
95% of researchers rate our articles as excellent or good
Learn more about the work of our research integrity team to safeguard the quality of each article we publish.
Find out more
ORIGINAL RESEARCH article
Front. Vet. Sci. , 02 May 2024
Sec. Livestock Genomics
Volume 11 - 2024 | https://doi.org/10.3389/fvets.2024.1382897
This article is part of the Research Topic Genomic Insights into Sheep and Goat Breeding Efficiency View all 12 articles
 Zhichen Liu1
 Qing Qin1
 Chongyan Zhang1
 Xiaolong Xu1Dongliang Dai1Mingxi Lan1Yichuan Wang1Jingwen Zhang1Dan Zhao1Deqing Kong1Tian Qin1Danni Wu1Xuedan Gong1Xingyu Zhou1Alatan Suhe2
 Zhixin Wang1,3,4,5
 Zhihong Liu1,3,4,5*
Sheep body size can directly reflect the growth rates and fattening rates of sheep and is also an important index for measuring the growth performance of meat sheep. In this study, high-resolution resequencing data from four sheep breeds (Dorper sheep, Suffolk sheep, Ouessant sheep, and Shetland sheep) were analyzed. The nonsynonymous single nucleotide polymorphisms of three candidate genes (KIAA1217, SNTA1, and LTBP1) were also genotyped in 642 healthy Ujumqin sheep using MALDI-TOFMS and the genotyping results were associated with growth traits. The results showed that different genotypes of the KIAA1217 g.24429511T>C locus had significant effects on the chest circumferences of Ujumqin sheep. The SNTA1 g.62222626C>A locus had different effects on the chest depths, shoulder widths and rump widths of Ujumqin sheep. This study showed that these two sites can be used for marker-assisted selection, which will be beneficial for future precision molecular breeding.
Sheep (Ovis aries) are economically one of the most important animals in the world (1), providing humans with a stable and high-quality source of animal protein and animal products such as skin, hair, and milk. Since sheep were domesticated (2), they have inhabited all parts of the world following the migration of humans. In this process, both the natural environment and artificial selection have had a profound impact on the domestication of sheep, resulting in large differences in the appearances, phenotypes, and morphological structures of sheep in different regions. For example, Dorper sheep native to South Africa and Suffolk sheep (3, 4) from the United Kingdom are famous for their fast growth rates and high meat production. The average adult sheep weight range can reach 85–120 kg. In sharp contrast, small sheep, such as Ouessant sheep and Shetland sheep (5, 6), have average adult body weights ranging from 45 to 75 kg. The growth traits of sheep (such as weight, height and length) can directly reflect the growth rates and fat growth rates of sheep and are also an important indicator of the growth performance of sheep. Therefore, understanding sheep growth traits is highly important for livestock production. At present, the common sheep varieties in China include Ujumqin sheep, Hu sheep, Xiaowei Han sheep, Tibetan sheep and others (7–10). As an excellent local variety differentiated from Mongolian sheep, Ujumqin sheep gradually developed after long-term selection and breeding and are well known for their fast growth rate and delicious meat.
In recent years, following the rapid development of biotechnology and genomics, molecular marker technology has improved. Single-nucleotide polymorphisms (SNPs) are third-generation molecular markers after restricted fragment length polymorphisms (RFLPs) and microsatellite polymorphisms (MPPs) (11). SNPs refer to DNA sequence polymorphisms caused by single nucleotide variations in the genome, including single base insertions, deletions, transitions, and transversions (12). SNPs can be classified into nonsynonymous single nucleotide polymorphisms (nsSNPs) and synonymous single nucleotide polymorphisms (sSNPs) according to their effects on gene transcription and protein translation. Nonsynonymous single nucleotide polymorphisms represent common genetic variants that alter the translated amino acid sequence, and this may affect the structure or function of the expressed protein (13). This genetic variation may lead to alterations in individual traits, such as body length and height growth traits. In this context, the results of an increasing number of studies have shown that nsSNPs have important effects on the growth traits of sheep (14, 15). By continuously mining and verifying major gene loci related to sheep economic traits, including the MSTN gene affecting sheep muscle growth and development, the TBXT gene affecting sheep tail type, and the FGF5 candidate gene related to wool length, researchers have applied these polymorphisms of major genes in production practice through gene editing and other technologies. This approach can greatly increase the economic value of sheep; for example, biallelic knockout of MSTN expression in sheep was successfully achieved using CRISPR/Cas9 gene editing. Compared with wild-type (WT) sheep, MSTN knockout sheep have greater muscle mass and muscle fiber diameters, but their meat quality and taste are not affected (16). CRISPR/Cas9-mediated deletion of the FGF5 gene not only results in the loss of its activity but also promotes the growth of sheep wool and cashmere, thereby increasing length and yield (17). These achievements have brought new optimism and opportunities for the development of animal husbandry. Nevertheless, the major gene loci involved in sheep growth traits still require research, especially with the deepening of our understanding of the sheep genome driven by biotechnology. There are still some potentially important gene loci that have not been revealed. Therefore, it is of great theoretical and practical significance to identify and verify the relevant sheep growth trait sites; it is expected that this investigation will provide a breakthrough for improving sheep production performance and economic benefits. It is important to identify potential genetic markers that affect the growth traits or reproductive characteristics of sheep and to accelerate the sheep breeding process.
In this study, resequencing data from four sheep breeds were divided into high-yield and low-yield groups according to body size, and population differentiation index (FST) analysis was used to identify genes and mutation sites related to the body size of the sheep. Based on the FST results, we performed GO and KEGG enrichment analyses for the top 5% of the candidate genes. Twenty-four nsSNPs across three candidate genes, KIAA1217, STNA1 and LTBP1, were identified. However, whether these nsSNPs have an effect in Ujumqin sheep is unclear. Therefore, we collected blood from 642 Ujumqin sheep for genotyping of the above sites, matched the genotyping results with body size data, and verified the molecular markers of the main effect growth trait sites in the genomes of Ujumqin sheep.
The experimental animals used in this study were bred in their country of origin and were not crossed with other sheep breeds. A total of 642 Ujumqin sheep (260 males +382 females) were obtained from the East Ujumqin Banner breeding farm in Xilin Gol League, Inner Mongolia. All healthy animals were fed freely under the same natural conditions. Venous blood collection was performed on sheep using a vacuum blood collection vessel, and the sample storage conditions were −20°C. The body size data of the sheep were measured manually. For detailed measurement methods, see a previously published article (18).
The raw data for this study were downloaded from the BioProject database of NCBI (PRJNA624020). The dataset contained resequencing data for four breeds of sheep (Dorper sheep, Suffolk sheep, Ouessant sheep and Shetland sheep), for a total of 37 samples.
Approximately 82.86 Gb of the original sequence was obtained from each sample, with an average depth of 27.4× covering the clean reads (Supplementary Datas 1, 2). Using default parameters, the 150 bp counterpart reads were mapped to the sheep reference genome Oar v.4.0 using the Burrows–Wheeler Aligner (19). The mapping results were then converted to BAM format and sorted using SAMtools (20). After mapping, we made SNP calls to all individuals using the Bayesian method implemented in SAMtools and the Genome Analysis Toolkit (GATK) (21). Then, SnpEff software (22) was used to annotate the structures of the mutation sites.
The four breeds of sheep were divided into two groups according to their body sizes (high-yield group: Dorper sheep, Suffolk sheep; low-yield group: Ouessant sheep, Shetland sheep). The FST value was estimated using a 100 kb sliding window on each chromosome with a window step size of 10 kb. The average FST values are the values for the entire genomes of different populations. When the FST value of the sliding window was greater than 95% of the FST value of the genome range, it was selected as a significant window. The overlapping significant windows were then merged into segments that were considered highly differentiated regions between populations. Genes within these regions of differentiation are considered candidates for selective elimination. We used the VCFtools 0.1.16 software package (23) for data collection for the FST calculation method: (1) Calculation of in-population genetic variation: For each genetic marker, the allele frequency of each population was calculated. The degree of heterozygosity (Ho) or allelic diversity within each population was calculated. (2) Calculation of interpopulation genetic variation: The average allele frequency of all populations was calculated. These mean frequencies were used to calculate the expected heterozygosity (Ht) of the population. (3) Calculation of FST:
Here, Ht is the overall expected heterozygosity between populations, and Hs is the weighted average expected heterozygosity within populations.
Gene Ontology (GO) and Kyoto Encyclopedia of Genes and Genomes (KEGG) enrichment analyses were performed for the top 5% of the FST genes. GO enrichment analysis was performed using the online tool g: Profiler (24), and GO classifications included biological processes (BP), cellular components (CC), and molecular functions (MF). The significantly enriched GO items were selected according to p < 0.05. KOBAS 3.0 (25) was used for KEGG pathway enrichment analysis, and p < 0.05 was considered the screening criterion for significant enrichment.
Based on the FST analysis results of this study and referring to previous results (26), primer design was performed using the upstream and downstream 200 bp sequence information of nsSNPs of common genes significantly selected by XP-CLR in the top 5% of FSTs. The primers were designed using the Agena online software Design Suite 2.0.1 The designed primer sequence was derived and then synthesized by Invitrogen. The mutation sites were identified by stroma-assisted laser desorption ionization time-of-flight mass spectrometry (MALDI-TOF-MS). The genotyping system used was the MassARRAY® MALDI-TOF system developed by Agena.
The phenotypic data of Ujumqin sheep were statistically analyzed using Excel 2021 software. SPSS 22.0 software (27) was used to analyze the correlation between genotypes and phenotypic traits. P < 0.05 indicated significant differences, and p < 0.01 indicated extremely significant differences. The following general linear model (GLM) was used for analysis: Y = μ + G + m + e.
Y, trait measurement value; μ, population mean; G, genotype effect; m, sex effect; e, random residual.
TBtools (28) was used to extract CDS information before and after mutation based on reference genome information. RNAfold2 online software was used to predict the secondary structure of mutated mRNAs. SOPMA (29) was used to predict protein secondary structure. After the amino acid sequence using CDS sequence can be converted to SWISS-MODEL3 online software to forecast the mutant protein tertiary structure before and after.
To identify candidate genes that affect sheep body size, we conducted FST selection signal analysis on the high-yield and low-yield groups of sheep (Figure 1), and a total of 1747 significant genes were selected as the top 5% of the FST. Analysis of these 1747 genes revealed that three genes (KIAA1217, SNTA1 and LTBP1) were significantly selected by the XP-CLR method used in previous studies. Therefore, we selected nsSNPs of the above three genes for further study (Table 1).
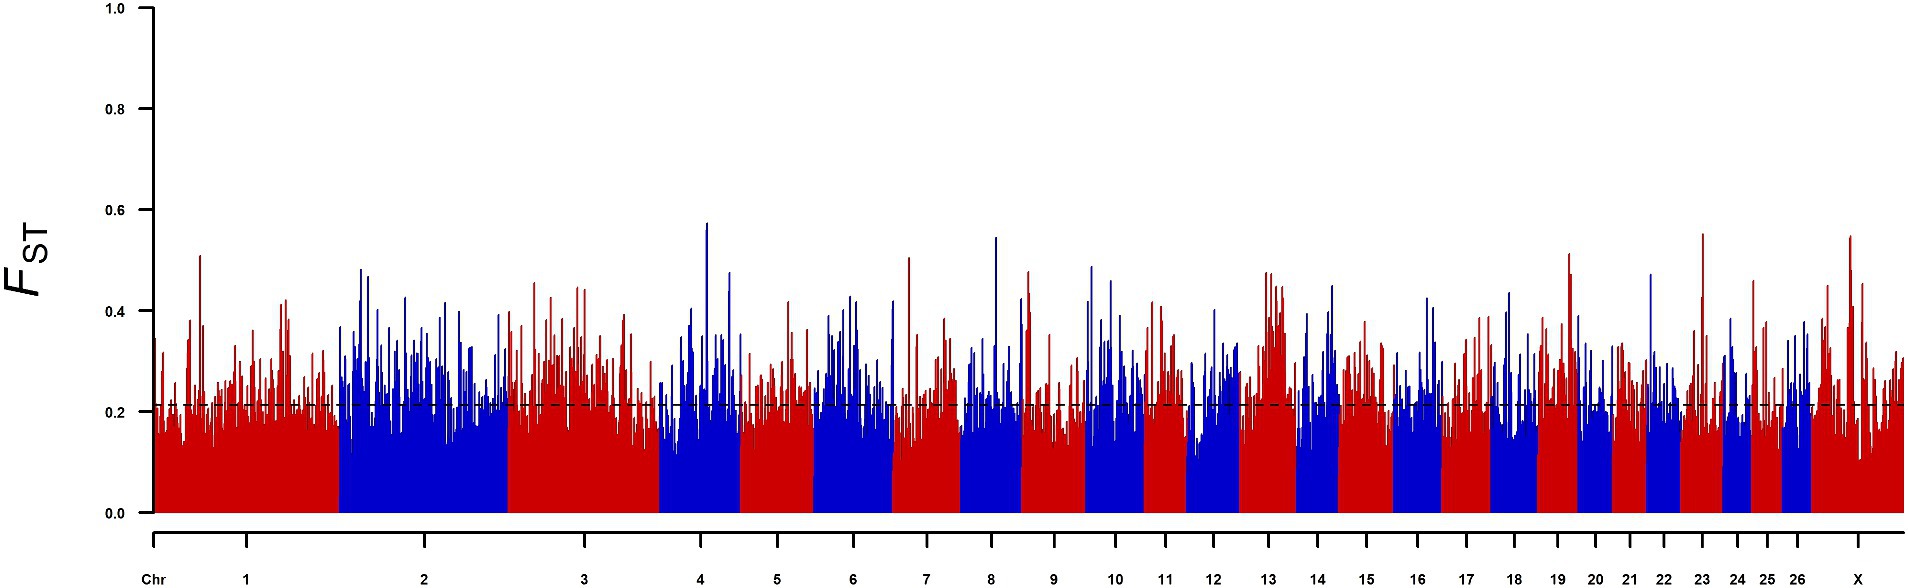
Figure 1. Genome-wide distribution of FST in the high-yield and low-yield groups; the X-axis represents chromosomes, the Y-axis represents FST values, and the black dashed line represents the significance threshold.
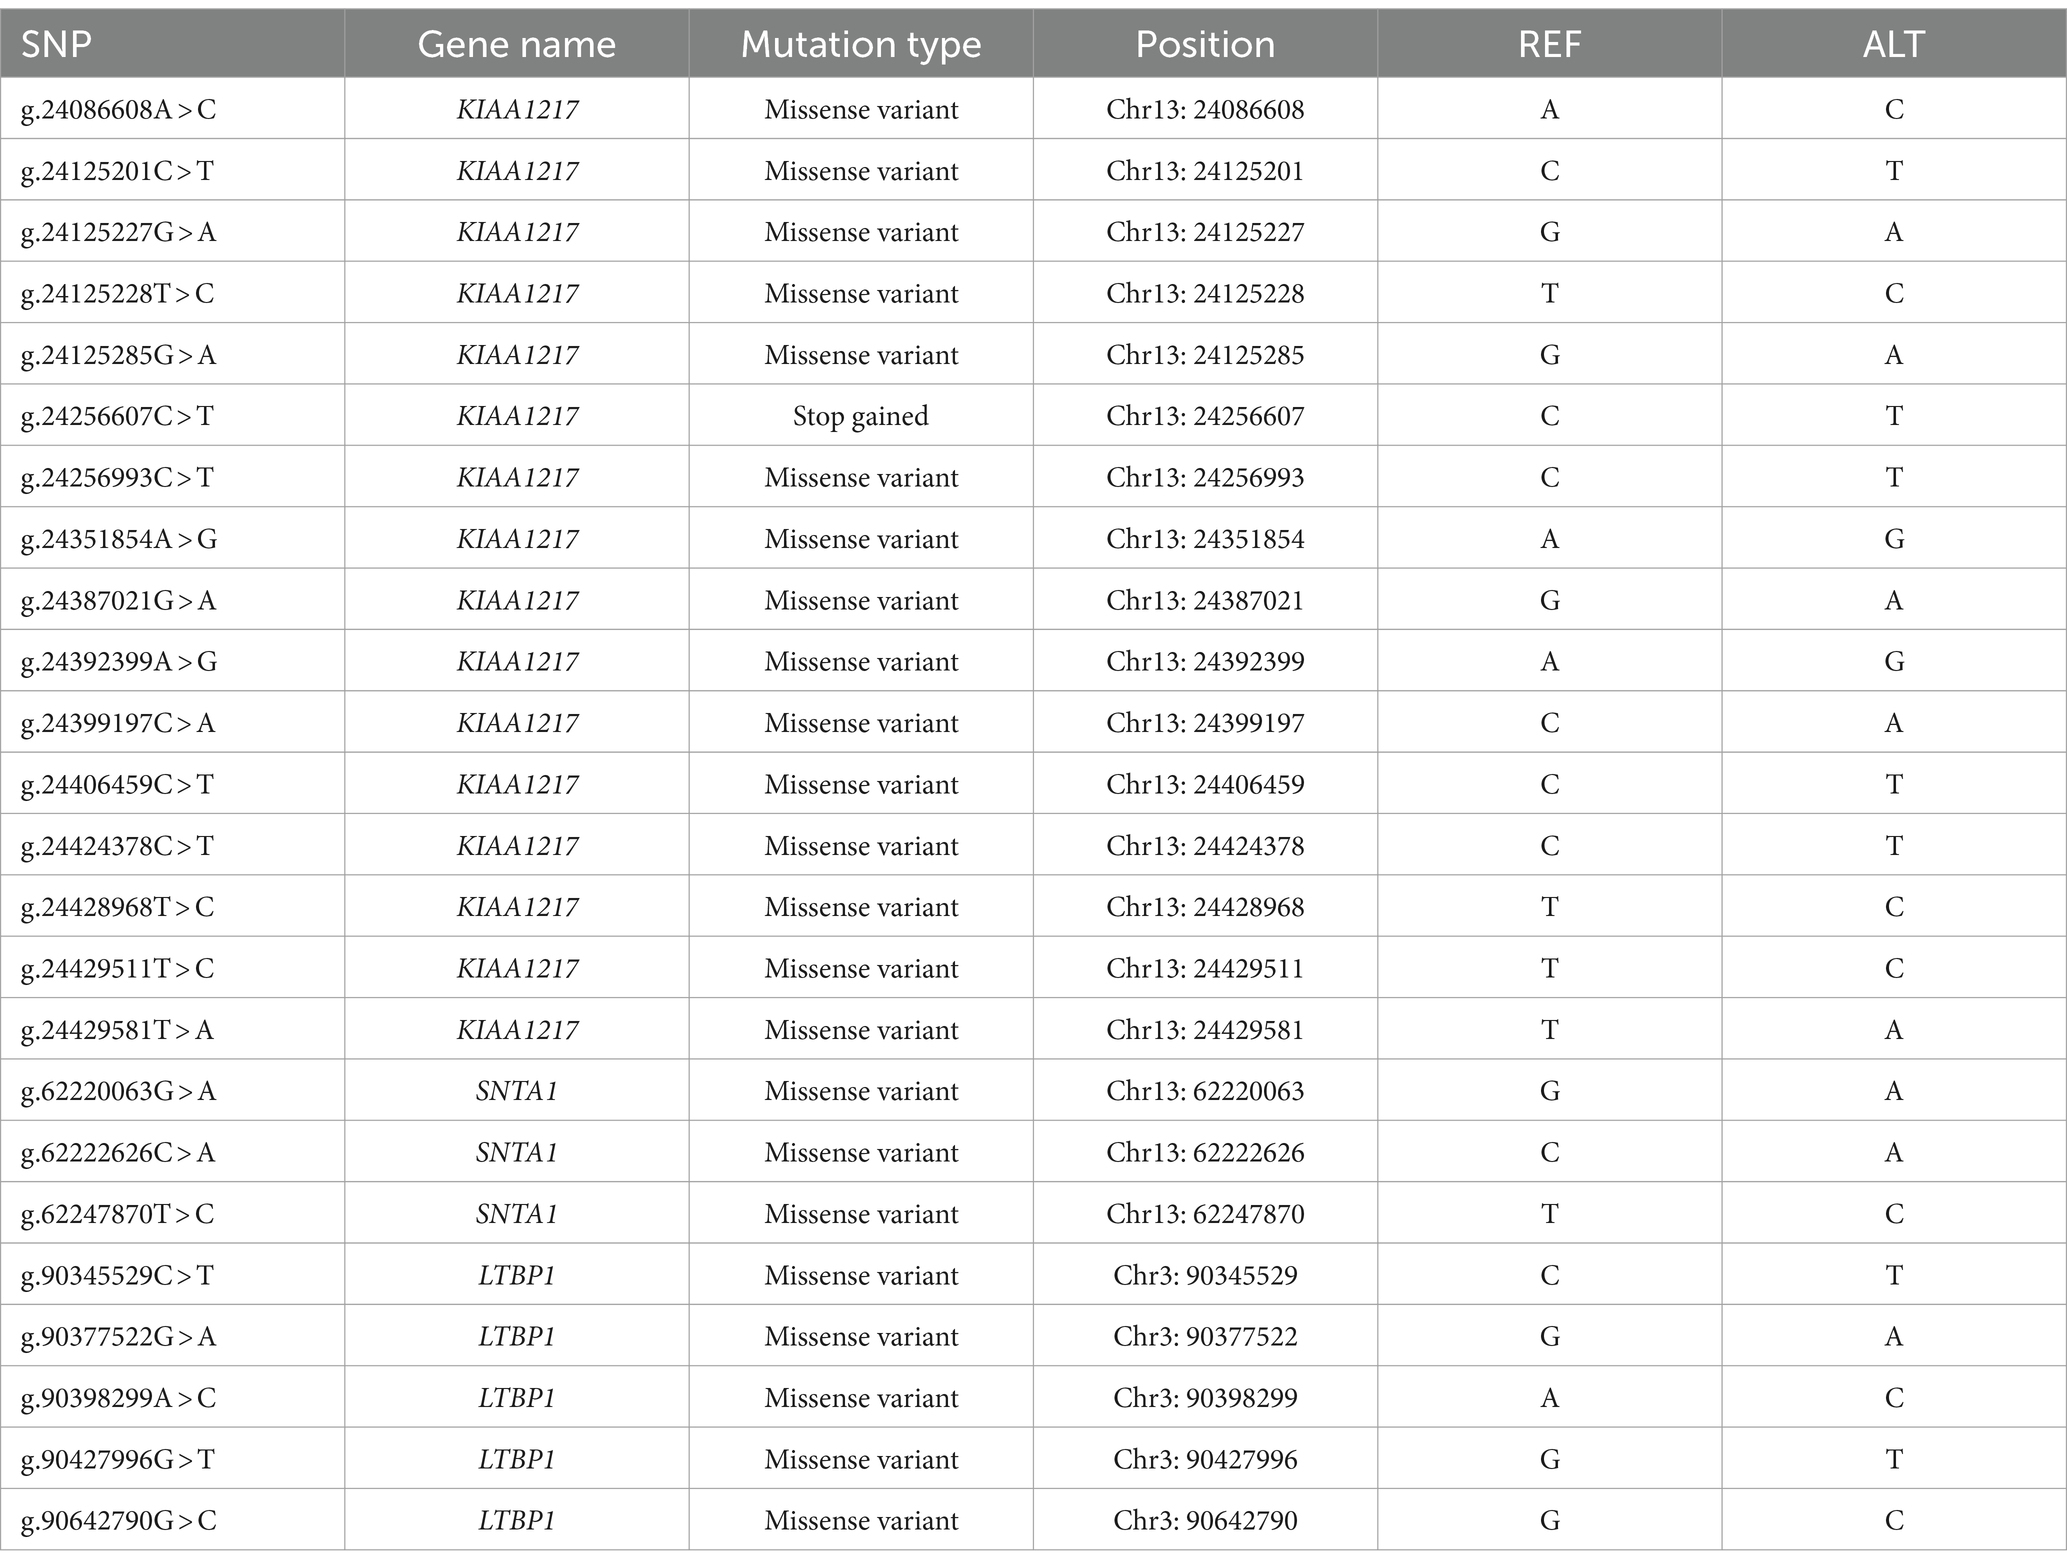
Table 1. The nonsynonymous single nucleotide polymorphism sites in the KIAA1217, SNTA1, and LTBP1 genes.
To investigate which GO enrichment terms and signaling pathways were associated with the top 5% of genes significantly enriched in the FST, we conducted GO and KEGG enrichment analyses of these 1747 genes (Figure 2). According to the GO classification statistics, 214 terms were grouped into three GO categories: cellular components, molecular functions, and biological processes. Among the three GO categories, the most significantly enriched were cytoplasm, protein binding and developmental process. GO enrichment analysis revealed that most of these genes were involved to varying degrees in the development of organisms (Figure 2A).
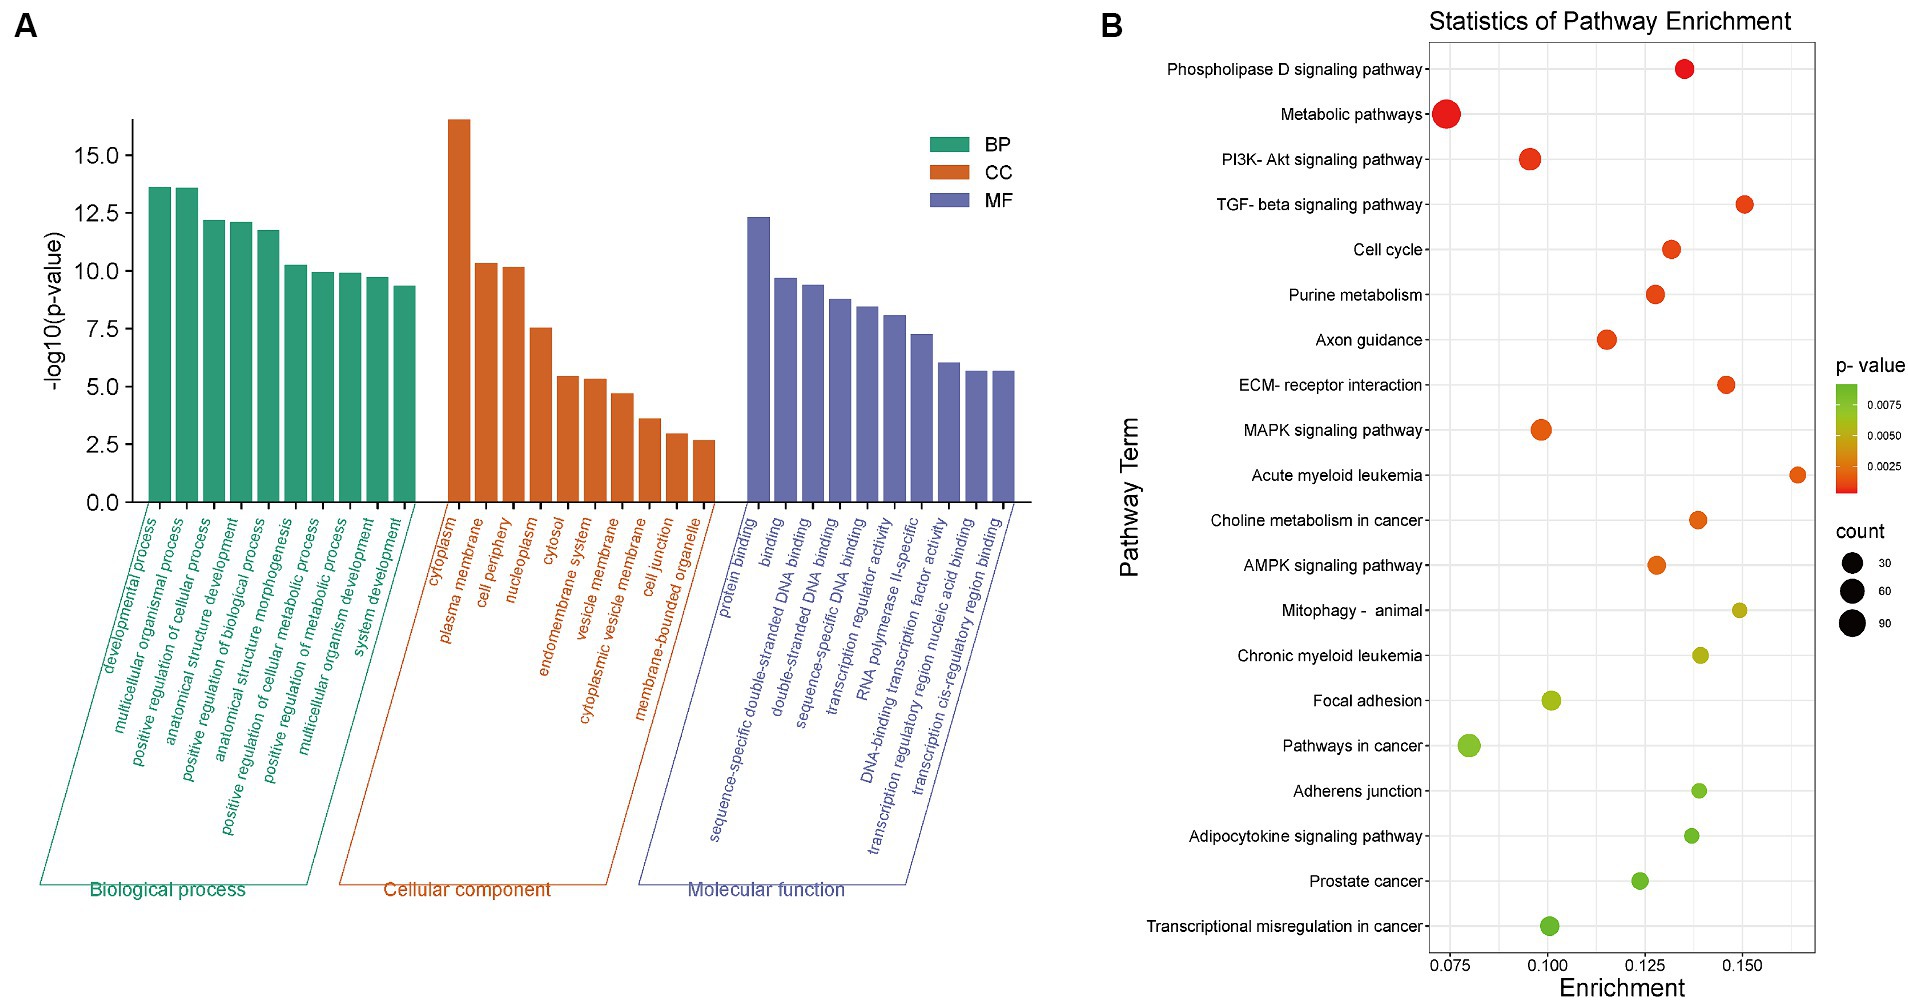
Figure 2. The results of GO/KEGG enrichment analysis of the top 5% of genes in the FST selection signal. (A) The results of GO enrichment analysis. Green, orange and blue represent biological processes, cell components and molecular functions in GO enrichment terms, respectively. (B) The results of KEGG enrichment analysis. The X-axis represents the ratio of differentially enriched genes to the total gene number of this term, and the Y-axis represents the enriched function/pathway. The color represents the degree of enrichment significance, and the closer to red the color is, the more significant the enrichment is. The size of the circle represents the number of genes enriched.
In addition, we performed KEGG pathway enrichment analysis to explore the most active pathways related to these genes. The results showed that most of the enriched pathways were related to biological development, such as the phospholipase D signaling pathway, the PI3K/Akt signaling pathway, the TGF-β signaling pathway, and cell cycle (Figure 2B).
The DNA of 642 Ujumqin sheep was genotyped and the next step was to analyze the loci with more than 95% detection rate. Among the 24 nsSNPs, only 2 met the above conditions, namely, KIAA1217 g.24429511T > C and SNTA1 g.62222626C > A (Figures 3A,B). Analysis of the genotype frequencies and allele frequencies of these two loci revealed 3 genotypes at each locus. The TC genotype in the KIAA1217 g.24429511T > C locus was the dominant genotype, and the genotype frequency was 0.48, indicating moderate polymorphism (0.25 < PIC<0.5). At the SNTA1 g.62222626C > A locus, the CC genotype was the dominant genotype, the genotype frequency was 0.84, and the polymorphism frequency was low (PIC<0.25). In addition, according to the χ2 test, both of the above two SNPs reached HWE (p > 0.05) (Table 2). The results of the association analysis between the typing results of the two loci and the 6-month-old body size data of Ujumqin sheep are shown in Table 3. The presence of different genotypes at the KIAA1217 g.24429511T > C locus had significant effects on the chest circumference of Ujumqin sheep (Figure 3C), and the chest circumference of individuals with the TC genotype was significantly greater than that of individuals with the TT genotype (p < 0.05). The chest depths of Ujumqin sheep with an AA genotype at the SNTA1 g.62222626C > A locus were greater than those of CC genotype and CA genotype sheep (Figure 3F), and the difference was significant (p < 0.05). The shoulder widths of CA genotype sheep were significantly greater than those of CC genotype sheep (Figure 3E) (p < 0.05), and the differences in rump width were highly significant (p < 0.01), as shown in Figure 3D.
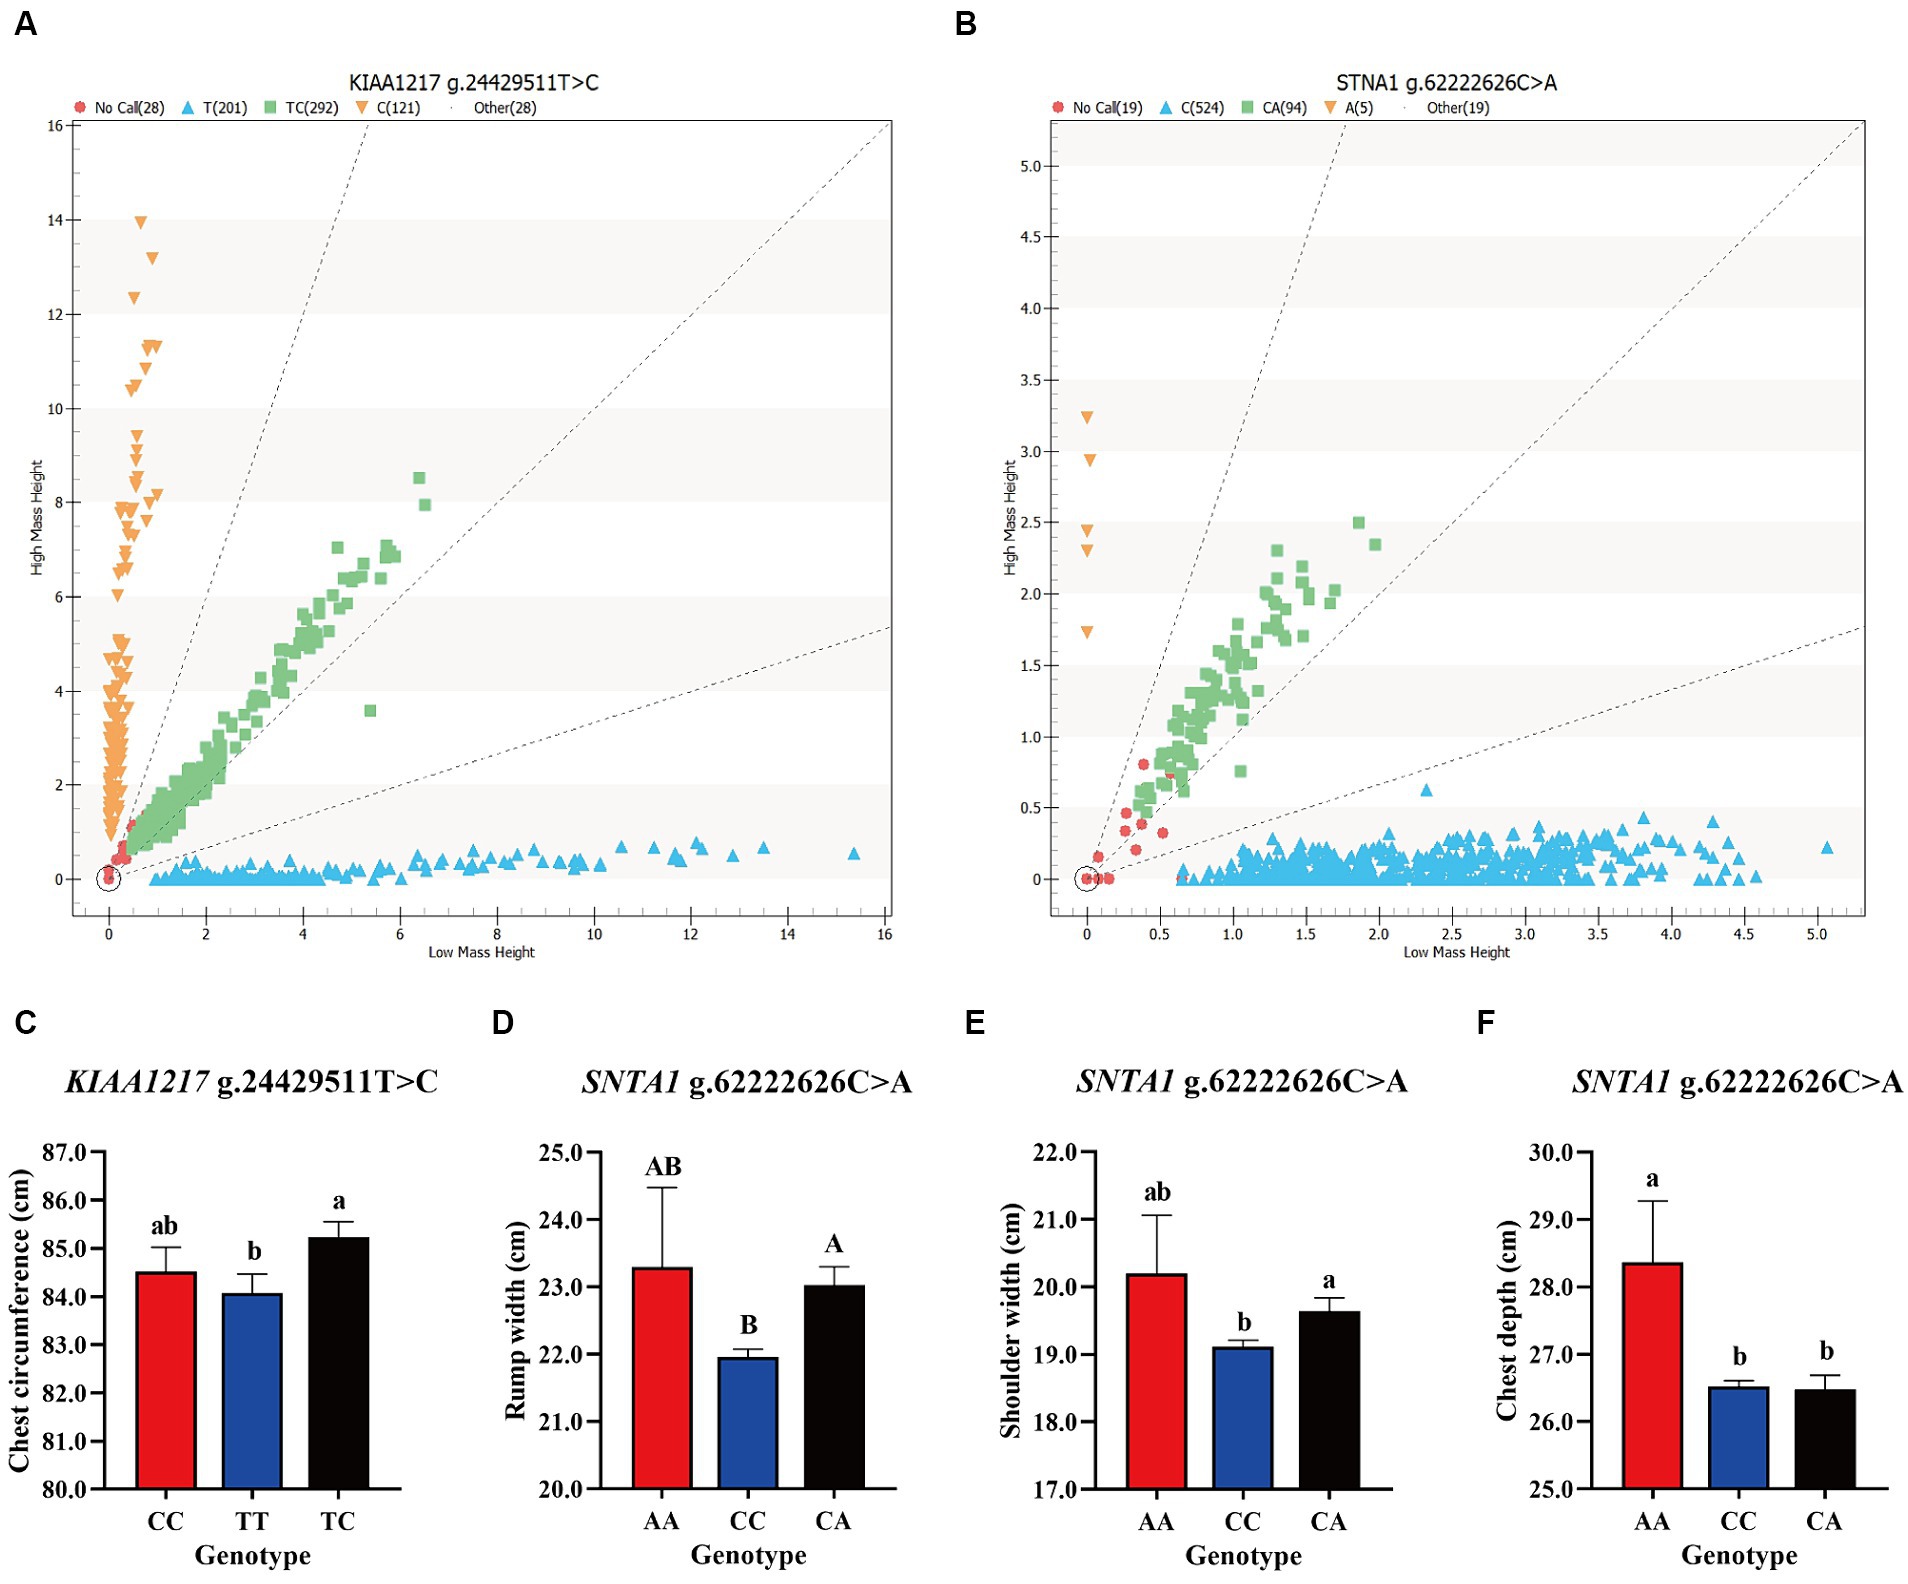
Figure 3. Results of site genotyping and association analysis; (A,B) show the genotyping results of KIAA1217 g.24429511T > C and SNTA1 g.62222626C > A in the Ujumqin sheep population, respectively. The genotypes near the X-axis were of low molecular weight, and those near the Y-axis were of high molecular weight. Blue and orange represent pure genotypes, green represents heterozygous genotypes, and red represents undetected samples. (C–F) Show the effects of different genotypes of two SNP loci on Ujumqin sheep production traits. (C) The chest sizes of sheep with the TC genotype at KIAA1217 g.24429511T > C were significantly greater than those of sheep with the TT genotype. At the SNTA1 g.62222626C > A locus, sheep with the (D) CA genotype were significantly wider than sheep with the CC genotype, (E) sheep with the CA genotype were significantly wider than those with the CC genotype, and (F) sheep with the AA genotype were significantly deeper than those with the CC and CA genotypes. Different letters on the shoulder of the same column of data indicate statistically significant differences, lowercase letters represent significant differences (p < 0.05), and uppercase letters represent extremely significant differences (p < 0.01).
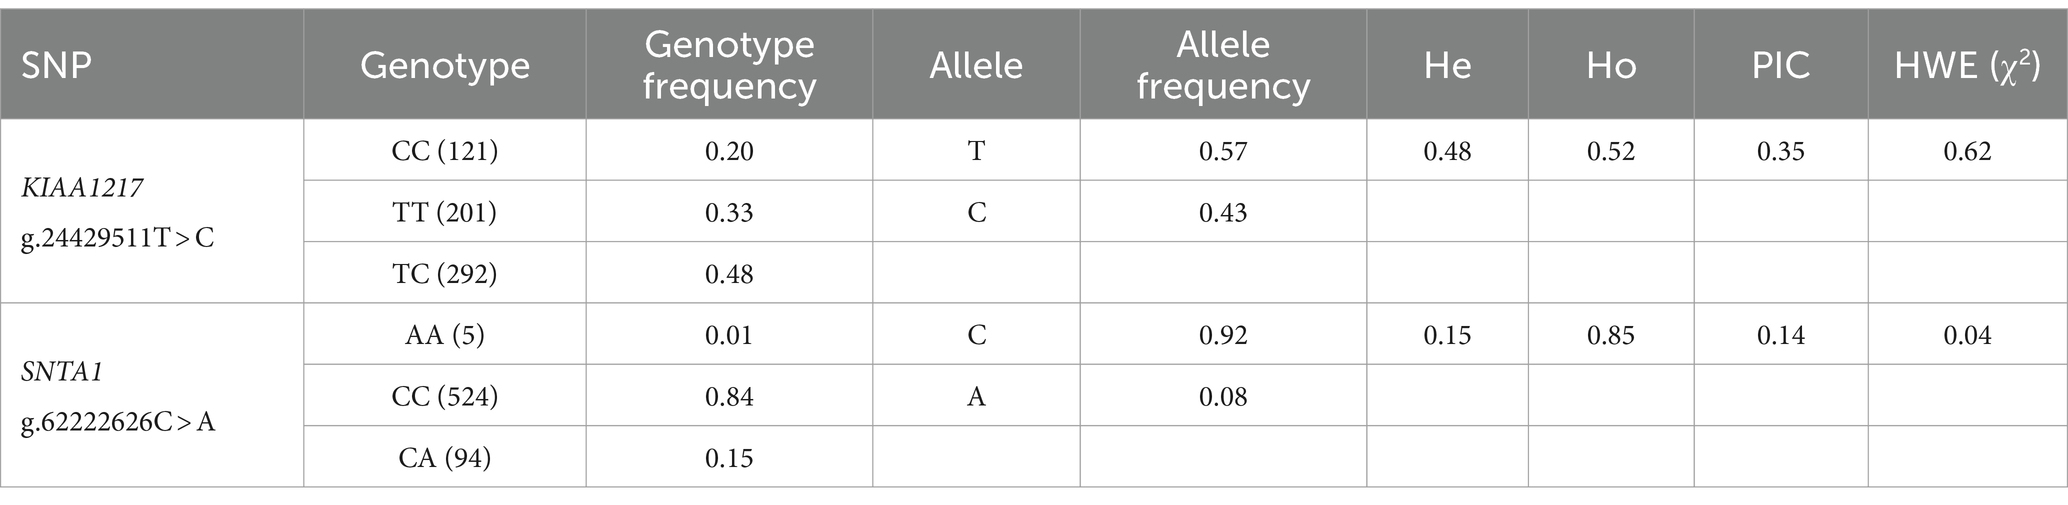
Table 2. Genetic parameters of nsSNPs in the experimental population of Ujumqin sheep.
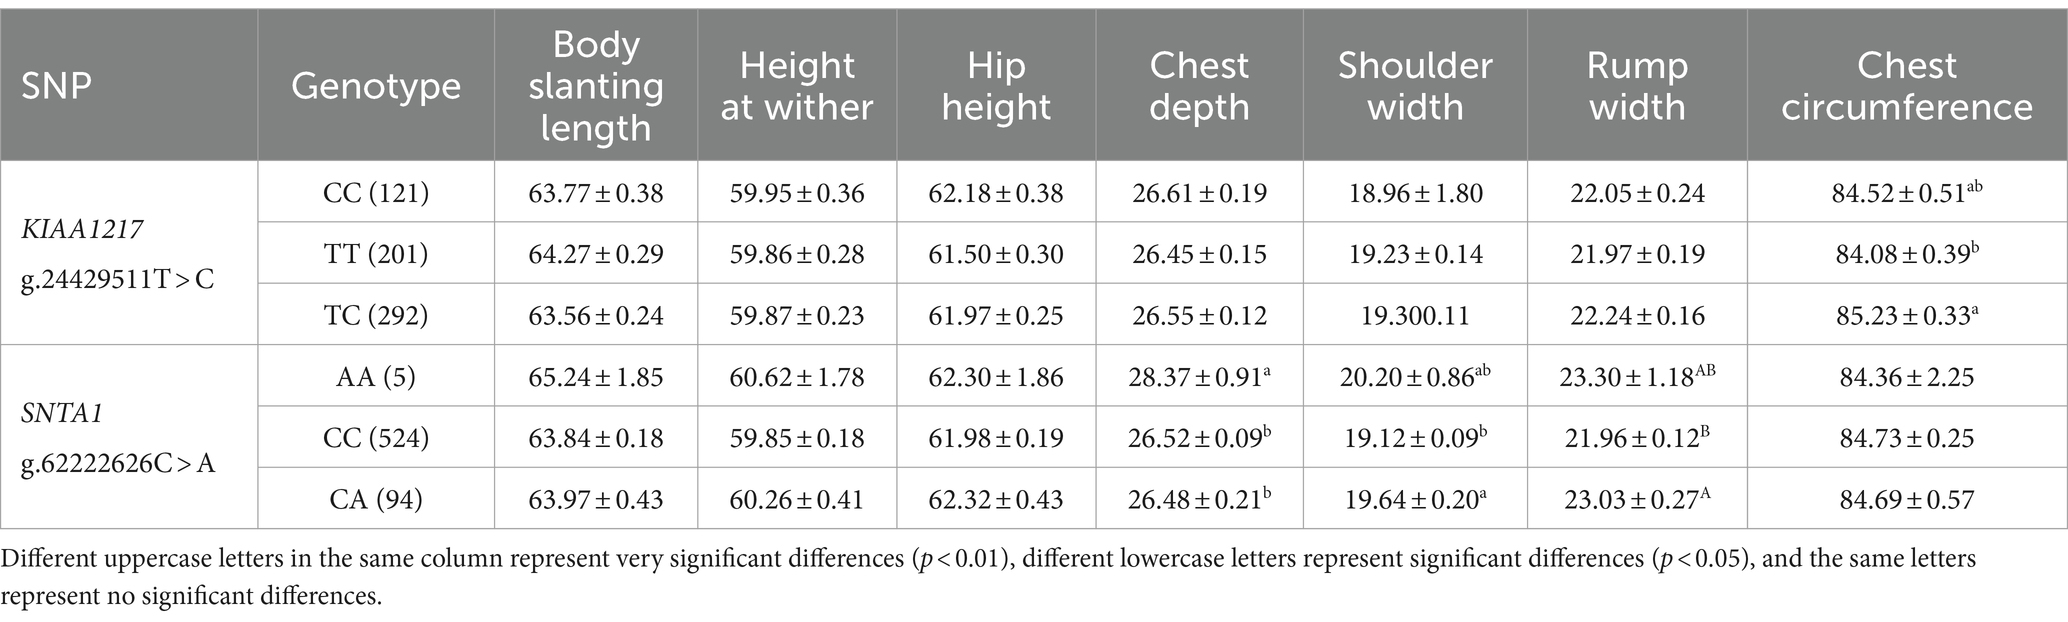
Table 3. Genetic parameters of nsSNPs in the experimental population of Ujumqin sheep.
To better understand how the above two mutation sites affect the expression of genes involved in the growth trait changes of Ujumqin sheep, we used TBtools to extract the CDSs of genes before and after the mutation and used online software to predict the secondary structures of mRNA and the secondary structures and tertiary structures of encoded proteins. The results showed that mutations at both sites resulted in changes in the original amino acid sequence, and mutations at KIAA1217 g.24429511T > C resulted in a change in amino acid 1,493 from the original phenylalanine to leucine (Figures 4A,B). Amino acid 260 at SNTA1 g.62222626C > A changed from tryptophan to leucine (Figures 4C,D). Secondary structure analysis of mRNA before and after mutation revealed that the minimum structural free energy of mRNA before and after the KIAA1217 g.24429511T > C mutation changed from −1983.90 kcal/mol to −1984.40 kcal/mol. The minimum structural free energy of the mRNA before and after the SNTA1 g.62222626C > A site changed from −692.50 kcal/mol to −695.50 kcal/mol, and the stability increased (Supplementary Figure 1). By analyzing the changes in amino acids at the mutation sites and their effects on protein secondary structures, it was found that the proportion of α-helix and random coils increased after mutation at KIAA1217 g.24429511T > C, and the proportion of β-turn and extended strands decreased. There was no change in the proportion of secondary structures after the SNTA1 g.62222626C > A mutation (Table 4).
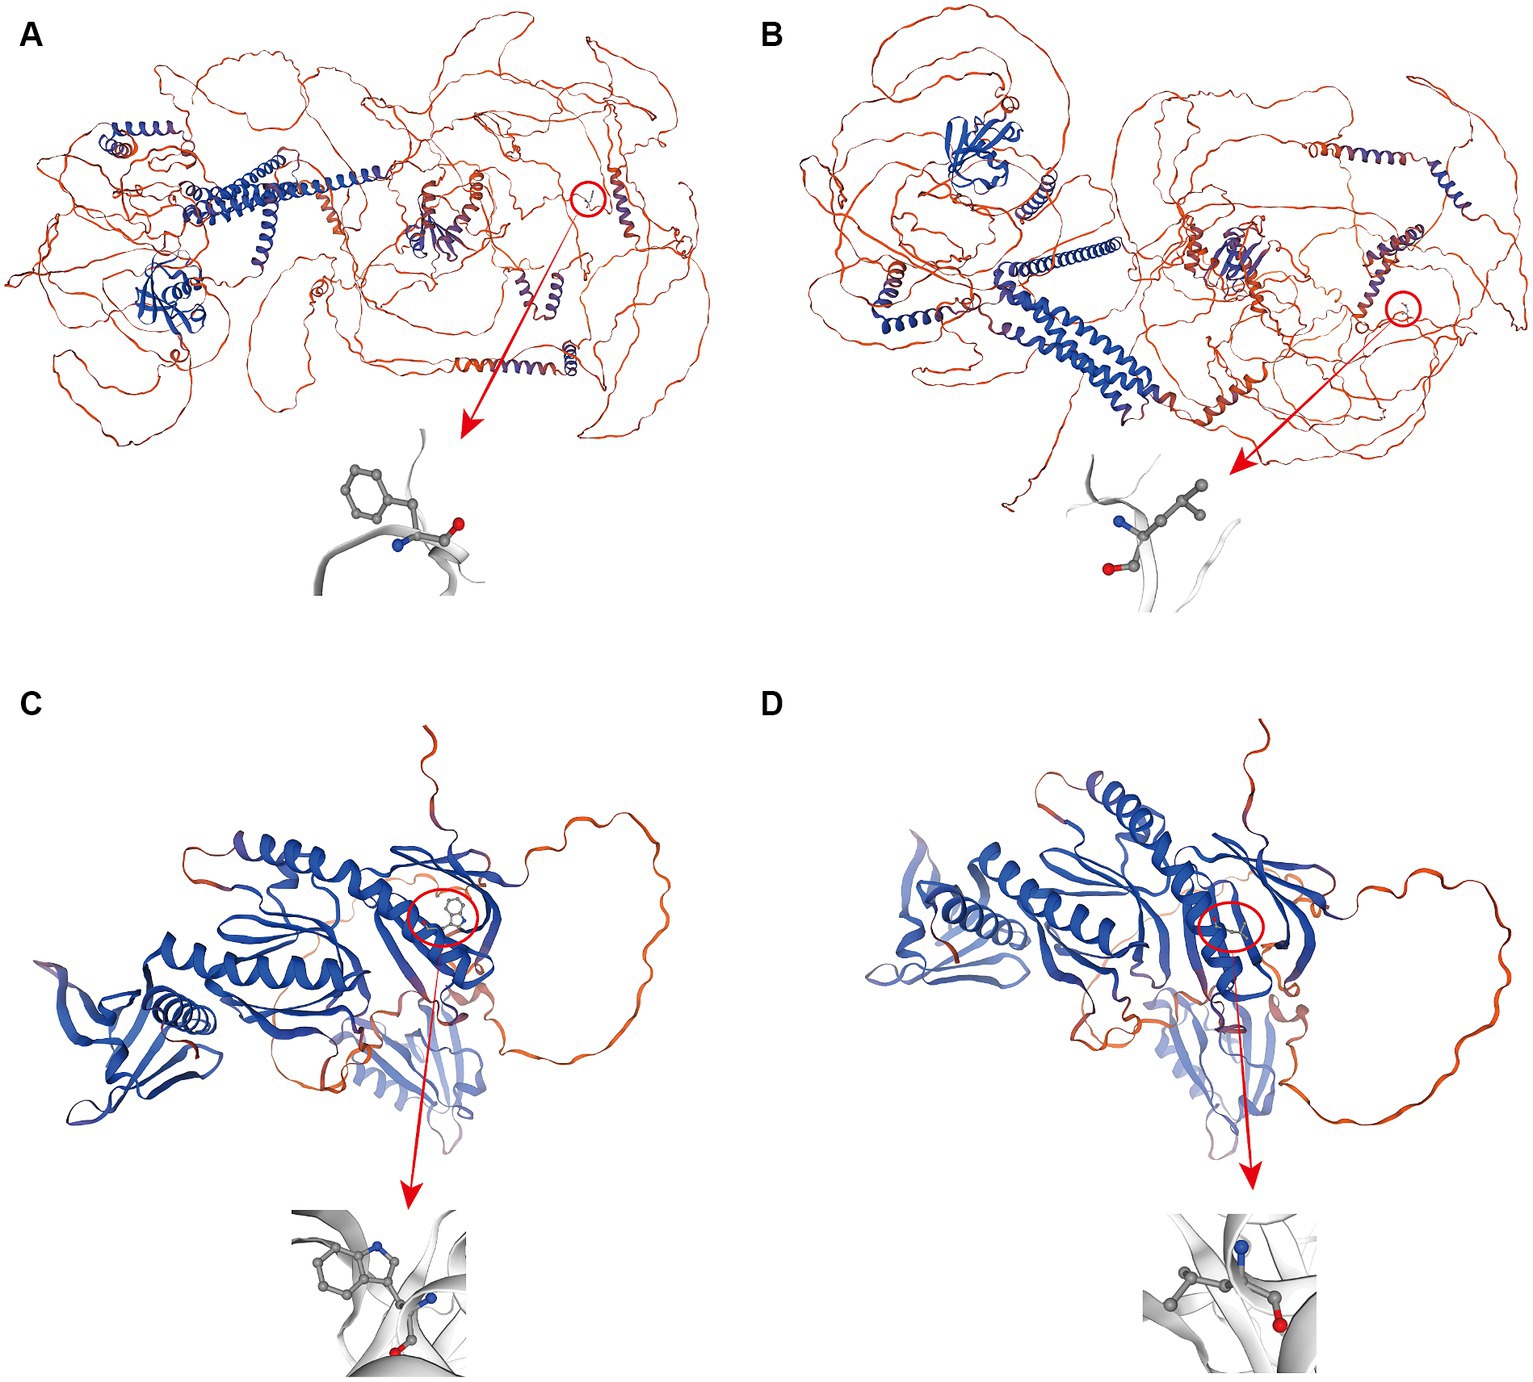
Figure 4. Protein tertiary structure prediction map before and after mutation at 2 mutation sites; (A–D) represent the wildtype and mutant proteins encoded by KIAA1217 and the wildtype and mutant proteins encoded by SNTA1, respectively.
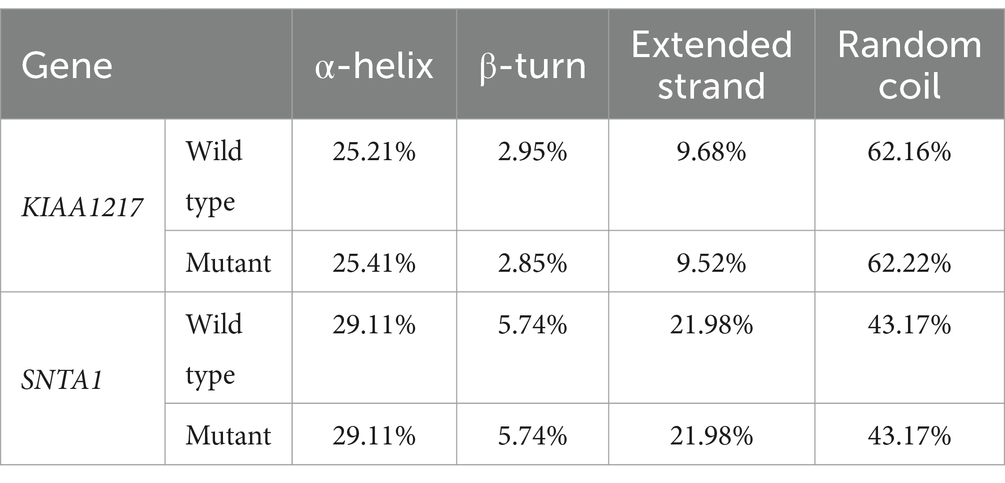
Table 4. Results of protein secondary structure prediction.
Against the background of natural selection, some selective intervention behaviors of humans may cause mutations in some sites of the animal body so that the genetic traits of the organism are diverse. Phenotypic alterations are often caused by functional mutations in genes that control the trait, so such mutations can serve as valid molecular markers for marker-assisted breeding (30). Among these mutations, missense mutations are considered to affect the body phenotype by affecting the mRNA expression of the related genes and the structures of the proteins. In this study, the g.24429511T > C and g.62222626C > A mutations, which are missense mutations that cause differences in growth traits, were located in exon 19 and exon 4 of the gene, respectively. Although both sites lead to changes in amino acids encoded, there are some differences between the two mutations. The g.24429511T > C missense mutation caused the encoded amino acid to change from phenylalanine to leucine, and the amino acid properties changed from polar to nonpolar after the mutation, which may have led to changes in protein properties. Further analysis revealed that mutation of this site resulted in a decrease in the minimum structural free energy of the mRNA secondary structure, an increase in stability, an increase in the proportion of α-helix and random coils, and a decrease in the proportion of β-turn and extended strands. After the missense mutation at g.62222626C > A, the encoded amino acid changed from tryptophan to leucine and from a polar amino acid to a nonpolar amino acid. However, from the perspective of protein secondary structure, the mutation at this site did not cause changes in the proportions of α-helix, extended strands, β-turn or random coils. The main reason may be that amino acids form extended strands in the secondary structure before and after mutation. The SNTA1 gene encodes a cytoplasmic peripheral membrane scaffold protein. In terms of tertiary structure, changes in the amino acids of the protein may affect the structure of the protein, thus affecting the binding of related proteins and leading to the emergence of different phenotypes.
KIAA1217 (a sickle tail protein homolog) has a curly helix region and an actin interaction domain. The proteins it encodes are necessary for normal disc development, dendritic spine morphogenetic regulation, embryonic skeletal system development by regulating cell migration, multicellular biological development, and substrate adhesion-dependent cell proliferation. Mutations in KIAA1217 are associated with malformations in the human backbone and tail vertebrae, and in mice, they affect the development of the spine, resulting in a reduced number of tail vertebrae and a characteristic short tail (31). Recently, researchers have shown that rapid evolution of the regulatory region of this gene in apes may lead to tail loss, which may be related to mutations in specific gene regulatory sequences (32). It has been confirmed that the vertebrae of sheep and humans are most similar in the thoracic and lumbar regions, although they show substantial differences in some dimensions (33). SNTA1 encodes the α1-synthetic protein, a scaffold protein that is a component of the anti-muscular dystrophin-associated protein complex (34). SNTA1 is the link between the extracellular matrix, the intracellular signaling apparatus, and the actin cytoskeleton. SNTA1 is involved in the regulation of the actin cytoskeleton and actin recombination (35). The SNTA1 signaling axis plays an important role in cytoskeletal tissue (36), and researchers have found that the SNTA1 gene is associated with amino acid and ion channel binding in different parts of bovine muscle (37). The sheep LTBP1 gene, located on chromosome 3, encodes TGF-β-binding protein 1 and is a member of the potential TGF-β-binding protein family. One indel of the LTBP1 gene was detected in four sheep breeds, and the effect of the LTBP1 gene on the growth traits of small-tailed cold sheep may be related to sex (38). Cao et al. conducted genome-wide DNA methylation sequencing in a subpopulation of Chinese Mongolian sheep and found that DNA methylation in three regions and two CpG sites in LTBP1 was significantly correlated with its RNA expression, and this gene was also identified as a potential candidate gene associated with weight variation (39). Unfortunately, 5 nsSNPSs of the LTBP1 gene were not detected in the population genotyping results of Ujumqin sheep in this study. Moreover, exploring the influence of the LTBP1 gene on the growth traits of Ujumqin sheep will also constitute a direction of follow-up research.
In recent years, following the development of biotechnology and genome research, an increasing number of SNPs related to the growth traits of livestock and poultry have been discovered. Studies have shown that the g.3148C > T polymorphism of the SIRT1 gene affects the heart circumference of Tibetan sheep, and the g.8074 T > A polymorphism of the SIRT2 gene is significantly correlated with body weight and body length (40). Cao et al. discovered OARX_76354330.1 and s64890.1 to be functional SNPs for growth traits of Hu sheep through genome-wide association analysis of body weight and identified three candidate genes related to body weight in Hu sheep (41): CAPN6, ITGA11 and SCMH1. By using genome-wide high-density SNP data (600 K) for selective scanning tests for important phenotypic traits, researchers have identified genes related to sheep body size, such as RMI1 and SCD5 (42). In the selection of sheep genotypes, it is necessary to comprehensively select SNP genotypes corresponding to the target traits; we therefore need to use different methods to identify additional SNP sites that affect sheep growth traits. Overall, this study used resequencing data from different sheep breeds to mine candidate genes and nsSNPs affecting sheep body size and verified their roles in Ujumqin sheep, thereby obtaining two molecular markers that could be applied in production practice. However, it is not yet clear whether these sites are equally useful in other sheep breeds, and this will be an important direction for our future research. Our results provide new insights into the mining of SNPs related to sheep growth and provide new genetic markers for the genetic improvement in Ujumqin sheep.
In this study, resequencing data from four sheep breeds were used to identify three genes related to the body size of sheep. Twenty-four nsSNPs across three genes were identified in Ujumqin sheep. Association analysis revealed that different genotypes of two SNP loci had differences in chest circumference, chest depth, body width and caudal breadth, and mRNA secondary structure stability was enhanced after mutation. These SNPs can be used as a molecular marker for Ujumqin sheep breeding and lay a foundation for future precise molecular breeding.
The data used in this study is sourced from the BioProject database of NCBI, numbered PRJNA624020.
The animal study was approved by in this study, blood was collected in accordance with the International Guiding Principles for Biomedical Research involving animals and approved by the Special Committee on Scientific Research and Academic Ethics of Inner Mongolia Agricultural University, responsible for the approval of Biomedical Research Ethics of Inner Mongolia Agricultural University [Approval No. (2020) 056]. No specific permissions were required for these activities, and no endangered or protected species were involved. The study was conducted in accordance with the local legislation and institutional requirements.
ZCL: Writing – original draft, Writing – review & editing. QQ: Writing – original draft, Writing – review & editing. CZ: Writing – original draft, Writing – review & editing. XX: Writing – original draft, Writing – review & editing. DD: Writing – original draft, Writing – review & editing. ML: Writing – original draft, Writing – review & editing. YW: Writing – original draft, Writing – review & editing. JZ: Writing – original draft, Writing – review & editing. DZ: Writing – original draft, Writing – review & editing. DK: Writing – original draft, Writing – review & editing. TQ: Writing – original draft, Writing – review & editing. DW: Writing – original draft, Writing – review & editing. XG: Writing – original draft, Writing – review & editing. XZ: Writing – original draft, Writing – review & editing. AS: Writing – original draft, Writing – review & editing. ZW: Writing – original draft, Writing – review & editing. ZHL: Writing – original draft, Writing – review & editing.
The author(s) declare that financial support was received for the research, authorship, and/or publication of this article. This work was supported by the Project of Northern Agriculture and Livestock Husbandry Technical Innovation Center, Chinese Academy of Agricultural Sciences (BFGJ2022002); The National Key R&D Program of China (2021YFD1200901); National Natural Science Foundation of China (32060742); The Major Science and Technology Projects of Inner Mongolia Autonomous Region (2020ZD0004); The central government guides local science and technology development funds (2022ZY0185); Higher educational Basic scientific research business fee project of Inner Mongolia Autonomous Region (BR221005); and University Youth Science and Technology Talent Support Project of Inner Mongolia Autonomous Region (NJYT23012).
The author thanks the staff of Ujumqin sheep breeding farm in East Ujumqin Banner, Xilin Gol League, Inner Mongolia for their help.
AS was employed by East Ujumqin Banner Hersig animal husbandry development limited liability company.
The remaining authors declare that the research was conducted in the absence of any commercial or financial relationships that could be construed as a potential conflict of interest.
All claims expressed in this article are solely those of the authors and do not necessarily represent those of their affiliated organizations, or those of the publisher, the editors and the reviewers. Any product that may be evaluated in this article, or claim that may be made by its manufacturer, is not guaranteed or endorsed by the publisher.
The Supplementary material for this article can be found online at: https://www.frontiersin.org/articles/10.3389/fvets.2024.1382897/full#supplementary-material
1. Hiendleder, S, Kaupe, B, Wassmuth, R, and Janke, A. Molecular analysis of wild and domestic sheep questions current nomenclature and provides evidence for domestication from two different subspecies. Proc Biol Sci. (2002) 269:893–904. doi: 10.1098/rspb.2002.1975
2. Zeder, MA . Domestication and early agriculture in the Mediterranean Basin: origins, diffusion, and impact. Proc Natl Acad Sci USA. (2008) 105:11597–604. doi: 10.1073/pnas.0801317105
3. Qiao, G, Xu, P, Guo, T, Wu, Y, Lu, X, Zhang, Q, et al. Genetic basis of Dorper sheep (Ovis Aries) revealed by Long-read De novo genome assembly. Front Genet. (2022) 13:846449. doi: 10.3389/fgene.2022.846449
4. Fitzmaurice, S, Conington, J, Fetherstone, N, Pabiou, T, McDermott, K, Wall, E, et al. Genetic analyses of live weight and carcass composition traits in purebred Texel, Suffolk and Charollais lambs. Animal. (2020) 14:899–909. doi: 10.1017/S1751731119002908
5. Smit, JJ, Schonewille, JT, and Beynen, AC. Transient lowering of plasma vitamin B12 concentrations in Ouessant sheep fed on a potassium-rich ration. Int J Vitamin Nutr Res Int Zeitschrift fur Vitamin. (1999) 69:273–6. doi: 10.1024/0300-9831.69.4.273
6. Thomas, DL . Performance and utilization of northern European short-tailed breeds of sheep and their crosses in North America: a review. Animal. (2010) 4:1283–96. doi: 10.1017/S1751731110000856
7. Li, S, Luo, R, Lai, D, Ma, M, Hao, F, Qi, X, et al. Whole-genome resequencing of Ujumqin sheep to investigate the determinants of the multi-vertebral trait. Genome. (2018) 61:653–61. doi: 10.1139/gen-2017-0267
8. Li, Y, Chen, Z, Fang, Y, Cao, C, Zhang, Z, Pan, Y, et al. Runs of homozygosity revealed reproductive traits of Hu sheep. Genes. (2022) 13:1848. doi: 10.3390/genes13101848
9. Luo, M, Wang, L, Xiao, C, Zhou, M, Li, M, and Li, H. Mir136 regulates proliferation and differentiation of small tail Han sheep preadipocytes. Adipocytes. (2023) 12:2173966. doi: 10.1080/21623945.2023.2173966
10. Jing, X, Zhou, J, Degen, A, Wang, W, Guo, Y, Kang, J, et al. Comparison between Tibetan and small-tailed Han sheep in adipocyte phenotype, lipid metabolism and energy homoeostasis regulation of adipose tissues when consuming diets of different energy levels. Br J Nutr. (2020) 124:668–80. doi: 10.1017/S0007114520001701
11. Gao, L, Jia, J, and Kong, X. A Snp-based molecular barcode for characterization of common wheat. PLoS One. (2016) 11:e0150947. doi: 10.1371/journal.pone.0150947
12. Sun, Y, Lan, X, Lei, C, Zhang, C, and Chen, H. Haplotype combination of the bovine Cfl2 gene sequence variants and association with growth traits in Qinchuan cattle. Gene. (2015) 563:136–41. doi: 10.1016/j.gene.2015.03.016
13. Nakken, S, Alseth, I, and Rognes, T. Computational prediction of the effects of non-synonymous single nucleotide polymorphisms in human DNA repair genes. Neuroscience. (2007) 145:1273–9. doi: 10.1016/j.neuroscience.2006.09.004
14. Zhang, L, Ma, X, Xuan, J, Wang, H, Yuan, Z, Wu, M, et al. Identification of Mef2b and Trhde gene polymorphisms related to growth traits in a new Ujumqin sheep population. PLoS One. (2016) 11:e0159504. doi: 10.1371/journal.pone.0159504
15. Li, X, Ding, N, Zhang, Z, Tian, D, Han, B, Liu, S, et al. Identification of somatostatin receptor subtype 1 (Sstr1) gene polymorphism and their association with growth traits in Hulun Buir sheep. Genes. (2021) 13:77. doi: 10.3390/genes13010077
16. Zhou, S, Kalds, P, Luo, Q, Sun, K, Zhao, X, Gao, Y, et al. Optimized Cas9:sgRNA delivery efficiently generates biallelic MSTN knockout sheep without affecting meat quality. BMC Genomics. (2022) 23:348. doi: 10.1186/s12864-022-08594-6
17. Li, WR, Liu, CX, Zhang, XM, Chen, L, Peng, XR, He, SG, et al. Crispr/Cas9-mediated loss of Fgf5 function increases wool staple length in sheep. FEBS J. (2017) 284:2764–73. doi: 10.1111/febs.14144
18. Qin, Q, Dai, D, Zhang, C, Zhao, C, Liu, Z, Xu, X, et al. Identification of body size characteristic points based on the mask R-Cnn and correlation with body weight in Ujumqin sheep. Front Vet Sci. (2022) 9:995724. doi: 10.3389/fvets.2022.995724
19. Li, H, and Durbin, R. Fast and accurate short read alignment with burrows-wheeler transform. Bioinformatics. (2009) 25:1754–60. doi: 10.1093/bioinformatics/btp324
20. Li, H, Handsaker, B, Wysoker, A, Fennell, T, Ruan, J, Homer, N, et al. The sequence alignment/map format and Samtools. Bioinformatics. (2009) 25:2078–9. doi: 10.1093/bioinformatics/btp352
21. McKenna, A, Hanna, M, Banks, E, Sivachenko, A, Cibulskis, K, Kernytsky, A, et al. The genome analysis toolkit: a Mapreduce framework for analyzing next-generation DNA sequencing data. Genome Res. (2010) 20:1297–303. doi: 10.1101/gr.107524.110
22. Cingolani, P . Variant annotation and functional prediction: Snpeff. Methods Mol Biol. (2022) 2493:289–314. doi: 10.1007/978-1-0716-2293-3_19
23. Danecek, P, Auton, A, Abecasis, G, Albers, CA, Banks, E, DePristo, MA, et al. The variant call format and Vcftools. Bioinformatics. (2011) 27:2156–8. doi: 10.1093/bioinformatics/btr330
24. Raudvere, U, Kolberg, L, Kuzmin, I, Arak, T, Adler, P, Peterson, H, et al. G:profiler: a web server for functional enrichment analysis and conversions of gene lists (2019 update). Nucleic Acids Res. (2019) 47:W191–8. doi: 10.1093/nar/gkz369
25. Bu, D, Luo, H, Huo, P, Wang, Z, Zhang, S, He, Z, et al. Kobas-I: intelligent prioritization and exploratory visualization of biological functions for gene enrichment analysis. Nucleic Acids Res. (2021) 49:W317–25. doi: 10.1093/nar/gkab447
26. Li, X, Yang, J, Shen, M, Xie, XL, Liu, GJ, Xu, YX, et al. Whole-genome resequencing of wild and domestic sheep identifies genes associated with morphological and agronomic traits. Nat Commun. (2020) 11:2815. doi: 10.1038/s41467-020-16485-1
27. Duricki, DA, Soleman, S, and Moon, LD. Analysis of longitudinal data from animals with missing values using Spss. Nat Protoc. (2016) 11:1112–29. doi: 10.1038/nprot.2016.048
28. Chen, C, Wu, Y, Li, J, Wang, X, Zeng, Z, Xu, J, et al. Tbtools-ii: a "one for all, all for one" bioinformatics platform for biological big-data mining. Mol Plant. (2023) 16:1733–42. doi: 10.1016/j.molp.2023.09.010
29. Geourjon, C, and Deléage, G. Sopma: significant improvements in protein secondary structure prediction by consensus prediction from multiple alignments. Comput Appl Biosci. (1995) 11:681–4. doi: 10.1093/bioinformatics/11.6.681
30. Dekkers, JC, and Hospital, F. The use of molecular genetics in the improvement of agricultural populations. Nat Rev Genet. (2002) 3:22–32. doi: 10.1038/nrg701
31. Al Dhaheri, N, Wu, N, Zhao, S, Wu, Z, Blank, RD, Zhang, J, et al. Kiaa1217: a novel candidate gene associated with isolated and syndromic vertebral malformations. Am J Med Genet A. (2020) 182:1664–72. doi: 10.1002/ajmg.a.61607
32. Shao, Y, Zhou, L, Li, F, Zhao, L, Zhang, BL, Shao, F, et al. Phylogenomic analyses provide insights into primate evolution. Science. (2023) 380:913–24. doi: 10.1126/science.abn6919
33. Wilke, HJ, Kettler, A, Wenger, KH, and Claes, LE. Anatomy of the sheep spine and its comparison to the human spine. Anat Rec. (1997) 247:542–55. doi: 10.1002/(SICI)1097-0185(199704)247:4<542::AID-AR13>3.0.CO;2-P
34. Dong, T, Zhang, S, Chang, Y, Bai, R, Jiang, Y, Ma, S, et al. The establishment of a homozygous Snta1 knockout human embryonic stem cell line (Wae009-a-50) using the Crispr/Cas9 system. Stem Cell Res. (2021) 51:102196. doi: 10.1016/j.scr.2021.102196
35. Bhat, SS, Parray, AA, Mushtaq, U, Fazili, KM, and Khanday, FA. Actin Depolymerization mediated loss of Snta1 phosphorylation and Rac1 activity has implications on Ros production, cell migration and apoptosis. Apoptosis. (2016) 21:737–48. doi: 10.1007/s10495-016-1241-6
36. Ali, R, Mir, HA, Hamid, R, Bhat, B, Shah, RA, Khanday, FA, et al. Actin modulation regulates the Alpha-1-Syntrophin/P66shc mediated redox signaling contributing to the Rhoa Gtpase protein activation in breast cancer cells. Front Oncol. (2022) 12:841303. doi: 10.3389/fonc.2022.841303
37. Zhang, T, Wang, T, Niu, Q, Zheng, X, Li, H, Gao, X, et al. Comparative transcriptomic analysis reveals region-specific expression patterns in different beef cuts. BMC Genomics. (2022) 23:387. doi: 10.1186/s12864-022-08527-3
38. Wang, S, Yi, X, Wu, M, Zhao, H, Liu, S, Pan, Y, et al. Detection of key gene Indels in Tgf-Β pathway and its relationship with growth traits in four sheep breeds. Anim Biotechnol. (2021) 32:194–204. doi: 10.1080/10495398.2019.1675682
39. Cao, J, Wei, C, Liu, D, Wang, H, Wu, M, Xie, Z, et al. DNA methylation landscape of body size variation in sheep. Sci Rep. (2015) 5:13950. doi: 10.1038/srep13950
40. Gui, LS, Raza, SHA, Zhou, L, Garcia, M, Abd El-Aziz, AH, Wei, D, et al. Association between single nucleotide polymorphisms in Sirt1 and Sirt2 loci and growth in Tibetan sheep. Animals. (2020) 10:1362. doi: 10.3390/ani10081362
41. Cao, Y, Song, X, Shan, H, Jiang, J, Xiong, P, Wu, J, et al. Genome-wide association study of body weights in Hu sheep and population verification of related single-nucleotide polymorphisms. Front Genet. (2020) 11:588. doi: 10.3389/fgene.2020.00588
Keywords: Ujumqin sheep, nsSNP, KIAA1217 , SNTA1 , LTBP1
Citation: Liu Z, Qin Q, Zhang C, Xu X, Dai D, Lan M, Wang Y, Zhang J, Zhao D, Kong D, Qin T, Wu D, Gong X, Zhou X, Suhe A, Wang Z and Liu Z (2024) Effects of nonsynonymous single nucleotide polymorphisms of the KIAA1217, SNTA1 and LTBP1 genes on the growth traits of Ujumqin sheep. Front. Vet. Sci. 11:1382897. doi: 10.3389/fvets.2024.1382897
Edited by:
Xiangdong Ding, China Agricultural University, ChinaReviewed by:
Shamik Polley, West Bengal University of Animal and Fishery Sciences, IndiaCopyright © 2024 Liu, Qin, Zhang, Xu, Dai, Lan, Wang, Zhang, Zhao, Kong, Qin, Wu, Gong, Zhou, Suhe, Wang and Liu. This is an open-access article distributed under the terms of the Creative Commons Attribution License (CC BY). The use, distribution or reproduction in other forums is permitted, provided the original author(s) and the copyright owner(s) are credited and that the original publication in this journal is cited, in accordance with accepted academic practice. No use, distribution or reproduction is permitted which does not comply with these terms.
*Correspondence: Zhihong Liu, bGl1emg3Nzk5QDE2My5jb20=
Disclaimer: All claims expressed in this article are solely those of the authors and do not necessarily represent those of their affiliated organizations, or those of the publisher, the editors and the reviewers. Any product that may be evaluated in this article or claim that may be made by its manufacturer is not guaranteed or endorsed by the publisher.
Research integrity at Frontiers
Learn more about the work of our research integrity team to safeguard the quality of each article we publish.