 Asger L. Jensen
 Anne K. H. Krogh
 Lise N. Nielsen
- Department of Veterinary Clinical Sciences, Faculty of Health and Medical Sciences, University of Copenhagen, Copenhagen, Denmark
Red blood cell distribution width (RDW) and visual assessments of anisocytosis assess variability in erythrocyte size. Veterinary studies on the correlation between the two methods and on observer agreement are scarce. The objectives were to assess the correlation of the grading of anisocytosis by means of conventional microscopy of canine blood smears to RDW, and to assess intra- and inter-observer variation in assessing the degree of anisocytosis. The study included 100 canine blood samples on which blood smear examination and RDW measurement were performed. RDW was measured on the Advia 2120i analyzer. The degree of anisocytosis was based on a human grading scheme assessing the ratio between the size of the representative largest red blood cell and that of the representative smallest red blood cell (1+ if <2x, 2+ if 2–3x, 3+ if 3–4x, and 4+ if >4x). Three observers participated and assessed the blood smears by conventional microscopy twice, 3 weeks apart by each observer. The correlation was assessed for each observer on each occasion using Kendahl-tau-b analysis. Intra-observer agreement was assessed using quadratically weighted kappa. Inter-observer agreement was assessed using free-marginal multi-rater kappa. Anisocytosis graded on blood smears correlated significantly with RDW values as assessed by Kendahl-tau-b ranging between 0.37 and 0.51 (p < 0.0001). Intra-observer agreement ranged from weak to moderate with resulting kappa-coefficients being 0.58, 0.68, and 0.75, respectively. Inter-observer agreement was weak (Kappa-values 0.44). The weak to moderate observer agreement in the visual assessment of anisocytosis indicates that the more precise and more repeatable RDW measurement should be used for clinical decision-making.
1. Introduction
Variability in erythrocyte size, anisocytosis, is useful for the describing, classifying, or prognosing of pathophysiological phenomena in dogs (1–4), such as anemia (5–9), microcytosis (10, 11), quatrefoil red blood cells (12), cardiopulmonary diseases (13–18), pancreatitis (19), inflammatory bowel disease (20), or diabetes mellitus (21), and of physiological phenomena such as sex and aging (22, 23).
The degree of anisocytosis is typically expressed either as variation in erythrocyte diameters in stained blood films (24) and/or by increased red cell distribution width (RDW) in automated analyzer counts (25). Evaluating a blood smear by conventional microscopy requires experience (26) and is prone to subjective assessment, which may lead to variability within and between observers. Furthermore, different grading schemes exist, some with very simple categorizations such as “absent or present” (9, 22). Others have applied subjective grading on a scale from +1 to +4, with +1 being the smallest amount (27), or grading +1 to +4 based on the number of variable-sized erythrocytes in a monolayer at 1,000x microscopic field (28) or high-power field (HPF) (21). Anisocytosis has even been graded by the number of microcytes visible in the standard field of view at × 100 magnification (11).
Red blood cell distribution width (RDW) is generated by most modern automated hematological analyzers from the distribution curve of erythrocyte volume derived by impedance changes, originally developed by Coulter (29, 30), and as seen in Idexx Procyte Dx (31), Sysmex pocH-100iV Diff (32), and in Abbot Sapphire, by flow cytometry and 2-angle laser light scatter, as present in instruments from Siemens such ad Advia2120 (33). In the SysmexXE5000, the size distribution of the erythrocytes is measured using the Sheath Flow Direct Current method where the signal amplitude changes when a blood cell passes through an aperture of the detector (34). The International Council for Standardization in Hematology (ICSH) (35) recommended standardization of the statistical method for analysis of erythrocyte volume distribution and for the algorithms used for the calculation of RDW in 1990. Seemingly, different manufacturers use different statistical methods and algorithms. A method to harmonize RDW by recalculating values according to instrument-specific polynomial curves has been suggested (36). Further, in some analyzers, RDW is calculated from the distribution histogram at the 50% height level above the baseline (Abbott); others use 20% height level above baseline (Sysmex XE500 and Mindray) or determine RDW from the erythrocyte volume histogram in the window between 60 and 120 fL (Siemens), with RDW being calculated as the ratio expressed in percentage between the standard deviation (SD) of erythrocyte volumes and the mean cell volume (MCV) (36, 37). In some analyzers, such as the Idexx Procyte Dx, RDW is reported as RDW-CV and RDW-SD, the difference being that RDW can be reported either as percentage (RDW-CV) or in femtoliters representing a standard deviation from the mean (RDW-SD). Irrespective of the method, RDW results below the reference interval should not be considered clinically meaningful, whereas an increased RDW value reflects a greater difference in the size of erythrocytes, which can be due to the presence of smaller and/or larger erythrocytes (36, 38).
In medical hematology, a study in 1975 did not show any strong relationship between anisocytosis graded on blood smears and analyzer-detected erythrocyte size variability, as only nine out of 40 patients with increased erythrocyte volume variability were identified as slightly or moderately anisocytic on blood smears (39). However, Simel et al. (40) found that semiquantitative grading of anisocytosis correlated with RDW (Kendal tau-b 0.22-0.40) and, when using intraclass correlation coefficient analysis, inter- and intra-observer agreement ranged between 0.336–0.553, and 0.400–0.642, respectively. Kumar et al. (41) also found high inter-observer agreement for semiquantitative grading of anisocytosis on blood smears (concordance correlation coefficient 0.73–0.76) but non-significant correlation between semi-quantitative grading of anisocytosis and RDW (concordance correlation coefficient 0.011). Finally, Jen et al. (42) found no intra-observer agreement (kappa coefficient 0.19) and no inter-observer agreement (kappa coefficient ranging between 0.16–0.19) in anemic patients.
In veterinary medicine, studies aiming to assess observer agreement and correlation between RDW and visual assessments of anisocytosis are rare. One study by Kumiega et al. (16) found that RDW results were within the reference range for dogs with degenerative mitral valvular disease while manual microscopic analysis of the blood smears revealed the presence of anisocytosis, although no direct correlation was reported. de Souza et al. (9) communicated that, in cases where anisocytosis was observed in blood smears in anemic dogs, these dogs also had higher RDW values and concluded that RDW values were more accurate than microscopic observations to detect anisocytosis.
As few veterinary studies have compared visual assessments of anisocytosis and RDW, the first research aim of this study was to evaluate whether anisocytosis assessed by conventional microscopy correlated to RDW. The second research aim was to evaluate observer variability in assessing the degree of anisocytosis using conventional microscopy. The research objectives were to assess the correlation of the semi-quantitative grading of anisocytosis by means of conventional microscopy of canine blood smears to RDW, and to assess intra- and inter-observer variation in assessing the degree of anisocytosis using conventional microscopy. The underlying rationale was that if semi-quantitative grading of anisocytosis correlated with RDW, the more precise of the two measures should be used for clinical decision-making.
2. Materials and methods
2.1. Study
The study was an observational, cross-sectional study on methodology, as the aim concerned method characteristics.
The Ethical Committee at the Department of Veterinary Clinical Sciences, SUND, University of Copenhagen approved the project (Approval number 2023-07), and all samples were anonymized.
2.2. Blood samples
In this study, only blood samples from dogs were included. This was due to the physical shape of canine RBC with biconcavity and there being a more pronounced central pallor in dogs compared to other common domestic animals (24). Dogs also have a larger array of erythrocyte morphologies compared to other species (43) and there was an availability of suitable blood samples at the laboratory.
All samples originated from privately owned dogs presented for diagnostic and/or therapeutic procedures at the University Hospital for Companion Animals, University of Copenhagen, where a hematologic analysis was requested by the attending veterinarian. This may result in the inclusion of samples with hemolysis and samples from both fasting and non-fasting dogs. However, hemolysis affect many hematologic parameters but not RDW when measured on Advia2120i (44). Further, in humans a light meal resulted in a small decrease 1 hour after eating (45). However, as the aim was to assess method characteristics and not relation to other patient characteristics, this does not affect the results of the present study.
Blood was collected in K3-EDTA-coated 2 mL blood collection tubes (Beckton-Dickinson Vacutainer). To avoid artifactual morphology changes as much as possible (46–48), all blood smears were prepared manually within 2 hours after arrival at the laboratory, using the wedge technique (49) and stained with modified Wright's stain in an automated stainer (Hematek 3000, Siemens Healthineers) or manually using Hemacolor (Merck, Denmark).
Blood samples were included irrespective of the final diagnoses, since the present study was a methodological study.
Red blood cell distribution width (RDW) on each blood sample was measured using an automated hematology system (ADVIA 2120i, Siemens Healthcare Diagnostics, Tarrytown, NY, USA), following the protocol and the canine setting in multispecies software provided by manufacturer. The analyzer was subjected to daily internal quality control and quarterly external quality control. In a prior internal evaluation of the analyzer, it was found that imprecision expressed by within- and between-run coefficients of variation (CV) ranged between 0.5–1.1% and 0.5–2.1%, respectively, based on replicate analysis of 10 canine blood samples with RDW within and above the established reference interval employed at the laboratory (11.7–14.3%). Over a 3-month period, approximately 15% of all canine samples analyzed had RDW values above the upper reference limit.
Koo and Li (50) suggest as a rule of thumb to obtain at least 30 heterogeneous samples. To secure a range of RDW values within and above the reference interval employed at the laboratory and a proportion of increased RDW values above the upper reference limit resembling daily practice (i.e., 15%), stored blood smears where RDW had been measured in the corresponding blood samples as well as prospectively collected blood samples were collected so that at least 15 blood smears with an increased RDW value were included. A total of 100 blood samples were thus included in the study.
Each blood smear was given an ID-number, and all slides were assessed on two separate occasions by each observer individually, 3 weeks apart. The order and ID numbers of the slides were changed randomly between the two occasions.
2.3. Observers
Koo and Li (50) further suggest to involve at least three observers when conducting reliability studies. Hence, the study included three observers with experience ranging from 10 to more than 30 years' post-graduate clinical pathological experience who routinely participate in the daily analysis of blood smears. Assessment of the impact of level of experience was not part of the aim of the study and thus not included in the study. In line with the recommendation by McHugh (51), all observers assessed five stored canine blood smears with different degrees of anisocytosis in plenum prior to the study using a multi-headed microscope to ensure that all observers agreed on the visual appearance of anisocytosis and applied the same microscopy and classification procedures.
2.4. Microscopy procedure
Evaluations were performed using Nikon Eclipse E200 (Nikon Corporation, Minato, Tokyo, Japan), equipped with an ocular CFI 10x/20, and objectives (Nikon E Plan 4× /0.1 ∞/– WD 30; Nikon E Plan 20× /0.40 ∞/0.17 WD 3.9; Nikon E Plan 50× /0.90 Oil ∞/× WD 0.35, and Nikon E Plan 100× /1.25 ∞/0.17 WD 0.23).
Each observer first selected the monolayer area of the blood smear using 40× or 200× magnification, the monolayer being identified as the area where approximately half of the erythrocytes touch one another, thus leaving out the lateral edges and the feathered edge. In cases of severe anemia where a monolayer could not be identified, the selected area was defined as the area on the blood smear where erythrocytes were separated by a distance of one cell diameter (28). Assessment of the degree of anisocytosis was then performed at 500×, as this allowed for a larger number of cells to be assessed in one view field. In case the individual observer needed to validate the observer's own assessment at 500×, this was performed at 1,000×.
2.5. Anisocytosis grading
The degree of anisocytosis was based on the grading scheme for human blood samples suggested by Gulati (52), where the ratio of the size of the representative largest red blood cell is compared to that of the representative smallest red blood cell, or assessed based on how many of the representative small red blood cells can fit into the representative largest red blood cell (1+ if <2×, 2+ if 2–3×, 3+ if 3-4×, and 4+ if >4× ). The method described by Gulati (52) was used to avoid introducing additional errors by defining and counting microcytes, normocytes, and macrocytes, and also to identify the representative largest and smallest erythrocytes over more than one view field. Typically, four to six fields were assessed to obtain an impression of the representative largest and smallest red blood cell.
In case an observer classified a blood smear to be of unacceptable quality, the blood smear was removed from the study and replaced by a new smear, which was evaluated as described.
2.6. Statistical analysis
The data for anisocytosis graded on blood smears were categorical on an ordinal scale and RDW values were on an interval scale.
For the assessment of the correlation between anisocytosis graded on blood smears and RDW values, correlations for each observer on each occasion between anisocytosis graded on blood smears and RDW values was assessed using Kendahl-tau-b analysis (53, 54). This procedure was selected as visual grading of anisocytosis in daily practice is done by one observer and not by a group of observers. The resulting Kendahl-tau-b correlation coefficients were interpreted as suggested by Khamis (55): 0.0-No relationship, 0.2-Weak positive relationship, 0.5-Moderate positive relationship, and 0.8-Strong positive relationship.
Intra-observer agreement was assessed for each observer using quadratically weighted kappa to take into account the disagreement between observations, such as a shift on the same blood smear from 1 to 2 being less serious than a shift from 1 to 3 (56, 57).
Inter-observer agreement was assessed using free-marginal multi-rater kappa as the study included three observers who were not restricted to assigning a certain number of cases to each category (58, 59).
To mitigate for the well-known effect of prevalence on Kappa-statistics (57), both stored blood smears where RDW had been measured in the corresponding blood samples as well as prospectively collected blood samples were included to obtain a proportion of increased RDW values above the upper reference limit resembling daily practice (15%).
Resulting kappa-values were interpreted as previously suggested (51): <0.20 no agreement, 0.21–0.39 minimal agreement, 0.40–0.59 weak agreement, 0.60–0.79 moderate agreement, 0.80–0.90 strong agreement, and >0.90 almost perfect agreement.
Statistical analyses were performed using the software MedCalc (60) with free-marginal kappa being calculated using an online kappa calculator (61).
3. Results
Of the 100 blood samples included in the study, none were classified as unacceptable by any of the observers. All observers noted that some (fewer than 15) blood smears were difficult to assess because of concomitant moderate to marked poikilocytosis or rouleaux formation. Because samples with poikilocytosis or rouleaux formation are likely to occur in daily practice, it was decided not to exclude these from the analysis to obtain a realistic as possible estimation of the observer variability in everyday practice. The underlying raw data set is available from the corresponding author.
The 100 RDW values ranged from 10.6 to 22.1% with 16 values (16%) being above the upper reference limit for RDW of 14.3%. Overall, the three observers classified 51–61% as grade 1, 20–40% as grade 2, 5–9% as grade 3, and 0–8% as grade 4 (Figure 1). Of the 16 samples with RDW above 14.3%, the three observers classified between 0 and 2 cases as Grade 1, 4–7 cases as Grade 2, 4–8 cases as Grade 3, and 0–8 cases as Grade 4.
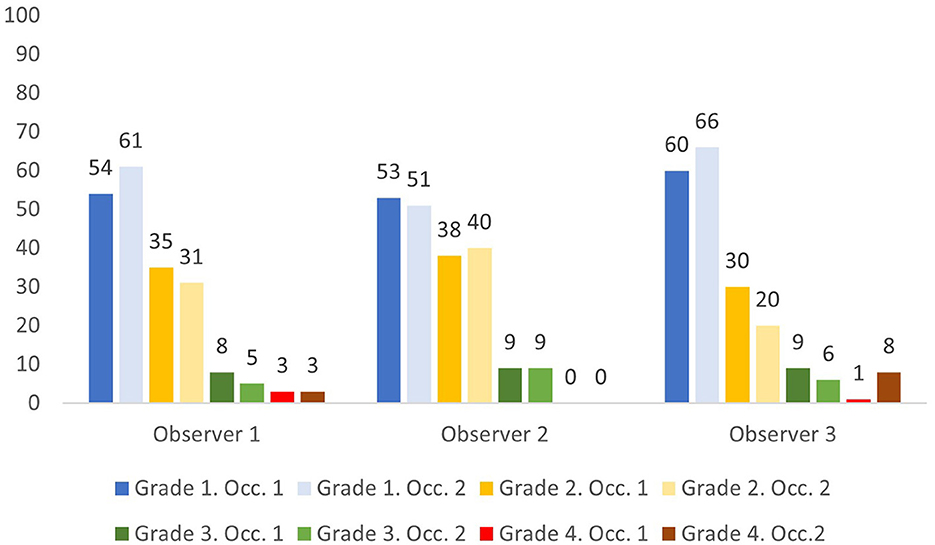
Figure 1. Percentage of samples assigned anisocytosis grade 1–4 by three observers on two occasions (Occ.1 and Occ. 2).
The upper reference limit for RDW is 14.3% at our laboratory. Using this limit, most observations by the three observers were anisocytosis grade 1 and 2 for RDW below 14.3%, and anisocytosis grade 2, 3, and 4 for RDW above 14.3% (Figures 2, 3).
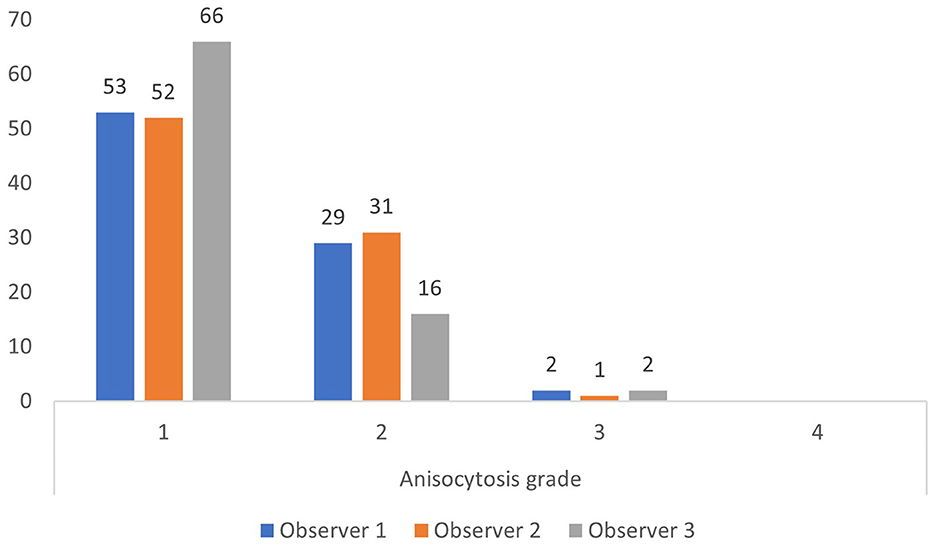
Figure 2. Anisocytosis grades by each observer when red cell density width (RDW) is below the upper limit of the reference interval of 14.3% (based on all 200 observations).
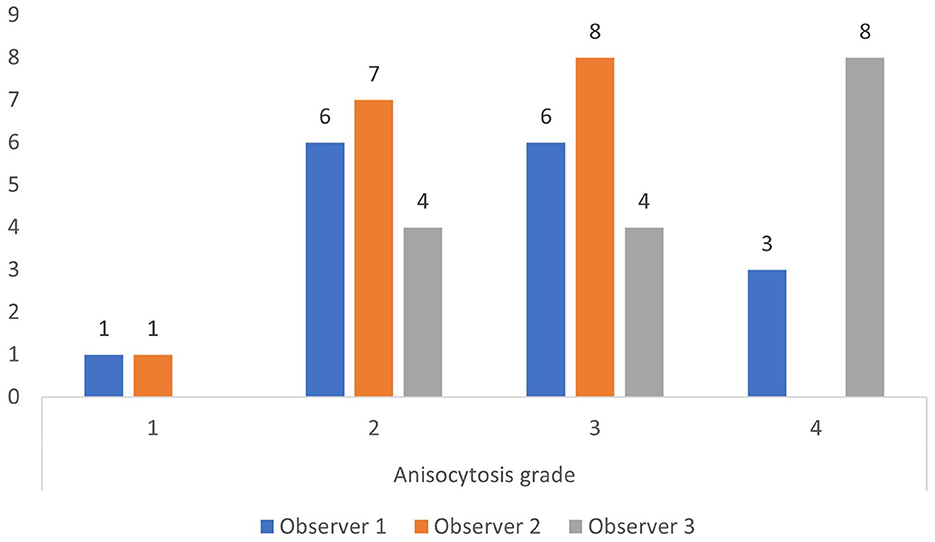
Figure 3. Anisocytosis grades by each observer when red cell density width (RDW) is above the upper limit of the reference interval of 14.3% (based on all 200 observations).
Anisocytosis graded on blood smears correlated moderately but significantly in this study to RDW with Kendahl-tau-b ranging between 0.37 and 0.51 (p < 0.0001) (Figure 4).
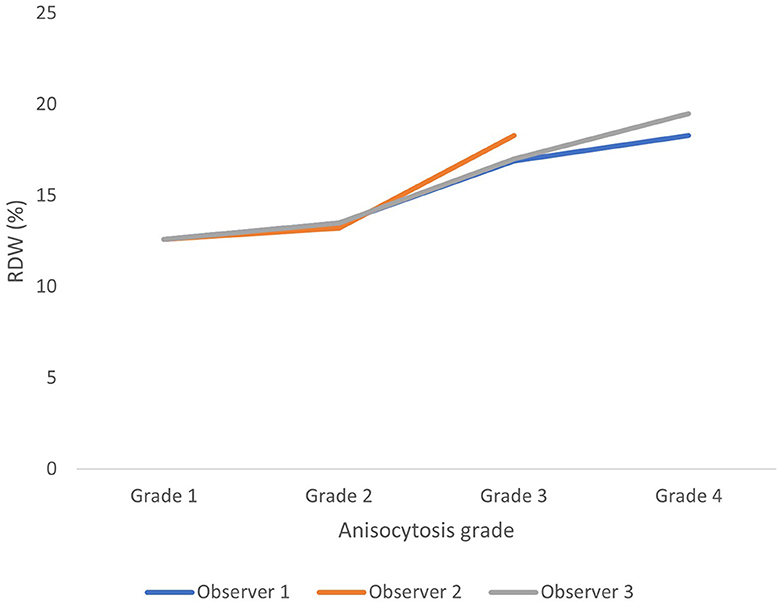
Figure 4. Average red blood cell density width (RDW) for each anisocytosis grade for each observer (based on all 200 observations). Anisocytosis graded on blood smears correlated moderately but significantly to RDW with Kendahl-tau-b ranging between 0.37 and 0.51 (p < 0.0001).
Intra-observer agreement as assessed by quadratically weighted kappa was weak to moderate, with resulting kappa-coefficients being 0.58, 0.68, and 0.75.
Inter-observer agreement as assessed by free-marginal kappa was weak. On the first occasion, the three observers agreed on classification on 39 occasions. Inter-observer variability expressed as kappa-value was 0.44 (0.36–0.53). On the second occasion, the three observers agreed on 39 occasions and inter-observer variability was 0.44 (0.35–0.53).
4. Discussion
RDW values are available in many veterinary laboratories, as is semiquantitative visual grading of anisocytosis. The two methods assess the same phenomenon, i.e., variability in erythrocyte size. In line with findings in medical hematology (40), the two methods also correlated in this study (Figure 2).
Visual microscopy to assess the degree of anisocytosis is associated with observer variability. In medical hematology, intra- and inter-observer agreement are moderate at best (39–42). This was also the case in the present study, where weak to moderate intra-observer agreement and weak inter-observer agreement were found. Several reasons for the weak to moderate observer agreement exist. For the semiquantitative assessment of anisocytosis, Gulati's method was applied in the present study to reduce additional errors from defining and assessing e.g., microcytes. However, in Gulati's method there are no solid borders between each category. For example, grade 2 includes RBC with a difference 2–3× and grade 3 includes a difference at 3–4×, thus if the degree of anisocytosis is borderline between the two grades, a variation is possible when assigning to one grade only.
Another reason for the weak to moderate observer variability is difficulties in assessing the degree of anisocytosis when poikilocytosis is present concomitantly. In this case, the Advia 2120i analyzer performs isovolumetric sphering of erythrocytes prior to analysis (33, 62, 63) and thus reduces poikilocytosis from RDW measurement, whereas the visual observer may experience difficulties in assessing the degree of anisocytosis. Also, marked rouleaux formation on blood smears may force visual assessments to be conducted nearer the feathered edge of the smear, potentially outside the monolayer. Although none of the observers excluded any samples as unacceptable, some samples that had either moderate to marked poikilocytosis or rouleaux formation were included to reflect everyday practice; this potentially could have interfered with observer variability, resulting in observer variability to be weak to moderate. Also, having each observer define the monolayer on each slide on each occasion made it very unlikely that the same field on each slide was evaluated by each observer on each occasion. This in turn adds to the magnitude of variability within and between observers. In contrast to the weak to moderate observer agreement found in this study, imprecision of RDW measurements on the Advia 2120i is below 2.5%. Seemingly, RDW measurement is more precise than visual assessment and thus, for clinical decision-making RDW values should be used. However, visual assessment of a blood smear remains a vital part of the CBC e.g., to validate the RDW value and other RBC features such as dimorphic RBC populations (64).
In the present study, only samples from dogs were included, and weak to moderate intra-observer agreement and weak inter-observer agreement were found. As intra- and inter-observer agreement in medical hematology are moderate at best (37–40), this could indicate that observer agreement is also weak to moderate in other animal species as well, thereby potentially also indicating that RDW values should be preferred over visual assessments of anisocytosis for clinical decision-making in other domestic animal species.
Data availability statement
The raw data supporting the conclusions of this article will be made available by the authors, without undue reservation.
Ethics statement
The animal studies were approved by the Ethical Committee at the Department of Veterinary Clinical Sciences, SUND, University of Copenhagen approved the project (Approval No. 2023-07), and all samples were anonymized. The studies were conducted in accordance with the local legislation and institutional requirements. Written informed consent was not obtained from the owners for the participation of their animals in this study because the study was approved by the Ethical Committee and no study on animals were conducted. Samples were already submitted and collected for diagnostic and/or therapeutic reasons so no additional samples were required. The samples were also anonymized and the study did not focus on the dogs included.
Author contributions
AJ: Conceptualization, Investigation, Writing—original draft, Writing—review and editing. AK: Investigation, Writing—original draft, Writing—review, and editing. LN: Investigation, Writing—original draft, Writing—review, and editing.
Funding
The author(s) declare that no financial support was received for the research, authorship, and/or publication of this article.
Conflict of interest
The authors declare that the research was conducted in the absence of any commercial or financial relationships that could be construed as a potential conflict of interest.
Publisher's note
All claims expressed in this article are solely those of the authors and do not necessarily represent those of their affiliated organizations, or those of the publisher, the editors and the reviewers. Any product that may be evaluated in this article, or claim that may be made by its manufacturer, is not guaranteed or endorsed by the publisher.
References
1. Martinez C, Mooney CT, Shiel RE, Tang PK, Mooney L, O'Neill EJ. Evaluation of red blood cell distribution width in dogs with various illnesses. Can Vet J. (2019) 60:964–71.
2. Garcia-Arce M, Gow AG, Handel I, Ngoi W, Thomas E. Retrospective evaluation of red blood cell distribution width in critically ill dogs (December 2016 to April 2017): 127 cas. J Vet Emerg Crit Care. (2022) 32:405–12. doi: 10.1111/vec.13167
3. Ludwik TM, Heinrich DA, Rendahl A, Friedenberg SG. Red cell distribution width illness severity and all-cause mortality in dogs. J Vet Emerg Crit Care. (2022) 32:9–17. doi: 10.1111/vec.13109
4. Miglio A, Valente C, Guglielmini C. Red Blood Cell Distribution Width as a Novel Parameter in Canine Disorders: Literature Review and Future Prospective. Animals. (2023) 13:985. doi: 10.3390/ani13060985
5. Stockham SL, Scott ML. Erythrocytes. In:Fundamentals of Veterinary Clinical Pathology. 2nd, ed. Iowa: Blackwell Publishing Inc. (2008). p. 107–221.
6. Neiger R, Hadley J, Pfeiffer DU. Differentiation of dogs with regenerative and non-regenerative anaemia on the basis of their red cell distribution width and mean corpuscular volume. Vet Rec. (2002) 150:431–4. doi: 10.1136/vr.150.14.431
7. Oikonomidis IL, Tsouloufi TK, Kritsepi-Konstantinou M, Soubasis N. Effect of anaemia and erythrocyte indices on canine glycated haemoglobin. Vet Rec. (2021) 188:58. doi: 10.1002/vetr.58
8. Stanley E, Appleman E, Schlag A, Siegel A. Relationship between cobalamin and folate deficiencies and anemia in dogs. J Vet Intern Med. (2019) 33:106–13. doi: 10.1111/jvim.15348
9. de Souza AM, Pereira J de J, Campos SDE, Bacellar DTL, Torres RA, Macieira D de B, et al. Behavior of red cell distribution width (RDW) in a population of anemic and non-anemic dogs from an ambulatory care unit. Rev Bras Ciência Veterinária. (2017) 24:18–21. doi: 10.4322/rbcv.2017.004
10. Gavazza A, Rispoli D, Bernabò N, Lubas G. Retrospective and observational investigation of canine microcytosis in relationship to sex, breed, diseases, and other complete blood count parameters. Comp Clin Path. (2012) 21:545–53. doi: 10.1007/s00580-010-1127-x
11. Aniołek O, Barc A, Jarosińska A, Gajewski Z. Evaluation of frequency and intensity of asymptomatic anisocytosis in the Japanese dog breeds Shiba, Akita, and Hokkaido. Acta Vet Brno. (2017) 86:385–91. doi: 10.2754/avb201786040385
12. Gavazza A, Ricci M, Brettoni M, Gugliucci B, Pasquini A, Rispoli D, et al. Retrospective and prospective investigations about “quatrefoil” erythrocytes in canine blood smears. Vet Med Int. (2014) 2014:409573. doi: 10.1155/2014/409573
13. Mazzotta E, Guglielmini C, Menciotti G, Contiero B, Baron Toaldo M, Berlanda M, et al. Red Blood Cell Distribution Width, Hematology, and Serum Biochemistry in Dogs with Echocardiographically Estimated Precapillary and Postcapillary Pulmonary Arterial Hypertension. J Vet Intern Med. (2016) 30:1806–15. doi: 10.1111/jvim.14596
14. Kim SJ, Suh S, Il Hyun C. Evaluation of red blood cell profiles in dogs with heartworm disease. Can J Vet Res. (2020) 84:265–71.
15. Guglielmini C, Valentini CM, Contiero B, Valente C, Poser H. Red cell distribution width has a negative prognostic role in dogs with myxomatous mitral valve disease. Animals. (2021) 11:1–14. doi: 10.3390/ani11030778
16. Kumiega E, Michałek M, Kasztura M, Noszczyk-Nowak A. Analysis of red blood cell parameters in dogs with various stages of degenerative mitral valve disease. J Vet Res. (2020) 64:325–32. doi: 10.2478/jvetres-2020-0043
17. Swann JW, Sudunagunta S, Covey HL, English K, Hendricks A, Connolly DJ. Evaluation of red cell distribution width in dogs with pulmonary hypertension. J Vet Cardiol. (2014) 16:227–35. doi: 10.1016/j.jvc.2014.08.003
18. Guglielmini C, Poser H, Pria AD, Drigo M, Mazzotta E, Berlanda M, et al. Red blood cell distribution width in dogs with chronic degenerative valvular disease. J Am Vet Med Assoc. (2013) 243:858–62. doi: 10.2460/javma.243.6.858
19. Guglielmini C, Crisi PE, Tardo AM, Di Maggio R, Contiero B, Boari A, et al. Prognostic role of red cell distribution width and other routine clinico-pathological parameters in dogs with acute pancreatitis. Animals. (2022) 12:3483. doi: 10.3390/ani12243483
20. Gori E, Pierini A, Nesci M, Benvenuti E, Tasca S, Lubas G, et al. Detection of anti-erythrocyte antibodies in dogs with inflammatory bowel disease (Ibd). Animals. (2021) 11:1–9. doi: 10.3390/ani11092580
21. Slead TS, Woolcock AD, Scott-Moncrieff JC, Messick JB, Moore GE. Complete blood counts and blood smear analyses in 312 diabetic dogs (2007–2017). J Am Anim Hosp Assoc. (2022) 58:180–8. doi: 10.5326/JAAHA-MS-7230
22. Montoya-Navarrete AL, Guerrero-Barrera AL, Quezada-Tristán T, Valdivia-Flores AG, Cano-Rábano MJ. Red blood cells morphology and morphometry in adult, senior, and geriatricians dogs by optical and scanning electron microscopy. Front Vet Sci. (2022) 9:998438. doi: 10.3389/fvets.2022.998438
23. de Souza AM, Camargo MB, Tendlerleibelbacellar D, Campos SD, Filho RA, de Alencar NX, et al. Age and sex influence in canineRed cell distribution width (RDW-CV and RDW-SD) values Valores dos índicesde anisocitose (RDW-CV e RDW-SD) em cães : influência da idade e do sexo. Rev Bras Ciência Veterinária. (2012) 19:90–3. doi: 10.4322/rbcv.2014.085
24. Harvey JW. Evaluation of Erythrocytes. In: Veterinary Hematology - A Diagnostic Guide and Color Atlas. St. Louis, Missouri: Elsevier Inc. (2012). p. 49–121. doi: 10.1016/B978-1-4377-0173-9.00004-X
26. Bain BJ. Diagnosis from the blood smear. N Engl J Med. (2005) 353:498–507. doi: 10.1056/NEJMra043442
27. Tvedten H, Weiss DJ. The complete blood count and bone marrow examination: General comments and selected techniques. In:Willard MD, Tvedten H, Turnwald GT, , editors. Small Animal Clinical Diagnosis by Laboratory Methods. 3rd ed. W.B. Saunders Company (1999). p. 11–30.
28. Weiss DJ. Uniform evaluation and semiquantitative reporting of hematologic data in veterinary laboratories. Vet Clin Pathol. (1984) 13:27–31. doi: 10.1111/j.1939-165X.1984.tb00836.x
29. Coulter WH. High speed automatic blood cell counter and cell size analyzer. Proc Natl Electron Conf. (1956) 12:1034–42.
30. Lichtman MA, Spivak JL, Boxer LA, Shattil SJ, Henderson ES. Hematology Landmark Papers of the Twentieth Century. London: Academic Press (2000). p. 911–21. doi: 10.1016/B978-012448510-5/50175-8
31. Fujino Y, Nakamura Y, Matsumoto H, Fukushima K, Takahashi M, Ohno K, et al. Development and evaluation of a novel in-clinic automated hematology analyzer, ProCyte Dx, for canine erythrocyte indices, leukogram, platelet counts and reticulocyte counts. J Vet Med Sci. (2013) 75:1519–24. doi: 10.1292/jvms.13-0264
32. Riond B, Weissenbacher S, Hofmann-Lehmann R, Lutz H. Performance evaluation of the Sysmex pocH-100iV Diff hematology analyzer for canine, feline, equine, and bovine blood. Vet Clin Pathol. (2011) 40:484–95. doi: 10.1111/j.1939-165X.2011.00372.x
33. ADVIA. 2120/2120i Hematology Systems Operator's Guide. Tarryton, NY: Siemens Healthcare Diagnostics Inc. (2010).
34. Tanaka C, Nagai T, Nakamura M, Yamauchi Y, Noguchi K, Takimoto Y, et al. Automated hematology analyzer XE-5000 — overview and basic performance. Sysmex J Int. (2007) 17:1–6.
35. England JM, Rowan RM, Bull BS, Coulter WH, Groner W, Jones AR, et al. ICSH recommendations for the analysis of red cell, white cell and platelet size distribution curves. Methods for fitting a single reference distribution and assessing its goodness of fit. Clin Lab Haematol. (1990) 12:417–31. doi: 10.1111/j.1365-2257.1990.tb00354.x
36. Salvagno GL, Sanchis-Gomar F, Picanza A, Lippi G. Red blood cell distribution width: A simple parameter with multiple clinical applications. Crit Rev Clin Lab Sci. (2015) 52:86–105. doi: 10.3109/10408363.2014.992064
37. Lippi G, Plebani M. Red blood cell distribution width (RDW) and human pathology. One size fits all. Clin Chem Lab Med. (2014) 52:1247–9. doi: 10.1515/cclm-2014-0585
38. Montagnana M, Cervellin G, Meschi T, Lippi G. The role of red blood cell distribution width in cardiovascular and thrombotic disorders. Clin Chem Lab Med. (2012) 50:635–41. doi: 10.1515/cclm.2011.831
39. Bessman JD, Johnson RK. Erythrocyte volume distribution in normal and abnormal subjects. Blood. (1975) 46:369–79. doi: 10.1182/blood.V46.3.369.369
40. Simel DL, DeLong ER, Feussner JR, Weinberg JB, Crawford J. Erythrocyte anisocytosis. Visual inspection of blood films vs automated analysis of red blood cell distribution width. Arch Intern Med. (1988) 148:822–5. doi: 10.1001/archinte.1988.00380040062012
41. Kumar A, Kushwaha R, Gupta C, Singh U. An analytical study on peripheral blood smears in anemia and correlation with cell counter generated red cell parameters. J Appl Hematol. (2013) 4:137. doi: 10.4103/1658-5127.127896
42. Jen P, Woo B, Rosenthal PE, Bunn F, Loscalzo A, Goldman L. The value of the peripheral blood smear in anemic inpatients. The laboratory's reading v a physician's reading. Arch Intern Med. (1983) 143:1120–5. doi: 10.1001/archinte.143.6.1120
43. Tvedten H. Classification and Laboratory Evaluation of Anemia. In:Brooks MB, Harr KE, Seelig DM, Wardrop KJ, Weiss DJ, , editors. Schalm's Veterinary Hematology. 7th ed. New York: John Wiley & Sons, Ltd. (2022). p. 198–208. doi: 10.1002/9781119500537.ch25
44. Lippi G, Musa R, Avanzini P, Aloe R, Pipitone S, Sandei F. Influence of in vitro hemolysis on hematological testing on Advia 2120. Int J Lab Hematol. (2012) 34:179–84. doi: 10.1111/j.1751-553X.2011.01378.x
45. Lippi G, Lima-Oliveira G, Salvagno GL, Montagnana M, Gelati M, Picheth G, et al. Influence of a light meal on routine haematological tests. Blood Transfus. (2010) 8:94–9. doi: 10.2450/2009.0142-09
46. Zini G. Stability of complete blood count parameters with storage: Toward defined specifications for different diagnostic applications. Int J Lab Hematol. (2014) 36:111–3. doi: 10.1111/ijlh.12181
47. Samu RP, Shuhaib S, Revi D, Rahul R. Storage dependent cellular changes in blood smears prepared from EDTA added venous blood samples. Acta Sci Med Sci. (2021) 5:42–6.
48. Furlanello T, Tasca S, Caldin M, Carli E, Patron C, Tranquillo M, et al. Artifactual changes in canine blood following storage, detected using the ADVIA 120 hematology analyzer. Vet Clin Pathol. (2006) 35:42–6. doi: 10.1111/j.1939-165X.2006.tb00087.x
49. Vives Corrons JL, Albarède S, Flandrin G, Heller S, Horvath K, Houwen B, et al. Guidelines for blood smear preparation and staining procedure for setting up an external quality assessment scheme for blood smear interpretation. Part 1: Control material. Clin Chem Lab Med. (2004) 42:922–6. doi: 10.1515/CCLM.2004.149
50. Koo TK Li MY, A. Guideline of Selecting and Reporting Intraclass Correlation Coefficients for Reliability Research. J Chiropr Med. (2016) 15:155–63. doi: 10.1016/j.jcm.2016.02.012
51. McHugh ML. Interrater reliability: the kappa statistic. Biochem Medica. (2012) 22:276–82. doi: 10.11613/BM.2012.031
52. Gulati G. Red cell morphology. In: Blood Cell Morphology Grading Guide. 2nd, ed. Chicago: ASCP Press (2018). p. 3–46.
53. Siegel S. Measures of correlation and their tests of significance. In: Nonparametric Statistics for Behavorial Sciences Internatio. Tokyo: McGraw-Hill Kogakusha, Ltd. (1956). p. 195–244.
54. Puka L. Kendall's Tau. In:Lovric M, , editor. International Encyclopedia of Statistical Science. Berlin, Heidelberg: Springer (2011). p. 713–5. doi: 10.1007/978-3-642-04898-2_324
55. Khamis H. Measures of association: How to choose? J Diagnostic Med Sonogr. (2008) 24:155–62. doi: 10.1177/8756479308317006
56. Brenner H, Kliebsch U. Dependence of weighted kappa coefficients on the number of categories. Epidemiology. (1996) 7:199–202. doi: 10.1097/00001648-199603000-00016
57. Sim J, Wright CC. The kappa statistic in reliability studies: Use, interpretation, and sample size requirements. Phys Ther. (2005) 85:257–68. doi: 10.1093/ptj/85.3.257
58. Brennan RL, Prediger DJ. Coefficient kappa: Some uses, misuses, and alternatives. Educ Psychol Meas. (1981) 41:687–99. doi: 10.1177/001316448104100307
59. Randolph JJ. Free-marginal multirater kappa (multirater κ free): an alternative to Fleiss' fixed-Marginal multirater kappa. In: Joensuu Learning and Instruction Symposium, Joensuu, Finland: ERIC. (2005).
60. MedCalc®. Statistical Software version 20,.211. MedCalc Software Ltd, Ostend, Belgium. (2023). Available online at: https://www.medcalc.org (accessed August 28, 2023).
61. Randolph JJ. Online Kappa Calculator [Computer Software]. (2008). Available online at: http://www.justusrandolph.net/kappa/ (accessed August 28, 2023).
62. Harris N, Kunica J, Kratz A. The ADVIA 2120 hematology system: flow cytometry-based analysis of blood and body fluids in the routine hematology laboratory. Lab Hematol. (2005) 11:47–61. doi: 10.1532/LH96.04075
63. Kim YR, Ornstein L. Isovolumetric sphering of erythrocytes for more accurate and precise cell volume measurement by flow cytometry. Cytometry. (1983) 3:419–27. doi: 10.1002/cyto.990030606
Keywords: dog, hematology, microscopy, observer variability, erythrocyte size variability
Citation: Jensen AL, Krogh AKH and Nielsen LN (2023) Comparison of visual assessments of anisocytosis in canine blood smears and analyzer-calculated red blood cell distribution width. Front. Vet. Sci. 10:1258857. doi: 10.3389/fvets.2023.1258857
Received: 14 July 2023; Accepted: 28 August 2023;
Published: 21 September 2023.
Edited by:
Carlo Guglielmini, University Hospital of Padua, ItalyReviewed by:
Fulvio Riondato, University of Torino, ItalyFederico Bonsembiante, University of Copenhagen, Denmark
Copyright © 2023 Jensen, Krogh and Nielsen. This is an open-access article distributed under the terms of the Creative Commons Attribution License (CC BY). The use, distribution or reproduction in other forums is permitted, provided the original author(s) and the copyright owner(s) are credited and that the original publication in this journal is cited, in accordance with accepted academic practice. No use, distribution or reproduction is permitted which does not comply with these terms.
*Correspondence: Asger L. Jensen, YWxqQHN1bmQua3UuZGs=