 Youbing Yang1†
 Mingxing Chu
 Zhangyuan Pan
- 1College of Animal Science and Technology, Henan University of Science and Technology, Luoyang, China
- 2Key Laboratory of Animal Genetics and Breeding and Reproduction of Ministry of Agriculture and Rural Affairs, Institute of Animal Science, Chinese Academy of Agricultural Sciences, Beijing, China
Introduction: Super-enhancers (SEs) are clusters of enhancers that act synergistically to drive the high-level expression of genes involved in cell identity and function. Although SEs have been extensively investigated in humans and mice, they have not been well characterized in pigs.
Methods: Here, we identified 42,380 SEs in 14 pig tissues using chromatin immunoprecipitation sequencing, and statistics of its overall situation, studied the composition and characteristics of SE, and explored the influence of SEs characteristics on gene expression.
Results: We observed that approximately 40% of normal enhancers (NEs) form SEs. Compared to NEs, we found that SEs were more likely to be enriched with an activated enhancer and show activated functions. Interestingly, SEs showed X chromosome depletion and short interspersed nuclear element enrichment, implying that SEs play an important role in sex traits and repeat evolution. Additionally, SE-associated genes exhibited higher expression levels and stronger conservation than NE-associated genes. However, genes with the largest SEs had higher expression levels than those with the smallest SEs, indicating that SE size may influence gene expression. Moreover, we observed a negative correlation between SE gene distance and gene expression, indicating that the proximity of SEs can affect gene activity. Gene ontology enrichment and motif analysis revealed that SEs have strong tissue-specific activity. For example, the CORO2B gene with a brain-specific SE shows strong brain-specific expression, and the phenylalanine hydroxylase gene with liver-specific SEs shows strong liver-specific expression.
Discussion: In this study, we illustrated a body map of SEs and explored their functions in pigs, providing information on the composition and tissue-specific patterns of SEs. This study can serve as a valuable resource of gene regulatory and comparative analyses to the scientific community and provides a theoretical reference for genetic control mechanisms of important traits in pigs.
1. Introduction
Pigs are important livestock animals, and pork is the most widely consumed meat in Asia and Europe (1). Pigs also are valuable biomedical models for studying human diseases, pathogen responses, xenotransplantation, and drug development (2–4). To understand the genetic underpinnings of the complex characteristics and disease phenotypes in pigs and their potential applications in medical research, it is crucial to systematically annotate and functionally elucidate the regulatory elements in non-coding genomes (5).
Enhancers are distal regulatory elements that control cell type-specific gene expression (6, 7). Enhancers contain a cluster of binding sites for sequence-specific transcription factors (TFs) and co-activators, which can be several hundreds to thousands of base pairs (bp) in length (8, 9). Enhancers play a key role in controlling transcriptional programs that regulate development, cell identity, and evolutionary processes by increasing the transcription of specific target genes (10). Enhancers are often flanked by histone modifications, such as histone H3 lysine 4 monomethylation (H3K4me1) and H3K27 acetylation (H3K27ac) (11). Therefore, histone modifications serve as beacons for the detection of potential enhancers. High ratios of H3K4me1 to histone H3 lysine 4 trimethylation have been used to predict probable enhancers (12). H3K27ac is a well-characterized histone marker associated with enhanced activity (13, 14). Supported by advances in next-generation sequencing technologies, chromatin immunoprecipitation followed by sequencing (ChIP-seq) has revealed approximately one million putative enhancers in the human genome across tissues (15). These findings have sparked considerable interest in the functional and characteristic analyses of these putative enhancers. The different features and functions of enhancers in mice and humans have been thoroughly studied (16–19). Genome-wide association studies have revealed that the majority of disease-associated variations in non-coding regulatory DNA, particularly in regions enriched in enhancers (20–22). Various human diseases, including polydactyly and cancer, are affected by enhancer failure caused by genetic, structural, and epigenetic processes (19, 23, 24).
Super-enhancers (SEs) are a distinct category of enhancers (25) that have a high TF density and large size compared to typical enhancers (26, 27). SEs are large enhancer clusters filled with key TFs, cofactors, histone modification markers, and chromatin modification molecules (28, 29). SEs have a stronger ability to drive target gene transcription than typical enhancers (29) and play an important role in the maintenance of cellular properties, determination of cell fate, and disease occurrence (25, 30, 31). For instance, SEs maintain stem cell pluripotency in mammals, and their disruption causes a loss of stem cell pluripotency (32, 33). Additionally, functional analysis of the Vsx2 SE has revealed the distinctive roles of the Vsx2 enhancer components in promoting proliferation and cell fate specification during retinal development (34). Recent studies have revealed that SEs are frequently responsible for the continuous and robust transcription of oncogenes in cancer cells, such as those that cause melanoma, esophageal cancer, gastric cancer, hepatocellular carcinoma, and colorectal cancer (35–37). In addition to cancer, several studies have demonstrated that SEs play crucial roles in various disorders (38, 39). For instance, single-nucleotide polymorphisms (SNPs) linked to systemic lupus erythematosus are enriched in SEs found in B cells (30). Moreover, SEs are linked to hereditary risk factors for complicated diseases such as type 2 diabetes and coronary artery disease (40, 41). SEs have been widely identified and characterized in human and mouse genomes (42).
The genetic background of pig traits may be useful for annotating human enhancers and diseases (43). The SEs of some tissues (e.g., liver, brain, muscle, and adipose) have been reported in previous studies (44–47). To advance our understanding of SEs and their possible functions in pigs, we systematically identified SEs in 14 pig tissues by integrating ChIP-seq data labeled with H3K27ac signals and five types of enhancer annotations (48). Additionally, we analyzed the features, gene expression, gene ontology (GO) enrichment, and tissue specificity of SEs. Our study provides a map of SEs in pigs and reveals their potential functions in the regulation of tissue-specific gene expression. These results provide support for the interpretation of the biological functions of specific tissues and the analysis of genetic control mechanisms in pigs.
2. Materials and methods
2.1. Public data resources
H3K27ac and H3K4me3 ChIP-seq raw data were downloaded from a paper by Pan et al. (49) for fourteen pig tissues, including adipose, cecum, cerebellum, colon, cortex, duodenum, hypothalamus, ileum, Jejunum, liver, lung, muscle, spleen, and stomach. The data processing method was the same as the study in Pan et al. (49). All work presented in this study was based on susScr11 reference genome.
2.2. Identification of super-enhancers
Enhancers were classified into five categories: strong active enhancers (EnhA), methylation active enhancers with ATAC (EnhAMe), weak active enhancers (EnhAWk), activate enhancer on heterochromatic (EnhAHet), and poised enhancers (EnhPois) (Supplementary Figure S1) (50). In each tissue, the five kinds of enhancers which contain all the enhancers have been combined in a gff file. Then SEs were identified using ROSE (v1.3.1) (48) with default parameters based on the H3K27ac signals of each sample in each tissue. Next, SEs were overlapped among samples within the same tissue. A total of 8,173 non-redundant of SEs were detected after combining and merging (at least overlap of 10 K bp) them across all tissues. Tissue-specific SEs was then detected using the same approach as above for tissue-specific regulatory elements. The clustering of SEs was conducted using k-means (n = 10) in ComplexHeatmap (v.2.9.3) (51).
2.3. Enrichment of states in pig super-enhancers
The enrichment of states in pig SEs was assessed by (C/A)/(B/D) (52), where A was the size of segments in a state, B was the size of segments in a genomic feature, C is the size of segments in the overlapped region of the state and the genomic feature, D was the size of segments in the entire genome. The overlapped region used intersect function in BEDTools (v2.26.0) (53). The genomic features also included X chromosome and repeat sequences. The repeat sequences were identified using RepeatMasker (v.4.0.8) (54). And we chose this sequence content originates from retrotransposition of SINE (short interspersed nuclear element), LINE (long interspersed nuclear element) and LTR (long terminal repeat) transposable element superfamilies, as well as direct transposition of genomic DNA (55, 56).
2.4. Factors affecting gene expression
The SEs expression, tau and conservation were compared difference between genes with and without super-enhancers. The gene conservation score was sequence identity (%) from pig gene to the orthologous huma gene. The non-redundant 8,173 SEs were arranged from small to large in size and evenly divided into five groups including G1, G2, G3, G4, and G5 (Supplementary Figure S2A), then used intersect function in BEDTools (v2.26.0) (53) with parameter of -w to get the gene corresponding and expression levels of SEs. The distance between the SEs and the transcription start site (TSS) were obtained using BEDTools closest (53) with parameter of -D (Supplementary Figure S2B). Next, they were sorted from small to large and divided into five groups: two groups of downstream T1 (n = 4,225) and T2 (n = 1,982), one group of T3 (n = 1,000) with the distance of 0, and two groups of upstream T4 (n = 2,688) and T5 (n = 4,244), and obtained the gene corresponding and expression levels. And the T3 was used as the reference group to compare the effect of distance on gene expression. The gene expression was expressed as the mean Transcript per million (TPM) of the gene in 14 tissues.
2.5. GO enrichment and motif analysis
The Gene Ontology (GO) enrichment analysis of genes with SEs was performed using WebGestalt.1 The motif analysis and annotation used Homer’s findMotifsGenome (v.4.11) (30) with FDR < 0.05.
3. Results
3.1. Identification and summary of pig SEs
SEs are generally defined as a class of regulatory regions with an unusually strong enrichment of transcription coactivator binding that play a biological role in controlling gene expression programs in tissues (transcriptional regulation, including health and disease) (48, 57). In this study, we investigated the features of SEs in 14 tissue samples (Figure 1A). We identified an average of 3,027 SEs across tissues, ranging from 2,193 in the muscle to 3,712 in the cecum, by integrating H3K27ac signals and enhancers (all five types of enhancers) (Figure 1B). The SEs had an average size of 56,862 bp, covering 42% of all enhancers and 6.85% of the pig genome. Moreover, each SE had a median of 43 enhancers and an average size of approximately 682 bp, with an average gap of 625 bp between adjacent enhancers (Figure 1C).
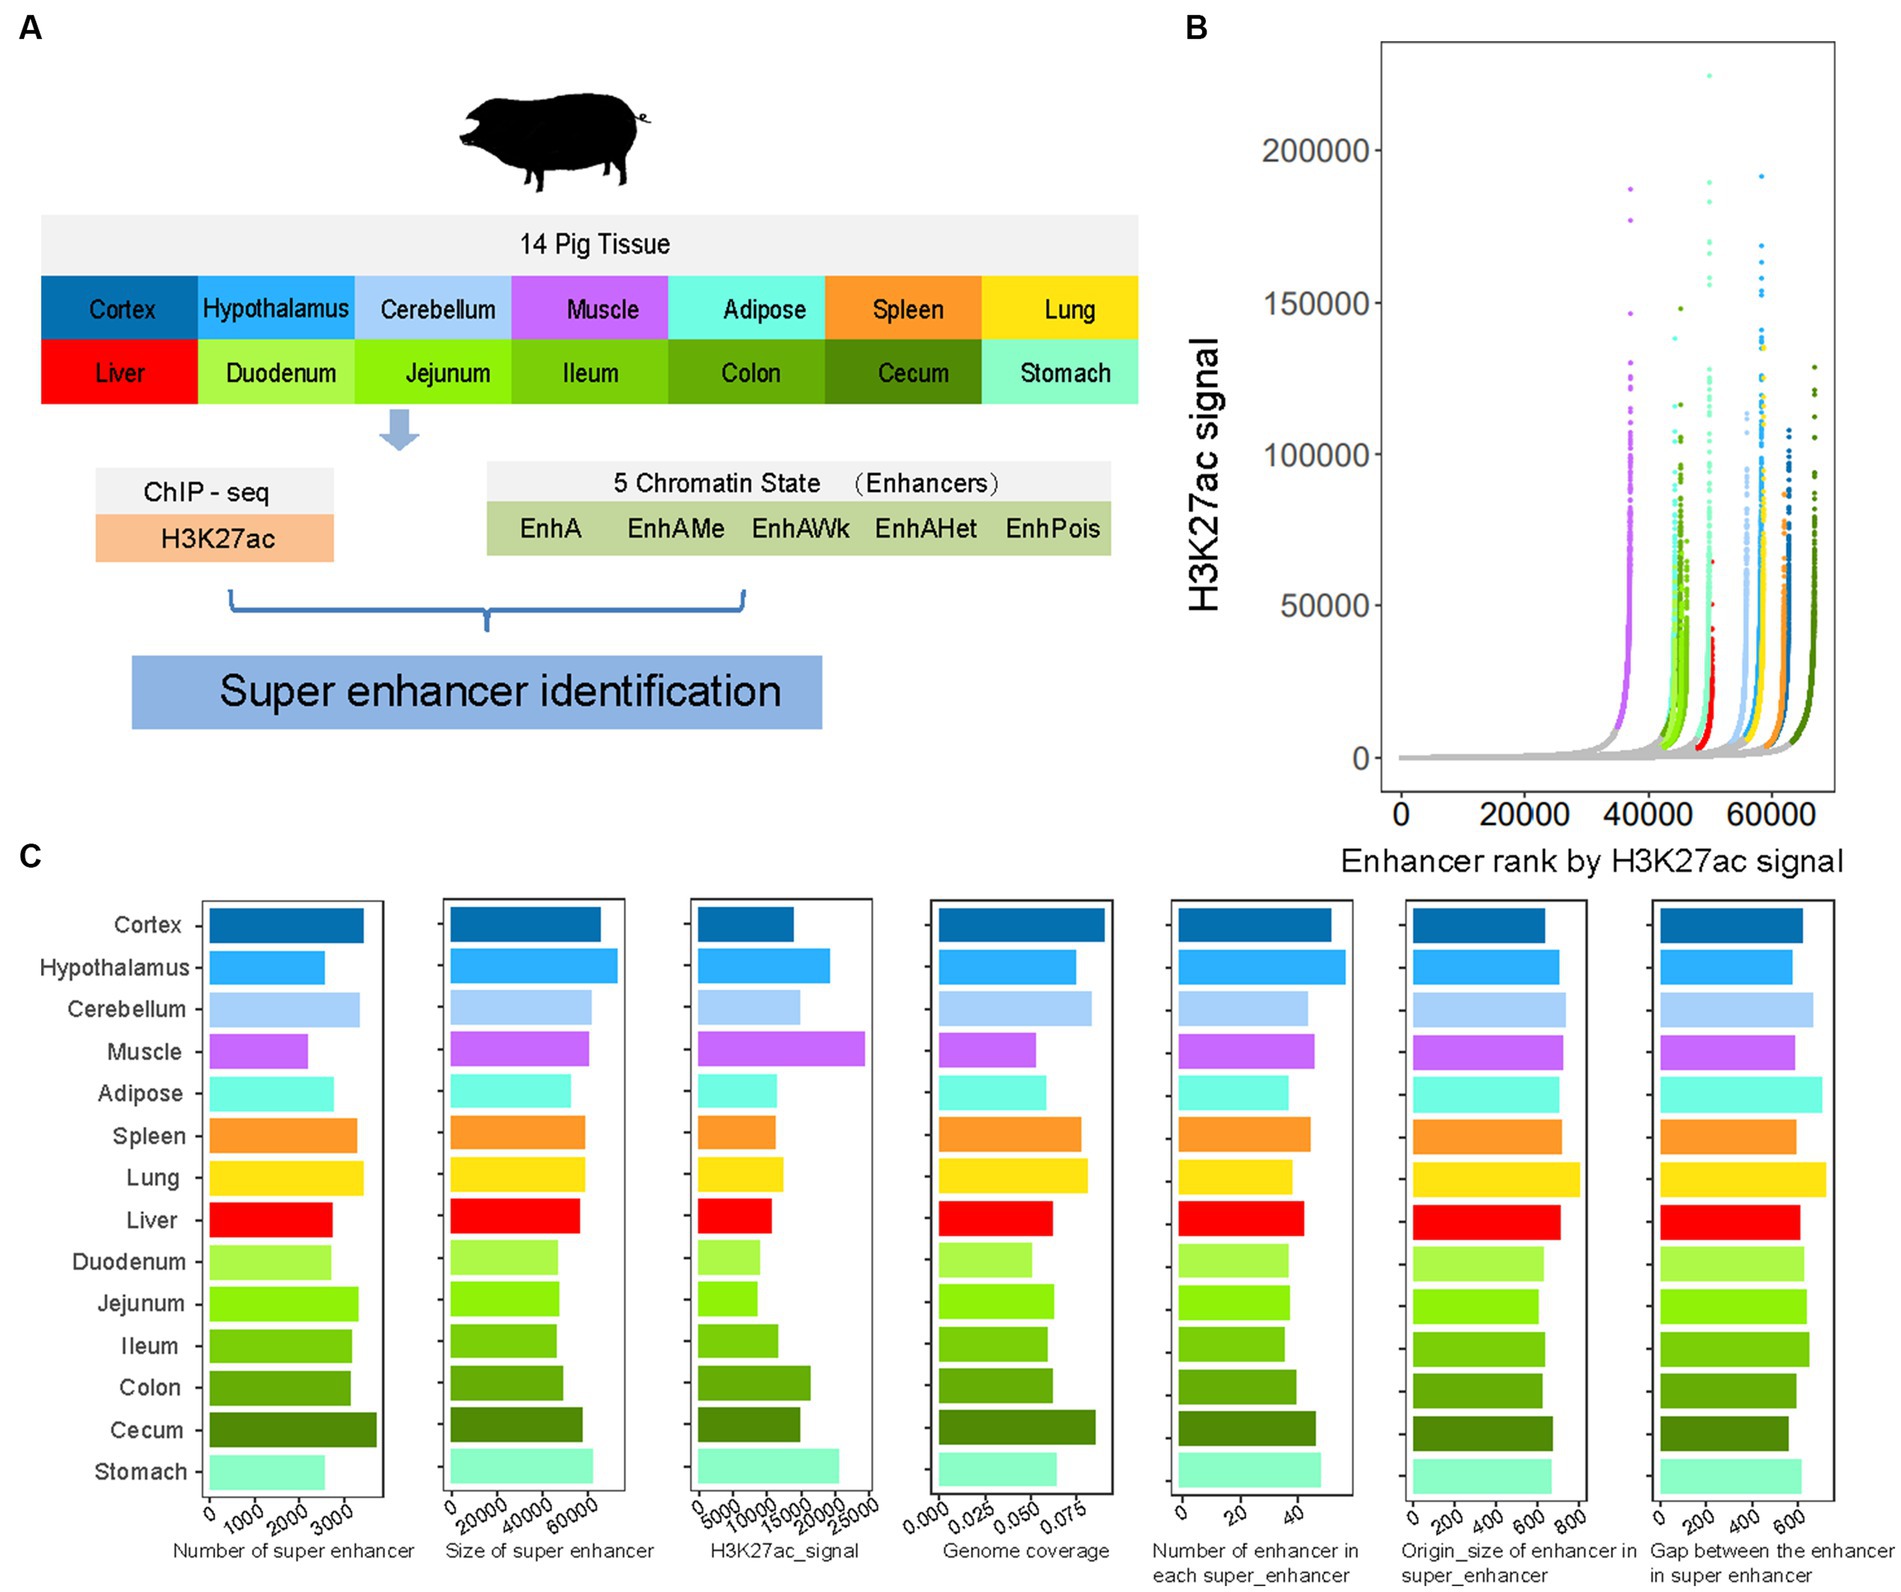
Figure 1. The summary of super-enhancers in pig. (A) The overview of the current study design. (B) Super-enhancers (SEs) identified by ROSE based on H3K27ac signal in each tissue. Super-enhancers are colored based on tissue, and show exceptionally high signal. Tissue color is the same with (A). (C) The distribution of number, size, H3K27ac signal intensity and genome coverage of super-enhancers, and the number of enhancers, origin size of enhancers and gap between enhancers based on super-enhancers of 14 tissues.
3.2. Characteristics of SEs in pigs
To further explore the features of SEs, we analyzed composition of the identified SEs. The SEs were large domains containing clusters of constituent enhancers (e.g., EnhA, EnhAMe, EnhAWk, EnhAHet, and EnhPois). Concerning the relationship between SEs and normal enhancers (NEs), we observed that approximately 40% of normal enhancers (NEs) formed SEs (Figure 2A). It was noted that among the five types of enhancers, SEs had many EnhA and EnhAHet, and fewer EnhPoIs than the other four types of enhancers (Figure 2B). Subsequently, we investigated the chromosomal distribution of SEs by calculating and comparing the fold enrichment of SEs on the autosomes and X chromosomes. The results showed that the fold enrichment of SEs on autosomes was approximately 1.06, whereas that on the X chromosome was only 0.2 (Figure 2C). The findings the extensive depletion of SEs in the X chromosome. Furthermore, we examined the association between SEs and repeat sequences. Repeat sequences comprise a high percentage of the genomes and are involved in tissue-specific transcriptional regulation (58, 59). Among the four major classes of transposable elements, which include short interspersed nuclear elements (SINEs), long interspersed nuclear elements (LINEs), long terminal repeats (LTRs), and direct transposition of genomic DNA, we observed that SINEs, which had higher divergence values, had the highest fold enrichment of SEs compared to the other classes (Figure 2D). Furthermore, SINE/MIR sequences showed the highest fold enrichment of SEs among the repeat sequences. We speculated that there were many repeat sequences of SINE that were older than other types in the SEs of pigs (60).
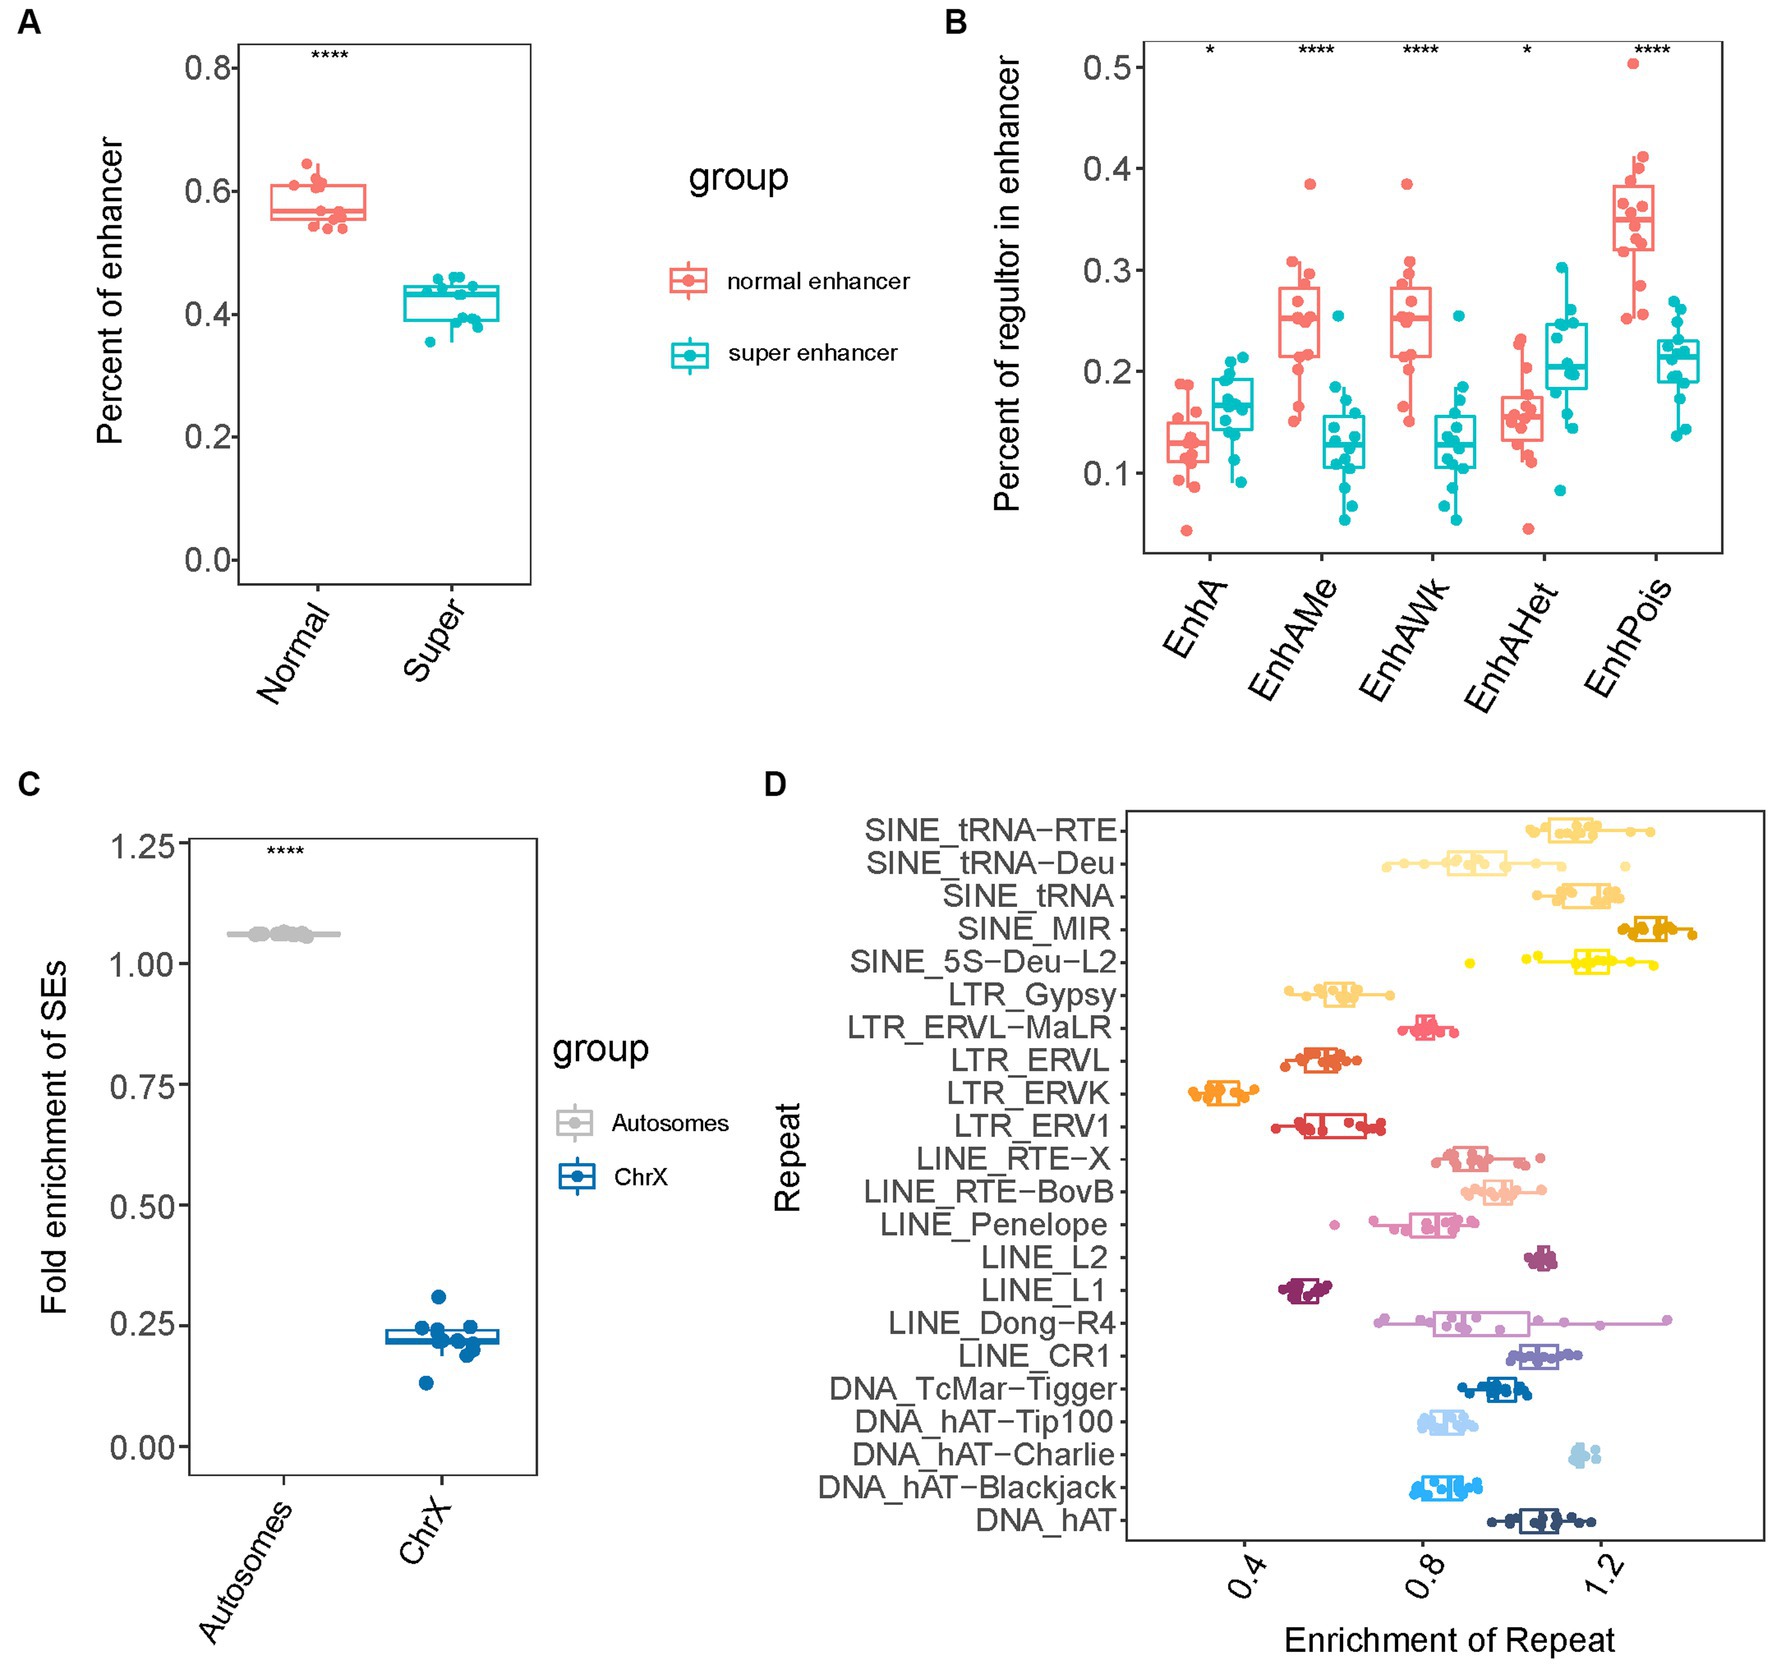
Figure 2. The composition of super-enhancers in pig. (A) The percent of enhancer in normal-enhancers and super-enhancers. (B) The percent of each of five enhancer types in super-enhancers and normal enhancers. (C) The fold enrichment of super-enhancers in autosomes and X chromosome. (D) The fold enrichment of super-enhancers in four repeat sequences types.
3.3. Influence of SEs characteristics on gene expression
To investigate the effects of SE characteristics on gene expression, we compared the expression of SEs and NEs, SEs of different lengths, and SEs at different distances to TSS. Genes regulated by SEs showed significantly higher expression, were less tissue-specific (tau), and were more conserved than those regulated by NEs (Figure 3A and Supplementary Figure S3). This finding was in agreement with previous findings in humans and chickens (50, 61). The estimation of SE size revealed that gene expression regulated by the longest SE group was significantly higher than the shortest group (Figure 3B). Furthermore, a negative correlation was evident between the proximity of SEs to their TSS and the expression levels of the target genes (Figure 3C). Gene expression in the groups with longer (i.e., T1, T5) distances to SEs was significantly lower than that in the groups with shorter (i.e., T2, T4) distances. These results suggest that SEs features influence gene expression.
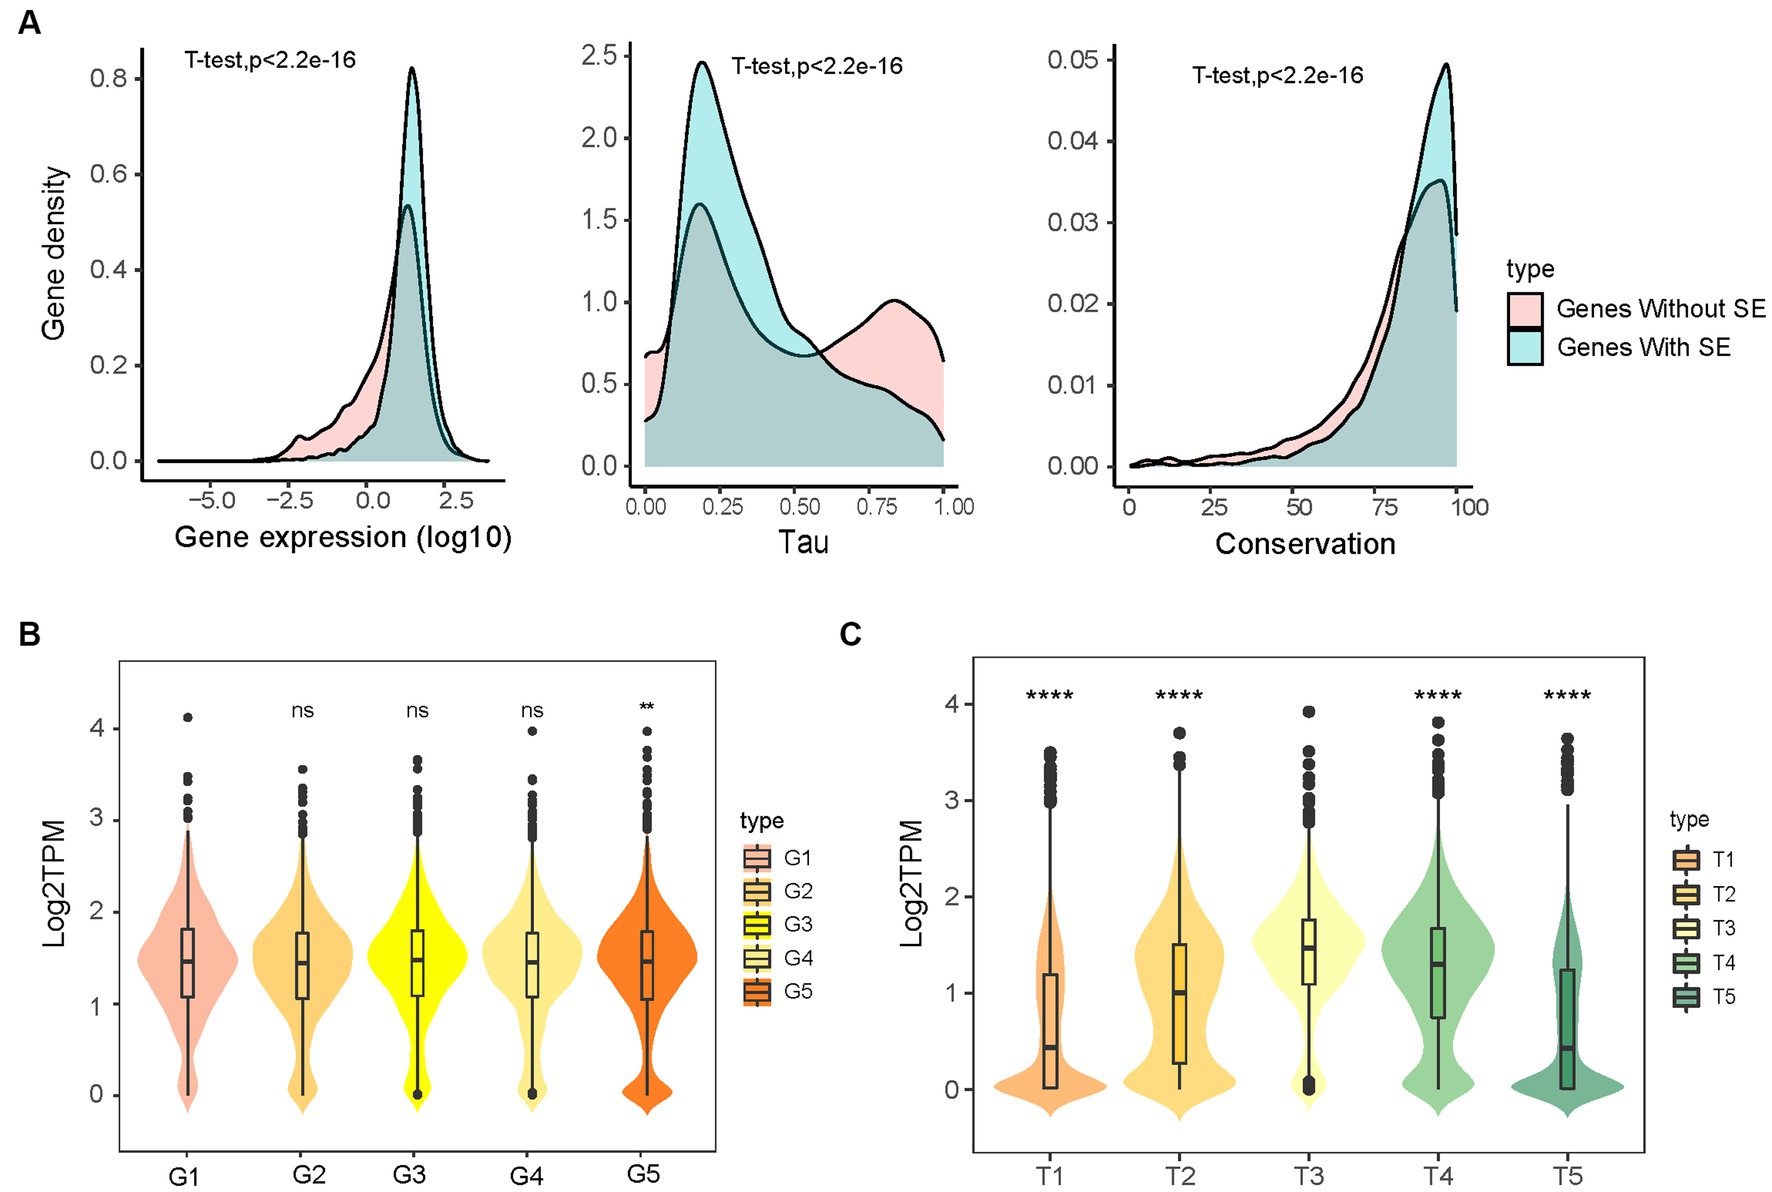
Figure 3. The gene expression influenced by super-enhancers. (A) Genes with (11,514) and without (11,886) super-enhancers differed in the expression, tau, and conservation. The gene conservation score was sequence identity (%) from pig gene to orthologous human gene. (B) The effect of SE length on the gene expression, categorized into five groups (G1–G5) based on increasing SE size. (C) The expression of genes with different distances to SEs, classified into five groups (T1–T5) based on ascending distance values: two groups of downstream genes T1 (n = 4,225) and T2 (n = 1,982), one group of genes overlapping with SEs T3 (n = 1,000), and two groups of upstream genes T4 (n = 2,688) and T5 (n = 4,244).
3.4. Tissue-specific pattern of SEs
To better understand the functions of SEs, the tissue-specific pattern of SEs was determined using GO and motif analyses. First, the SEs from the 14 tissues were merged to obtain 8,173 non-redundant SEs. Of these SEs, 27.9% (n = 2,281) were identified in one tissue and only 2.46% (n = 201) were identified in all tissues (Supplementary Figure S4). These SEs showed strong tissue-specific activity. Next, all SEs were clustered based on their activities in all 14 tissues. We found the phenomenon that some SEs were variable among tissues and revealed distinct tissue-sharing patterns for each SE cluster (Figure 4A). GO enrichment analysis of the putative target genes of these SE clusters revealed a distinct biological function of each cluster (Figure 4B). Genes targeted by SEs in C3 (Cluster 3), which are broadly active in most tissues, are involved in essential biological functions, such as homeostatic processes. SEs in C8 are specifically active in the cerebellum and their target genes are enriched in the regulation of locomotion and osmotic stress processes. SEs in C4, specific to the cerebellum, cortex, and hypothalamus, are involved in pallium development and regulation of embryonic development processes. Moreover, SEs in C1 are specifically active in intestinal tissues and correspond to phospholipid transport and glutamine family amino acid catabolic processes. SE-associated genes in C6 are specifically active in the lung and spleen and are involved in processes that include cellular responses to acid chemicals and negative regulation of blood circulation The SEs in C2 included those that were active in the lungs and spleen, in addition to those active in the intestinal tissues. The target genes of the C2 SEs are involved in lung morphogenesis, catechol-containing compound biosynthetic processes, and regulation of glucose transmembrane transport. The target genes of SEs in C5 are specifically active in the liver and were related to immune function (e.g., cellular response to cytokine stimulus). Similarly, SEs in C10 are specifically active in the cecum and are related to immune functions that include the Toll-like receptor 4 signaling pathway. SEs in C7 are specifically active in the muscle and are related to muscle activity. Finally, SEs in C9 are responsive to hormones and are specifically active in adipose tissue. Some known genes associated with SEs of each cluster are shown in Figure 4B.
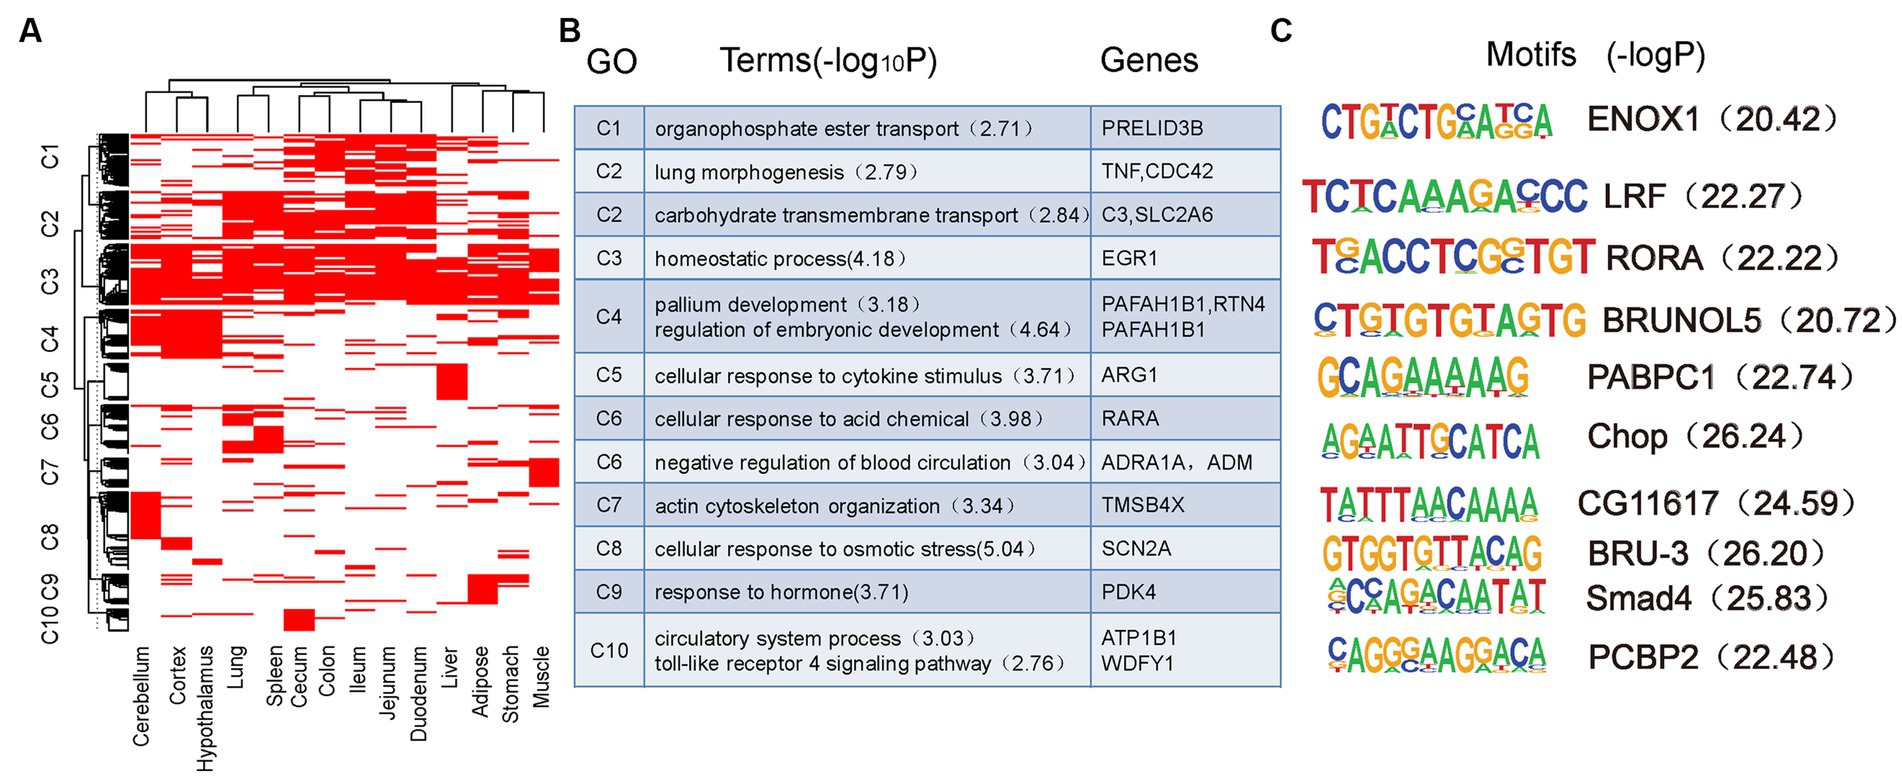
Figure 4. Tissue-specific pattern of super-enhancers. (A) Clustering of 8,173 non-redundant super-enhancers based on their activity in each tissue. (B) GO function and representative genes in each super-enhancers cluster. (C) Motifs enriched in each super-enhancers cluster.
Motif enrichment analysis was performed for each SE cluster to further confirm that these identified enhancers functioned as tissue-specific elements (Figure 4C). The BRUNOL5 motif enriched in C4 is associated with multiple brain diseases in humans (62). The PABPC1 motifs enriched in C5 playes a role in the liver (63). The LRF motif enriched in C2 contributes to gut and immune tissues (64). Smad4 enriched in C9 is important in adipogenic differentiation and has been described in human adipose tissue-derived stem cells (65). The CHOP motif enriched in C6 is related to pulmonary fibrosis and immune function in mice (66). The PCBP2 motif enriched in C10 also plays a role in immune function (67). Furthermore, we observed increased expression of genes with tissue-specific SEs in the corresponding tissues. These results demonstrate the importance of SEs in tissue specificity and function in pigs.
3.5. Tissue-specific SEs in brain and liver tissues
To further illustrate the situation of SEs, we selected the tissue-specific SEs in the brain and liver. Coronin 2B (CORO2B), a gene with brain-specific SEs, displayed obvious elevated H3K4me1 and H3K27ac signaling and gene expression in brain tissue (Figure 5A). This gene plays a prominent role in maintaining correct distribution of the cytoskeleton and neuronal migration (68). Moreover, the phenylalanine hydroxylase gene (PAH) has been linked to liver-specific SEs with strong liver-specific H3K4me1 and H3K27ac signaling (Figure 5B), showing liver-specific expression. The PAH gene is specifically expressed in the human liver and is associated with phenylketonuria (69, 70). Overall, these results suggest that tissue-specific SEs play important roles in the regulation of tissue-specific functions.
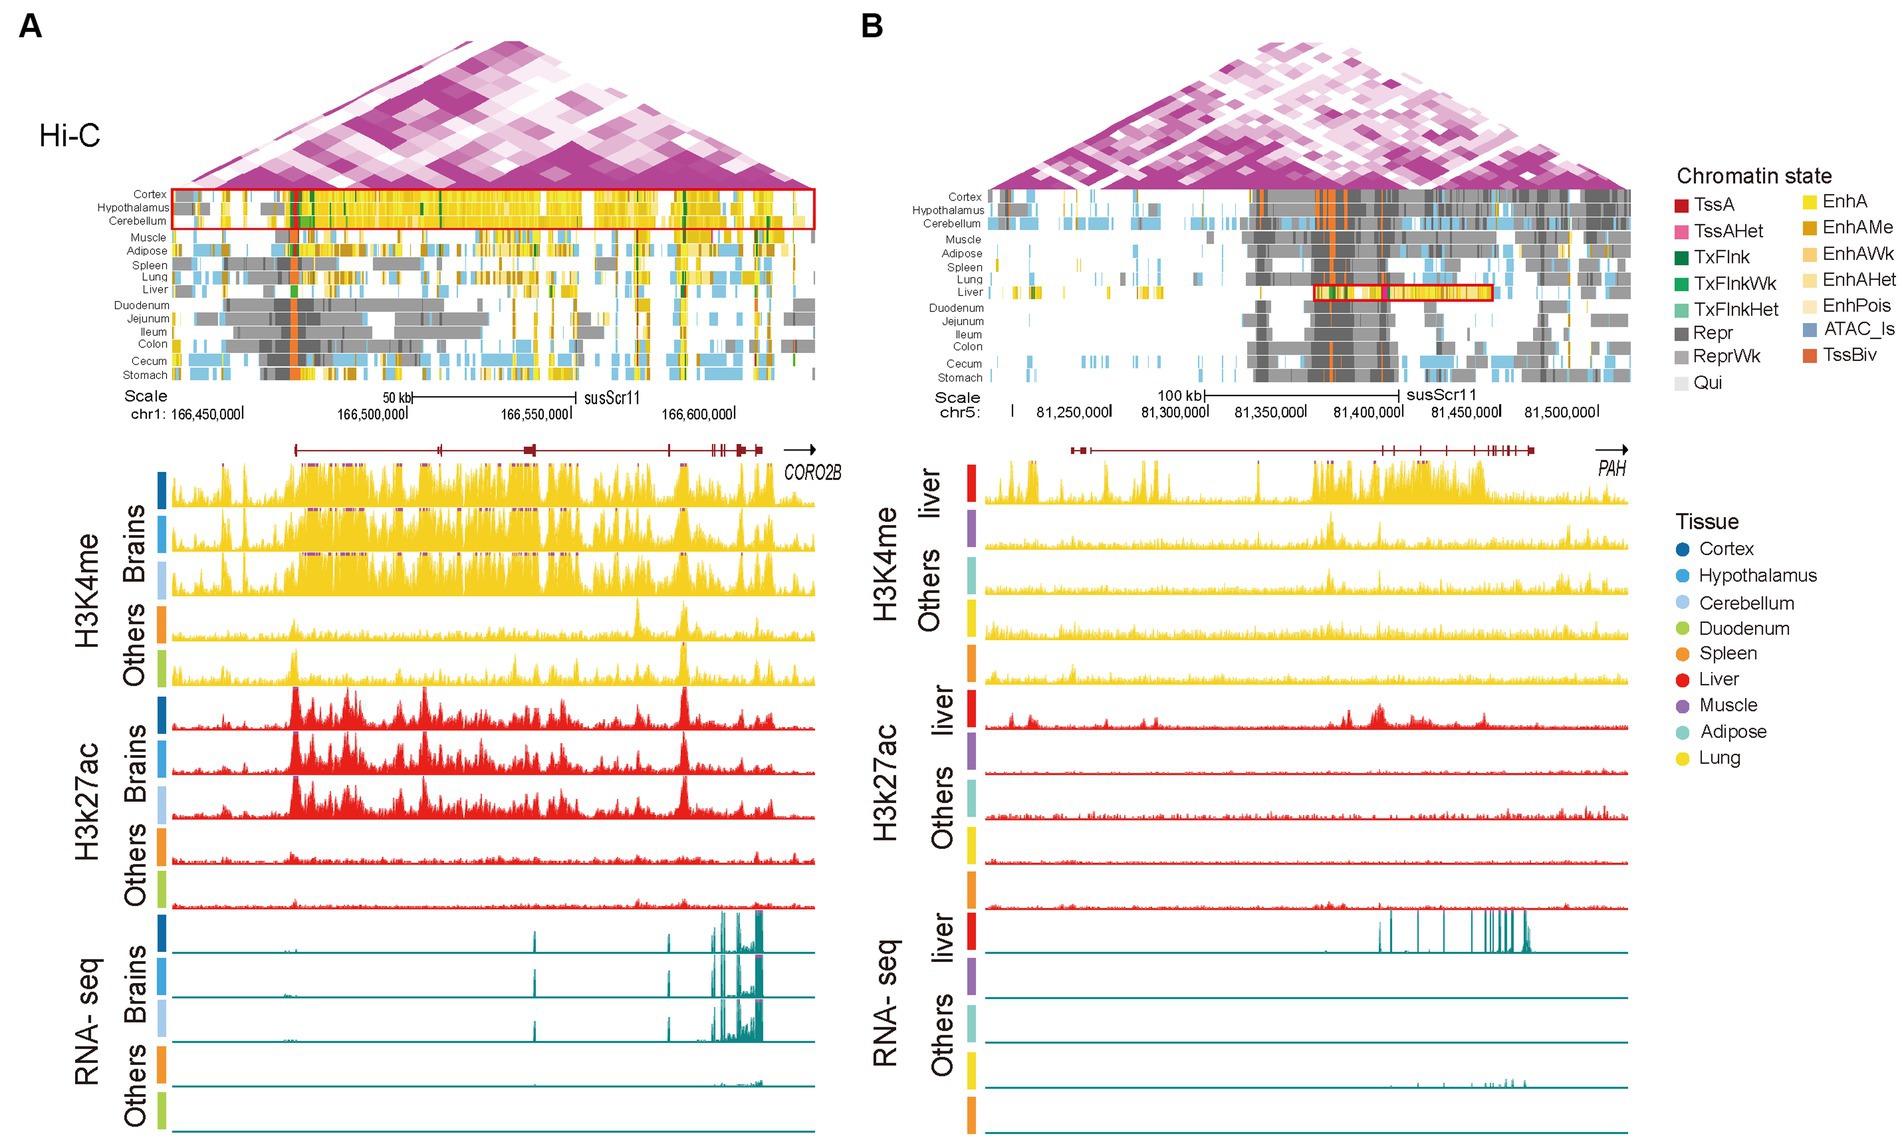
Figure 5. Super-enhancers in brain and liver tissues. (A) A brain-specific super-enhancer present at the CORO2B locus (chr1:166,239,933-167,241,533). (B) A liver-specific super-enhancer present at the PAH locus (chr5:81,236,096-81,453,790). Following sections are Hi-C, chromatin state, H3K4me1, H3K27ac, and RNA-seq. Vertical scale of UCSC tracks shows normalized signal from 0 to 100 for RNA-seq, 0 to 150 for H3K27ac, and 0 to 50 for H3K4me1. The red boxed areas are the range of SEs.
4. Discussion
SEs can be useful genetic areas for selection and breeding because selection concentrates on functional SEs (71). The pig genome sequence is publicly available, enabling the systematic discovery and characterization of SEs in this species. In the present study, we utilized ChIP-seq data labeled with H3K27ac signals and five types of enhancer annotations to identify 42,380 SEs in 14 pig tissues. We compared the features and functions of the SEs and NEs and revealed gene expression, composition, pathway enrichment, and tissue specificity of the SEs. Our findings will aid in the understanding of the regulatory environment of porcine SEs and their potential applications in genomic selection.
We explored the composition of SEs from various perspectives. Our results demonstrate that SEs are distinct from NEs in terms of the size and content of TFs and transcriptional activity. SEs were significantly larger and more likely to be enriched with the activation enhancer. Previous studies have demonstrated that contacts between the enhancers that make up these super-regulatory elements are functionally influential (72), and that individual enhancer elements within the SEs have additive or synergistic relationships (72, 73). Further studies are needed to clarify the interactions of individual enhancer elements within SEs. Moreover, we observed that SEs were seriously depleted in the X chromosome, indicating that SEs were not present on the X chromosome. This finding may be related to our data from male pigs (49). In the present study, the repeat sequences of the pig genome were mainly composed of SINEs and LINEs, followed by DNA retrotransposons and LTR transposons. This is consistent with earlier research that demonstrated a high percentage of LINE and SINE retrotransposons in repetitive sequences of mammalian genomes (74). The SINE/MIR sequences had the highest fold enrichment of SEs compared to the other repeats. This could be because SINE/MIR sequences displayed were derived from a family of ancient SINEs and are distributed among a wide range of species (60), indicating that the SEs of SINE/MIR may play important roles in species evolution.
Genes regulated by SEs were significantly more highly expressed, less tissue-specific, and more conserved than those regulated by NEs. These results are consistent with those of earlier studies in humans and chickens (50, 61). We investigated the effects of various SE features on gene expression. Our preliminary results indicated that SE length influences gene expression. According to an earlier study, the complexity of a regulatory task is correlated with an increase in enhancer length and number of TF-binding sites (75). SEs may have features similar to those of enhancers, which require further study. Additionally, we examined the relationship between the expression levels of the target genes and the distance between the SEs and the TSS. We observed that gene expression positively correlated with the proximity of SEs to TSS, indicating a proximity effect of SEs on gene regulation. Collectively, these results suggest that SE features can influence gene expression.
Clustering of all SEs based on their activities in all 14 tissues revealed that some SEs were variable among tissues and displayed distinct tissue-sharing patterns for each SE cluster. SEs are not fixed entities but are dynamic and context-dependent (76). For example, SEs are regulated genes that specify cell fate and identity by the sequential addition or removal of enhancers during differentiation (77). Therefore, the phenomenon reflects the complexity and diversity of gene regulation. GO enrichment analysis and motif analyses were performed to investigate the tissue specificity of SEs. Intestine-specific SEs were found to be involved in the circulatory system and nutrient absorption, matching the function and biology of the intestine. These SEs may play key roles in the growth and development of pigs. We also identified liver- and cecal-specific SEs that are associated with the regulation of immune function and the development and suppression of diseases such as diabetes and liver cancer (30). Pallium development is strongly correlated with the presence of brain-specific SEs. We identified a brain-specific SE in the CORO2B gene, which is important in neuronal migration in mice, and shows strong brain-specific expression (68, 78). Neuronal migration during cortical development is essential for maintaining normal brain function and structure. Impairments in neuronal migration can lead to various neurodevelopmental and neuropsychiatric disorders in humans, such as Timothy syndrome, schizophrenia, and autism spectrum disorders (79–81). Moreover, we found that PAH genes with liver-specific SEs exhibited strong liver-specific expression. The PAH gene codes for the enzyme phenylalanine hydroxylase (70). Pathogenic variants of the PAH gene can result in phenylketonuria, which causes liver dysfunction (82). The results reveal the tissue specificity of SEs and provide insights into the regulatory mechanisms of disease in pigs.
In conclusion, our analysis of SEs in the pig genome provides a body map of SEs and clarifies their features and functions. The findings will support the identification of the biological functions of particular tissues and provide a valuable resource for transcriptional regulation studies in pigs.
Data availability statement
Publicly available datasets were analyzed in this study. This data can be found at: https://www.ncbi.nlm.nih.gov/bioproject; PRJEB37735.
Ethics statement
Ethical approval was not required for the study involving animals in accordance with the local legislation and institutional requirements because raw data were downloaded from public databases.
Author contributions
YY, XL, and ZP participated in the design of the study. YY and XL carried out the analysis, interpretation of data, and initiated, drafted, and revised the manuscript. ZM wrote sections of the manuscript. YL, KQ, and MC revised the manuscript. All authors contributed to the article and approved the submitted version.
Funding
This work was supported by National Key R&D Program of China (2022YFF1000103), National Natural Science Foundation of China (31802031), Science and Technology Project of Henan Province (222102110477) and National Innovation and Entrepreneurship Training Program for College Students (202210464064).
Conflict of interest
The authors declare that the research was conducted in the absence of any commercial or financial relationships that could be construed as a potential conflict of interest.
Publisher’s note
All claims expressed in this article are solely those of the authors and do not necessarily represent those of their affiliated organizations, or those of the publisher, the editors and the reviewers. Any product that may be evaluated in this article, or claim that may be made by its manufacturer, is not guaranteed or endorsed by the publisher.
Supplementary material
The Supplementary material for this article can be found online at: https://www.frontiersin.org/articles/10.3389/fvets.2023.1239965/full#supplementary-material
Footnotes
References
1. Lebret, B, and Čandek-Potokar, M. Review: pork quality attributes from farm to fork. Part II. Processed pork products. Animal. (2022) 16:100383. doi: 10.1016/j.animal.2021.100383
2. Geilen, J, Kainz, M, Zapletal, B, Geleff, S, Wisser, W, Bohle, B, et al. Unilateral acute lung injury in pig: a promising animal model. J Transl Med. (2022) 20:548. doi: 10.1186/s12967-022-03753-5
3. Lunney, JK, Van Goor, A, Walker, KE, Hailstock, T, Franklin, J, and Dai, C. Importance of the pig as a human biomedical model. Sci Transl Med. (2021) 13:eabd5758. doi: 10.1126/scitranslmed.abd5758
4. Paudyal, B, Mwangi, W, Rijal, P, Schwartz, JC, Noble, A, Shaw, A, et al. Fc-mediated functions of porcine IgG subclasses. Front Immunol. (2022) 13:903755. doi: 10.3389/fimmu.2022.903755
5. Pagni, S, Mills, JD, Frankish, A, Mudge, JM, and Sisodiya, SM. Non-coding regulatory elements: potential roles in disease and the case of epilepsy. Neuropathol Appl Neurobiol. (2022) 48:e12775. doi: 10.1111/nan.12775
6. Gasperini, M, Tome, JM, and Shendure, J. Towards a comprehensive catalogue of validated and target-linked human enhancers. Nat Rev Genet. (2020) 21:292–310. doi: 10.1038/s41576-019-0209-0
7. Schoenfelder, S, and Fraser, P. Long-range enhancer-promoter contacts in gene expression control. Nat Rev Genet. (2019) 20:437–55. doi: 10.1038/s41576-019-0128-0
8. King, DM, Hong, CKY, Shepherdson, JL, Granas, DM, Maricque, BB, and Cohen, BA. Synthetic and genomic regulatory elements reveal aspects of cis-regulatory grammar in mouse embryonic stem cells. elife. (2020) 9:e41279. doi: 10.7554/eLife.41279
9. Yokoshi, M, Kawasaki, K, Cambon, M, and Fukaya, T. Dynamic modulation of enhancer responsiveness by core promoter elements in living drosophila embryos. Nucleic Acids Res. (2022) 50:92–107. doi: 10.1093/nar/gkab1177
10. Field, A, and Adelman, K. Evaluating enhancer function and transcription. Annu Rev Biochem. (2020) 89:213–34. doi: 10.1146/annurev-biochem-011420-095916
11. Calo, E, and Wysocka, J. Modification of enhancer chromatin: what, how, and why? Mol Cell. (2013) 49:825–37. doi: 10.1016/j.molcel.2013.01.038
12. Ilott, NE, Heward, JA, Roux, B, Tsitsiou, E, Fenwick, PS, Lenzi, L, et al. Long non-coding RNAs and enhancer RNAs regulate the lipopolysaccharide-induced inflammatory response in human monocytes. Nat Commun. (2014) 5:3979. doi: 10.1038/ncomms4979
13. Creyghton, MP, Cheng, AW, Welstead, GG, Kooistra, T, Carey, BW, Steine, EJ, et al. Histone H3K27ac separates active from poised enhancers and predicts developmental state. Proc Natl Acad Sci U S A. (2010) 107:21931–6. doi: 10.1073/pnas.1016071107
14. Visel, A, Blow, MJ, Li, Z, Zhang, T, Akiyama, JA, Holt, A, et al. ChIP-seq accurately predicts tissue-specific activity of enhancers. Nature. (2009) 457:854–8. doi: 10.1038/nature07730
15. Arner, E, Daub, CO, Vitting-Seerup, K, Andersson, R, Lilje, B, Drabløs, F, et al. Transcribed enhancers lead waves of coordinated transcription in transitioning mammalian cells. Science. (2015) 347:1010–4. doi: 10.1126/science.1259418
16. Bai, X, Shi, S, Ai, B, Jiang, Y, Liu, Y, Han, X, et al. ENdb: a manually curated database of experimentally supported enhancers for human and mouse. Nucleic Acids Res. (2020) 48:D51–7. doi: 10.1093/nar/gkz973
17. Shen, Y, Yue, F, McCleary, DF, Ye, Z, Edsall, L, Kuan, S, et al. A map of the cis-regulatory sequences in the mouse genome. Nature. (2012) 488:116–20. doi: 10.1038/nature11243
18. Singh, D, and Yi, SV. Enhancer pleiotropy, gene expression, and the architecture of human enhancer-gene interactions. Mol Biol Evol. (2021) 38:3898–909. doi: 10.1093/molbev/msab085
19. Wang, Z, Zhang, Q, Zhang, W, Lin, JR, Cai, Y, Mitra, J, et al. HEDD: human enhancer disease database. Nucleic Acids Res. (2018) 46:D113–20. doi: 10.1093/nar/gkx988
20. Farh, KK, Marson, A, Zhu, J, Kleinewietfeld, M, Housley, WJ, Beik, S, et al. Genetic and epigenetic fine mapping of causal autoimmune disease variants. Nature. (2015) 518:337–43. doi: 10.1038/nature13835
21. Ishigaki, K. Beyond GWAS: from simple associations to functional insights. Semin Immunopathol. (2022) 44:3–14. doi: 10.1007/s00281-021-00894-5
22. Willson, J. Deciphering the impact of enhancer variation. Nat Rev Genet. (2020) 21:274–5. doi: 10.1038/s41576-020-0230-3
23. Kvon, EZ, Zhu, Y, Kelman, G, Novak, CS, Plajzer-Frick, I, Kato, M, et al. Comprehensive in vivo interrogation reveals phenotypic impact of human enhancer variants. Cells. (2020) 180:1262–1271.e15. doi: 10.1016/j.cell.2020.02.031
24. Zaugg, JB, Sahlén, P, Andersson, R, Alberich-Jorda, M, de Laat, W, Deplancke, B, et al. Current challenges in understanding the role of enhancers in disease. Nat Struct Mol Biol. (2022) 29:1148–58. doi: 10.1038/s41594-022-00896-3
25. Peng, Y, and Zhang, Y. Enhancer and super-enhancer: positive regulators in gene transcription. Animal Model Exp Med. (2018) 1:169–79. doi: 10.1002/ame2.12032
26. Wang, X, Cairns, MJ, and Yan, J. Super-enhancers in transcriptional regulation and genome organization. Nucleic Acids Res. (2019) 47:11481–96. doi: 10.1093/nar/gkz1038
27. Zhang, J, Yue, W, Zhou, Y, Liao, M, Chen, X, and Hua, J. Super enhancers-functional cores under the 3D genome. Cell Prolif. (2021) 54:e12970. doi: 10.1111/cpr.12970
28. Cheng, H, Dou, X, and Han, JD. Understanding super-enhancers. Sci China Life Sci. (2016) 59:277–80. doi: 10.1007/s11427-016-5028-3
29. Tang, F, Yang, Z, Tan, Y, and Li, Y. Super-enhancer function and its application in cancer targeted therapy. NPJ Precis Oncol. (2020) 4:2. doi: 10.1038/s41698-020-0108-z
30. Hnisz, D, Abraham, BJ, Lee, TI, Lau, A, Saint-André, V, Sigova, AA, et al. Super-enhancers in the control of cell identity and disease. Cells. (2013) 155:934–47. doi: 10.1016/j.cell.2013.09.053
31. Xiao, Q, Xiao, Y, Li, LY, Chen, MK, and Wu, M. Multifaceted regulation of enhancers in cancer. Biochim Biophys Acta Gene Regul Mech. (2022) 1865:194839. doi: 10.1016/j.bbagrm.2022.194839
32. Li, Y, Rivera, CM, Ishii, H, Jin, F, Selvaraj, S, Lee, AY, et al. CRISPR reveals a distal super-enhancer required for Sox2 expression in mouse embryonic stem cells. PLoS One. (2014) 9:e114485. doi: 10.1371/journal.pone.0114485
33. Zhang, J, Zhou, Y, Yue, W, Zhu, Z, Wu, X, Yu, S, et al. Super-enhancers conserved within placental mammals maintain stem cell pluripotency. Proc Natl Acad Sci U S A. (2022) 119:e2204716119. doi: 10.1073/pnas.2204716119
34. Bian, F, Daghsni, M, Lu, F, Liu, S, Gross, JM, and Aldiri, I. Functional analysis of the Vsx2 super-enhancer uncovers distinct cis-regulatory circuits controlling Vsx2 expression during retinogenesis. Development. (2022) 149:dev200642. doi: 10.1242/dev.200642
35. Liu, Q, Guo, L, Lou, Z, Xiang, X, and Shao, J. Super-enhancers and novel therapeutic targets in colorectal cancer. Cell Death Dis. (2022) 13:228. doi: 10.1038/s41419-022-04673-4
36. Thandapani, P. Super-enhancers in cancer. Pharmacol Ther. (2019) 199:129–38. doi: 10.1016/j.pharmthera.2019.02.014
37. Zhuang, HH, Qu, Q, Teng, XQ, Dai, YH, and Qu, J. Superenhancers as master gene regulators and novel therapeutic targets in brain tumors. Exp Mol Med. (2023) 55:290–303. doi: 10.1038/s12276-023-00934-0
38. Lakhia, R, Mishra, A, Biggers, L, Malladi, V, Cobo-Stark, P, Hajarnis, S, et al. Enhancer and super-enhancer landscape in polycystic kidney disease. Kidney Int. (2023) 103:87–99. doi: 10.1016/j.kint.2022.08.039
39. Liu, M, Cao, S, He, L, Gao, J, Arab, JP, Cui, H, et al. Super enhancer regulation of cytokine-induced chemokine production in alcoholic hepatitis. Nat Commun. (2021) 12:4560. doi: 10.1038/s41467-021-24843-w
40. Gong, J, Qiu, C, Huang, D, Zhang, Y, Yu, S, and Zeng, C. Integrative functional analysis of super enhancer SNPs for coronary artery disease. J Hum Genet. (2018) 63:627–38. doi: 10.1038/s10038-018-0422-2
41. Sun, W, Yao, S, Tang, J, Liu, S, Chen, J, Deng, D, et al. Integrative analysis of super enhancer SNPs for type 2 diabetes. PLoS One. (2018) 13:e0192105. doi: 10.1371/journal.pone.0192105
42. Wang, Y, Song, C, Zhao, J, Zhang, Y, Zhao, X, Feng, C, et al. SEdb 2.0: a comprehensive super-enhancer database of human and mouse. Nucleic Acids Res. (2023) 51:D280–90. doi: 10.1093/nar/gkac968
43. Sun, H, Liao, Y, Wang, Z, Zhang, Z, Oyelami, FO, Olasege, BS, et al. ETph: enhancers and their targets in pig and human database. Anim Genet. (2020) 51:311–3. doi: 10.1111/age.12893
44. Hu, M, Kuang, R, Guo, Y, Ma, R, Hou, Y, Xu, Y, et al. Epigenomics analysis of miRNA cis-regulatory elements in pig muscle and fat tissues. Genomics. (2022) 114:110276. doi: 10.1016/j.ygeno.2022.110276
45. Peng, Y, Kang, H, Luo, J, and Zhang, Y. A comparative analysis of super-enhancers and broad H3K4me3 domains in pig, human, and mouse tissues. Front Genet. (2021) 12:701049. doi: 10.3389/fgene.2021.701049
46. Zhang, Y, Zhang, J, Wang, C, Dai, H, du, X, Li, Q, et al. The super-enhancer repertoire in porcine liver. J Anim Sci. (2023) 101:skad056. doi: 10.1093/jas/skad056
47. Zhou, Z, Jiang, T, Zhu, Y, Ling, Z, Yang, B, and Huang, L. A comparative investigation on H3K27ac enhancer activities in the brain and liver tissues between wild boars and domesticated pigs. Evol Appl. (2022) 15:1281–90. doi: 10.1111/eva.13461
48. Whyte, WA, Orlando, DA, Hnisz, D, Abraham, BJ, Lin, CY, Kagey, MH, et al. Master transcription factors and mediator establish super-enhancers at key cell identity genes. Cells. (2013) 153:307–19. doi: 10.1016/j.cell.2013.03.035
49. Pan, Z, Yao, Y, Yin, H, Cai, Z, Wang, Y, Bai, L, et al. Pig genome functional annotation enhances the biological interpretation of complex traits and human disease. Nat Commun. (2021) 12:5848. doi: 10.1038/s41467-021-26153-7
50. Pan, Z, Wang, Y, Wang, M, Wang, Y, Zhu, X, Gu, S, et al. An atlas of regulatory elements in chicken: a resource for chicken genetics and genomics. Sci Adv. (2023) 9:eade1204. doi: 10.1126/sciadv.ade1204
51. Gu, Z, Eils, R, and Schlesner, M. Complex heatmaps reveal patterns and correlations in multidimensional genomic data. Bioinformatics. (2016) 32:2847–9. doi: 10.1093/bioinformatics/btw313
52. Ernst, J, and Kellis, M. ChromHMM: automating chromatin-state discovery and characterization. Nat Methods. (2012) 9:215–6. doi: 10.1038/nmeth.1906
53. Quinlan, AR, and Hall, IM. BEDTools: a flexible suite of utilities for comparing genomic features. Bioinformatics. (2010) 26:841–2. doi: 10.1093/bioinformatics/btq033
54. Tarailo-Graovac, M, and Chen, N. Using RepeatMasker to identify repetitive elements in genomic sequences. Curr Protoc Bioinformatics. (2009) 4. doi: 10.1002/0471250953.bi0410s25
55. du, Z, D’Alessandro, E, Asare, E, Zheng, Y, Wang, M, Chen, C, et al. Retrotransposon insertion polymorphisms (RIPs) in pig reproductive candidate genes. Genes (Basel). (2022) 13:1359. doi: 10.3390/genes13081359
56. Schumann, GG, Gogvadze, EV, Osanai-Futahashi, M, Kuroki, A, Münk, C, Fujiwara, H, et al. Unique functions of repetitive transcriptomes. Int Rev Cell Mol Biol. (2010) 285:115–88. doi: 10.1016/B978-0-12-381047-2.00003-7
57. Pott, S, and Lieb, JD. What are super-enhancers? Nat Genet. (2015) 47:8–12. doi: 10.1038/ng.3167
58. Faulkner, GJ, Kimura, Y, Daub, CO, Wani, S, Plessy, C, Irvine, KM, et al. The regulated retrotransposon transcriptome of mammalian cells. Nat Genet. (2009) 41:563–71. doi: 10.1038/ng.368
59. Margulies, EH, NISC Comparative Sequencing Program‡, Maduro, VV, Thomas, PJ, Tomkins, JP, Amemiya, CT, et al. Comparative sequencing provides insights about the structure and conservation of marsupial and monotreme genomes. Proc Natl Acad Sci U S A. (2005) 102:3354–9. doi: 10.1073/pnas.0408539102
60. Nishihara, H, Smit, AF, and Okada, N. Functional noncoding sequences derived from SINEs in the mammalian genome. Genome Res. (2006) 16:864–74. doi: 10.1101/gr.5255506
61. van Groningen, T, Koster, J, Valentijn, LJ, Zwijnenburg, DA, Akogul, N, Hasselt, NE, et al. Neuroblastoma is composed of two super-enhancer-associated differentiation states. Nat Genet. (2017) 49:1261–6. doi: 10.1038/ng.3899
62. McKetney, J, Runde, RM, Hebert, AS, Salamat, S, Roy, S, and Coon, JJ. Proteomic atlas of the human brain in Alzheimer’s disease. J Proteome Res. (2019) 18:1380–91. doi: 10.1021/acs.jproteome.9b00004
63. YuFeng, Z, and Ming, Q. Expression and prognostic roles of PABPC1 in hepatocellular carcinoma. Int J Surg. (2020) 84:3–12. doi: 10.1016/j.ijsu.2020.10.004
64. Nie, J, Carpenter, AC, Chopp, LB, Chen, T, Balmaceno-Criss, M, Ciucci, T, et al. The transcription factor LRF promotes integrin β7 expression by and gut homing of CD8αα+ intraepithelial lymphocyte precursors. Nat Immunol. (2022) 23:594–604. doi: 10.1038/s41590-022-01161-x
65. Park, JS, Kim, M, Song, NJ, Kim, JH, Seo, D, Lee, JH, et al. A reciprocal role of the Smad4-Taz axis in osteogenesis and adipogenesis of mesenchymal stem cells. Stem Cells. (2019) 37:368–81. doi: 10.1002/stem.2949
66. Yao, Y, Wang, Y, Zhang, Z, He, L, Zhu, J, Zhang, M, et al. Chop deficiency protects mice against bleomycin-induced pulmonary fibrosis by attenuating M2 macrophage production. Mol Ther. (2016) 24:915–25. doi: 10.1038/mt.2016.36
67. Gu, H, Yang, J, Zhang, J, Song, Y, Zhang, Y, Xu, P, et al. PCBP2 maintains antiviral signaling homeostasis by regulating cGAS enzymatic activity via antagonizing its condensation. Nat Commun. (2022) 13:1564. doi: 10.1038/s41467-022-29266-9
68. Chen, Y, Xu, Z, Chen, J, Qiu, Y, Yuan, L, Liu, P, et al. Coronin 2B regulates neuronal migration via Rac1-dependent multipolar-bipolar transition. J Neurosci. (2023) 43:211–20. doi: 10.1523/JNEUROSCI.1087-22.2022
69. Manek, R, Zhang, YV, Berthelette, P, Hossain, M, Cornell, CS, Gans, J, et al. Blood phenylalanine reduction reverses gene expression changes observed in a mouse model of phenylketonuria. Sci Rep. (2021) 11:22886. doi: 10.1038/s41598-021-02267-2
70. Oussalah, A, Jeannesson-Thivisol, E, Chéry, C, Perrin, P, Rouyer, P, Josse, T, et al. Population and evolutionary genetics of the PAH locus to uncover overdominance and adaptive mechanisms in phenylketonuria: results from a multiethnic study. EBioMedicine. (2020) 51:102623. doi: 10.1016/j.ebiom.2019.102623
71. Zhang, Y, Zhang, J, Wang, C, Qin, X, Zhang, Y, Liu, J, et al. Effective quality breeding directions-comparison and conservative analysis of hepatic super-enhancers between Chinese and Western pig breeds. Biology (Basel). (2022) 11:11. doi: 10.3390/biology11111631
72. Proudhon, C, Snetkova, V, Raviram, R, Lobry, C, Badri, S, Jiang, T, et al. Active and inactive enhancers cooperate to exert localized and long-range control of gene regulation. Cell Rep. (2016) 15:2159–69. doi: 10.1016/j.celrep.2016.04.087
73. Hay, D, Hughes, JR, Babbs, C, Davies, JOJ, Graham, BJ, Hanssen, L, et al. Genetic dissection of the alpha-globin super-enhancer in vivo. Nat Genet. (2016) 48:895–903. doi: 10.1038/ng.3605
74. RNN, P, Vandewege, MW, and Ray, DA. Mammalian transposable elements and their impacts on genome evolution. Chromosom Res. (2018) 26:25–43. doi: 10.1007/s10577-017-9570-z
75. Li, L, and Wunderlich, Z. An enhancer’s length and composition are shaped by its regulatory task. Front Genet. (2017) 8:63. doi: 10.3389/fgene.2017.00063
76. Tsankov, AM, Gu, H, Akopian, V, Ziller, MJ, Donaghey, J, Amit, I, et al. Transcription factor binding dynamics during human ES cell differentiation. Nature. (2015) 518:344–9. doi: 10.1038/nature14233
77. Kai, Y, Li, BE, Zhu, M, Li, GY, Chen, F, Han, Y, et al. Mapping the evolving landscape of super-enhancers during cell differentiation. Genome Biol. (2021) 22:269. doi: 10.1186/s13059-021-02485-x
78. Chen, Y, Xu, J, Zhang, Y, Ma, S, Yi, W, Liu, S, et al. Coronin 2B regulates dendrite outgrowth by modulating actin dynamics. FEBS Lett. (2020) 594:2975–87. doi: 10.1002/1873-3468.13886
79. Birey, F, Li, MY, Gordon, A, Thete, MV, Valencia, AM, Revah, O, et al. Dissecting the molecular basis of human interneuron migration in forebrain assembloids from Timothy syndrome. Cell Stem Cell. (2022) 29:248–264.e7. doi: 10.1016/j.stem.2021.11.011
80. Muraki, K, and Tanigaki, K. Neuronal migration abnormalities and its possible implications for schizophrenia. Front Neurosci. (2015) 9:74. doi: 10.3389/fnins.2015.00074
81. Pan, YH, Wu, N, and Yuan, XB. Toward a better understanding of neuronal migration deficits in autism spectrum disorders. Front Cell Dev Biol. (2019) 7:205. doi: 10.3389/fcell.2019.00205
Keywords: super-enhancers, pig, features, tissue-specific, function
Citation: Yang Y, Li X, Meng Z, Liu Y, Qian K, Chu M and Pan Z (2023) A body map of super-enhancers and their function in pig. Front. Vet. Sci. 10:1239965. doi: 10.3389/fvets.2023.1239965
Edited by:
Jiuzhou Song, University of Maryland, College Park, United StatesCopyright © 2023 Yang, Li, Meng, Liu, Qian, Chu and Pan. This is an open-access article distributed under the terms of the Creative Commons Attribution License (CC BY). The use, distribution or reproduction in other forums is permitted, provided the original author(s) and the copyright owner(s) are credited and that the original publication in this journal is cited, in accordance with accepted academic practice. No use, distribution or reproduction is permitted which does not comply with these terms.
*Correspondence: Mingxing Chu, bXhjaHVAMjYzLm5ldA==; Zhangyuan Pan, emh5cGFuMDFAMTYzLmNvbQ==
†These authors have contributed equally to this work and share first authorship