 Jingneng Wang1†
 Hui Zhang
 Yongsong Zhou
- 1Shanghai Xiongtu Biotechnology Co., Ltd., Shanghai, China
- 2Jiangsu Agri-Animal Husbandry Vocational College, Taizhou, China
- 3Institute of Food Safety and Nutrition, Jiangsu Academy of Agricultural Sciences, Nanjing, China
Deoxynivalenol (DON) contamination of food crops and feeds is almost impossible to avoid completely; however, through best management practices, this risk can be effectively managed and maximumly mitigated. Accurate and rapid detection of DON contamination as early in the entire value chain as possible is critical. To achieve this goal, we developed a DON test strip based on time-resolved fluorescence immunoassay (TRFIA) and a specific DON monoclonal antibody for the rapid quantification of DON in food crops and feeds. The strip displayed a good linearity (R2 = 0.9926), with a limit of quantification of 28.16 μg/kg, a wide linear range of 50 ~ 10,000 μg/kg. The intra-batch coefficient of variation (CV) and the inter-batch CV was <5.00 and 6.60%, respectively. This TRFIA-DON test strip was applied to detect DON in real samples, and the accuracy and reliability were confirmed by liquid chromatography-mass spectrometry (LC-MS/MS). Results showed that the relative standard deviation between the DON strips and LC-MS/MS was <9%. The recovery rates in corn samples ranged from 92 to 104%. The established TRFIA-DON test strip had the characteristics of high sensitivity, high accuracy, and a wide linear range which was suitable for rapid and quantitative determination of DON in food crops and feeds at both on-site and laboratory.
1. Introduction
Deoxynivalenol (DON) is one of the five most important mycotoxins in agriculture (1), and it is also the most widely distributed toxin with the highest contamination level among the trichothecenes (2). Although the toxicity of DON is relatively less than other mycotoxins, it remains a primary concern in many countries because DON can not only cause major economic losses to animal husbandry, but also seriously endanger human and animal health. DON is most harmful to pigs, followed by rodents, dogs, cats, poultry, and ruminants (3). Because DON is harmful to almost all animals, many countries have established the tolerable limit standard of DON in animal feed. The recommended levels of DON in animal feed are ranged from 0.9 to 12 mg/kg by regulatory public agencies worldwide (4). Mycotoxins such as DON are estimated to cause billions of dollars in economic losses in both China and the United States each year (5, 6). The USA, India and China have reported acute vomiting in humans due to ingest foods contaminated with DON (7). In the face of DON, the biggest problem is not that it is widespread in food crop and animal feed (8, 9), but that we have not found an effective method to mitigate it until now (10). In addition, the harmful effects are becoming worse and worse because of climate change (1, 11). DON contamination cannot be completely avoided (12), and there is no ideal detoxification strategy, therefore, it is particularly important to detect DON as early as possible.
Mycotoxin analytical methods can be artificially divided into three broad categories: immunobased, direct, and indirect (12). Of the three categories, antibody-based immunoassay such as enzyme-linked immunosorbent assay (13, 14), fluorescence polarization immunoassay (15, 16), and surface plasmon resonance (17) are probably the most commonly used method. The direct methods are usually the most accurate which include liquid chromatography-mass spectrometry (LC-MS/MS) (18), gas chromatography-mass spectrometry (19), and high-performance liquid chromatography (20, 21). Indirect testing methods, including near infrared spectroscopy (22), mid-infrared spectroscopy (23), and hyperspectral imaging (24), rely on other characteristics to infer the presence or absence of mycotoxins. They are not ideal methods when considered in terms of the speed of detection, the cost and performance. For example, direct methods are most precise and accurate, but also the most expensive; the speed and cost of gold immunochromatography assay (GICA) is acceptable, but it is not accurate enough.
Since the identification of DON in 1970's (25), researchers have been working hard to develop an accurate, rapid, and cost-effective testing method, however, the success remains elusive (1). Therefore, we try to develop a time-resolved immunochromatographic strip for rapid and quantitative determination of deoxynivalenol. Time-resolved fluorescence immunoassay (TRFIA) is a promising analytical method because of its high specificity, high sensitivity, and low cost. Recently, a lot of analytical methods based on TRFIA to detect DON, zearalenone, fumonisin, aflatoxin, ochratoxin A, and T-2 toxin in cereals and feed were developed and applied (6, 26–32). However, as far as DON detection is concerned, the existing TRFIA-based test strips cannot meet the needs of industrial applications either in terms of their sensitivity or accuracy.
In order to improve the sensitivity and accuracy of the test strip, we combined time-resolved fluorescence with immunochromatography and established a TRFIA strip for the rapid testing and quantification of DON. First, time-resolved fluorescent microspheres were used to label highly specific DON antibodies. Then, the key experimental parameters affecting the performance of the strip were optimized. Thirdly, the sensitivity, accuracy, specificity, and stability of the strip were evaluated. Finally, the performance of the TRFIA-DON strip was compared with that of LC-MS/MS. The TRFIA-DON strip developed in this study can be used for rapid and quantitative detection of DON contamination in food crops and feeds.
2. Materials and methods
2.1. Reagents and materials
Bovine serum albumin (BSA), N-hydroxysuccinimide (NHS, 0.5 mg/mL), and 1-(3-dimethylaminopropyl)-3-ethylcarbonimide hydrochloride (EDC, 0.5 mg/mL) were obtained from Sigma-Aldrich (St. Louis, Missouri, MO, USA). Methanol, sucrose, sodium chloride and other chemical reagents were purchased from Sinopharm Chemical Reagent Co., Ltd. (Shanghai China). Quality control material DON in maize was purchased from Academy of National Food and Strategic Reserves Administration (1,410 ± 110 μg/kg, GBW(E) 100383, Beijing China). DON solution was purchased from ANPEL Laboratory Technologies, Inc. (Shanghai China). Europium Chelate Microspheres and Fluoro-Max Fluorescent Carboxylate-Modified Particles (europium chelate PS-COOH; nominal diameter, 200 nm; m/v, 1%) were purchased from Bangs Laboratories, Inc. (Fishers, IN, USA) and Thermo Fisher Scientific, Inc. (Waltham, MA, USA), respectively. The DON monoclonal antibody, DON antigen, polyvinyl chloride (PVC) board, nitrocellulose (NC) membrane, absorbent pad, and glass cellulose membrane were purchased from Yangzhou Keneng Biotechnology Co., Ltd. (Yangzhou, Jiangsu, China). The solutions used to pretreat the conjugate pad, activate the microspheres (0.05 mol/L 2-(N-morpholino) ethanesulfonic acid, pH 6.0), dilute the microspheres (0.05 mol/L Tris, pH8.0, containing 10% sucrose, 0.05% Procline 300), and preserve the microsphere-antibody conjugate (0.05 mol/L Tris, pH8.0, containing 10% trehalose, 1% BSA, 0.05% Procline 300) were purchased from Shanghai Xiongtu Biotechnology Co., Ltd. (Shanghai China). The sample extracting solution is a mixture of acetonitrile, deionized water, and acetic acid (v/v, 70:29.5:0.5). The acetonitrile and acetic acid were purchased from Yangzhou Keneng Biotechnology.
2.2. Principal instruments
The portable TRFIA analyzer (XT8201A) and the thermostatic incubator (XT8202A) for test strips were purchased from Shanghai Xiongtu Biotechnology. The HGS510 dispense system, the guillotine cutter, ultrasonic instrument, and high-speed refrigerated centrifuge were purchased from Yangzhou Keneng Biotechnology. The LC-MS/MS instrument was manufactured by Waters Co., (Milford, MA, USA).
2.3. Labeling of mouse anti-DON antibody by fluorescent microspheres
Activation solution of microspheres (900 μL) and 100 μL of fluorescent microspheres were placed in a 2 mL centrifuge tube and mixed by ultrasound machine. Then 40 μL of NHS-EDC (v/v, 1:1) solution were added to the centrifuge tube and placed at room temperature for 40 min in a dark place. The obtained mixture was centrifuged at 14,000 r/min for 20 min to discard the supernatant. Subsequently, 500 μL of boric acid buffer and 50 μL of DON monoclonal antibody were added to the precipitate and vortexed for 1 min. The antibody and microsphere mixtures were incubated at room temperature for 2 h in a dark place. Next, 500 μL of blocking solution were added and reacted at room temperature for 60 min. The mixture was centrifuged at 14,000 r/min for 20 min to discard the supernatant. Finally, the precipitate was redissolved by adding 1 mL of microsphere-antibody conjugate preservation solution and stored at 4°C.
2.4. Assembly of TRFIA-DON test strip
Firstly, an NC membrane was affixed to the PVC board. Then, 0.2 mg/mL goat anti-mouse IgG and 0.25 mg/mL DON antigen were sprayed onto the NC membrane as a C line and a T line, respectively. The NC-PVC board was placed in a drying oven to dry at 37°C overnight. The microsphere-antibody conjugate was diluted 40 times with diluent and sprayed on the glass cellulose membrane as a conjugate pad. The conjugate pad was placed in a drying oven to dry at 37°C overnight. As shown in Figure 1, the absorbent pad, conjugate pad, and sample pad were assembled in turn. After the assembly was completed, the assembled board was cut into a 4 mm wide strip with the guillotine cutter. The 4 mm wide strip was placed into a plastic card to produce a DON test strip. DON test strips were sealed in a dark plastic bag and stored at 4°C for further experiments.
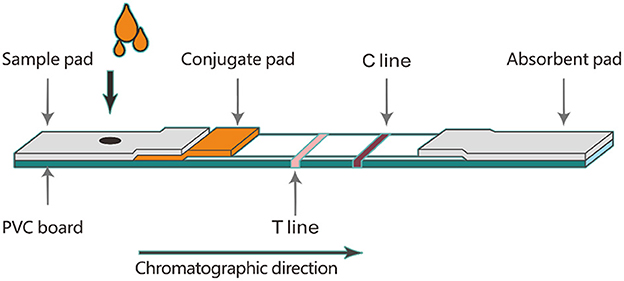
Figure 1. Assembly diagram of time-resolved fluorescence immunoassay test strip.
2.5. Screening the optimal ratio of microspheres and antibodies
Two different brands of microspheres (100 μL each) were coupled with different amounts of DON monoclonal antibody. The ratios of microspheres to antibodies were 8:1, 4:1 and 1:1, respectively. Each microsphere-antibody conjugate was diluted 40 times and sprayed on the conjugate pad. When the conjugate pad was dried at 37°C overnight, assemble the TRFIA-DON test strip according to the process shown in Figure 1. To screen the optimal ratio of microspheres and antibodies, 100 μL of boric acid buffer (0.2 M, pH 7.5) were added to the sample well of TRFIA-DON test strip and detected by portable TRFIA analyzer. The test was repeated three times for each strip with different ratios of microspheres and antibodies. The optimal microsphere-antibody combination was selected by comparing the intensity and stability of the fluorescence signal values.
2.6. Screening of pretreatment solution for conjugate pad
Five different conjugate pad pre-treatment solutions (CPPS), numbered CPPS-A, CPPS-B, CPPS-C, CPPS-D and CPPS-E, were sprayed on five different glass cellulose membranes. The pre-treated glass cellulose membranes were dried at 37°C overnight, and then the microsphere-antibody conjugates were sprayed on them. The portable TRFIA analyzer was used to detect the fluorescence signal values of T and C lines for each test strip.
2.7. NC membrane drying time
Three NC membranes were taken and dried for 12, 24 and 48 h, respectively. These NC membranes were then used to assemble TRFIA-DON test strips. The fluorescence signal values of T and C lines of the sample with DON concentration of 0, 100, 1,000, 2,000, 5,000 and 10,000 μg/kg were determined and the T/C ratios were calculated.
2.8. Screening of microsphere diluents
Six different microsphere diluents (#1, #2, #3, #4, #5 and #6) were used to dilute the same microsphere-antibody conjugate, respectively. The volume ratio of diluent to microsphere-antibody conjugate was 40:1. The microsphere-antibody conjugates diluted with different diluents were sprayed on the conjugate pad, and then the TRFIA-DON test strips were prepared according to the steps shown in Figure 1. These strips were stored at 4 and 37 C for 21 days. The T-line and C-line fluorescence signal values of these strips were measured on day 0, day 3, day 6, day 9, day 12, day 15, day 18, and day 21, respectively.
2.9. Establishment of a standard curve
DON standard solution was prepared into working solution with concentrations of 20, 50, 100, 300, 700, 1,500, 3,000, 5,000, 8,000, and 12,000 μg/kg, respectively. Working solution (100 μL) and 600 μL of boric acid buffer (0.2 M, pH 7.5) were placed in a 2 mL centrifuge tube and thoroughly mixed. Then, 100 μL of mixtures were tested and recorded the T-line and C-line fluorescence signal values. Four Parameter Logistic Regression was used to draw the standard curve for quantitative determination of DON. The X-axis and Y-axis were represented by the natural logarithm of each working solution concentration and the ratio of T/C value corresponding to each concentration to T0/C0 value of 3.62 μg/kg a natural maize sample, respectively. The concentration of DON in the natural maize sample was determined by the LC-MS/MS method (GB 5009.111-2016) (33). First, the T and C values of DON standard solutions with different concentrations were measured with DON test strips, and the T/C values of each concentration point were calculated. Then, T and C values of a natural maize sample was measured with DON test strips, and T/C value of the natural maize sample was calculated, which was defined as T0/C0 value. Finally, the T/C value at each concentration point was divided by the T0/C0 value as the Y-axis value.
2.10. Sample pretreatment and testing
First, the sample to be tested was thoroughly mixed, and 1.00 g was placed in a 10 mL centrifuge tube, and then 5 mL sample extracting solutions were added to the centrifuge tube. The centrifuge tube was vortexed for 5 min, and centrifuged at 4,000 r/min for 2 min. Then, 100 μL of supernatant and 600 μL of boric acid buffer (0.2 M, pH 7.5) were taken and placed into 2 mL centrifuge tube. Subsequently, 100 μL of mixtures were dripped into the sample well of TRFIA-DON test strip. The TRFIA-DON test strip was placed on a thermostatic incubator and incubated at 37 °C for 6 min. After the incubation reaction was complete, the TRFIA-DON test strip was immediately inserted into the portable TRFIA analyzer. The fluorescence signal values of T-line and C-line were measured and the concentration of DON in sample was automatically calculated by the TRFIA instrument.
2.11. Determination of DON by LC-MS/MS
The concentration of DON in the sample was determined by the LC-MS/MS method. For details, refer to the National Standards of the People's Republic of China (GB/T 30956–2014, GB 5009.111-2016) (33, 34).
2.12. Evaluation the performance of TRFIA-DON test strip
2.12.1. Sensitivity
A total of 20 negative samples were test by the prepared TRFIA-DON test strips, and then the mass concentration was calculated. The standard deviation (SD) and average (X) were obtained. The limit of quantification (LOQ) of the test strip was calculated as the following formula: LOQ = X + 10 SD.
2.12.2. Precision
DON contamination samples were prepared by adding DON solution to negative corn samples, and negative corn samples were identified by national standard method (34). The concentrations of DON in the contaminated samples were 100,1,000 and 3,500 μg/kg, respectively. The contaminated samples were tested with strips from the same batch and three different batches. Each batch of test strips was repeated 6 times (using the same reagent and the same standard substance), and the coefficients of variation (CVs) within the same batch and between different batches were calculated to evaluate the precision of the strips.
2.12.3. Accuracy
To evaluate the accuracy of the TRFIA-DON test strip, six pieces of quality control material DON in corn were weighed separately (1 g each). The DON was extracted using the method described in the section of “Sample pretreatment and testing.” The concentrations of DON in supernatant were detected with the prepared strips, and the recovery rates of the strips were calculated.
2.12.4. Stability
The prepared TRFIA-DON test strips were encapsulated in aluminum foil bags and stored at 4°C for 90 days. The DON contamination samples with concentrations of 0, 100, 1,500, and 7,000 μg/kg were detected by randomly selecting test strips. Each concentration was repeated 6 times. The T-line and C-line fluorescence signal values of these strips were measured on day 1, day 15, day 30, day 45, day 60, day 75, and day 90, respectively.
2.12.5. Applicability
Different types of crops and feeds, including wheat, corn, flour, poultry feed, laying hen feed, piglet feed, pig compound feed, sow feed, and supplemental feed for calf concentrates, 10 samples of each type, were randomly selected from the market and pretreated. All samples were detected by the LC-MS/MS method and the established TRFIA-DON test strip, respectively. The test was repeated three times for each sample.
3. Results
3.1. Optimal ratio of microspheres and antibodies
As shown in Figure 2, the fluorescence signal values of T-line and C-line increased as the ratio of microspheres to antibodies gradually decreased. When the ratio of microspheres to antibody was 4:1 and 1:1, ideal fluorescence signal intensity could be obtained. However, from the perspective of economy, 1:1 was finally selected as the ratio of microspheres to antibody coupling in this study. In addition, the same amount of antibody was used to conjugate different brands of microspheres. In this experiment, the fluorescence signal intensity of Fluoro-Max Fluorescent Carboxylate-Modified Particles (Thermo Fisher Scientific) was significantly higher than that of Europium Chelate Microspheres (Bangs Laboratories). Therefore, Thermo's fluorescent microspheres were selected in the follow-up experiment of this study.
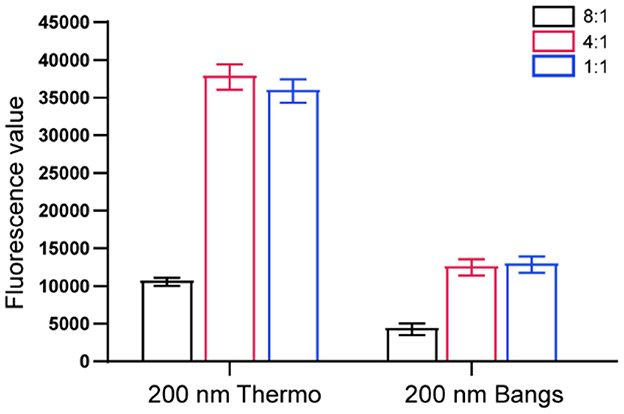
Figure 2. Screening the optimal ratio of microspheres and antibodies.
3.2. Conjugate pad pretreatment solution
In order to select the most suitable conjugate pad for this experimental study, a total of five different pretreatment solutions were tested. The test was repeated three times for each pretreatment solution. The results showed that the strongest fluorescence signals were found in strips assembled from CPPS-D treated conjugate pads, indicating that CPPS-D had the best effect on the release of fluorescent microspheres (Table 1). CV values of CPPS-D and CPPS-E were the smallest among the five pretreatment solutions, all of which were 3%. The effects of different pretreatment solutions on fluorescence signal values were analyzed by analysis of variance. No significant difference was observed between pretreatment solutions (Table 2). Higher fluorescence signal intensity and lower CV predicted that the test strip would have a wider linear range and better stability. Therefore, the CPPS-D was selected as the pretreatment solution for conjugate pad.
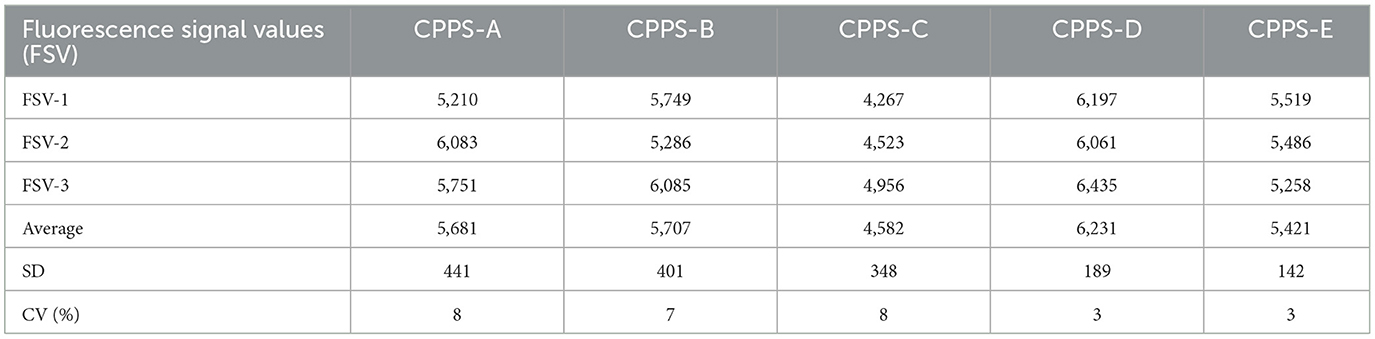
Table 1. Effects of different pretreatment solutions on fluorescent microspheres.
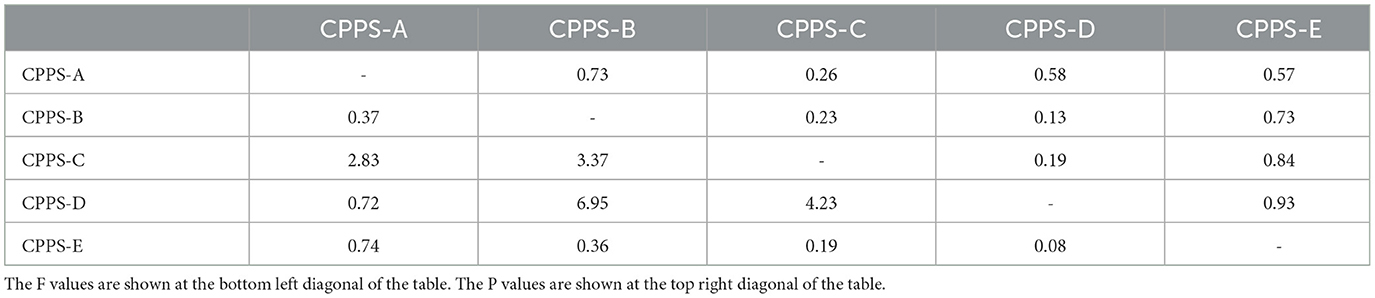
Table 2. Significance test of five pretreatment solutions used analysis of variance.
3.3. NC membrane drying time
It was not difficult to find from Figure 3 that compared with 12 h of drying, the T/C range of the test strip composed of 24 h of drying NC membrane was wider and more sensitivity, which was more conducive to the establishment of standard curve and the improvement of the accuracy of the test strip. In terms of sensitivity and linear range, there was no significant difference between the NC membrane dried for 48 h and that dried for 24 h.
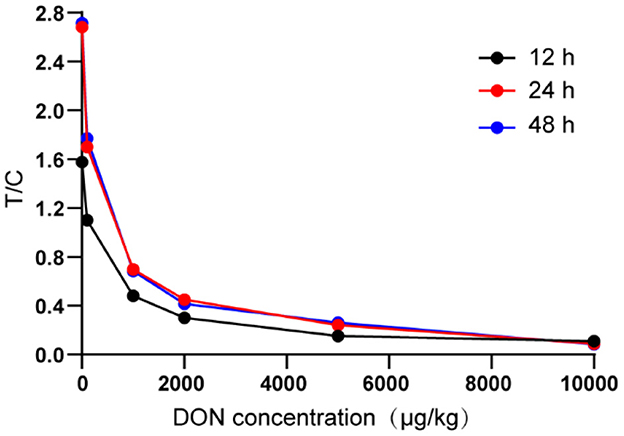
Figure 3. Determine the drying time of NC membrane.
3.4. Microsphere diluents
After 21 days of storage and regular sampling detection, the results were shown in Figure 4. It can be seen from the results that the stability of the test strip made by the diluent of No. 6 was the best whether it was stored at 4 or 37°C. Microsphere diluent No. 6 had the smallest SD value, which was 2.42 and 2.13 at 4 and 37°C storage conditions, respectively. Therefore, the No. 6 microsphere diluent was used in the follow-up experiment of this study.
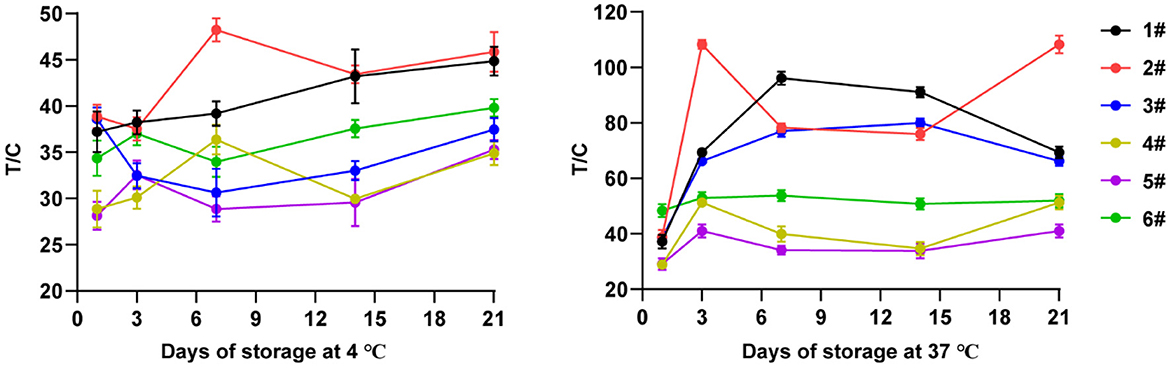
Figure 4. Influence of different microsphere diluents on the stability of test strips.
3.5. Standard curve and linearity of the TRFIA-DON test strip
To establish a standard curve, the fluorescence signal intensities on T-line and the C-line with different DON concentrations were tested and recorded by a TRFIA instrument (Figure 5). Each concentration was measured and recorded three times. The standard curve exhibited good linearity when the natural logarithm ranged from 1.609 to 9.393, corresponding to concentrations ranging from 5 μg/kg to 12,000 μg/kg. In this concentration range, the inhibition rate ranged from 92 to 95%. The fitted linear regression equation was Y = −13.622X + 121.61 (R2 = 0.9926). From piecewise linear regression equation, we could deduce that the linear range of the curve was 50 ~ 10,000 μg/kg.
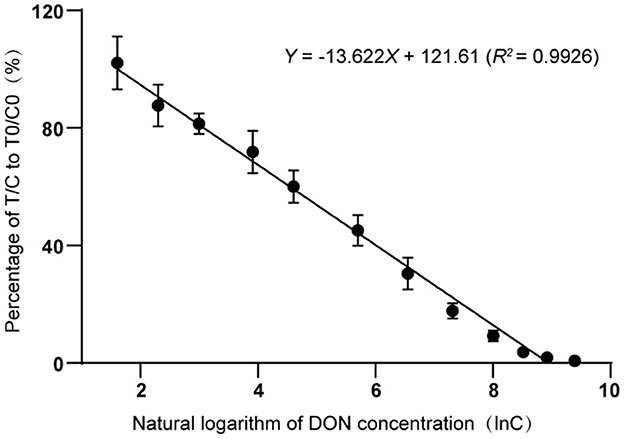
Figure 5. Standard curve of deoxynivalenol detection via time-resolved fluorescence immunoassay.
3.6. Performance evaluation
3.6.1. Sensitivity
In order to verify the sensitivity of DON strips, we tested 20 negative samples with the established DON strips, and the results were shown in Table 3. According to the linear regression equation, the LOQ of the developed DON strips was calculated as 28.16 μg/kg.
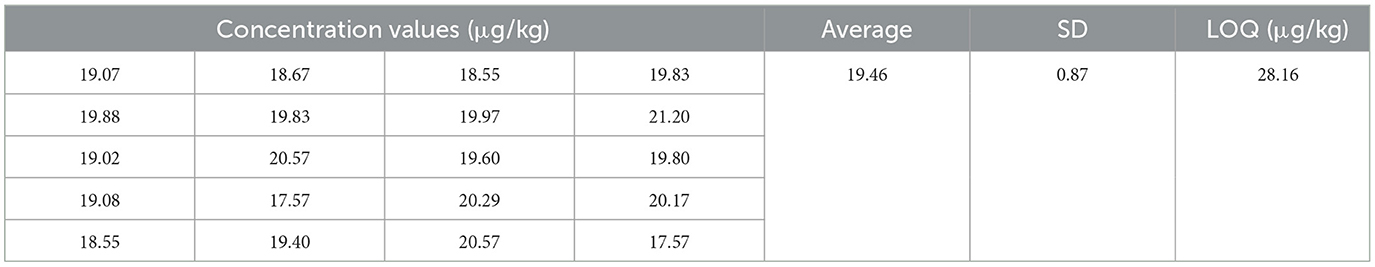
Table 3. Limit of quantification for the established TRFIA-DON test strip.
3.6.2. Precision
We evaluated the precision of the DON strips by using three artificial DON contamination samples with concentrations of 100, 1,000 and 35,00 μg/kg, respectively. Results showed that the intra-batch CVs of the strips at the concentrations of 100, 1,000 and 35,00 μg/kg were 5.00, 3.12, and 4.67%, respectively, and the inter-batch CVs at those concentrations were 4.55, 6.60, and 4.24%, respectively (Table 4).
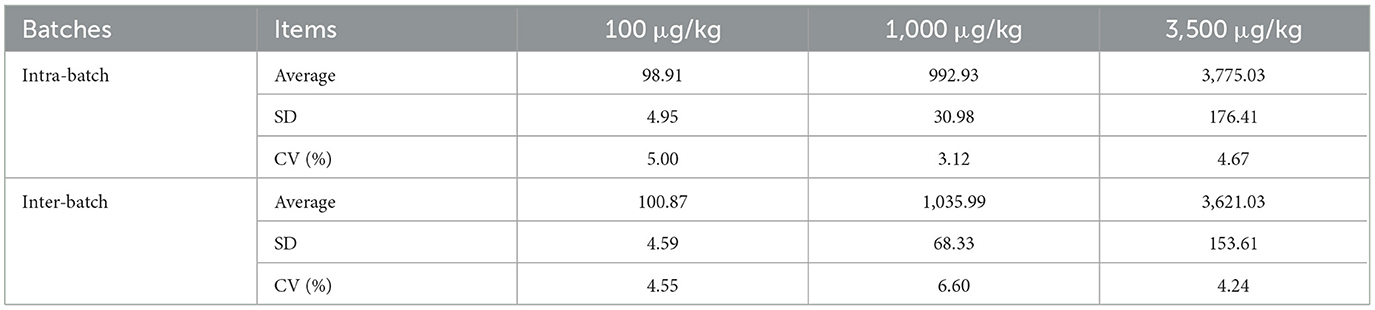
Table 4. Coefficient of variation for the established TRFIA-DON test strip.
3.6.3. Accuracy
The quality control material DON in maize sample was used to evaluate the accuracy of TRFIA-DON test strip. As shown in Table 5, the recovery rates in maize samples ranged from 92 to 104%, which could meet the requirements of daily detection.
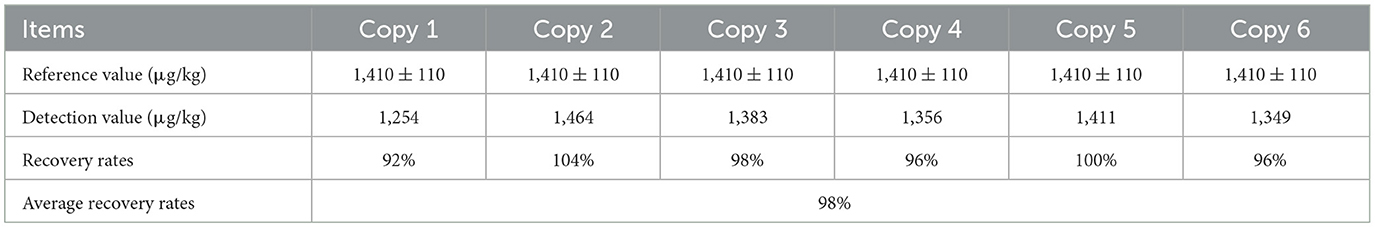
Table 5. Recovery rates of the TRFIA-DON test strip in corn samples.
3.6.4. Stability
Through long-term storage (90 days) and random sampling test experiment at irregular intervals, we found that the fluorescence signals of T-line and C-line of DON test strips gradually tended to be stable after 60 days of storage at 4°C (Figure 6). The T/C values were used to calculate the CVs of the test strips with different storage times. The results showed that the CVs of the DON test strips on the 60th, 75th and 90th days was <5%.
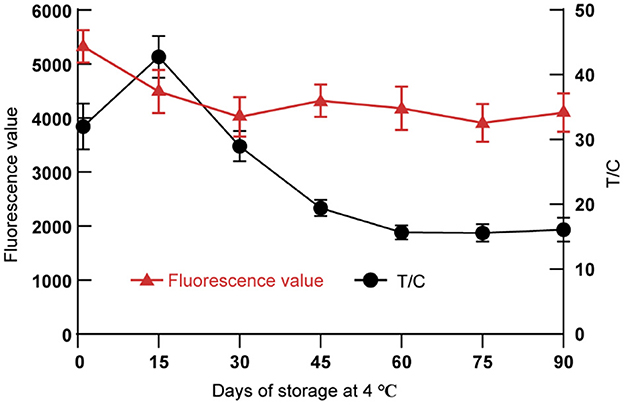
Figure 6. Stability of the TRFIA-DON test strip.
3.6.5. Applicability
To evaluate the applicability of developed TRFIA-DON test strips, a batch of real samples were tested by DON strips and LC-MS/MS, and the testing results were compared. Results showed that the relative standard deviation (RSD) between the DON strips and LC-MS/MS was <9% (Table 6). The DON in the real samples could be determined accurately and reliably via the established TRFIA-DON test strips. The DON test strips could meet the requirements of DON rapid detection in food crops and feeds.
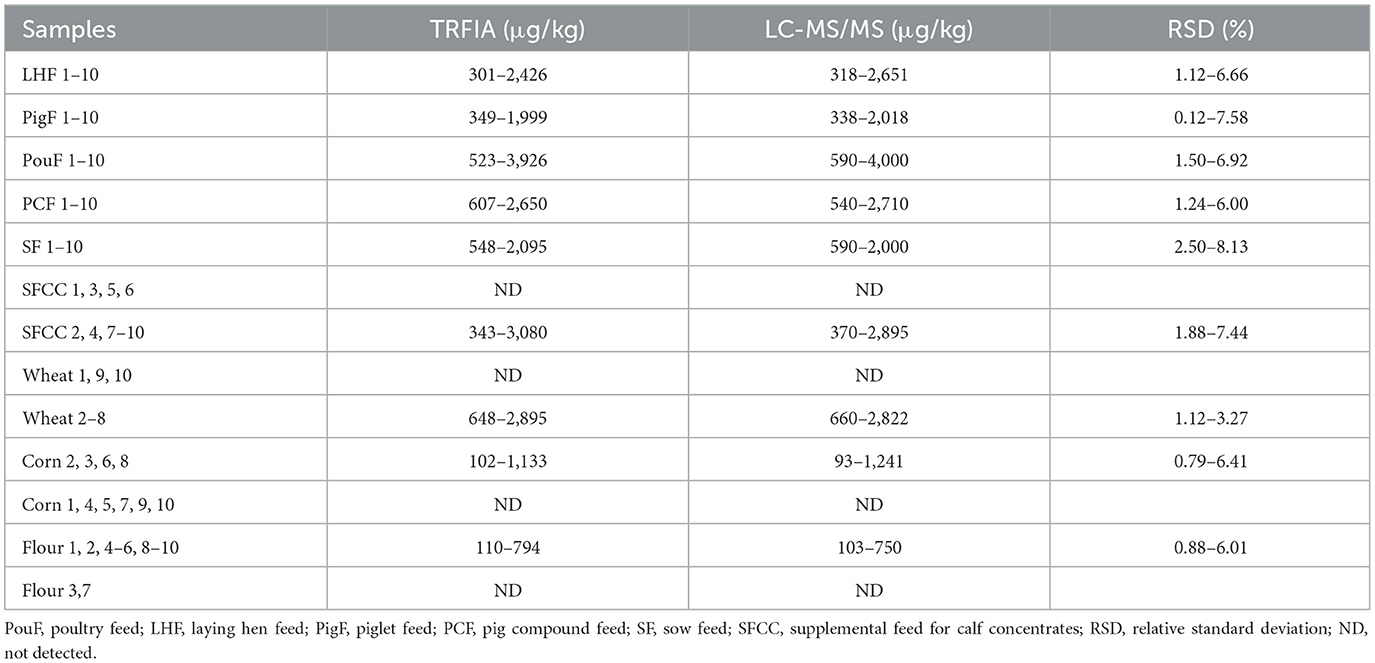
Table 6. Comparison of TRFIA-DON test strip and LC-MS/MS for DON detection in crops and feeds.
4. Discussion
DON contamination is greatly affected by temperature and humidity, especially the temperature and humidity during harvest can directly affect the content and over-standard rate of DON in corn, wheat and other food crops. Corn, wheat, and soy are the main raw materials of livestock and poultry feed. The quality of feedstuff can significantly affect the early development of intestine and the microflora of animals, which in turn affect their growth performance (35, 36). Animals fed DON contaminated feed will appear vomiting, decreased feed intake, growth retardation and other symptoms (37). At the same time, DON can also be transferred into animal food such as milk, meat and eggs through feed, so as to be ingested by human body, posing a serious threat to human health (7). The fixed location and extensive scope of food crop harvesting increase the difficulty of market monitoring and supervision. In addition, more and more severe environmental conditions have posed new challenges to crop storage and the health of domestic animals (38, 39). Therefore, a simple, rapid, and accurate detection method is urgently needed for the detection of DON in food crops and feeds. Compared with the existing detection technology, the DON quantitative test strip established in this study has the advantages of strong specificity, high sensitivity, precise quantification and simple operation that can be used for both on-site and laboratory detection.
How to control and optimize the key factors such as the specificity of antibody and the quality of fluorescent microspheres affecting the performance of test strips is the difficulty and key point of developing rapidly quantitative test strips based on TRFIA technology (40). In the present study, we determined the optimal ratio of microspheres to antibodies (1:1), the optimal drying time of NC membrane (24 h) and other key factors affecting the performance of TRFIA-DON test strips. The LOQ of developed DON test strips is 28.16 μg/kg. Recently, a number of DON detection assays have been developed based on lateral-flow immunochromatographic (41), surface plasmon resonance (42), nanogold immunochromatographic (43), HPLC-UV technique (44), and TRFIA technology (31). The sensitivity of DON strips developed in this study is slightly higher than or close to that of those reported detection assays. It takes about 6 min to test food crop and feed samples with this paper strip, which is faster than recently developed nanogold immunochromatographic assay (45) and traditional LC-MS/MS. Compared with GICA and enzyme-linked immunosorbent assay (ELISA), TRFIA-DON test strip has the advantages of simple operation, good repeatability, and short detection time (Table 7). In addition, the results detected by this developed DON strips are nearly consistent with the LC-MS/MS detection results. These results show that the paper strip has high accuracy and reliability.
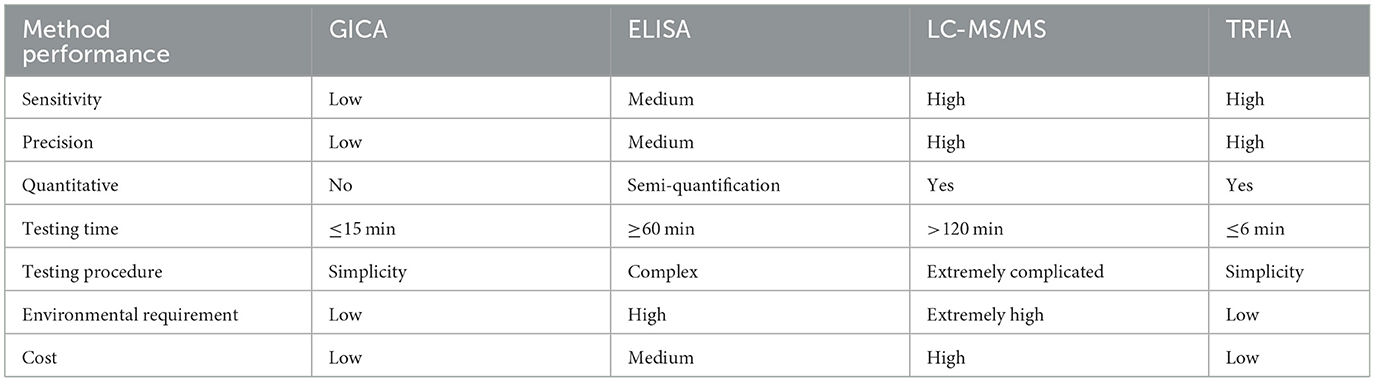
Table 7. Performance comparison of commonly used DON detection methods and TRFIA.
5. Conclusion
DON contamination is one of the major global challenges to food and feed safety. Industry requires rapid, accurate, reliable, and portable testing methods to manage this challenge. In this study, we combined time-resolved fluorescence with immunochromatography to develop a TRFIA-DON test strip with the characteristics of high sensitivity, high accuracy, and a wide linear range. The accuracy of TRFIA-DON test strip in the detection of real food and feed samples was almost consistent with that of LC-MS/MS. This detection method is easy to operate and does not require dedicated facilities and highly qualified personnel. Moreover, the established TRFIA-DON test strip can rapid and quantitative determination of DON in food crops and feeds, which is applicable to the quantitative determination of DON at both on-site and laboratory.
Data availability statement
The original contributions presented in the study are included in the article/supplementary material, further inquiries can be directed to the corresponding authors.
Author contributions
JW, YZ, and LW contributed to conception and design of the study. JW, JL, LQ, and XM performed the experimental research and statistical analysis. JW wrote the first draft of the manuscript. JL, HZ, and XM wrote sections of the manuscript. YZ, LW, and HZ reviewed and edited the manuscript. All authors contributed to manuscript revision, read, and approved the submitted version.
Funding
This project was supported by the Taizhou Science and Technology Support Plan (Agriculture) Project (No. TN202120).
Conflict of interest
JW, XM, LQ, and YZ were employed by Shanghai Xiongtu Biotechnology.
The remaining authors declare that the research was conducted in the absence of any commercial or financial relationships that could be construed as a potential conflict of interest.
Publisher's note
All claims expressed in this article are solely those of the authors and do not necessarily represent those of their affiliated organizations, or those of the publisher, the editors and the reviewers. Any product that may be evaluated in this article, or claim that may be made by its manufacturer, is not guaranteed or endorsed by the publisher.
References
1. Sumarah MW. The deoxynivalenol challenge. J Agric Food Chem. (2022) 70:9619–24. doi: 10.1021/acs.jafc.2c03690
2. Polak-Sliwinska M, Paszczyk B. Trichothecenes in food and feed, relevance to human and animal health and methods of detection: a systematic review. Molecules. (2021) 26:454. doi: 10.3390/molecules26020454
3. Mishra S, Srivastava S, Dewangan J, Divakar A, Kumar Rath S. Global occurrence of deoxynivalenol in food commodities and exposure risk assessment in humans in the last decade: a survey. Crit Rev Food Sci Nutr. (2020) 60:1346–74. doi: 10.1080/10408398.2019.1571479
4. Pinto A, De Pierri CR, Evangelista AG, Gomes A, Luciano FB. Deoxynivalenol: toxicology, degradation by bacteria, and phylogenetic analysis. Toxins. (2022) 14:90. doi: 10.3390/toxins14020090
5. Holanda DM, Kim SW. Mycotoxin occurrence, toxicity, and detoxifying agents in pig production with an emphasis on deoxynivalenol. Toxins. (2021) 13:171. doi: 10.3390/toxins13020171
6. Dong H, An X, Xiang Y, Guan F, Zhang Q, Yang Q, et al. Novel time-resolved fluorescence immunochromatography paper-based sensor with signal amplification strategy for detection of deoxynivalenol. Sensors. (2020) 20:6577. doi: 10.3390/s20226577
7. Etzel RA. Reducing malnutrition: time to consider potential links between stunting and mycotoxin exposure? Pediatrics. (2014) 134:4–6. doi: 10.1542/peds.2014-0827
8. Gruber-Dorninger C, Jenkins T, Schatzmayr G. Global mycotoxin occurrence in feed: a ten-year survey. Toxins. (2019) 11:375. doi: 10.3390/toxins11070375
9. Eskola M, Kos G, Elliott CT, Hajslova J, Mayar S, Krska R. Worldwide contamination of food-crops with mycotoxins: validity of the widely cited 'FAO estimate' of 25. Crit Rev Food Sci Nutr. (2020) 60:2773–89. doi: 10.1080/10408398.2019.1658570
10. Kihal A, Rodriguez-Prado M, Calsamiglia S. The efficacy of mycotoxin binders to control mycotoxins in feeds and the potential risk of interactions with nutrient: a review. J Anim Sci. (2022). doi: 10.1093/jas/skac328. [Epub ahead of print].
11. Ganesan AR, Mohan K, Karthick Rajan D, Pillay AA, Palanisami T, Sathishkumar P, et al. Distribution, toxicity, interactive effects, and detection of ochratoxin and deoxynivalenol in food: a review. Food Chem. (2022) 378:131978. doi: 10.1016/j.foodchem.2021.131978
12. Renaud JB, Miller JD, Sumarah MW. Mycotoxin testing paradigm: challenges and opportunities for the future. J AOAC Int. (2019) 102:1681–8. doi: 10.5740/jaoacint.19-0046
13. Tima H, Bruckner A, Mohacsi-Farkas C, Kisko G. Fusarium mycotoxins in cereals harvested from Hungarian fields. Food Addit Contam Part B Surveill. (2016) 9:127–31. doi: 10.1080/19393210.2016.1151948
14. Gummadidala PM, Omebeyinje MH, Burch JA, Chakraborty P, Biswas PK, Banerjee K, et al. Complementary feeding may pose a risk of simultaneous exposures to aflatoxin M1 and deoxynivalenol in Indian infants and toddlers: lessons from a mini-survey of food samples obtained from Kolkata, India. Food Chem Toxicol. (2019) 123:9–15. doi: 10.1016/j.fct.2018.10.006
15. Maragos CM, Plattner RD. Rapid fluorescence polarization immunoassay for the mycotoxin deoxynivalenol in wheat. J Agric Food Chem. (2002) 50:1827–32. doi: 10.1021/jf011487d
16. Maragos C. Fluorescence polarization immunoassay of mycotoxins: a review. Toxins. (2009) 1:196–207. doi: 10.3390/toxins1020196
17. Li Y, Liu X, Lin Z. Recent developments and applications of surface plasmon resonance biosensors for the detection of mycotoxins in foodstuffs. Food Chem. (2012) 132:1549–54. doi: 10.1016/j.foodchem.2011.10.109
18. Al-Taher F, Banaszewski K, Jackson L, Zweigenbaum J, Ryu D, Cappozzo J. Rapid method for the determination of multiple mycotoxins in wines and beers by LC-MS/MS using a stable isotope dilution assay. J Agric Food Chem. (2013) 61:2378–84. doi: 10.1021/jf304729f
19. Rodriguez-Carrasco Y, Molto JC, Berrada H, Manes J. A survey of trichothecenes, zearalenone and patulin in milled grain-based products using GC-MS/MS. Food Chem. (2014) 146:212–9. doi: 10.1016/j.foodchem.2013.09.053
20. Goncalves C, Mischke C, Stroka J. Determination of deoxynivalenol and its major conjugates in cereals using an organic solvent-free extraction and IAC clean-up coupled in-line with HPLC-PCD-FLD. Food Addit Contam Part A Chem Anal Control Expo Risk Assess. (2020) 37:1765–76. doi: 10.1080/19440049.2020.1800829
21. Bryla M, Ksieniewicz-Wozniak E, Waskiewicz A, Szymczyk K, Jedrzejczak R. Natural occurrence of nivalenol, deoxynivalenol, and deoxynivalenol-3-glucoside in polish winter wheat. Toxins. (2018) 10:81. doi: 10.3390/toxins10020081
22. Levasseur-Garcia C. Updated overview of infrared spectroscopy methods for detecting mycotoxins on cereals (Corn, Wheat, and Barley). Toxins. (2018) 10:38. doi: 10.3390/toxins10010038
23. Sieger M, Kos G, Sulyok M, Godejohann M, Krska R, Mizaikoff B. Portable infrared laser spectroscopy for on-site mycotoxin analysis. Sci Rep. (2017) 7:44028. doi: 10.1038/srep44028
24. Fox G, Manley M. Applications of single kernel conventional and hyperspectral imaging near infrared spectroscopy in cereals. J Sci Food Agric. (2014) 94:174–9. doi: 10.1002/jsfa.6367
25. Yoshizawa T, Morooka N. Deoxynivalenol and its monoacetate: new mycotoxins from fusarium roseum and moldy barley. Agric Biol Chem. (1973) 37:2933–4. doi: 10.1080/00021369.1973.10861103
26. He D, Wu Z, Cui B, Jin Z, Xu E. A fluorometric method for aptamer-based simultaneous determination of two kinds of the fusarium mycotoxins zearalenone and fumonisin B(1) making use of gold nanorods and upconversion nanoparticles. Mikrochim Acta. (2020) 187:254. doi: 10.1007/s00604-020-04236-4
27. Li R, Meng C, Wen Y, Fu W, He P. Fluorometric lateral flow immunoassay for simultaneous determination of three mycotoxins (aflatoxin B(1), zearalenone and deoxynivalenol) using quantum dot microbeads. Mikrochim Acta. (2019) 186:748. doi: 10.1007/s00604-019-3879-6
28. Majdinasab M, Zareian M, Zhang Q, Li P. Development of a new format of competitive immunochromatographic assay using secondary antibody-europium nanoparticle conjugates for ultrasensitive and quantitative determination of ochratoxin A. Food Chem. (2019) 275:721–9. doi: 10.1016/j.foodchem.2018.09.112
29. Niazi S, Khan IM Yu Y, Pasha I, Shoaib M, Mohsin A, et al. A “turnon” aptasensor for simultaneous and time-resolved fluorometric determination of zearalenone, trichothecenes A and aflatoxin B(1) using WS(2) as a quencher. Mikrochim Acta. (2019) 186:575. doi: 10.1007/s00604-019-3570-y
30. Sun Y, Xing G, Yang J, Wang F, Deng R, Zhang G, et al. Development of an immunochromatographic test strip for simultaneous qualitative and quantitative detection of ochratoxin A and zearalenone in cereal. J Sci Food Agric. (2016) 96:3673–8. doi: 10.1002/jsfa.7550
31. Wang X, Lu D, Huang Q, Yang J. Microfluidics-based time-resolved fluorescence immunoassay for the on-site detection of aflatoxins B1 zearalenone and deoxynivalenol in cereals. Foods. (2022) 11:1319. doi: 10.3390/foods11091319
32. Zhang Z, Wang D, Li J, Zhang Q, Li P. Monoclonal antibody–europium conjugate-based lateral flow time-resolved fluoroimmunoassay for quantitative determination of T-2 toxin in cereals and feed. Analyt Method. (2015) 7:2822–9. doi: 10.1039/C5AY00100E
33. NHC SFDA. Determination of Deoxynivalenol and its Acetylated Derivatives in Foodstuffs. Beijing: Standards Press of China. (2016).
34. AQSIQ SAC. Determination of Deoxynivalenol in Feeds–High Performance Liquid Chromatography with Immunoaffinity Column Clean-up. Beijing: Standards Press of China (2014).
35. Zhang Q, Zhang S, Wu S, Madsen MH, Shi S. Supplementing the early diet of broilers with soy protein concentrate can improve intestinal development and enhance short-chain fatty acid-producing microbes and short-chain fatty acids, especially butyric acid. J Anim Sci Biotechnol. (2022) 13:97. doi: 10.1186/s40104-022-00749-5
36. Wang Z, Shao D, Wu S, Song Z, Shi S. Heat stress-induced intestinal barrier damage and dimethylglycine alleviates via improving the metabolism function of microbiota gut brain axis. Ecotoxicol Environ Saf. (2022) 244:114053. doi: 10.1016/j.ecoenv.2022.114053
37. Mwaniki AW, Buis QR, Trott D, Huber LA, Yang C, Kiarie EG. Comparative efficacy of commercially available deoxynivalenol detoxifying feed additives on growth performance, total tract digestibility of components, and physiological responses in nursery pigs fed diets formulated with naturally contaminated corn. Transl Anim Sci./ (2021) 5:txab050. doi: 10.1093/tas/txab050
38. Hoffmans Y, Schaarschmidt S, Fauhl-Hassek C, van der Fels-Klerx HJ. Factors during production of cereal-derived feed that influence mycotoxin contents. Toxins. (2022) 14:301. doi: 10.3390/toxins14050301
39. Shi S, Shao D, Yang L, Liang Q, Han W, Xue Q, et al. Whole genome analyses reveal novel genes associated with chicken adaptation to tropical and frigid environments. J Adv Res. (2022). doi: 10.1016/j.jare.2022.07.005. [Epub ahead of print].
40. McLean GR, Zhang Y, Ndoyi R, Martin A, Winer J. Rapid Quantification of SARS-CoV-2 neutralising antibodies using time-resolved fluorescence immunoassay. Vaccines. (2022) 10:2149. doi: 10.3390/vaccines10122149
41. Kong D, Wu X, Li Y, Liu L, Song S, Zheng Q, et al. Ultrasensitive and eco-friendly immunoassays based monoclonal antibody for detection of deoxynivalenol in cereal and feed samples. Food Chem. (2019) 270:130–7. doi: 10.1016/j.foodchem.2018.07.075
42. Wei T, Ren P, Huang L, Ouyang Z, Wang Z, Kong X, et al. Simultaneous detection of aflatoxin B1, ochratoxin A, zearalenone and deoxynivalenol in corn and wheat using surface plasmon resonance. Food Chem. (2019) 300:125176. doi: 10.1016/j.foodchem.2019.125176
43. Xu Y, Yang H, Huang Z, Li Y, He Q, Tu Z, et al. A peptide/maltose-binding protein fusion protein used to replace the traditional antigen for immunological detection of deoxynivalenol in food and feed. Food Chem. (2018) 268:242–8. doi: 10.1016/j.foodchem.2018.06.096
44. Lee SY, Woo SY, Malachova A, Michlmayr H, Kim SH, Kang GJ, et al. Simple validated method for simultaneous determination of deoxynivalenol, nivalenol, and their 3-beta-D-glucosides in baby formula and Korean rice wine via HPLC-UV with immunoaffinity cleanup. Food Addit Contam Part A Chem Anal Control Expo Risk Assess. (2019) 36:964–75. doi: 10.1080/19440049.2019.1606454
Keywords: deoxynivalenol, time-resolved fluorescence immunoassay, quantitative analysis, rapid testing, food crop, animal feed
Citation: Wang J, Wang L, Zhang H, Mei X, Qiu L, Liu J and Zhou Y (2023) Development of a time-resolved immunochromatographic strip for rapid and quantitative determination of deoxynivalenol. Front. Vet. Sci. 10:1142820. doi: 10.3389/fvets.2023.1142820
Received: 12 January 2023; Accepted: 27 February 2023;
Published: 16 March 2023.
Edited by:
Bing Dong, China Agricultural University, ChinaReviewed by:
Zheng Han, Shanghai Academy of Agricultural Sciences, ChinaPengjie Luo, National Food and Veterinary Risk Assessment Institute, Lithuania
Chen Yiqiang, China Agricultural University, China
Copyright © 2023 Wang, Wang, Zhang, Mei, Qiu, Liu and Zhou. This is an open-access article distributed under the terms of the Creative Commons Attribution License (CC BY). The use, distribution or reproduction in other forums is permitted, provided the original author(s) and the copyright owner(s) are credited and that the original publication in this journal is cited, in accordance with accepted academic practice. No use, distribution or reproduction is permitted which does not comply with these terms.
*Correspondence: Jing Liu, eWRsaXVqaW5nQHNpbmEuY29t; Yongsong Zhou, eGlvbmd0dTIwMjJAMTYzLmNvbQ==
†These authors have contributed equally to this work