Abstract
Particularly in unshorn llamas and alpacas with a dense fiber coat, changes in body condition often remain undetected for a long time. Manual palpation of the lumbar vertebrae is hence a simple and practical method for the objective assessment of body condition in South American camelids (SAC). Depending on tissue coverage, a body condition score (BCS) of 1 (emaciated) to 5 (obese) with an optimum of 3 is assigned. To date, there is a lack of detailed information on the comparability of the results when the BCS in llamas or alpacas is assessed by different examiners. Reliability of BCS assessment of 20 llamas and nine alpacas during a veterinary herd visit by six examiners was hence evaluated in this study. A gold standard BCS (gsBCS) was calculated from the results of the two most experienced examiners. The other examiners deviated by a maximum of 0.5 score points from the gsBCS in more than 80% of the animals. Inter-rater reliability statistics between the assessors were comparable to those in body condition scoring in sheep and cattle (r = 0.52–0.89; τ = 0.43–0.80; κw = 0.50–0.79). Agreements were higher among the more experienced assessors. Based on the results, the assessment of BCS in SAC by palpation of the lumbar vertebrae can be considered as a simple and reproducible method to reliably determine nutritional status in llamas and alpacas.
1. Introduction
The husbandry of South American camelids (SAC) is becoming more and more popular in Europe (1–4). In case of disease, llamas and alpacas are, however, often presented late for veterinary care. Hence, the animals are often severely emaciated or reveal anemia (5). In a recently published evaluation of 300 SAC presented to our clinic, we found that 60% of the alpacas and 70% of the llamas revealed a Body Condition Score (BCS) lower than the optimal score of three (5). At the same time, half of the SAC farms in Germany that participated in an online survey recently stated that they never had problems with emaciation. Furthermore, a quarter observed < 1 case of emaciation per year (1). This survey also showed that the occurrence of gastrointestinal endoparasitic infections and emaciation was more likely on farms with more animals than those with fewer animals (1). This discrepancy between the high amount of emaciated animals that are presented to the clinic and a rather low awareness of emaciation on the farms indicates that the assessment of the nutritional status is of particular importance in husbandry of SAC to recognize emaciation in time. Inadequate feeding management, chronic diseases, dental problems, and especially gastrointestinal endoparasites can lead to a poor nutritional status related to a low BCS (6–8). The decrease in body condition, sometimes within a relatively short space of time, is overlooked by the keeper due to the animal's dense fiber coat. In addition, SAC generally hide symptoms of disease for a long time and only display them at a very late stage (6). Visual examination alone is hence insufficient and may lead to incorrect results. When assessing the nutritional status of llamas and alpacas, manual palpation is vital (9). For the standardized assessment of the nutritional status in SAC, descriptions of a body condition score (BCS) from previous studies are available. Most of the authors recommend the palpatory examination of the lumbar spine for determining the BCS in SAC (9–16). However, depending on the source, other body regions, such as the thorax behind the elbow, the paralumbar fossa, or the area between the front and rear legs, are sometimes included in the assessment of the BCS of llamas and alpacas (6, 10, 12). In cattle, where the concept of body condition scoring is an important tool in herd management (17), several studies on the learnability and reproducibility of the BCS are available (18–21). Similar data can be found for sheep (22–24). To the best of our knowledge, accurate data on the comparability of BCS in llamas and alpacas are currently unavailable. In order to investigate the inter-rater reliability (25) for the BCS in SAC by palpation of the lumbar spine, we evaluated the results of six examiners with different levels of expertise assessing the BCS of llamas and alpacas during a herd visit in northern Germany.
2. Material and methods
2.1. Herd
The mixed llama and alpaca herd was located in northern Germany and had a size of 35 animals in early summer 2022. A total of five animals had died peracutely within a few weeks before the visit in August 2022. In addition, two crias had been born during the same period, resulting in a total of 32 animals (23 llamas and nine alpacas) at the time of our visit. The age of the animals ranged from 10 days to 19 years, all animals had been shorn between April and May 2022. The purpose of the visit was to check the health status of the remaining animals in the herd after the previously incurred losses. A clinical examination of each of the animals according to the routine protocol of the clinic was performed and the animals were vaccinated against clostridia. The BCS of the animals as part of the clinical examination was assessed by six examiners in order to increase the precision of the results and to obtain more routine in herd management of SAC. The assessment of the BCS is seen as a routine method in SAC husbandry, which should acclimatize the animals to stress-free handling (26). Since not all examiners assessed the BCS in three of the animals, these animals were excluded from the evaluation. Ultimately, body condition scores of 20 llamas and nine alpacas assessed by six examiners were included in this study.
2.2. Assessment of BCS
The BCS was assessed by palpation of the lumbar spine behind the last ribs according to previous descriptions (6, 9, 10) and ranged from 1 to 5 as follows:
BCS 1—emaciated
BCS 2—thin
BCS 3—optimal
BCS 4—overweight
BCS 5—obese
All examiners palpated the spinous and transverse processes of the lumbar vertebrae as well as the muscle and fat coverage in between. In animals with an optimal nutritional status (BCS 3), the line between spinous and transverse processes should be neither convex nor concave (Figure 1). The more concave the line was, the lower the BCS was classified (BCS 1 and 2), the more convex the line was, the higher the BCS was classified (BCS 4 and 5). Steps of 0.5 in between were possible. Most of the animals were fixed in a chute for clinical examination. A few animals that were not compatible with the chute were restrained by only one person for the examination.
Figure 1
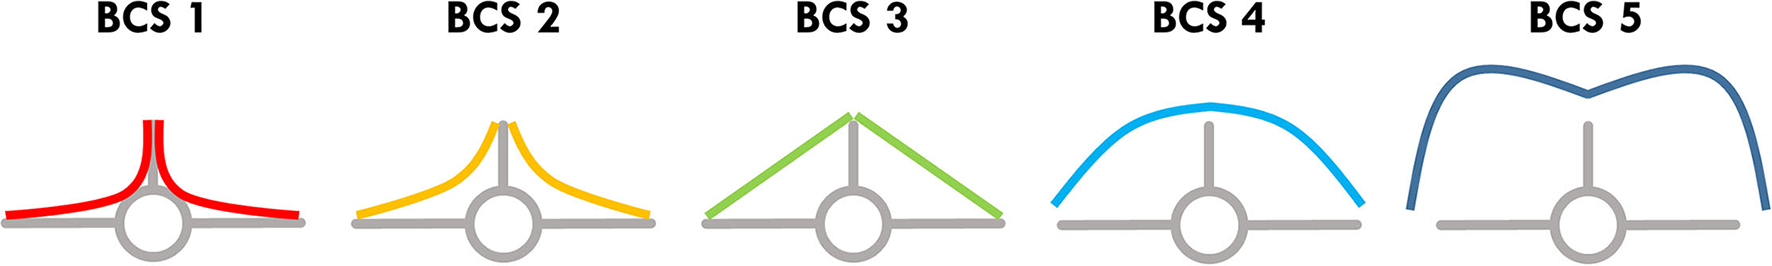
Schematic cross section through the lumbar spine. BCS in llamas and alpacas is assessed by palpating the tissue coverage of the lumbar vertebrae. The spinous and transverse processes as well as the connecting line between these two are palpated. If the BCS is optimal (3), this connecting line is straight; if this line is concave, the BCS is <3; if it is convex, the BCS is >3. Figure modified according to Wagener and Ganter (9).
The results of the individual examiners for each animal were recorded as paper protocols on the farm and transferred to an Excel sheet (Microsoft Excel for Office 365) for further analysis later.
2.3. Examiners
The six different examiners had different levels of experience with body condition scoring in SAC:
- Examiner 1: veterinarian with more than 5 years of experience of regular practical assessment of BCS in SAC and small ruminants at clinic and herd level prior to the study
- Examiner 2: veterinarian with approx. one year of experience in regular practical assessment of BCS in SAC and small ruminants at clinic level prior to the study
- Examiner 3: veterinarian with approx. one year of experience in regular practical assessment of BCS in SAC and small ruminants at clinic level prior to the study
- Examiner 4: veterinarian with approx. one year of experience in regular practical assessment of BCS in small ruminants at herd level prior to the study
- Examiner 5: veterinary student who had learnt to assess BCS in SAC 3 years prior to the study
- Examiner 6: animal keeper, owner of the farm with more than 5 years of experience in regular practical assessment of BCS in SAC at herd level prior to the study.
2.4. Gold Standard BCS (gsBCS)
In order to obtain a “correct” BCS as a reference value for each animal, a gold standard BCS (gsBCS) was calculated for each animal according to Kleiböhmer et al. (19) who checked the accuracy of the BCS in cattle (19). Due to the experience and the close agreement of examiners 1 and 6, the gsBCS was calculated from their findings by calculating the means of both examiners for each animal. Examiners 1 and 6 both had more than 5 years of experience in determining the BCS. Examiner 6 tended to assess a lower BCS than examiner 1. In 16 animals, examiners 1 and 6 agreed, in seven animals, the BCS assessed by examiner 6 was 0.5 score points lower than that assessed by examiner 1 and in two animals, 1 score point lower than examiner 1. In four animals, examiner 6 was 0.5 score points higher than examiner 1. Since the two examiners differed by 0.5 score points for 11 animals, the calculated gsBCS for these animals resulted in 0.25 score points. Although these were mathematically correct, they did not represent a BCS that could be realistically examined. Therefore, for these animals, the BCS was rounded up or down to the nearest full score. For example, if the calculated value was 2.25, it was rounded down to 2, and if it was 2.75, it was rounded up to 3.
2.5. Statistical evaluation
Analysis of data was performed with Excel (Microsoft Excel for Office 365), SAS (SAS Enterprise Guide 7.1) and R [(R Foundation for Statistical Computing, Vienna, Austria, https://www.R-project.org) in combination with RStudio (Integrated Development for RStudio, Inc., http://www.rstudio.com)].
Descriptive statistics included mean, minimum and maximum of the BCS in each animal as well as mean, minimum and maximum of the assessed BCS by each examiner. In some of the groups examined, the values were not normally distributed. However, the mean was consistently used in the descriptive statistics, since some gradations were not visible in the median. In addition, the number of deviations from gsBCS were determined for each examiner by subtraction. For testing the inter-rater reliability of a BCS in ruminants, different statistical tests have been used in previously published studies (21, 22, 24, 27, 28). We used Spearman's rank correlation coefficient (r), Kendall's rank correlation coefficient (τ), and Cohen's weighted kappa (κw) for testing pairwise correlation and agreement of the examiners with each other and with the gsBCS. In addition, one overall Kendall's coefficient of concordance (W) was computed, including only the examiners' scores without the gsBCS. Spearman's and Kendall's correlation was interpreted as follows: r/τ = 0–0.1: negligible correlation; r/τ = 0.1–0.39: weak correlation; r/τ = 0.4–0.69: moderate correlation; r/τ = 0.7–0.89: strong correlation; r/τ = 0.9–1.0: very strong correlation (29, 30). Cohen's weighted kappa and Kendall's coefficient of concordance were interpreted as follows: κw/W = 0–0.2: slight agreement; κw/W = 0.21–0.4: fair agreement; κw/W = 0.41–0.6: moderate agreement; κw/W = 0.61–0.8: substantial agreement; κw/W = 0.81–1: almost perfect (31). Differences between llamas and alpacas were tested by using the unpaired two-samples Wilcoxon test. A p-value < 0.05 was considered significant.
3. Results
By the examination of 29 animals, in total, 174 BCSs were recorded. All assessed BCSs as well as further details on the animals can be found in Table 1. The mean value for all records was 3.29, the lowest BCS was 1.5, the highest 5. The gsBCS for all animals was 3.28 (mean) and ranged from 1.5 to 4. The alpacas of this herd had a lower gsBCS (mean: 2.83) than the llamas (mean: 3.48). However, the difference was not statistically significant (p = 0.08). The minimal BCS assessed by an examiner for all animals was 2.83 (mean) with a range of 1.5–4; the maximal BCS assessed by an examiner for all animals was 3.74 (mean) with a range of 2–5. The range of the BCSs that were assessed in an individual animal by the six examiners was 0.91 (mean) for all animals and was between 0 and 2 score points. In only one animal with a BCS of 4 did all six examiners give the same BCS. In 11 animals, the range of the examiners was 0.5 score points, the mean gsBCS in these animals was 3.00. In another 11 animals with a mean gsBCS of 3.18, the range was one score point. Four animals with a gsBCS of 3.75 (mean) had a range of 1.5 score points and two animals with a gsBCS of 4 each had a range of 2 score points in the BCS assessed by the six examiners.
Table 1
| Animal | Species | Sex* | Age (years) | Examiner 1 | Examiner 2 | Examiner 3 | Examiner 4 | Examiner 5 | Examiner 6 | gsBCS |
|---|---|---|---|---|---|---|---|---|---|---|
| A 1 | Alpaca | m | 0 | 4 | 4 | 3.5 | 3.5 | 4 | 3.5 | 4 |
| A 2 | Alpaca | f | 1 | 4 | 4 | 2.5 | 4.5 | 4 | 4 | 4 |
| A 3 | Alpaca | f | 1 | 3.5 | 3.5 | 3 | 3.5 | 3.5 | 3.5 | 3.5 |
| A 4 | Alpaca | f | 2 | 2.5 | 3 | 2.5 | 2.5 | 2.5 | 3 | 3 |
| A 5 | Alpaca | f | 5 | 3.5 | 3.5 | 3.5 | 3 | 3 | 3.5 | 3.5 |
| A 6 | Alpaca | f | 7 | 2.5 | 3 | 2.5 | 2.5 | 2.5 | 2 | 2 |
| A 7 | Alpaca | f | 10 | 2 | 2 | 3 | 2.5 | 2.5 | 2 | 2 |
| A 8 | Alpaca | f | 13 | 1.5 | 1.5 | 2 | 1.5 | 1.5 | 1.5 | 1.5 |
| A 9 | Alpaca | mn | 13 | 2 | 2.5 | 2 | 2 | 2.5 | 2.5 | 2 |
| L 1 | Llama | m | 1 | 3 | 3.5 | 3 | 3 | 2.5 | 3 | 3 |
| L 2 | Llama | f | 2 | 3 | 4 | 4.5 | 3.5 | 3 | 3 | 3 |
| L 3 | Llama | f | 2 | 3.5 | 3.5 | 3.5 | 4 | 4 | 3.5 | 3.5 |
| L 4 | Llama | f | 3 | 3.5 | 3.5 | 4 | 4 | 3.5 | 4 | 4 |
| L 5 | Llama | m | 4 | 3.5 | 3 | 4 | 3.5 | 3.5 | 3.5 | 3.5 |
| L 6 | Llama | f | 5 | 3.5 | 4 | 3 | 4 | 3.5 | 3.5 | 3.5 |
| L 7 | Llama | mn | 5 | 3.5 | 3.5 | 4 | 5 | 3 | 4 | 4 |
| L 8 | Llama | f | 6 | 4.5 | 4.5 | 5 | 5 | 3.5 | 4 | 4 |
| L 9 | Llama | f | 6 | 3 | 4 | 4 | 4 | 3.5 | 4 | 3.5 |
| L 10 | Llama | f | 7 | 4 | 4 | 4 | 4.5 | 3.5 | 4 | 4 |
| L 11 | Llama | f | 8 | 3 | 3 | 2.5 | 3 | 2.5 | 3 | 3 |
| L 12 | Llama | m | 9 | 4 | 4 | 4 | 4 | 4 | 4 | 4 |
| L 13 | Llama | f | 10 | 3.5 | 3 | 4 | 3.5 | 3.5 | 3.5 | 3.5 |
| L 14 | Llama | f | 11 | 2.5 | 2 | 2.5 | 2.5 | 2.5 | 2.5 | 2.5 |
| L 15 | Llama | m | 11 | 4.5 | 3.5 | 4 | 4 | 3.5 | 4 | 4 |
| L 16 | Llama | mn | 14 | 3.5 | 3.5 | 4 | 3.5 | 2.5 | 4 | 4 |
| L 17 | Llama | f | 14 | 3.5 | 3.5 | 4 | 5 | 4 | 4.5 | 4 |
| L 18 | Llama | mn | 16 | 2.5 | 3 | 3 | 3 | 3 | 2.5 | 2.5 |
| L 19 | Llama | f | 19 | 2 | 2 | 3 | 2 | 2 | 2.5 | 2 |
| L 20 | Llama | mn | 19 | 3.5 | 3.5 | 3.5 | 3.5 | 3 | 4 | 4 |
Overview of sex, age, assessed Body Condition Score (BCS) by each examiner, and calculated gsBCS (gold standard BCS) of the examined alpacas and llamas.
*f, female; m, male; mn, male neutered.
Deviations of the individual examiners are displayed in Table 2. For five of the six examiners no significant difference could be detected between the examination of the BCS in alpacas and lamas regarding the deviations in the assessed BCS from the gsBCS (examiner 1: p = 0.38; examiner 2: p = 0.03; examiner 3: p = 0.21; examiner 4: p = 0.96; examiner 5: p = 0.74; examiner 6: p = 0.67).
Table 2
| Deviation from gsBCS | ||||||||
|---|---|---|---|---|---|---|---|---|
| n | Mean | Min-Max | Total score | ±0.00 BCS | ±0.50 BCS | ±1.00 BCS | ±1.50 BCS | |
| All examiners | 174 | 3.29 | 1.5–5 | 573 | 92 (52.9%) | 69 (39.7%) | 10 (5.7%) | 3 (1.7%) |
| gsBCS | 29 | 3.28 | 1.5–4 | 95 | 0 | 0 | 0 | 0 |
| Examiner 1 | 29 | 3.21 | 1.5–4.5 | 93 | 19 (65.5%) | 10 (34.5%) | 0 (0.0%) | 0 (0.0%) |
| Examiner 2 | 29 | 3.29 | 1.5–4.5 | 95.5 | 12 (41.4%) | 15 (51.7%) | 2 (6.9%) | 0 (0.0%) |
| Examiner 3 | 29 | 3.38 | 2–5 | 98 | 12 (41.4%) | 12 (41.4%) | 3 (10.3%) | 2 (6.9%) |
| Examiner 4 | 29 | 3.45 | 1.5–5 | 100 | 12 (41.4%) | 14 (48.3%) | 3 (10.3%) | 0 (0.0%) |
| Examiner 5 | 29 | 3.10 | 1.5–4 | 90 | 13 (44.8%) | 13 (44.8%) | 2 (6.9%) | 1 (3.4%) |
| Examiner 6 | 29 | 3.33 | 1.5–4.5 | 96.5 | 24 (82.8%) | 5 (17.2%) | 0 (0.0%) | 0 (0.0%) |
Overview of the results of each examiner and the number of assessed Body Condition Scores (BCS) that deviated from the gsBCS (gold standard BCS).
Spearman's correlation analysis revealed strong significant correlations between gsBCS and examiners 2, 4, and 5 and moderate significant correlations between gsBCS and examiner 3. Interpreting the correlation and agreement between gsBCS and examiners 1 and 6 is unnecessary, since the gsBCS is the result of the assessments by examiners 1 and 6. Spearman's correlations between the individual examiners were almost all strong, moderate correlations were only found between examiner 3 and other examiners (1,2,5). The range for r between the individual examiners was 0.52–0.89.
When the same limits were applied to τ, Kendall's rank correlation coefficient resulted in weaker correlations. In this statistic, examiner 4 showed a strong correlation with the gsBCS and examiners 2, 3, and 5 a moderate correlation therewith. There was a moderate correlation among the individual examiners. A strong correlation was only found between examiner 1 and examiners 4, 5, and 6 as well as between examiner 4 and examiners 5 and 6. The range for τ between the individual examiners was 0.43–0.80.
Cohen's weighted kappa (κw), on the other hand, showed better agreement than τ in most comparisons. The gsBCS had a substantial agreement with examiners 2–5. The kappa between examiners showed substantial agreement in almost all pairs except in the comparison of examiner 2 with examiners 3 and 5, and examiner 5 with examiners 3 and 4. The range for κw between the individual examiners was 0.50–0.79.
Kendall's coefficient of concordance (W) amounted to 0.78, which corresponded to an overall substantial agreement between the six examiners.
The exact values for Spearman's rank correlation coefficient, Kendall's rank correlation coefficient, and Cohen's weighted kappa are displayed in Tables 3, 4.
Table 3
| Spearman's rank correlation coefficient (r) Kendall's rank correlation coefficient (τ) Cohen's weighted kappa (κw) | |||||||
|---|---|---|---|---|---|---|---|
| gsBCS | Examiner 1 | Examiner 2 | Examiner 3 | Examiner 4 | Examiner 5 | Examiner 6 | |
| gsBCS | < 0.0001 < 0.0001 – | < 0.0001 < 0.0001 – | < 0.0001 0.0002 – | < 0.0001 < 0.0001 – | < 0.0001 < 0.0001 – | < 0.0001 < 0.0001 – | |
| Examiner 1 | 0.91 0.86 0.86 | < 0.0001 < 0.0001 – | 0.0003 0.0007 – | < 0.0001 < 0.0001 – | < 0.0001 < 0.0001 – | < 0.0001 < 0.0001 – | |
| Examiner 2 | 0.73 0.65 0.73 | 0.77 0.69 0.78 | 0.0007 0.0009 – | < 0.0001 < 0.0001 – | < 0.0001 < 0.0001 – | < 0.0001 < 0.0001 – | |
| Examiner 3 | 0.66 0.57 0.66 | 0.62 0.52 0.64 | 0.59 0.51 0.58 | < 0.0001 < 0.0001 – | 0.0035 0.0054 – | < 0.0001 < 0.0001 – | |
| Examiner 4 | 0.86 0.78 0.63 | 0.82 0.73 0.74 | 0.79 0.69 0.69 | 0.70 0.61 0.69 | < 0.0001 < 0.0001 – | < 0.0001 < 0.0001 – | |
| Examiner 5 | 0.73 0.64 0.71 | 0.80 0.70 0.74 | 0.70 0.61 0.50 | 0.52 0.43 0.54 | 0.81 0.71 0.54 | < 0.0001 < 0.0001 – | |
| Examiner 6 | 0.95 0.92 0.92 | 0.83 0.74 0.79 | 0.72 0.62 0.71 | 0.70 0.60 0.67 | 0.89 0.80 0.75 | 0.70 0.60 0.67 | |
Spearman's rank correlation coefficient (r), Kendall's rank correlation coefficient (τ), and Cohen's weighted kappa (κw) are listed in bold.
The first line in each cell represents Spearman's r, the second line Kendall's τ, and the third line Cohen's κw. Respective p-values for Spearman's r and Kendall's τ are listed in italics. gsBCS, gold standard BCS.
Table 4
| r = | τ = | κw= | ||||
|---|---|---|---|---|---|---|
| Mean±SD | Min–Max | Mean±SD | Min–Max | Mean±SD | Min–max | |
| gsBCS | 0.81 ± 0.12 | 0.66–0.95 | 0.74 ± 0.14 | 0.57–0.92 | 0.75 ± 0.11 | 0.63–0.92 |
| Examiner 1 | 0.77 ± 0.09 | 0.62–0.83 | 0.68 ± 0.09 | 0.52–0.75 | 0.74 ± 0.06 | 0.64–0.79 |
| Examiner 2 | 0.71 ± 0.08 | 0.59–0.79 | 0.62 ± 0.07 | 0.51–0.69 | 0.65 ± 0.11 | 0.50–0.78 |
| Examiner 3 | 0.63 ± 0.08 | 0.52–0.70 | 0.53 ± 0.07 | 0.43–0.61 | 0.62 ± 0.06 | 0.54–0.69 |
| Examiner 4 | 0.80 ± 0.07 | 0.70–0.89 | 0.71 ± 0.07 | 0.61–0.80 | 0.68 ± 0.08 | 0.54–0.74 |
| Examiner 5 | 0.71 ± 0.12 | 0.52–0.81 | 0.61 ± 0.11 | 0.43–0.71 | 0.60 ± 0.10 | 0.50–0.74 |
| Examiner 6 | 0.77 ± 0.09 | 0.70–0.89 | 0.67 ± 0.09 | 0.60–0.80 | 0.72 ± 0.05 | 0.67–0.79 |
Agreements [Spearman's rank correlation coefficient (r), Kendall's rank correlation coefficient (τ) and Cohen's weighted kappa (κw)] of all examiners with the gsBCS (line “gsBCS”; n = 6), and of the individual examiners with each of the other examiners (lines “examiner 1” to “examiner 6”; n = 5 each).
4. Discussion and outlook
When considering the overall Kendall's coefficient of concordance, the agreement between the estimated BCSs of different examiners in this mixed herd of llamas and alpacas was surprisingly high. The largest range in BCS with 2 score points was found in only two of the animals, whereas the assessed BCS in 22 of the 29 animals (75.9%) differed only by a maximum of 1 score point between the examiners. When using the gsBCS as a definition of the correct score in each animal, only three (1.7%) of the 174 BCSs that were assessed in this study deviated from the gsBCS by more than 1 score point. Of course, this has to be considered within the context of the limitation that the gsBCS was calculated from the findings of examiners 1 and 6, and thus, there was already a close relationship between these three values. When interpreting the deviations from the gsBCS, the other examiners (2–5) did not deviate from the gsBCS in more than 40% of the animals, and did not deviate more than 0.5 score points in over 80% of the animals.
Examiners 1, 4, and 6 had the highest means for r, τ and κw compared to the other examiners. In contrast to the others, these examiners had more experience in assessing BCS in flocks. Furthermore, examiners 1 and 6 had the longest experience in assessing BCS in SAC. The other examiners who had clinical but not flock experience in assessing the BCS in SAC resulted in lower means for r, τ and κw. In contrast to the SACs detected in the clinic, the SACs examined in this study had higher BCSs. The alpacas referred to our clinic revealed a BCS of 2.43 ± 0.77 (mean ± SD), the llamas a BCS of 2.20 ± 0.99 (mean ± SD) (5). This may have resulted in lower BCS being detected more reliably, and could be an explanation as to why animals with a higher gsBCS revealed a higher range of assessed BCS by the individual examiners. It is worth mentioning that the greatest differences in the estimation of the BCS between the examiners were in animals with a mean gsBCS of around 3, that represents an optimal nutritional status. The clinical consequences of these differences are therefore negligible.
Since no comparable studies for SAC are known so far, the results of studies in cattle and sheep were used for comparison. Kleiböhmer et al. (19) found that even inexperienced examiners who had received extensive training in BCS assessment were able to obtain reproducible BCS assessment results after 6 weeks (19). The 175 cows in their study were examined by 15 examiners. Herein, only 3% of the assessed BCS had a deviation of 0.5 score points from the gsBCS.
Other studies on the inter-rater reliability used a weighted kappa analysis for evaluation (21, 22, 24). In our study, the range of inter-rater reliability among examiners was κw = 0.50–0.79, which is comparable to other studies on the inter-rater reliability of the BCS in sheep or cattle.
Phythian et al. (22) investigated the inter-rater reliability for body condition scoring in sheep before and after a brief recalibration on the inter-observer agreement of three examiners (22). Before re-calibration, they found κw = 0.3–0.5 and W = 0.4–0.5, and thereafter, κw = 0.4–0.7 and W = 0.4–0.6. They also concluded that both a BCS as well in full as in half-unit scores can be determined by different examiners with a good agreement. In a study from New Zealand by Corner-Thomas et al. (24), BCSs of 45 sheep were assessed by both three experienced technicians and 23 farmers who had previously received training in BCS. Pairs of farmers revealed a higher variability in kappa (κw = 0.54–0.94) than the pairs of technicians (κw = 0.82–0.88) (24).
Kristensen et al. (21) tested the inter-rater reliability of 51 dairy veterinarians with different levels of experience after a workshop on BCS (21). The examiners assessed the BCS of 20 cows twice at an interval of 2.5 hours. The inter-rater reliability between the workshop participants was tested as well as the inter-rater reliability between participants and the six instructors who had also received a special training beforehand. That study showed that the inter-rater reliability of the second scoring showed better agreements (κw scoring 1 between workshop participants: κw = 0.50/0.17/0.78 [mean/minimum/maximum] κw scoring 2 between workshop participants: κw = 0.64/0.41/0.82). In addition, the respective pairs of workshop participants and instructors revealed a higher agreement than between workshop participants (κw scoring 1 between workshop participants and instructors: κw = 0.62/0.33/0.84 [mean/minimum/maximum]; κw scoring 2 between workshop participants: κw = 0.74/0.55/0.85) (21). This is also consistent with the findings from our study: examiners 1 and 6, who both had the longest experience in body condition scoring at SAC and could thus be compared with the instructors from the study by Kristensen et al. (21), had the highest kappa values compared to the other examiners.
However, when comparing the BCS in SAC to the BCS in cows, it is important to note that the BCS in cows involves multiple body regions, which enables a more precise awarding of 0.25 score points (18). In our study, where BCS was only assessed by palpation of the lumbar spine, such a precision cannot be achieved under practical conditions (9). The comparison to previous studies in sheep (22, 24), where the BCS was assessed in a similar manner, therefore seems more apt. The influence of different examiners concerning other body regions needs to be studied separately. This is supported by the findings of Zielke et al. (28) who found differences in the inter-rater reliability of BCS assessed in different body regions in bisons (28).
Since only inter-rater reliability of the BCS in SAC was evaluated in our study, intra-rater reliability has so far not been taken into account. The latter describes how reproducible the assessment of the BCS in an animal by the same examiner is. Intra-rater reliability of the BCS in cows and sheep has been studied by different research groups so far (20–24, 27, 32). Data on intra-rater reliability from ruminants suggest that more experienced examiners achieve higher kappa values than less experienced examiners (20, 21). This still remains to be tested for SAC. Kristensen et al. (21) also concluded that even limited training can lead to a significant improvement in validity and precision in the assessment of BCS (21).
Approaches for BCS assessment are not only available for the New World camelids but also for the Old World camelids in which different regions of the body, including the hump, are included (33–36). To date, there have been no studies on how reproducible the results are for assessing BCS in Old World camelids. Since the BCS could also provide an important indication of nutritional status and possible infections with gastrointestinal endoparasites in both New and Old World camels, the accuracy and repeatability of the BCS should also be investigated more closely in these species.
In conclusion, our findings indicate that the assessment of the BCS at the lumbar spine in SAC is a quite reproducible examination method, even when it is performed by different examiners. Our data as well as the results from other studies support the assumption that reproducibility increases with training and experience. If BCS is assessed regularly by staff involved in husbandry and veterinary care of SAC, emaciation as a sign of disease, stress, or lack of management can be detected at an early stage and appropriate measures of intervention can be taken in time.
Statements
Data availability statement
The original contributions presented in the study are included in the article/supplementary material, further inquiries can be directed to the corresponding author.
Ethics statement
Ethical review and approval were not required for the animal study because all data used for this study were collected during the clinical examination of the animals for diagnosis of a veterinary herd problem. Written informed consent was obtained from the owners for the participation of their animals in this study.
Author contributions
MGW wrote the manuscript, the manuscript was reviewed by JS, NO, AT, FK, and MG, data were collected by MGW, JS, NO, AT, and FK, and data were evaluated by FK and MGW. The study was designed by MGW and supervised by MG and FK. All authors read and approved the final manuscript.
Funding
This Open Access publication was funded by the Deutsche Forschungsgemeinschaft (DFG, German Research Foundation)–491094227 Open Access Publication Funding and the University of Veterinary Medicine Hannover, Foundation.
Acknowledgments
The authors also gratefully acknowledge the help of Stefan Germann for the good cooperation and help with the examination of the animals, and Frances Sherwood-Brock, English Editorial Office, University of Veterinary Medicine Hannover, Foundation for proofreading the manuscript to ensure correct English.
Conflict of interest
The authors declare that the research was conducted in the absence of any commercial or financial relationships that could be construed as a potential conflict of interest.
Publisher’s note
All claims expressed in this article are solely those of the authors and do not necessarily represent those of their affiliated organizations, or those of the publisher, the editors and the reviewers. Any product that may be evaluated in this article, or claim that may be made by its manufacturer, is not guaranteed or endorsed by the publisher.
References
1.
NeubertSvon AltrockAWendtMWagenerMG. Llama and alpaca management in Germany—results of an online survey among owners on farm structure, health problems and self-reflection. Animals. (2021) 11:102. 10.3390/ani11010102
2.
DavisRKeebleEWrightAMorganK. South American camelids in the United Kingdom: population statistics, mortality rates and causes of death. Veterinary Record. (1998) 142:162–6. 10.1136/vr.142.7.162
3.
Hengrave BurriIMartigJSagerHLiesegangAMeylanM. South American camelids in Switzerland. I Population, management and health problems. Schweizer Archiv für Tierheilkunde. (2005) 147:325–34. 10.1024/0036-7281.147.8.325
4.
WagnerHUlrichLLeisenAWehrendA. Population structure of South American camelids in Germany. Tierarztl Prax Ausg G Grosstiere Nutztiere. (2022) 50:237–49. 10.1055/a-1899-5786
5.
WagenerMGNeubertSPunsmannTMWiegandSBGanterM. Relationships between body condition score (BCS), FAMACHA©-score and haematological parameters in alpacas (Vicugna pacos), and Llamas (Lama glama) presented at the veterinary clinic. Animals. (2021) 11:2517. 10.3390/ani11092517
6.
Van SaunRJ. Nutritional requirements and assessing nutritional status in camelids. Vet Clin Food Anim. (2009) 25:265–79. 10.1016/j.cvfa.2009.03.003
7.
Van SaunRJ. Nutritional diseases of llamas and alpacas. Vet Clin Food Anim. (2009) 25:797–810. 10.1016/j.cvfa.2009.07.013
8.
FrezzatoGStellettaCMurilloCEPSimonatoGCassiniR. Parasitological survey to address major risk factors threatening alpacas in Andean extensive farms (Arequipa, Peru). J Vet Med Sci. (2020) 82:1655–61. 10.1292/jvms.20-0253
9.
WagenerMGGanterM. Body condition scoring in South American camelids. Prakt Tierarzt. (2020) 101:684–96. 10.2376/0032-681X-2020
10.
JohnsonLW. Llama nutrition. Vet Clin North Am Food Animal Practice. (1994) 10:187–201. 10.1016/S0749-0720(15)30554-5
11.
HiltonCPughDWrightJWaldridgeBSimpkinsSHeathA. How to determine and when to use body weight estimates and condition scores in llamas. Vet Med. (1998) 93:1015–8.
12.
BromageG. “Feeding and nutrition,” In: G. Bromage, editor Llamas and Alpacas: A Guide to Management. Ramsbury, Marlboroug: The Crowood Press Ltd. (2006). p. 34–45.
13.
JonesMBoileauM. Camelid herd health. Vet Clin Food Anim. (2009) 25:239–63. 10.1016/j.cvfa.2009.02.006
14.
FowlerME. “Feeding and nutrition,” In: Fowler ME, editor. Medicine and Surgery of South American Camelids. 3rd ed. Ames, Iowa: Blackwell Publishing (2010). p. 17–58. 10.1002/9781118785706.ch2
15.
Van SaunRJHerdtT. “Nutritional assessment,” In: Cebra C, Anderson D, Tibary A, Van Saun R, Johnson, LR, editors. Llama and Alpaca Care: Medicine, Surgery, Reproduction, Nutrition, and Herd Health.St. Louis, MO: Elsevier Saunders (2014). p. 100–123. 10.1016/B978-1-4377-2352-6.00012-2
16.
Australian Alpaca Association. (2008). Available online at: https://alpacalibrary.com/media/blogs/husbandry-for-beginners/quick-uploads/p177/alpaca_fact_sheet_4_body_condition_sep_2013.pdf?mtime=1525215224 (accessed December 17, 2022).
17.
MarkusfeldOGalonNEzraE. Body condition score, health, yield and fertility in diary cows. Vet Rec. (1997) 141:67–72. 10.1136/vr.141.3.67
18.
FergusonJDGalliganDTThomsenN. Principal descriptors of body condition score in Holstein cows. J Dairy Sci. (1994) 77:2695–703. 10.3168/jds.S0022-0302(94)77212-X
19.
KleiböhmerGHeuwieserWBergmannJOchsmannA. Body condition scoring of cows - accuracy and learning the method. Praktischer Tierarzt. (1998) 79:50–61.
20.
PothmannHErlenAPichlerMHuberJDrillichM. Relationship and repeatability of body condition scoring and backfat thickness measurement in dairy cows by different investigators. Berl Munch Tierarztl Wochenschr. (2015) 128:319–25. 10.2376/0005-9366-128-319
21.
KristensenEDueholmLVinkDAndersenJJakobsenEIllum-NielsenSet al. Within-and across-person uniformity of body condition scoring in Danish Holstein cattle. J Dairy Sci. (2006) 89:3721–8. 10.3168/jds.S0022-0302(06)72413-4
22.
PhythianCJHughesDMichalopoulouECrippsPJDuncanJS. Reliability of body condition scoring of sheep for cross-farm assessments. Small Ruminant Res. (2012) 104:156–62. 10.1016/j.smallrumres.2011.10.001
23.
KeinprechtHPichlerMPothmannHHuberJIwersenMDrillichM. Short term repeatability of body fat thickness measurement and body condition scoring in sheep as assessed by a relatively small number of assessors. Small Ruminant Res. (2016) 139:30–8. 10.1016/j.smallrumres.2016.05.001
24.
Corner-ThomasRSewellAKempPWoodBGrayDBlairHet al. Body condition scoring of sheep: intra-and inter-observer variability. New Zealand J Animal Sci Prod. (2020) 80:107–12.
25.
de RaadtAWarrensMJBoskerRJKiersHAL. A comparison of reliability coefficients for ordinal rating scales. J Classification. (2021) 38:519–43. 10.1007/s00357-021-09386-5
26.
GaulyM. “Fütterung,” In: Gauly M, Vaughan J, Cebra C, editors. Neuweltkameliden– Haltung, Zucht, Erkrankungen. 4th ed.Stuttgart: Thieme (2018). p. 46–67. 10.1055/b-005-145257
27.
KenyonPMaloneySBlacheD. Review of sheep body condition score in relation to production characteristics. New Zealand J Agric Res. (2014) 57:38–64. 10.1080/00288233.2013.857698
28.
ZielkeLWrage-MönnigNMüllerJ. Development and assessment of a body condition score scheme for European bison (Bison bonasus). Animals. (2018) 8:163. 10.3390/ani8100163
29.
SchoberPBoerCSchwarteLA. Correlation coefficients: appropriate use and interpretation. Anesthesia Analgesia. (2018) 126:1763–8. 10.1213/ANE.0000000000002864
30.
AbdiH. “The Kendall rank correlation coefficient,” In: Salkind N, editor. Encyclopedia of measurement and statistics.Thousand Oaks: Sage (2007). p. 508–10.
31.
LandisJRKochGG. The measurement of observer agreement for categorical data. Biometrics. (1977) 33:159–74. 10.2307/2529310
32.
CalavasDSulpicePLepetitcolinEBugnardF. Assessing the accuracy of the practice of a method of scoring the body condition of ewes within a professional framework. Vet Res. (1998) 29:129–38. 10.1016/S0921-4488(97)00117-X
33.
FayeBBengoumiMCleradinATabaraniAChilliardY. Body condition score in dromedary camel: a tool for management of reproduction. Emirates J Agric Sci. (2001) 13:01–6. 10.9755/ejfa.v12i1.5193
34.
IglesiasCNavasFCianiEArbuluAAGonzálezAMarínCet al. Zoometric characterization and body condition score in Canarian camel breed. Archivos de zootecnia. (2020) 69:14–21. 10.21071/az.v69i265.5034
35.
MenchettiLZappaterraMNanni CostaLPadalinoB. Application of a protocol to assess camel welfare: scoring system of collected measures, aggregated assessment indices, and criteria to classify a pen. Animals. (2021) 11:494. 10.3390/ani11020494
36.
PadalinoBMenchettiL. The first protocol for assessing welfare of camels. Front Vet Sci. (2021) 7:631876. 10.3389/fvets.2020.631876
Summary
Keywords
emaciation, clinical score, inter-rater reliability, nutrition, herd management, endoparasitosis, camelids
Citation
Wagener MG, Schregel J, Ossowski N, Trojakowska A, Ganter M and Kiene F (2023) The influence of different examiners on the Body Condition Score (BCS) in South American camelids—Experiences from a mixed llama and alpaca herd. Front. Vet. Sci. 10:1126399. doi: 10.3389/fvets.2023.1126399
Received
17 December 2022
Accepted
16 January 2023
Published
03 February 2023
Volume
10 - 2023
Edited by
Abdelmalik Ibrahim Khalafalla, Abu Dhabi Agriculture and Food Safety Authority (ADAFSA), United Arab Emirates
Reviewed by
Michael Robert Hässig, University of Zurich, Switzerland; Bernard Faye, Institut National de la Recherche Agronomique (INRA), France
Updates
Copyright
© 2023 Wagener, Schregel, Ossowski, Trojakowska, Ganter and Kiene.
This is an open-access article distributed under the terms of the Creative Commons Attribution License (CC BY). The use, distribution or reproduction in other forums is permitted, provided the original author(s) and the copyright owner(s) are credited and that the original publication in this journal is cited, in accordance with accepted academic practice. No use, distribution or reproduction is permitted which does not comply with these terms.
*Correspondence: Matthias Gerhard Wagener ✉ matthias.gerhard.wagener@tiho-hannover.de
This article was submitted to Veterinary Epidemiology and Economics, a section of the journal Frontiers in Veterinary Science
Disclaimer
All claims expressed in this article are solely those of the authors and do not necessarily represent those of their affiliated organizations, or those of the publisher, the editors and the reviewers. Any product that may be evaluated in this article or claim that may be made by its manufacturer is not guaranteed or endorsed by the publisher.