 Sebastiano Busato
 Hunter R. Ford
 Alzahraa M. Abdelatty
 Charles T. Estill1,3
 Massimo Bionaz
- 1Department of Animal and Rangeland Sciences, Oregon State University, Corvallis, OR, United States
- 2Department of Nutrition and Clinical Nutrition, Faculty of Veterinary Medicine, Cairo University, Giza, Egypt
- 3College of Veterinary Medicine, Oregon State University, Corvallis, OR, United States
Metabolic challenges experienced by dairy cows during the transition between pregnancy and lactation (also known as peripartum), are of considerable interest from a nutrigenomic perspective. The mobilization of large amounts of non-esterified fatty acids (NEFA) leads to an increase in NEFA uptake in the liver, the excess of which can cause hepatic accumulation of lipids and ultimately fatty liver. Interestingly, peripartum NEFA activate the Peroxisome Proliferator-activated Receptor (PPAR), a transcriptional regulator with known nutrigenomic properties. The study of PPAR activation in the liver of periparturient dairy cows is thus crucial; however, current in vitro models of the bovine liver are inadequate, and the isolation of primary hepatocytes is time consuming, resource intensive, and prone to errors, with the resulting cells losing characteristic phenotypical traits within hours. The objective of the current study was to evaluate the use of precision-cut liver slices (PCLS) from liver biopsies as a model for PPAR activation in periparturient dairy cows. Three primiparous Jersey cows were enrolled in the experiment, and PCLS from each were prepared prepartum (−8.0 ± 3.6 DIM) and postpartum (+7.7± 1.2 DIM) and treated independently with a variety of PPAR agonists and antagonists: the PPARα agonist WY-14643 and antagonist GW-6471; the PPARδ agonist GW-50156 and antagonist GSK-3787; and the PPARγ agonist rosiglitazone and antagonist GW-9662. Gene expression was assayed through RT-qPCR and RNAseq, and intracellular triacylglycerol (TAG) concentration was measured. PCLS obtained from postpartum cows and treated with a PPARγ agonist displayed upregulation of ACADVL and LIPC while those treated with PPARδ agonist had increased expression of LIPC, PPARD, and PDK4. In PCLS from prepartum cows, transcription of LIPC was increased by all PPAR agonists and NEFA. TAG concentration tended to be larger in tissue slices treated with PPARδ agonist compared to CTR. Use of PPAR isotype-specific antagonists in PCLS cultivated in autologous blood serum failed to decrease expression of PPAR targets, except for PDK4, which was confirmed to be a PPARδ target. Transcriptome sequencing revealed considerable differences in response to PPAR agonists at a false discovery rate-adjusted p-value of 0.2, with the most notable effects exerted by the PPARδ and PPARγ agonists. Differentially expressed genes were mainly related to pathways involved with lipid metabolism and the immune response. Among differentially expressed genes, a subset of 91 genes were identified as novel putative PPAR targets in the bovine liver, by cross-referencing our results with a publicly available dataset of predicted PPAR target genes, and supplementing our findings with prior literature. Our results provide important insights on the use of PCLS as a model for assaying PPAR activation in the periparturient dairy cow.
Introduction
Dairy cows experience drastic metabolic challenges during the peripartum, the period encompassing 3 weeks before to 3 weeks after calving. A decrease in feed intake, combined with a sharp increase in energy demands dictated by the rapidly changing metabolic landscape, result in a state of energetic deficiency. This status is counterbalanced by the mobilization of non-esterified fatty acids (NEFA) that are used as energy (1, 2). At the crux of these metabolic changes is the liver, as the central organ for gluconeogenesis and lipid metabolism, contributing to the maintenance of energy homeostasis (3). In particular, during the early postpartum hepatic uptake and metabolism of NEFA sharply increase (4). In the liver, absorbed NEFA are either oxidized or esterified into triacylglycerols (TAG) that are stored in the tissue or secreted back into circulation through very low density lipoproteins (VLDL) (4). Ruminants, and particularly cattle, are biologically predisposed to secrete TAG in VLDL at a lower rate than other species (5); consequently, increases in circulating NEFA can result in steatosis in the liver, significantly limiting hepatic function at a time when it is the most crucial (6). Further, partial oxidation of NEFA leads to the production of ketones, including β-hydroxybutyrate, supraphysiological levels of which (>3.0 mmol/L) lead to clinical ketosis, with detrimental effects on the animal (7). Thus, it is not surprising that studies on the biology of the periparturient dairy cow focus particularly on liver activity, metabolites, and liver-specific pathways.
Perhaps counterintuitively, evidence shows that energy restriction in prepartum improves the ability of the liver to cope with postpartum stressors, leading to lower postpartum NEFA, total hepatic lipids and TAG, when compared to overfed cows (8), or cows fed ad libitum (9). From a molecular standpoint, prepartum feed restriction in dairy cows leads to greater hepatic NEFA uptake and intracellular transport postpartum (10), increases gluconeogenic capacity (11, 12), as well as the expression of genes involved in lipid metabolism (11). Early regulation of pathways related to energy homeostasis and lipid metabolism in the liver may “prime” the organ, and lead to a quicker metabolic response in the early postpartum, contributing to the underrepresentation of pathophysiological conditions; in this context, the role of the Peroxisome Proliferator-activated Receptors (PPAR) could be crucial (13).
PPAR are a group of transcriptional regulators that belong to the nuclear receptor superfamily, of which three isotypes are known and characterized: PPARα, PPARδ, and PPARγ (14). In bovine, expression of PPARα is detected primarily in the liver, while PPARγ is highly abundant in the adipose tissue, and PPARδ is rather ubiquitously expressed (13, 15). PPAR activity, dependent on intracellular concentration of suitable ligands, is known to be modulated by fatty acids and their metabolites (14). Broadly speaking, genes that were identified as PPAR targets code for proteins involved in fatty acid metabolism in the liver, lipid catabolism and insulin sensitivity in the adipose tissue, and in regulation of inflammation and the immune response (13). Crucially, some of the genes upregulated by energy restriction and/or the transition from pregnancy to lactation are targets of PPAR (16), which suggest a strong involvement of PPAR in the hepatic response to metabolic changes in the peripartum. Recently our group showed that, in immortalized mammary, liver, and endothelial bovine cells, PPAR activity is strongly induced by NEFA present in blood serum of early lactation Jersey cows (17). Our results support the hypothesis that a moderate increase in circulating NEFA prepartum, brought forth by energy restriction, improves hepatic fitness postpartum through activation of PPAR.
The study of hepatic metabolism and gene expression in vitro can aid in the quantification of parameters of interest with remarkable precision. Currently, the gold standard for cell-based hepatic studies is the isolation and purification of parenchymal cells (hepatocytes) using a two-step perfusion method on either whole liver or the caudate lobe alone (18). While feasible in smaller species, whole-liver or single-lobe isolation of hepatocytes in livestock remains incredibly impractical, with relatively low viability and rapid phenotype loss in culture (19, 20). An alternative can be the use of hepatic cells isolated from newborn calves (21–24); however, extrapolation of results to hepatic metabolism of periparturient dairy cows is problematic, as from a biological standpoint liver of newborn calves is radically different than the liver of an adult cow (25).
A valuable alternative could be the use of precision-cut liver slices (PCLS), obtained through precise dissection of cylindrical liver samples under conditions that facilitate cell survival and allow maintenance of tissue morphology. As demonstrated in other species, PCLS can be a valuable tool to estimate hepatic lipid metabolism (26) and transcriptomic changes (27) ex vivo. However, the adoption of PCLS as a research tool for ruminants remains low. To the best of our knowledge, no published manuscript utilizes PCLS culture to study whole-transcriptome changes in the bovine liver.
The objective of the present study was to evaluate the feasibility of using PCLS obtained from periparturient dairy cows to assess activation of PPAR via transcriptomics-based approaches and identify PPAR target genes in bovine. We hypothesize that culture and treatment of PCLS with known PPAR agonists and antagonists would result in measurable changes in gene expression, the identification of which could shed light on the consequences of greater PPAR activation in the peripartum.
Materials and Methods
Animals and Collection of Blood and Liver Tissue
Experimental procedures used in this study were approved by the Institutional Animal Care and Use Committee (IACUC) of Oregon State University (protocol# 4894). Liver biopsies were performed on four primiparous Jersey cows; however, one cow had to be removed from the study (see RT-qPCR). The biopsy was performed both during prepartum (−8.0 ± 3.6 DIM, henceforth referred to as “−10 DIM”) and postpartum (+7.7 ± 1.2 DIM, henceforth referred to as “+10 DIM”). The area selected for puncture was clipped, and decontaminated using povidone iodine medical scrub (055478, Covetrus, OH, USA) followed by a solution of 75% ethanol, applied with a surgical gauze (100-1444, Henry Schein, NY, USA). A small incision was made using a #10 surgical blade (327-1504, Integra Miltex, PA, USA), and a 6 mm i.d. trocar was used to collect liver tissue up to 3 times until sufficient tissue was obtained (~500–800 mg). The tissue was immediately transferred to a sterile tissue culture dish (351029, Corning Falcon, NY, USA), rinsed immediately in sterile phosphate buffered saline (25-508P, Genclone, CA, USA), and transferred to a 50 mL conical tube containing ice-cold Krebs-Henseleit buffer [KHB, prepared as previously described (28)] until further processing. Liver samples were transported from the collection site to the laboratory within 1 h. Pre-prandial blood samples were collected from each animal immediately before the liver biopsy, using Vacutainer blood collection tubes without anti-coagulants (366430, Becton, Dickinson and Company, NJ, USA). Samples were allowed to coagulate at room temperature for no <30 min. The serum was separated by centrifugation (15 min, 1,500 × g, 25°C), and kept at room temperature until all the liver slices were prepared (<1 h).
PCLS Preparation and Culture
PCLS were prepared following the protocol developed by De Graaf and collaborators (28), with few modifications. Briefly, liver tissue samples were transported to the laboratory in ice-cold KHB; upon arrival, they were immediately embedded in low temperature gelling ultrapure agarose (16500-100, Invitrogen, CA, USA) inside an 8 mm mold-plunger assembly (MD2200, tissue embedding unit, Alabama Research & Development, AL, USA). The plunger with the embedded tissue was then transferred to a Krumdieck Tissue Slicer (MD1000-A1, Alabama Research & Development, AL, USA), pre-filled with ice-cold KHB; slice thickness was set at 280–300 μm, with a cycle speed of ~35 and using the “intermittent blade mode”. Slices were then collected and placed on a new tissue culture dish, prefilled with a minimum amount of cold KHB to prevent dehydration. A total of 36 PCLS were selected for each animal at each timepoint, evaluating visually to identify those with the a clear circular shape, and without holes or patent morphological irregularities. The 36 PCLS were thus transferred to three 12-well culture plates (665180, Greiner Bio One, NC, USA) and the treatments were applied in duplicates. In Plates 1 and 2, PCLS were cultured in William's Medium E (WME, A1217601, Gibco, Thermo Fisher Scientific, MA, USA), supplemented with GlutaMAX (35050-061, Gibco, NY, USA), 14 mM of D-glucose monohydrate (0643-1KG, VWR, OH, USA), and 50 μg/mL of gentamycin (15750060, Life Technologies, OR, USA). Within the plate, PCLS were treated with 100 μM of the PPARα agonist WY-14643 (70730, Cayman Chemicals, MI, USA), 50 μM of the PPARδ agonist GW-501516 (ALX-420-032-M005, Enzo, NY, USA), or 100 μM of the PPARγ agonist rosiglitazone (R0106, TCI, OR, USA); 200 μM of palmitic acid (100905, MP Biomedicals, CA, USA) or 100 μM of serum NEFA, isolated via solid phase extraction as previously described (17). Palmitate was supplied unbound from albumin to mimic a local concentrated release (17). WY-14643 concentration was selected based on prior reports (29); additionally, according to our findings in an immortalized model of bovine liver (17), the dose-dependent response to PPARα and PPARγ was similar (hence the 100 μM concentration of both WY and rosiglitazone), while PPARδ modulation was about twice as sensitive (hence the 50 μM dose for GW-501516). Additionally, peak PPAR activation for palmitic acid was achieved at 200 μM. The concentration of NEFA was chosen to mimic the physiological concentration of NEFA in the lactating dairy cow. In Plate 3, PCLS from each cow were cultured in blood serum isolated from the same cow on the day of the liver biopsy; PPAR antagonists were added at 50 μM in duplicates to the wells: for PPARα, GW-6471 (9453, CAS# 880635-03-0, BioVision incorporated, CA, USA); for PPARδ, GSK-3787 (3961/10, CAS# 188591-46-0, Tocris, Bio-Techne Corporation, MN, USA); for PPARγ, GW-9662 (70785, CAS# 22978-25-2, Cayman Chemicals, MI, USA). Additionally, palmitic acid and serum NEFA were also supplemented with doses as in Plates 1 and 2. All treatments were adjusted for the vehicle (DMSO, D2438, Millipore Sigma, MO, USA) at a volume of 0.8%. Plates were placed in a modular incubator chamber (MIC-101, Billups-Rothenberg, CA, USA), clamped shut, and flushed with carbogen (95% O2, 5% CO2) for 10 min. The modular chamber was placed inside a cell culture incubator, and atop a benchtop orbital shaker located inside of the incubator. The slices were incubated for 18 h at 37°C, ~100 rpm.
TAG Quantification
PCLS from Plate 1 were collected, and the two replicates for each treatment were pooled. Slices were homogenized using a handheld tissue homogenizer (850101019999, Scilogex, CT, USA), and whole-homogenate TAG were measured according to the manufacturer's instructions (10010303, Cayman Chemicals, MI, USA). A small amount of tissue homogenate from the first dilution was retained separately, and protein concentration was assessed using a Pierce BCA Protein Assay Kit (23225, Thermo Scientific, MA, USA), following the manufacturer's instructions. Assayed TAG concentration was normalized to the protein concentration.
RNA Sequencing and RT-qPCR
RNA Isolation
PCLS from Plates 2 and 3 were collected after incubation, and transferred to separate screw-cap vials (490003-520, VWR, PA, USA), pre-filled with 600 μL of ice-cold TRIzol reagent (15596026, Thermo Scientific, MA, USA) and two 3.2 mm beads, homogenized using a Geno/Grinder Automated Tissue Homogenizer (2010-115, SPEX SamplePrep, NJ, USA; courtesy of the Department of Crop and Soil Sciences, Oregon State University, OR, USA). The tissue was disrupted in short burst (45 s) at 1,500 rpm, followed by incubation on ice for 3 min; the disruption-incubation cycle was repeated up to three times, or until no tissue pieces were visible within the tubes. Immediately after disruption, 120 μL of pre-chilled chloroform was added to the tube, and the samples were mixed by inverting the tube, and incubated on ice for 5 min. After incubation, the samples were transferred to a new 1.7 mL microcentrifuge tube, and centrifuged at 4°C for 15 min, 15,000×g. The upper-phase supernatant (~200 μL) was collected and RNA was purified using a Mag-MAX-96 Total RNA Isolation Kit (AM1830, Invitrogen, MA, USA) following the manufacturer's instructions, with minor modifications: briefly, 100 μL of each sample was transferred to the first row (A) of a 96-Well DeepWell Storage Plate (260251, Thermo Scientific, MA, USA). Rows B-F contained reagents supplied with the kit: 20 μL of the magnetic beads mix (row B), 150 μL of wash solution 1 (row C), 150 μL of wash solution 2 (row D), and 50 μL of DNAse-RNAse free water (VWRL0201-0500, VWR, PA, USA) in rows E and F. A suitable protocol was then generated to mimic the manufacturer's protocol with a KingFisher Duo Purification System (5400110, Thermo Scientific, MA, USA). Eluted RNA was measured using a SpectraDrop Micro-Volume Microplate in a SpectraMax plus 384 spectrophotometer (89212-396, Molecular Devices, CA, USA). Average 260/230 and 260/280 ratios were 2.06 ± 0.24 and 1.69 ± 0.27, respectively. RNA integrity was assessed by the Center for Genome Research and Bioinformatics at Oregon State University using an Agilent Bioanalyzer 2100 (G2939BA, Agilent, CA, USA). For one animal, the RIN for the +10 DIM PCLS was below 3. Further, principal component analysis of RNAseq data revealed that animal to be a clear outlier and was removed from the study. Upon removal of that animal, resulting RNA integrity numbers were 7.26 ± 0.64 (mean ± SD).
RT-qPCR
Complementary DNA (cDNA) synthesis, PCR, and data analysis using LinRegPCR were performed as previously described (25). Primers used in this study are listed in Supplementary Table S1; all primers not sourced from a prior study were assessed by amplifying a mixture of bovine cDNA, and the resulting amplicon was sequenced by the Center for Genome Research and Bioinformatics (currently Center for Quantitative Life Sciences) at Oregon State University using an ABI 3730 capillary sequencer machine. Amplicons were aligned against the bovine genome using NCBI Basic Local Alignment Search Tool (BLAST) (30) to ensure specificity. Selection of internal control genes was accomplished using GeNorm (31). Potential reference genes GAPDH, MRPL39 and UXT were tested via GeNorm. Results from GeNorm indicated that the geometrical mean of those 3 reference genes provided a robust normalization (V2/3 < 0.18).
Library Preparation and Sequencing
RNA isolated from PCLS from postpartum animals cultivated in William's E Medium and treated with the three isotype-specific PPAR agonists, as well as the control group, were sent to the Center for Genome Research and Bioinformatics at Oregon State University for high-throughput sequencing. Library construction was obtained using a QuantSeq 3' mRNA-Seq Library Prep Kit FWD for Illumina (015.96, Lexogen, NH, USA). Sequencing was performed on an Illumina HiSeq3000 platform, at 60 samples/lane. The raw reads have been deposited (GEO accession number GSE183063).
Quality Control and Differential Gene Expression Analysis
Quality control was assayed using MultiQC v1.8 (32) (https://multiqc.info/). Reads were then trimmed based on PHRED score and adapter presence using TRIMMOMATIC v0.39 (33) (https://github.com/usadellab/Trimmomatic) with arguments LEADING:5 TRAILING:5 SLIDINGWINDOW:4:5 MINLEN:3. A genome index was generated using the ARS-UCD1.2 Bos Taurus genome (http://ftp.ensembl.org/pub/release-104/fasta/bos_taurus/dna/) and the ARS-UCD1.2.104 annotation (http://ftp.ensembl.org/pub/release-104/gtf/bos_taurus/), using the genomeGenerate function of STAR v2.7.1 (34) (https://github.com/alexdobin/STAR). Trimmed reads were aligned against the reference genomic index using STAR, and the average overall alignment rate was 85.46%. Aligned.sam files were sorted and converted to.bam using samtools v1.0 (35) (https://github.com/samtools/samtools), and gene count matrices were generated using stringtie v 2.0 (https://ccb.jhu.edu/software/stringtie/).
Differential expression was determined using the DESeq2 package, v1.30.1 (36) (https://bioconductor.org/packages/release/bioc/html/DESeq2.html) in R v3.9, after filtering for low counts (any transcript with raw count ≤ 4). Three contrasts were generated (PPARA agonist vs. CTR, PPARD agonist vs. CTR, and PPARG agonist vs. CTR) and DEG were considered significant with an FDR-adjusted p-values below 0.2.
Bioinformatics Analyses: Ontology and Function
Functional analysis was performed using the Dynamic Impact Approach (37), as well as DAVID (38) (https://david.ncifcrf.gov/). Figures regarding functional analysis results were generated using the ggplot2 R package v3.3.3 (https://ggplot2.tidyverse.org/reference/ggplot.html), and treemaps using REVIGO (39) (http://revigo.irb.hr/).
To discriminate between actual gene targets of PPAR and genes that are differentially expressed in response to the treatment but not regulated by PPAR, we cross-referenced our results with the publicly available PPARgene database (http://www.ppargene.org/). This resource provides a comprehensive list of 2,683 predicted targets, based on a logistic regression model that utilizes both experimental high-throughput sequencing data and the degree of conservation of the PPAR binding site within the human and mouse genome (40). A prediction score from 0 to 1 is assigned to each gene, with the authors defining a value below 0.6 as “low confidence”, between 0.6 and 0.8 as “medium confidence”, and between 0.8 and 1 as “high confidence”. We extracted only medium and high confidence genes from the dataset to reduce potential confounding factors.
Statistical Analysis
Normalized RT-qPCR data were log2 transformed prior statistical analysis. Data were checked for outliers using PROC REG of SAS and datapoints with a studentized-t >2.8 were removed. Statistical analysis was performed as four separated datasets: PCLS from prepartum cows cultivated in artificial media; PCLS from prepartum cows cultivated in blood serum; PCLS from postpartum cows cultivated in artificial media; and PCLS from postpartum cows cultivated in blood serum. Final datasets were analyzed using PROC GLIMMIX of SAS (v9.4, SAS, NC, USA) using treatment as explanatory variable and cow as random variable using the default covariate model. Postpartum TAG data were analyzed through PROC GLM of SAS (v9.4, SAS, NC, USA), using treatment as the only explanatory variable. In all cases, a p-value of 0.1 was considered as the threshold for tendencies and a p-value of 0.05 was set as the threshold for significance between the pairwise comparisons.
Results
RT-qPCR and TAG Quantification
In the first experiment we assessed the transcription of PPAR target genes upon treatment with various PPAR isotypes synthetic agonists in PCLS obtained from pre- and post-partum cows cultivated in synthetic media. In the same experiment we also treated PCLS with C16:0 and NEFA, both previously observed to be agonist of PPAR in bovine cells (17). The PCLS from each cow was treated with NEFA isolated from the same cow. Analysis of relative gene expression through RT-qPCR revealed minimal differences across treatments in the late prepartum (−10 DIM, Figure 1A), as well as the early postpartum (+10 DIM, Figure 1B). In the prepartum, transcription of LIPC was increased by all treatments except C16:0, with the highest effect observed for slices treated with a PPARδ agonist (GW-501516; 3.4-fold increase vs. untreated control). In the postpartum, treating liver slices with a PPARγ agonist (rosiglitazone) resulted in 2-fold increased transcription of ACADVL vs. untreated control. Treatment with GW-501516 increased expression of PDK4, LIPC, and PPARD. Only a tendency for higher TAG content in cells was observed in response to PPARδ agonist (Figure 2).
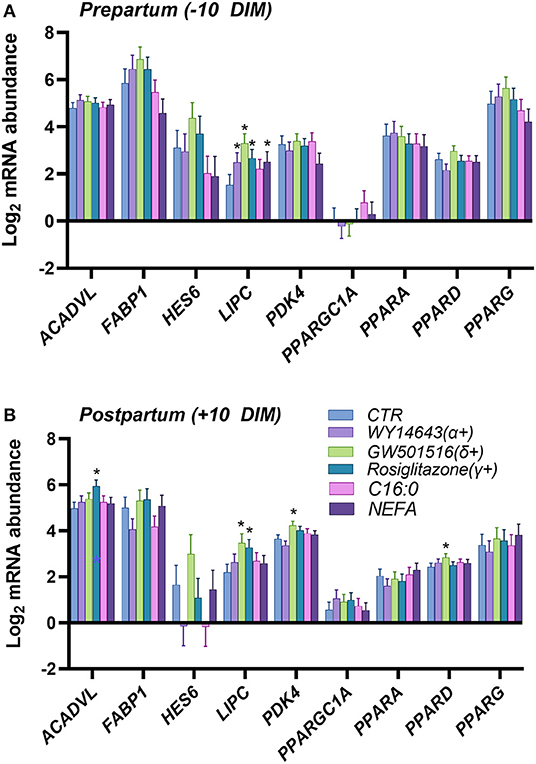
Figure 1. Relative normalized expression of ACADVL, FABP1, HES6, LIPC, PDK4, PGC1A, PPARA, PPARD and PPARG in response to synthetic PPAR agonists (100 μM WY-14643, a PPARα agonist; 50 μM GW-501516, a PPARδ agonist; and 100 μM Rosiglitazone, a PPARγ agonist), 200 μM palmitic acid, or 100 μM NEFA isolated from each respective animal, in PCLS obtained from prepartum [(A), −10 DIM] and postpartum [(B), +10 DIM] cows, and cultured for 18 h in William's Medium E. *indicates significant differences (P < 0.05) when compared to WME control.
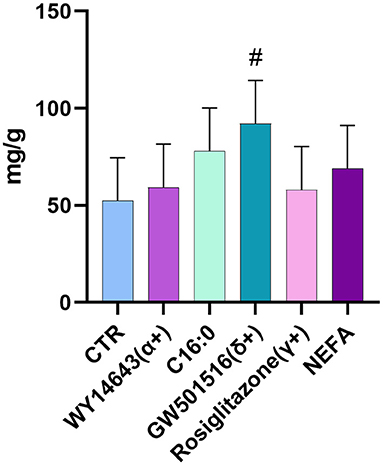
Figure 2. Amount of triacylglycerol in PCLS from postpartum cows (+10 DIM) treated with PPAR isotype-specific agonists (100 μM WY-14643, a PPARα agonist; 50 μM GW-501516, a PPARδ agonist; and 100 μM Rosiglitazone, a PPARγ agonist), 200 μM palmitic acid, or 100 μM NEFA isolated from each respective animal. Results are presented as fold change vs. each animal's control group (PCLS cultured in William's Medium E only). #indicates tendencies (P < 0.1) when compared to control. Incubation time was 18 h.
In a second experiment we assessed which PPAR isotype is activated by blood serum by using various PPAR isotype-specific antagonists with PCLS. Our assumption was that blood serum containing NEFA would activate PPAR. The dose of the antagonists was based on our prior work in immortalized bovine liver cells (17). We also treated cells with C16:0, to mimic supplementation of this fatty acid in live animals. As for the first experiment, we detected a minimal effect on transcription of genes, especially in the PCLS obtained from pre-partum cows. We did not observe any overlap between the two experiments. In the prepartum (Figure 3A), transcription of ACADVL was increased in response to C16:0. The addition of the PPARγ antagonist increased the expression of HES6 and PPARG, while the use of the PPARδ antagonist reduced the transcription of PDK4. In the postpartum (Figure 3B), treating liver slices with palmitic acid increased expression of FABP1, while the PPARδ antagonist significantly downregulated PDK4 and the PPARγ antagonist decreased transcription of LIPC and PPARGC1A.
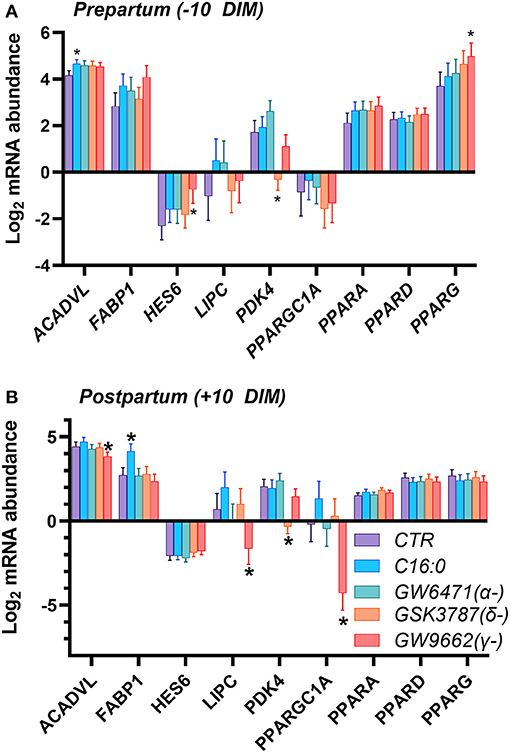
Figure 3. Relative normalized expression of ACADVL, FABP1, HES6, LIPC, PDK4, PGC1A, PPARA, PPARD and PPARG in response to synthetic PPAR antagonists (50 μM GW-6471, a PPARα antagonist; 50 μM GSK-3787, a PPARδ antagonist; and 50 μM GW-9662, a PPARγ antagonist) or 200 μM palmitic acid, in PCLS obtained from prepartum (A, −10 DIM) and postpartum (B, +10 DIM) cows, and cultured in blood serum. *Indicates significant differences (P < 0.05) when compared to serum control; Incubation time was 18 h.
RNA Sequencing and Functional Analysis
Differentially Expressed Genes
Gene expression profiling was performed through RNA sequencing for PCLS from postpartum animals (+10 DIM), which were treated with isotype-specific agonists for PPARα (WY-14643), PPARδ (GW-501516) and PPARγ (rosiglitazone). Complete dataset is available in Supplementary File 1.
Principal component analysis revealed considerable separation with minimal overlap between the treatment groups, suggesting moderate differences in the gene expression landscape (Supplementary Figure S1). Analysis through DESeq2 (Table 1) revealed a total of 140, 173, and 222 DEG with a cut-off of FDR-adjusted p-values = 0.1 by the PPARα, PPARδ, and PPARγ agonist, respectively. A more liberal cutoff of FDR-adjusted p-values = 0.2 indicated 308, 501, and 379 DEG by the PPARα, PPARδ, and PPARγ agonist, respectively. The latter statistical results were used for downstream analyses.
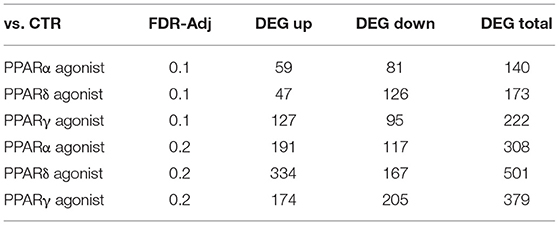
Table 1. List of differentially expressed genes in PCLS for the three comparisons of interest.
Dynamic Impact Approach
The Dynamic Impact Approach (DIA) analysis (Figure 4) revealed a large impact of both the PPARα and PPARδ agonists on KEGG categories related to metabolism, chiefly carbohydrate and lipid metabolism, all of which had a pattern toward activation of the pathways. Of note, though the impact of the PPARγ agonist on metabolism was lower than the other two PPAR agonists, a strong effect on lipid metabolism was maintained, also with a positive trend. Additionally, samples treated with the PPARγ agonist displayed a strong inhibitory effect on KEGG subcategories related to “Signaling Molecules and Interaction” and under the “Immune System” subcategory of pathways, while the other two PPAR agonists did not.
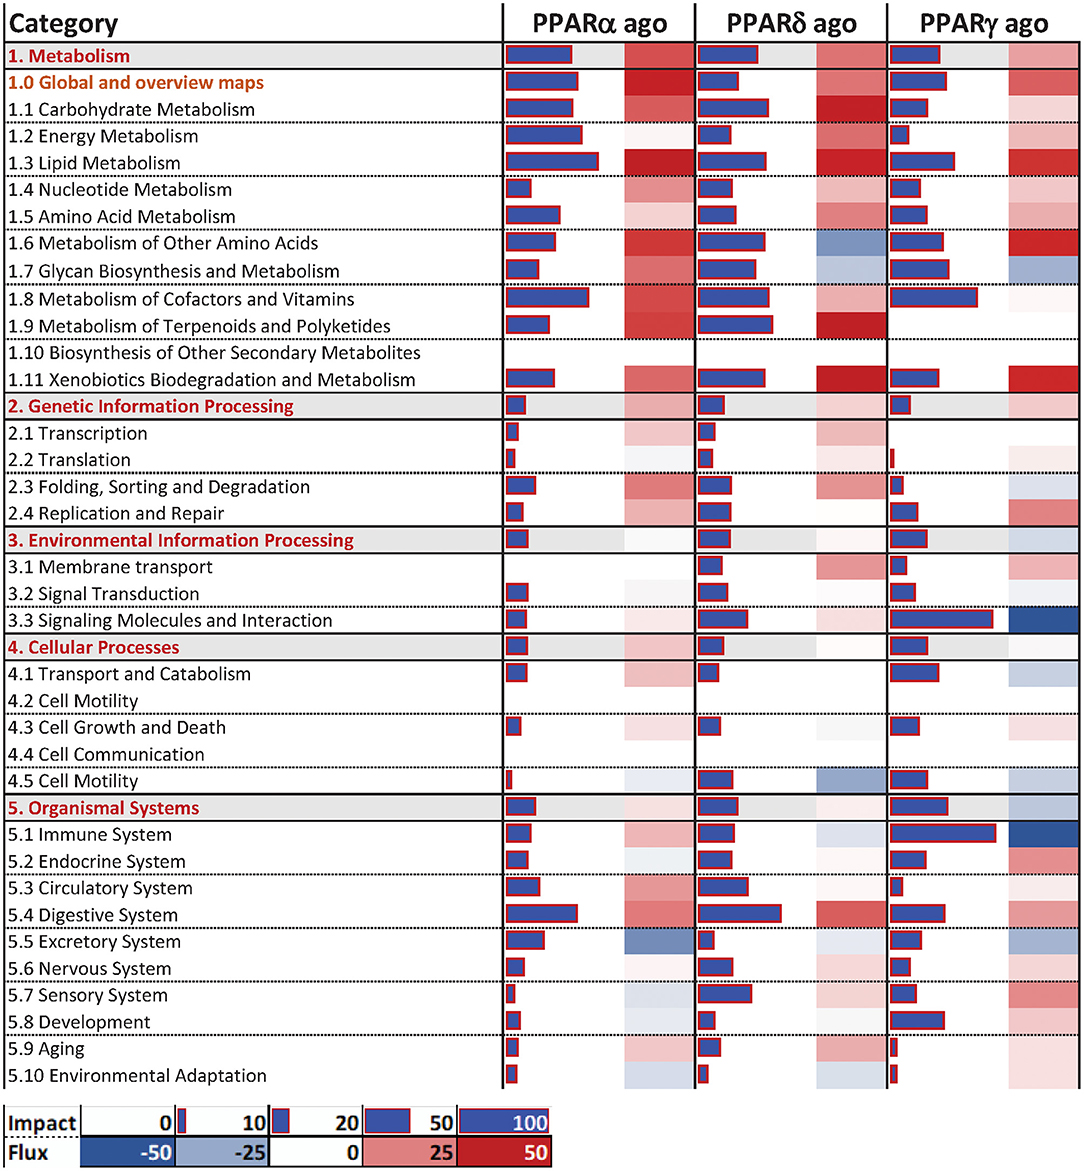
Figure 4. Main categories and subcategories of KEGG pathways induced via the use of isotype-specific PPAR agonists in PCLS, as summarized by the Dynamic Impact Approach. Blue bars refer to the impact in terms of overrepresented genes in the pathways, while the shaded cell denotes the flux, i.e., the overall effect on the pathway, with red denoting activation and green denoting inhibition.
In terms of individual pathways within the KEGG subcategories (Figure 5), for the “Carbohydrate Metabolism” subcategory, all three groups had a modest positive impact on “Pentose and glucuronate interconversions”, as well as “Glyoxylate and dicarboxylate metabolism”, and “Ascorbate and aldarate metabolism”. In the “Lipid Metabolism” subcategory, PPAR agonists had comparable positive impacts on “Metabolism of linoleic acid”, as well as “Fatty acid degradation” and the “Metabolism of ether lipids” (although to a lesser degree). Additionally, only the PPARα and PPARδ agonists induced the pathway “Synthesis and degradation of ketone bodies”. In the “Signaling Molecules and Interaction” and “Immune System” subcategories of KEGG pathways, the most consistent and noticeable effect was brought forth by the PPARγ agonist, moderately or strongly inhibiting signaling-related pathways such as “Cytokine-cytokine receptor interaction” and “Cell adhesion molecules”. Additionally, signaling of several immune-related receptors like the toll-like receptor (TLR), tumor necrosis factor (TNF), and RIG-I-like receptor and NOD-like receptor was inhibited. Further, the PPARγ agonist inhibited the “Antigen processing and presentation” and “Chemokine signaling” pathways.
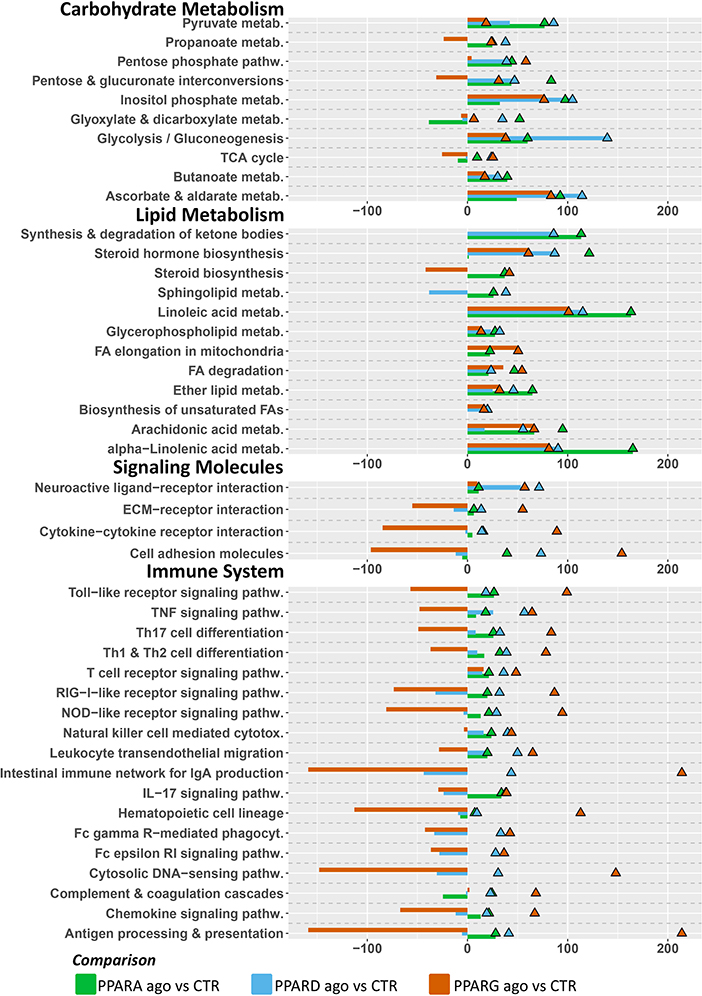
Figure 5. Main KEGG pathways highlighted by DIA, divided by subcategory. Triangles (color-coded) represent the impact in terms of overrepresented genes in the pathways, whereas bars (also color-coded) refer to the overall flux of the pathway, with negative numbers indicating inhibition of the pathway, and positive numbers indicating induction of the pathway.
DAVID
The analysis of enriched Gene Ontology (GO) terms by DAVID confirmed results from the DIA (Figure 6; Supplementary Figures S2–S7), where samples treated with a PPARγ agonist present an enrichment of the terms “T cell activation,” “response to cytokine,” “chemokine activity,” “immune response”, “inflammatory response,” and “immune system process” within the cohort of downregulated genes. Further, upregulated genes in response to the PPARδ agonist were overrepresented in the “TAG homeostasis” GO term.

Figure 6. Overrepresented gene ontology (GO) terms with a p-value <0.01, according to DAVID, by the three PPAR agonists. Pathways associated with positive numbers are overrepresented in the subset of genes significantly upregulated by the treatment, whereas pathways represented by a negative number are overrepresented in the genes significantly downregulated by the treatment. Absolute numbers correspond to fold enrichment of the pathway.
Predicted PPAR Targets
Combining the database in PPARgene with our DEGs, and sub-setting the database to include only values with prediction score > 0.6, reveals a total of 91 predicted targets that were differentially expressed in the three contrasts in our experiment (Figure 7); namely, 12 predicted targets were differentially expressed by the PPARα agonist alone (five were up-regulated), 27 by the PPARδ agonist alone (17 up-regulated), and 27 by the PPARγ agonist alone (eight were up-regulated). Further, three genes were differentially expressed by both the PPARα and PPARδ agonists (all up-regulated), six by both the PPARα and PPARγ agonists (five up-regulated), nine by both the PPARδ and PPARγ agonists (four up-regulated), and seven by all three agonists (six up-regulated).
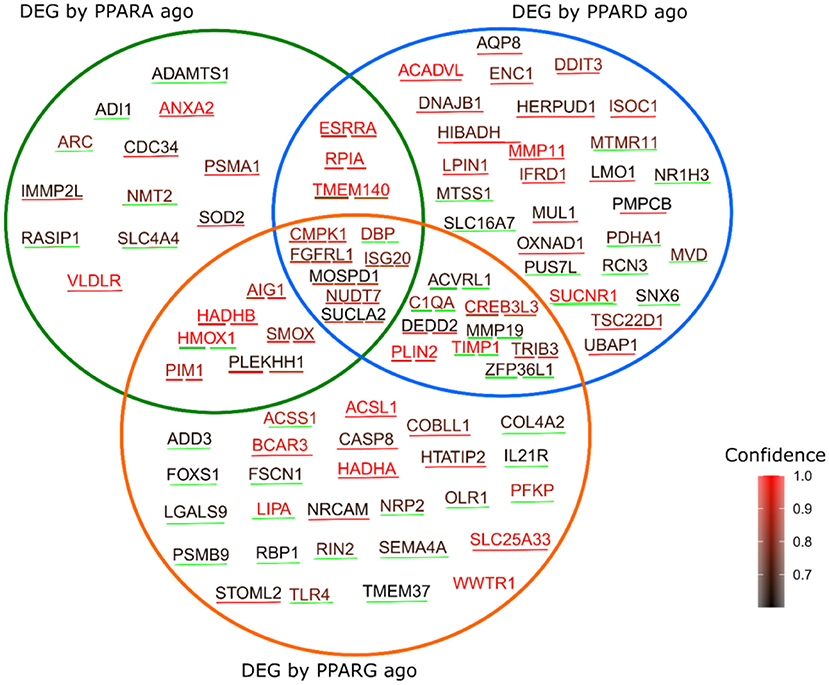
Figure 7. Genes predicted as PPAR target by the PPARgene algorithm, which were also differentially expressed by the three treatments in the current study. The color of the words corresponds to the degree of confidence of the prediction, while the color of the underlining line indicates the direction of the differential expression, with red indicating upregulation in response to the treatment, and green indicating downregulation.
Discussion
Synthetic PPAR Agonists and Antagonists Modulate Very Few Putative PPAR Targets and in the Postpartum Only
A reliable indicator of PPAR activation is the expression of canonical PPAR target genes in response to a putative ligand. Our results indicate a minor modulation of putative PPAR targets in response to PPAR agonists and antagonists in bovine liver PCLS both when cultivated in culture medium or in homologous blood serum. Although we observed minor effects, any effect on the transcription of putative PPAR targets was mostly detectable in post-partum PCLS samples. Prior studies in bovine, which highlight that modulation of PPAR target through supplementation of saturated fatty acids elicits a response primarily in the postpartum, are in line with our results: cows supplemented with saturated fatty acids, proven to be a PPAR ligand in bovine cells (17), displayed an increase in hepatic expression of putative PPAR targets (e.g., PLIN2, FABP1, ACOX1) between −14 and +7 days relative to parturition (16). The same design revealed similar outcomes in the adipose tissue, where canonical PPARγ targets were found to be upregulated slightly in the prepartum, but the greatest impact was found in the postpartum in response to either saturated fat or fish oil (rich in unsaturated fatty acids) (41).
Our present data appear to contrast with our prior study, where data indicated a stronger PPAR activation in cultured bovine cells when treated with pre-partum rather than post-partum blood serum (17). Among all genes measured, the PDK4, a well-established PPARδ target (42) was consistently affected by the use of synthetic PPARδ agonist or antagonist in the present study confirming results from our prior study using bovine immortalized cells (17, 43). Those data indicated a key role of PPARδ in bovine liver but also confirm that PDK4 is a reliable marker of PPARδ activation in bovine.
The minor effect on the transcription of the RT-qPCR measured putative PPAR target genes in the PCLS treated with the various PPAR agonists may indicate poor response of the liver to PPAR agonist. This is a possibility, considering the poor response observed in prior studies using in vivo supplementation of C16:0 on liver transcriptome (16, 44, 45) or the lack of response on P450 enzyme activity to the PPARα agonist Wy-14643 in goats (46). This possibility would be a major obstacle for any nutrigenomic interventions to improve liver performance in dairy cows via activation of PPAR, as previously advocated (13).
The genes selected for the RT-qPCR are only putative PPAR targets in bovine, since studies to identify true PPAR isotype specific target genes are still lacking [although the problem has been pointed out for almost a decade (13)]. Thus, it is possible that the relatively minor effect observed through RT-qPCR may be due to an inaccurate choice of target genes on our part. For this reason, we analyzed gene expression at a whole-transcriptome level to assess if there was any response of PCLS to PPAR agonists and, if so, determine PPAR targets in bovine liver.
Activation of PPAR Does Not Affect TAG in Bovine PCLS
The relatively minor changes in terms of canonical PPAR targets were apparently in line with the minor effect on the amount of TAG in the PCLS. The level of TAG in liver of cows are the combined result of re-esterification of circulating NEFA in TAG that are accumulated as lipid droplets and then released with the VLDL. The synthetic media used in our experiment was supplemented with 10% FBS, containing an overall low amount of free fatty acids (FA); thus, the addition of NEFA and C16:0 should have increased accumulation of TAG, if no increase in oxidation was present. On the other hand, the activation of PPARα and PPARδ should have increased oxidation of fatty acids and, perhaps, even increase VLDL secretion (13); thus, we were expecting a decrease in TAG with those treatments.
The role of PPAR in the regulation of hepatic TAG is unclear as prior studies on the topic have revealed. In mice fed a diet deficient in methionine and choline (simulating conditions experienced during non-alcoholic steatohepatitis), administration of the PPARδ agonist GW501516 and the pan-agonist bezafibrate markedly reduced hepatic TAG and lipid droplet size in hepatocytes (47); on the other hand, the same PPARδ agonist failed to reduce liver TAG in mice consuming a “Western type” high-fat diet, though circulating plasma TAG were significantly lower (48). Finally, in mice chronically exposed to carbon tetrachloride (causing fibrosis in the liver), treatment with GW501516 caused a net increase in liver TAG, which was not observed in the PPARδ-knockout population, indicating that activation of PPARδ is required for TAG accumulation under those conditions (49). It is unclear why we observed a tendency for higher TAG accumulation in PCLS treated with PPARδ in our experiment, but we cannot exclude that activation of PPARδ could increase TAG accumulation in vivo.
For the PPARα (WY-14643) and PPARγ (rosiglitazone) agonists, the situation is remarkably similar: though most studies report a reduction of plasma TAG (postprandial) when administering PPARα and PPARγ agonist (50–52), conflicting reports exist on the impact on hepatic TAG. In mice fed a high-fat diet, both rosiglitazone and WY-14643, as well as ragaglitazar (dual PPARα/PPARγ agonist) significantly decreased both TAG accumulation and TAG production rates in the liver, with the dual agonist achieving TAG concentrations equal to the control group fed a normal diet (53). In addition, mice exposed to a methionine- and choline-deficient diet (similar to the scenario discussed for the PPARδ agonist above), had a sharp reduction in hepatic TAG after treatment with WY-14643 (54). On the other hand, WY-14643 effected a sharp increase in TAG in primary mouse hepatocytes (55), and induced expression of HILPDA in mouse PCLS, the overexpression of which caused a marked decrease in hepatic TAG secretion, and a consequent increase in TAG content within the liver (56). In the present experiment with bovine PCLS, the same transcript was not affected by WY-14643 (Supplementary File 1). Similarly, treatment of genetically diabetic mice with rosiglitazone increased hepatic TAG (57, 58). Other studies have noted that liver-specific expression levels of PPARγ determine the outcome of administering the agonist, as mice with low hepatic Pparg expression saw a reduction in TAG accumulation, while mice with high hepatic Pparg expression displayed a consistent increase in hepatic TAG (59).
The available evidence seems to suggest that in certain pathophysiological conditions and drastic metabolic alterations, the activation of PPAR (regardless of isotype) can contribute to the clearance of TAG, whereas in metabolically stable animals the outcome is the opposite. It is worth considering that in the studies cited above the agonists were administered for at least 12 days (in the shortest trial) and up to 9 weeks (in the longest); though PCLS are technically viable up to 96 h (28), we noticed significant RNA degradation (RIN < 6) after 24 h of incubation (data not shown). As such, a combination of different metabolic conditions between the animals in our study and those in the cited studies, combined with a markedly shorter incubation time with the agonists, might explain the lack of significant differences in our results.
Activation of All PPAR Isotypes Induce Pathways Related to Lipid Metabolism
Based on the findings revealed by the DIA analysis, activation of any of the three PPAR isotypes leads to a strong activation of lipid metabolism. The apparent activation of lipid metabolism aligns with the findings of previous investigations. Treatment of liver slices of dairy calves with the PPARα agonist clofibrate led to a significant increase in expression of genes associated with lipid metabolism (60), while an in vitro investigation in goat mammary epithelial cells found that activation of PPARδ with the synthetic agonist GW0742 resulted in increased expression of genes associated with fatty acid activation and lipid transport (61). Interestingly, both these studies found significant upregulation of ACSL1, the long-chain member of the acyl-coenzyme A synthetase family. Although PPARG is typically more abundant in the adipose tissue than in the liver of dairy cattle, we did find a significant upregulation of genes associated with lipid metabolism when the PPARγ agonist rosiglitazone was used as well. Prior work examining PPARγ activity in the liver of ruminants is limited, but activation of PPARγ in the liver of non-ruminants seems to produce a similar upregulation of genes associated with lipid accumulation as is seen in the adipose tissue (62).
Activation of PPARγ Modulates Pathways Associated With the Immune Response in Liver
Activation of PPARγ resulted in a general inhibition of pathways associated with the immune system. PPARγ has a well-investigated role in modulating the immune response and inflammation (63), with activation of PPARγ limiting the expression of pro-inflammatory cytokines like TNFα (64). Activation of PPARγ in the liver could also impact biliary duct maintenance by regulating intracellular TLR signaling (65).
The inhibition of the immune system revealed by the DIA and DAVID when the liver slices were treated with the PPARγ agonist seems to be driven by several pathways, with the stronger effect observed in the IgA production and antigen processing and presentation. The inhibition of those pathways is mainly driven by the downregulation in transcription coding for major histocompatibility complex-associated proteins involved in the antigen processing and presentation. This effect is likely from the immune cells present in the liver, including Kupfer dendritic cells, Kupffer cells and monocyte-derived myeloid cells that are the most important when considering the antigen processing and presentation in the liver (66). Our tissue culture model likely included all those cells, as indicated by the relatively high RNSA abundance of Kupffer cells markers (Supplementary File 1).
Our results indicate a potential role of activation of PPARγ in reducing inflammation and immune activation in the liver. This can have important practical implications for transition dairy cows, due to the known negative effect of the liver's response to inflammation on performance and liver function in dairy cows (67).
In silico Analysis and Gene Expression Patterns Identifies Novel Putative PPAR Targets in Dairy Cattle
Confirmed PPAR Targets
Most of Confirmed PPAR Targets Are Involved in Lipid Metabolism
The comparison between PPAR targets predicted by PPARgene and DEG in response to PPAR agonists in this study revealed significant overlap. Some of the identified targets across treatment groups are well-documented PPAR targets: ACADVL, involved in the oxidation of very long chain FA, is a known target of PPARδ in monogastrics (68) as well as in cattle (13, 69), and its expression was found to be responsive to NEFA and modulated by metabolic changes in the peripartum (10, 70). In our RNAseq data, ACADVL was upregulated in response to the PPARδ agonist. This was not confirmed by the RTqPCR data (see the limitation session). Similarly, perilipin 2 (PLIN2), upregulated by both the PPARδ and PPARγ agonists, is a known PPAR target in monogastrics (71), though it is of note that while in monogastrics PLIN2 is identified as a target of PPARα, studies in goats found its expression to be responsive to rosiglitazone, the same PPARγ agonist used in this study (72). VLDLR, the gene encoding the VLDL receptor, was upregulated by the PPARα agonist, and substantial evidence exists indicating it as a target gene of PPARδ (73) and PPARα (74), through which it contributes to lowering serum TAG in mice. Transcription of LPIN1 was upregulated by the PPARδ agonist in PCLS in our study, the same transcript was previously identified as a PPAR target in bovine cells (13) and several monogastric species (75).
Most of the genes identified as putative targets have a role in the metabolism of lipids and fatty acids, inflammation, the immune response, and the antioxidant system. Of the ones related to lipid and fatty acid metabolism, ACSS1 and ACSL1, encoding acyl-CoA synthetase 2 and acyl-CoA synthetase long-chain, respectively, were differentially expressed in response to the PPARγ agonist rosiglitazone in our study, and are known PPAR targets in monogastrics (76, 77). ACSL1 in particular was shown to regulate plasma TAG amount through the PPARγ pathway in humans (77); however, these results do not seem to be replicated in prior bovine studies, at least as it pertains to mammary epithelial cells, as the expression of ACSL1 was not altered by rosiglitazone or several fatty acids (78). Whether modulation of ACSL1 can be possible and relevant beyond the liver in bovine remains to be determined. Within the same category, HTATIP2 was upregulated, and LIPA and OLR1 were downregulated in PCLS treated with a PPARγ agonist. HTATIP2, which encodes an oxidoreductase, was previously shown to form a complex with acyl-CoA synthase 4 (79), and its overexpression in mouse hepatocytes altered fatty acid metabolism by reducing oxidation rates, and increased esterification as either TAG or cholesteryl esters (80). Additionally, HTATIP2 expression increased in the liver of ciprofibrate-treated Cynomolgus monkeys (81); though ciprofibrate (and fibrates in general) are regarded as PPARα agonists, which would suggest that HTATIP2 is a PPARα target in monogastric, some evidence exists for the role of ciprofibrate in activating PPARγ at larger doses (82).
LIPA, encoding a lysosomal lipase, was previously found to be downregulated in PPARγ-knockout mouse prostate epithelial cells (83), and by overexpression of PPARγΔ5, a recently-discovered isoform of PPARγ, in HEK293 cells (84). Interestingly, mutations in the LIPA gene can lead to defects in the storage of cholesteryl esters, which would suggest a plausible link between LIPA and HTATIP2. Finally, OLR1, a receptor for oxidized LDL, was found to be upregulated by rosiglitazone and downregulated in response to the PPARγ antagonist PD068235 in 3T3-L1 mouse adipocytes (85), and its expression was highly correlated with that of PPARγ in porcine adipose tissue (86). An upregulation of the oxidized LDL receptor can lead to increased uptake of oxidized LDL, as well as the accumulation of TAG (86). Downregulation of OLR1 and LIPA suggest that, in the bovine liver, PPARγ agonists may lead to decreased accumulation of TAG; this is further substantiated by the upregulation of COBLL1 in response to the PPARγ agonist, and of CREB3L3 by both the PPARγ and PPARδ agonist. In human SGBS preadipocytes, knockout of COBLL1 increased TAG accumulation by ~30% (87), while CREB3L3 ablation in mice led to a dramatic increase (~4-fold) in circulating TAG and a consequent increase in hepatic TAG, along with increased ketogenesis (88), though existing evidence in monogastrics highlights a major interaction with PPARα (89), not PPARδ or PPARγ. Our results seem in partial disagreement with these findings, as the amount of TAG in post-partum slices was not significantly different between treatment groups. As mentioned earlier in the discussion, a plausible explanation could be the limited incubation time (~18 h) of the PCLS, suggesting that a longer timeframe may be needed to witness biologically relevant effects.
Among the putative targets, evidence emerges for a role of PPAR agonists in the regulation of FA oxidation through novel mechanisms. HADHA and HADHB, encoding the subunits of the mitochondrial trifunctional protein MTP, were upregulated by the PPARγ agonist (HADHA) and by the PPARα and PPARγ agonist (HADHB). MTP is an enzyme associated with the inner mitochondrial membrane, and it catalyzes the final steps of the beta oxidation of long-chain FA in the mitochondria (90). Bezafibrate, a PPARα agonist, upregulated both HADHA and HADHB in human skin fibroblasts (90), while the PPARα/PPARγ dual agonist LY465608 increased expression of HADHB in both rat and dog hepatocytes, simultaneously increasing FA oxidation as measured by acyl-CoA and carnitine palmitoyl transferase I activity (91). Additionally, NUDT7, upregulated by all of three PPAR agonists in our study, is known to regulate peroxisomal FA oxidation by modulating coenzyme A degradation (92), and its expression is responsive to PPARα agonist WY-14643 in mouse liver (93). Limited evidence exists for the role of HADHA/B and NUD7 in bovines, most of which is in regards to unrelated production parameters such as meat color (94).
Few PPAR Targets Are Coding for Proteins Involved in Antioxidant Response
Two of the putative targets suggest a possible role of PPAR isotypes in regulating the antioxidant response: SOD2, encoding mitochondrial manganese superoxide dismutase, is directly regulated by PPARα, and downregulated in PPARα-/– mice (95), and accordingly our results found it upregulated in response to the PPARα agonist. On the other hand, HMOX1 (hemoxygenase-1) was downregulated by both the PPARα and PPARγ agonists. Studies in rat liver identified a response of HMOX1 to pioglitazone (PPARγ agonist) (96); this may be a product of indirect regulation, as PPARγ agonist rosiglitazone is known to activate the AMP kinase pathway, of which HMOX1 is a target (97). To our knowledge, a link between PPAR isotypes and HMOX1/SOD2 has not been elucidated in bovines.
PPAR Targets and Insulin Signaling-Related Functions
DBP, downregulated by all three PPAR agonists, and TRIB3, upregulated by both the PPARδ and PPARγ agonists, are involved in regulating insulin sensitivity. Acetylation of histone 3 lysine 9 at the promoter region of DBP, and its consequent upregulation, plays a role in regulation of glucose homeostasis and is related to PPARγ in mice (98) and humans with type 2 diabetes (99), while TRIB3 affects response to insulin by inhibiting Akt phosphorylation (100), and its activity is directly related to that of PPARγ (101). The differential expression of TRIB3 observed in response to the PPARδ agonist may be a feature unique to the bovine liver: though a possible link between TRIB3 expression and PPARα has been established (102), no evidence of an interaction with PPARδ has been elucidated.
Confirmed Targets Repressed by PPARγ Are Involved in Inflammation and Immune Regulation
Five genes among the identified putative targets are involved in the regulation of the immune response: IL21R, LGALS9, SEMA4A, NRP2, and TLR4 were all downregulated in the PPARγ agonist group. IL21R, encoding an interleukin receptor, is known to play a role in ensuring proper function of T cells in mice (103), and was previously found upregulated by the pan-PPAR agonist elafibranor (104). LGALS9 (galectin 9) is involved in T cell exhaustion (105), and activates AMPK (106), and was found to be strongly downregulated in response to rosiglitazone (the same PPARγ agonist as in our study) in 3T3-L1 preadipocytes (107). SEMA4A encodes semaphorin-4a and its activity is directly dependent on its receptors, neuropilins (of which NRP2 is one); SEMA4A is involved in the proliferation of CD4+ T cells in mice and human (108), and in the function and survival of regulatory T cells in mice (109). Though no direct evidence exists of a link between PPAR and SEMA4A, other studies have shown that PPAR agonists can regulate other semaphorins, such as SEMA6B [downregulated by all PPAR isotypes in human genomic fragments in vitro (110)] and SEMA3G [upregulated by PPARγ ligands in human endothelial cells (111)]. Finally, Toll-like receptor 4 (TLR-4), also downregulated by the PPARγ in our study, regulates the adaptive immune response by triggering production of pro-inflammatory cytokines. In accordance with our results, rosiglitazone-treated rats displayed lower expression of TLR4 (112), and human HMEC-1 mammary epithelial cells treated with hypaphorine, which decreased PPARγ expression, had a drastic upregulation of TLR4 (113).
Novel PPAR Targets Are Likely Involved in Regulation of Inflammation
A considerable number of genes related to metalloproteinases (MMP) was observed among the novel putative targets, mostly modulated by the PPARδ and PPARγ agonists. MMP19 was downregulated in both groups, as well as TIMP1, a protein involved in the intracellular regulation of MMP, the abundance of which was markedly lower in rat chondrocytes treated with GW-501516 and rosiglitazone, the same PPARδ and PPARγ agonists used in this study (114). On the other hand, MMP11 was upregulated in response to the PPARδ agonist in our study. Finally, ADAMTS1, a zinc-binding metalloproteinase, was downregulated in response to the PPARα agonist. MMPs have a known role in regulating inflammation, and some evidence of a link with PPAR activity is present in the literature for monogastrics (115, 116). This is certainly the case for MMP19, involved in the development of T cells in mice (117); MMP11, related to several cytokines in breast cancer cells (118); and ADAMTS1, a known regulator of the inflammatory response (119). The concerted modulation of several MMPs in our study suggests an intricated landscape of the inflammatory response as regulated by PPAR.
Limitations
1) Slice thickness and compound absorption: though the Krumdieck tissue slicer provides relatively consistent precision throughout the slices, prior studies have shown that the thickness of bovine PCLS is remarkably less consistent between slices than that of human, pig, rat and mouse (120). The absorption of small molecules (such as the PPAR agonists used in this manuscript, or C16:0) relies heavily on slice thickness, as the rate of diffusion is limited by the rapid extraction of the compound by the cells in the outer layer (121). A reduction of the slice thickness to 100 μm could ensure that all cells are metabolizing the compound (121); however, the likelihood of obtaining brittle tissue (especially in the inconsistency-prone bovine PCLS) increases greatly, rendering the endeavor practically impossible. Future studies may benefit from the use of more accurate machines in the preparation of PCLS, such as the Leica VT1200 S (120).
2) Cellular composition of PCLS: utilizing liver slices ensures that the histology and morphology of the tissue is maintained; however, obtaining liver samples through liver biopsy does not guarantee homogenous composition of each sample, as the operator cannot visually identify the lobes of the liver prior to puncture. Though these differences are bound to be minor, two slices proceeding from different areas of the liver are likely to display different patterns of gene expression. In future studies, the use of ultrasonographic examination to determine liver morphology prior to sampling may allow to obtain more consistent results.
3) Statistical power: the study had a relatively low sample size (originally four animals but in the final analysis only three animals, especially for the RNAseq dataset). This led to large variability between biological replicates, especially in the prepartum, where the range of DIM of the four samples was rather large (prepartum samples were collected based on expected calving dates, which can be an imprecise estimate for some animals). The reason for such limitation is 2-fold: one was financial, the utilization of different treatments resulted in a relatively large number of samples to be sequenced reaching the maximum financial allowance for such analysis; the other reason was the attempt to minimize the use of animals. To partially addressed those issues and minimize technical variation, samples from each animal were run in duplicate in vitro and post-treatment duplicates were pooled, as indicated above. Future studies will benefit from a more limited range of treatments and larger replication for each group, which will undoubtedly be more feasible considering the rapidly declining costs of NGS technologies.
4) Breed and parity: our study included only primiparous Jersey cows. Other breeds and multiparous cows may have a different response to our experimental setup. For example: Holstein cows have a greater loss of body condition in the peripartum, as well as higher NEFA and BHBA postpartum, and overall higher negative energy balance (122–124). All of these would like impact the response of PCLS to PPAR activation. The present study is meant to be a starting point for further exploration of PPAR activation in bovines using PCLS; future studies will undoubtedly benefit from including other breeds and test multiparous cows.
5) To optimize the use of the limited funding available to achieve the stated objective, many samples (60) were sequenced in each lane. Though the library prep kit used is apt at maximizing sequencing depth when compared with other commercial solutions, we noticed that many transcripts with (typically) a relatively low expression were either not detected or detected at very low level, with zero-counts in most samples. Despite being able to detect >14,000 transcripts with a count>4 in at the least one sample, which is somewhat similar to what previously reported in RNAseq analysis of bovine liver (125–127), many transcripts with a relatively medium-low expression were either not detected or detected at very low level, with lack of detection in most samples. Most of the genes used for the RT-qPCR were in this category, such as all PPAR transcripts and LIPC. Other were undetectable in RNAseq, such as PPARGC1A and HES6. Among the transcripts detected in all the samples (i.e., PDK4, ACADVL, and FABP1), a positive correlation was observed between results of RTqPCR and RNAseq when both were normalized using reference genes (Supplementary File 2). The low depth likely limited the discovery of other PPAR target genes.
Conclusions
Bovine PCLS are responsive to treatment with PPAR agonists and reveal a complex and heterogeneous transcriptomic response. Though minimal changes in TAG accumulation were detected, suggesting no effective changes in oxidation and esterification rates, several genes involved in lipid metabolism were altered in response to the PPAR agonists in the postpartum, suggesting that the lack of enzymatic effect may be due to the relatively short incubation time. An important suggestion from our study is a relationship between PPARγ activation and potential decreased inflammation in the liver, that can tremendously benefit post-partum cows. Of the differentially expressed genes identified in the study, a considerable number of them corresponds to putative PPAR target genes, predicted in silico; further, many of these find support in the literature, as prior studies highlight their link with PPAR activation. In summary, PCLS represent a valuable model of the bovine liver of periparturient dairy cows
Data Availability Statement
Raw sequencing reads have been deposited to NCBI Gene Expression Omnibus (GEO accession number GSE183063). All relevant processed data is provided in the Supplementary Materials. Any additional documents will be provided by the authors upon request.
Ethics Statement
The animal study was reviewed and approved by Institutional Animal Care and Use Committee (IACUC) of Oregon State University (protocol# 4894).
Author Contributions
SB helped performing liver biopsy, collected blood, optimized the PCLS, performed all the experiments, analyzed the data, interpreted the data, and wrote the manuscript. HF helped interpreting the data and revised the manuscript. AA performed RT-qPCR analysis and revised the manuscript. CE performed liver biopsies and revised the manuscript. MB received the funding, helped in interpreting the data, helped writing the manuscript, and revised the final manuscript. All authors contributed to the article and approved the submitted version.
Funding
This project was funded by the Oregon Beef Council.
Conflict of Interest
The authors declare that the research was conducted in the absence of any commercial or financial relationships that could be construed as a potential conflict of interest.
Publisher's Note
All claims expressed in this article are solely those of the authors and do not necessarily represent those of their affiliated organizations, or those of the publisher, the editors and the reviewers. Any product that may be evaluated in this article, or claim that may be made by its manufacturer, is not guaranteed or endorsed by the publisher.
Acknowledgments
The authors acknowledge the help of Larissa Lewis, manager of the Oregon State University Dairy Center in getting and preparing the cows for the experiment. We thank Dr. William E. David, University Distinguished Professor, Department of Environmental and Molecular Toxicology at Oregon State University for lending us the Krumdieck Tissue Slicer for this experiment.
Supplementary Material
The Supplementary Material for this article can be found online at: https://www.frontiersin.org/articles/10.3389/fvets.2022.931264/full#supplementary-material
Supplementary File 1. Complete dataset with annotation and statistical results.
Supplementary File 2. Comparison between RTqPCR and RNAseq for selected transcripts.
Supplementary Figure S1. Principal component analysis of the RNAseq.
Supplementary Figure S2. Enriched GO terms within the cohort of genes significantly upregulated (FDR-adjusted p-value <0.2) by treatment with the PPARα agonist.
Supplementary Figure S3. Enriched GO terms within the cohort of genes significantly downregulated (FDR-adjusted p-value <0.2) by treatment with the PPARα agonist.
Supplementary Figure S4. Enriched GO terms within the cohort of genes significantly upregulated (FDR-adjusted p-value <0.2) by treatment with the PPARδ agonist.
Supplementary Figure S5. Enriched GO terms within the cohort of genes significantly downregulated (FDR-adjusted p-value <0.2) by treatment with the PPARδ agonist.
Supplementary Figure S6. Enriched GO terms within the cohort of genes significantly upregulated (FDR-adjusted p-value <0.2) by treatment with the PPARγ agonist.
Supplementary Figure S7. Enriched GO terms within the cohort of genes significantly downregulated (FDR-adjusted p-value <0.2) by treatment with the PPARγ agonist.
Supplementary Table S1. Accession number, gene symbol, sequence, and amplicon size of quantified genes, and internal control genes. If reference is lacking, primers were designed for this manuscript.
References
1. Pascottini OB, Leroy JLMR, Opsomer G. Metabolic stress in the transition period of dairy cows: focusing on the prepartum period. Animals. (2020) 10:1419. doi: 10.3390/ani10081419
2. Drackley JK. Biology of dairy cows during the transition period: the final frontier? J Dairy Sci. (1999) 82:2259–73. doi: 10.3168/jds.S0022-0302(99)75474-3
3. Aschenbach JR, Kristensen NB, Donkin SS, Hammon HM, Penner GB. Gluconeogenesis in dairy cows: the secret of making sweet milk from sour dough. IUBMB Life. (2010) 62:869–77. doi: 10.1002/iub.400
4. Hocquette JF, Bauchart D. Intestinal absorption, blood transport and hepatic and muscle metabolism of fatty acids in preruminant and ruminant animals. Reprod Nutr Dev. (1999) 39:27–48. doi: 10.1051/rnd:19990102
5. Pullen DL, Liesman JS, Emery RS. A species comparison of liver slice synthesis and secretion of triacylglycerol from nonesterified fatty acids in media2. J Anim Sci. (1990) 68:1395–9. doi: 10.2527/1990.6851395x
6. Grummer RR. Nutritional and management strategies for the prevention of fatty liver in dairy cattle. Vet J. (2008) 176:10–20. doi: 10.1016/j.tvjl.2007.12.033
7. Adewuyi AA, Gruys E, van Eerdenburg FJCM. Non esterified fatty acids (NEFA) in dairy cattle: a review. Vet Q. (2005) 27:117–26. doi: 10.1080/01652176.2005.9695192
8. Janovick NA, Boisclair YR, Drackley JK. Prepartum dietary energy intake affects metabolism and health during the periparturient period in primiparous and multiparous Holstein cows1. J Dairy Sci. (2011) 94:1385–400. doi: 10.3168/jds.2010-3303
9. Van den Top AM, Geelen MJ, Wensing T, Wentink GH, Van 't Klooster AT, Beynen AC. Higher postpartum hepatic triacylglycerol concentrations in dairy cows with free rather than restricted access to feed during the dry period are associated with lower activities of hepatic glycerolphosphate acyltransferase. J Nutr. (1996) 126:76–85. doi: 10.1093/jn/126.1.76
10. Gross JJ, Schwarz FJ, Eder K, van Dorland HA, Bruckmaier RM. Liver fat content and lipid metabolism in dairy cows during early lactation and during a mid-lactation feed restriction. J Dairy Sci. (2013) 96:5008–17. doi: 10.3168/jds.2012-6245
11. Akbar H, Bionaz M, Carlson DB, Rodriguez-Zas SL, Everts RE, Lewin HA, et al. Feed restriction, but not l-carnitine infusion, alters the liver transcriptome by inhibiting sterol synthesis and mitochondrial oxidative phosphorylation and increasing gluconeogenesis in mid-lactation dairy cows. J Dairy Sci. (2013) 96:2201–13. doi: 10.3168/jds.2012-6036
12. Velez JC, Donkin SS. Feed restriction induces pyruvate carboxylase but not phosphoenolpyruvate carboxykinase in dairy cows*. J Dairy Sci. (2005) 88:2938–48. doi: 10.3168/jds.S0022-0302(05)72974-X
13. Bionaz M, Chen S, Khan MJ, Loor JJ. Functional role of PPARs in ruminants: potential targets for fine-tuning metabolism during growth and lactation. PPAR Res. (2013) 2013:e684159. doi: 10.1155/2013/684159
14. Michalik L, Auwerx J, Berger JP, Chatterjee VK, Glass CK, Gonzalez FJ, et al. International union of pharmacology. LXI peroxisome proliferator-activated receptors. Pharmacol Rev. (2006) 58:726–41. doi: 10.1124/pr.58.4.5
15. Bionaz M, Vargas-Bello-Pérez E, Busato S. Advances in fatty acids nutrition in dairy cows: from gut to cells and effects on performance. J Anim Sci Biotechnol. (2020) 11:110. doi: 10.1186/s40104-020-00512-8
16. Akbar H, Schmitt E, Ballou MA, Corrêa MN, DePeters EJ, Loor JJ. Dietary lipid during late-pregnancy and early-lactation to manipulate metabolic and inflammatory gene network expression in dairy cattle liver with a focus on PPARs. Gene Regul Syst Biol. (2013) 7:GRSB.S12005. doi: 10.4137/GRSB.S12005
17. Busato S, Bionaz M. The interplay between non-esterified fatty acids and bovine peroxisome proliferator-activated receptors: results of an in vitro hybrid approach. J Anim Sci Biotechnol. (2020) 11:91. doi: 10.1186/s40104-020-00481-y
18. Godoy P, Hewitt NJ, Albrecht U, Andersen ME, Ansari N, Bhattacharya S, et al. Recent advances in 2D and 3D in vitro systems using primary hepatocytes, alternative hepatocyte sources and non-parenchymal liver cells and their use in investigating mechanisms of hepatotoxicity, cell signaling and ADME. Arch Toxicol. (2013) 87:1315–530. doi: 10.1007/s00204-013-1078-5
19. Giantin M, Gallina G, Pegolo S, Lopparelli RM, Sandron C, Zancanella V, et al. Primary hepatocytes as an useful bioassay to characterize metabolism and bioactivity of illicit steroids in cattle. Toxicol In Vitro. (2012) 26:1224–32. doi: 10.1016/j.tiv.2012.06.003
20. Elgendy R, Giantin M, Dacasto M. Transcriptomic characterization of bovine primary cultured hepatocytes; a cross-comparison with a bovine liver and the Madin-Darby bovine kidney cells. Res Vet Sci. (2017) 113:40–9. doi: 10.1016/j.rvsc.2017.08.006
21. Zhang Z-G, Li X-B, Gao L, Liu G-W, Kong T, Li Y-F, Wang H-B, Zhang C, Wang Z, Zhang R-H. An updated method for the isolation and culture of primary calf hepatocytes. Vet J Lond Engl 1997. (2012) 191:323–6. doi: 10.1016/j.tvjl.2011.01.008
22. Zhu Y, Guan Y, Loor JJ, Sha X, Coleman DN, Zhang C, et al. Fatty acid-induced endoplasmic reticulum stress promoted lipid accumulation in calf hepatocytes, and endoplasmic reticulum stress existed in the liver of severe fatty liver cows. J Dairy Sci. (2019) 102:7359–70. doi: 10.3168/jds.2018-16015
23. Zhao B, Luo C, Zhang M, Xing F, Luo S, Fu S, et al. Knockdown of phosphatase and tensin homolog (PTEN) inhibits fatty acid oxidation and reduces very low density lipoprotein assembly and secretion in calf hepatocytes. J Dairy Sci. (2020) 103:10728–41. doi: 10.3168/jds.2019-17920
24. Zhang B, Yang W, Wang S, Liu R, Loor JJ, Dong Z, et al. Lipid accumulation and injury in primary calf hepatocytes challenged with different long-chain fatty acids. Front Vet Sci. (2020) 7:547047. doi: 10.3389/fvets.2020.547047
25. Rosa F, Busato S, Avaroma FC, Linville K, Trevisi E, Osorio JS, et al. Transcriptional changes detected in fecal RNA of neonatal dairy calves undergoing a mild diarrhea are associated with inflammatory biomarkers. PLoS ONE. (2018) 13:e0191599. doi: 10.1371/journal.pone.0191599
26. Harvey TN, Sandve SR, Jin Y, Vik JO, Torgersen JS. Liver slice culture as a model for lipid metabolism in fish. PeerJ. (2019) 7:e7732. doi: 10.7717/peerj.7732
27. Yadetie F, Zhang X, Hanna EM, Aranguren-Abadía L, Eide M, Blaser N, et al. RNA-Seq analysis of transcriptome responses in Atlantic cod (Gadus morhua) precision-cut liver slices exposed to benzo[a]pyrene and 17α-ethynylestradiol. Aquat Toxicol. (2018) 201:174–86. doi: 10.1016/j.aquatox.2018.06.003
28. de Graaf IAM, Olinga P, de Jager MH, Merema MT, de Kanter R, van de Kerkhof EG, et al. Preparation and incubation of precision-cut liver and intestinal slices for application in drug metabolism and toxicity studies. Nat Protoc. (2010) 5:1540–51. doi: 10.1038/nprot.2010.111
29. Janssen AWF, Betzel B, Stoopen G, Berends FJ, Janssen IM, Peijnenburg AA, et al. The impact of PPARα activation on whole genome gene expression in human precision cut liver slices. BMC Genomics. (2015) 16:760. doi: 10.1186/s12864-015-1969-3
30. NCBI Resource Coordinators. Database resources of the National Center for Biotechnology Information. Nucleic Acids Res. (2016) 44:D7–19. doi: 10.1093/nar/gkv1290
31. Vandesompele J, De Preter K, Pattyn F, Poppe B, Van Roy N, De Paepe A, Speleman F. Accurate normalization of real-time quantitative RT-PCR data by geometric averaging of multiple internal control genes. Genome Biol. (2002) 3:RESEARCH0034. doi: 10.1186/gb-2002-3-7-research0034
32. Ewels P, Magnusson M, Lundin S, Käller M. MultiQC: summarize analysis results for multiple tools and samples in a single report. Bioinformatics. (2016) 32:3047–8. doi: 10.1093/bioinformatics/btw354
33. Bolger AM, Lohse M, Usadel B. Trimmomatic: a flexible trimmer for Illumina sequence data. Bioinformatics. (2014) 30:2114–20. doi: 10.1093/bioinformatics/btu170
34. Dobin A, Davis CA, Schlesinger F, Drenkow J, Zaleski C, Jha S, et al. ultrafast universal RNA-seq aligner. Bioinformatics. (2013) 29:15–21. doi: 10.1093/bioinformatics/bts635
35. Li H, Handsaker B, Wysoker A, Fennell T, Ruan J, Homer N, et al. 1000 genome project data processing subgroup. The sequence alignment/map format and SAMtools. Bioinformatics. (2009) 25:2078–9. doi: 10.1093/bioinformatics/btp352
36. Love MI, Huber W, Anders S. Moderated estimation of fold change and dispersion for RNA-seq data with DESeq2. Genome Biol. (2014) 15:550. doi: 10.1186/s13059-014-0550-8
37. Bionaz M, Periasamy K, Rodriguez-Zas SL, Hurley WL, Loor JJ. A Novel dynamic impact approach (DIA) for functional analysis of time-course omics studies: validation using the bovine mammary transcriptome. PLoS ONE. (2012) 7:e32455. doi: 10.1371/journal.pone.0032455
38. Huang DW, Sherman BT, Lempicki RA. Systematic and integrative analysis of large gene lists using DAVID bioinformatics resources. Nat Protoc. (2009) 4:44–57. doi: 10.1038/nprot.2008.211
39. Supek F Bošnjak M Škunca N Šmuc T REVIGO REVIGO summarizes and visualizes long lists of gene ontology terms. PLoS ONE. (2011) 6:e21800. doi: 10.1371/journal.pone.0021800
40. Fang L, Zhang M, Li Y, Liu Y, Cui Q, Wang N. PPARgene: a database of experimentally verified and computationally predicted PPAR target genes. PPAR Res. (2016) 2016:e6042162. doi: 10.1155/2016/6042162
41. Schmitt E, Ballou MA, Correa MN, DePeters EJ, Drackley JK, Loor JJ. Dietary lipid during the transition period to manipulate subcutaneous adipose tissue peroxisome proliferator-activated receptor-γ co-regulator and target gene expression. J Dairy Sci. (2011) 94:5913–25. doi: 10.3168/jds.2011-4230
42. Kleiner S, Nguyen-Tran V, Baré O, Huang X, Spiegelman B, Wu Z. PPARδ agonism activates fatty acid oxidation via PGC-1α but does not increase mitochondrial gene expression and function. J Biol Chem. (2009) 284:18624–33. doi: 10.1074/jbc.M109.008797
43. Lohakare J, Osorio JS, Bionaz M. Peroxisome proliferator-activated receptor β/δ does not regulate glucose uptake and lactose synthesis in bovine mammary epithelial cells cultivated in vitro. J Dairy Res. (2018) 85:295–302. doi: 10.1017/S0022029918000365
44. Weld KA, Erb SJ, White HM. Short communication: Effect of manipulating fatty acid profile on gluconeogenic gene expression in bovine primary hepatocytes. J Dairy Sci. (2019) 102:7576–82. doi: 10.3168/jds.2018-16150
45. Rico DE, Parales JE, Corl BA, Lengi A, Chouinard PY, Gervais R. Abomasally infused SFA with varying chain length differently affect milk production and composition and alter hepatic and mammary gene expression in lactating cows. Br J Nutr. (2020) 124:386–95. doi: 10.1017/S0007114520000379
46. Cappon GD, Liu RCM, Frame SR, Hurtt ME. Effects of the rat hepatic peroxisome proliferator, Wyeth 14,643, on the lactating goat. Drug Chem Toxicol. (2002) 25:255–66. doi: 10.1081/DCT-120005888
47. Nagasawa T, Inada Y, Nakano S, Tamura T, Takahashi T, Maruyama K, et al. Effects of bezafibrate, PPAR pan-agonist, and GW501516, PPARδ agonist, on development of steatohepatitis in mice fed a methionine- and choline-deficient diet. Eur J Pharmacol. (2006) 536:182–91. doi: 10.1016/j.ejphar.2006.02.028
48. Barroso E, Rodríguez-Calvo R, Serrano-Marco L, Astudillo AM, Balsinde J, Palomer X, et al. The PPARβ/δ activator GW501516 prevents the down-regulation of AMPK caused by a high-fat diet in liver and amplifies the PGC-1α-Lipin 1-PPARα pathway leading to increased fatty acid oxidation. Endocrinology. (2011) 152:1848–59. doi: 10.1210/en.2010-1468
49. Kostadinova R, Montagner A, Gouranton E, Fleury S, Guillou H, Dombrowicz D, et al. GW501516-activated PPARβ/δ promotes liver fibrosis via p38-JNK MAPK-induced hepatic stellate cell proliferation. Cell Biosci. (2012) 2:34. doi: 10.1186/2045-3701-2-34
50. Tan GD, Fielding BA, Currie JM, Humphreys SM, Désage M, Frayn KN, et al. The effects of rosiglitazone on fatty acid and triglyceride metabolism in type 2 diabetes. Diabetologia. (2005) 48:83–95. doi: 10.1007/s00125-004-1619-9
51. Chaput E, Saladin R, Silvestre M, Edgar AD. Fenofibrate and rosiglitazone lower serum triglycerides with opposing effects on body weight. Biochem Biophys Res Commun. (2000) 271:445–50. doi: 10.1006/bbrc.2000.2647
52. van Wijk JPH, de Koning EJP, Cabezas MC, Rabelink TJ. Rosiglitazone improves postprandial triglyceride and free fatty acid metabolism in type 2 diabetes. Diabetes Care. (2005) 28:844–9. doi: 10.2337/diacare.28.4.844
53. Ye J-M, Iglesias MA, Watson DG, Ellis B, Wood L, Jensen PB, et al. PPARα/γ ragaglitazar eliminates fatty liver and enhances insulin action in fat-fed rats in the absence of hepatomegaly. Am J Physiol-Endocrinol Metab. (2003) 284:E531–40. doi: 10.1152/ajpendo.00299.2002
54. Ip E, Farrell G, Hall P, Robertson G, Leclercq I. Administration of the potent PPARα agonist, Wy-14,643, reverses nutritional fibrosis and steatohepatitis in mice. Hepatology. (2004) 39:1286–96. doi: 10.1002/hep.20170
55. Edvardsson U, Ljungberg A, Lindén D, William-Olsson L, Peilot-Sjögren H, Ahnmark A, et al. PPARα activation increases triglyceride mass and adipose differentiation-related protein in hepatocytes. J Lipid Res. (2006) 47:329–40. doi: 10.1194/jlr.M500203-JLR200
56. Mattijssen F, Georgiadi A, Andasarie T, Szalowska E, Zota A, Krones-Herzig A, et al. Hypoxia-inducible lipid droplet-associated (HILPDA) is a novel peroxisome proliferator-activated receptor (PPAR) target involved in hepatic triglyceride secretion. J Biol Chem. (2014) 289:19279–93. doi: 10.1074/jbc.M114.570044
57. Hemmeryckx B, Gaekens M, Gallacher DJ, Lu HR, Lijnen HR. Effect of rosiglitazone on liver structure and function in genetically diabetic akita mice. Basic Clin Pharmacol Toxicol. (2013) 113:353–60. doi: 10.1111/bcpt.12104
58. Watkins SM, Reifsnyder PR, Pan H, German JB, Leiter EH. Lipid metabolome-wide effects of the PPARγ agonist rosiglitazones. J Lipid Res. (2002) 43:1809–17. doi: 10.1194/jlr.M200169-JLR200
59. Gao M, Ma Y, Alsaggar M, Liu D. Dual outcomes of rosiglitazone treatment on fatty liver. AAPS J. (2016) 18:1023–31. doi: 10.1208/s12248-016-9919-9
60. Litherland NB, Bionaz M, Wallace RL, Loor JJ, Drackley JK. Effects of the peroxisome proliferator-activated receptor-α agonists clofibrate and fish oil on hepatic fatty acid metabolism in weaned dairy calves1. J Dairy Sci. (2010) 93:2404–18. doi: 10.3168/jds.2009-2716
61. Shi HB, Zhang CH, Zhao W, Luo J, Loor JJ. Peroxisome proliferator-activated receptor delta facilitates lipid secretion and catabolism of fatty acids in dairy goat mammary epithelial cells. J Dairy Sci. (2017) 100:797–806. doi: 10.3168/jds.2016-11647
62. Lee YK, Park JE, Lee M, Hardwick JP. Hepatic lipid homeostasis by peroxisome proliferator-activated receptor gamma 2. Liver Res. (2018) 2:209–15. doi: 10.1016/j.livres.2018.12.001
63. Croasdell A, Duffney PF, Kim N, Lacy SH, Sime PJ, Phipps RP. PPARγ and the innate immune system mediate the resolution of inflammation. PPAR Res. (2015) 2015:549691. doi: 10.1155/2015/549691
64. Nakajima A, Wada K, Miki H, Kubota N, Nakajima N, Terauchi Y, et al. Endogenous PPAR gamma mediates anti-inflammatory activity in murine ischemia-reperfusion injury. Gastroenterology. (2001) 120:460–9. doi: 10.1053/gast.2001.21191
65. Harada K, Nakanuma Y. Biliary innate immunity: function and modulation. Mediators Inflamm. (2010) 2010:373878. doi: 10.1155/2010/373878
66. Mehrfeld C, Zenner S, Kornek M, Lukacs-Kornek V. The contribution of non-professional antigen-presenting cells to immunity and tolerance in the liver. Front Immunol. (2018) 9:635. doi: 10.3389/fimmu.2018.00635
67. Veas F. Acute Phase Proteins as Early Non-Specific Biomarkers of Human and Veterinary Diseases. London: BoD – Books on Demand (2011). 424 p.
68. Roberts LD, Murray AJ, Menassa D, Ashmore T, Nicholls AW, Griffin JL. The contrasting roles of PPARδ and PPARγ in regulating the metabolic switch between oxidation and storage of fats in white adipose tissue. Genome Biol. (2011) 12:R75. doi: 10.1186/gb-2011-12-8-r75
69. Thering BJ, Bionaz M, Loor JJ. Long-chain fatty acid effects on peroxisome proliferator-activated receptor-α-regulated genes in Madin-Darby bovine kidney cells: optimization of culture conditions using palmitate. J Dairy Sci. (2009) 92:2027–37. doi: 10.3168/jds.2008-1749
70. van Dorland HA, Richter S, Morel I, Doherr MG, Castro N, Bruckmaier RM. Variation in hepatic regulation of metabolism during the dry period and in early lactation in dairy cows. J Dairy Sci. (2009) 92:1924–40. doi: 10.3168/jds.2008-1454
71. Fornes D, Gomez Ribot D, Heinecke F, Roberti SL, Capobianco E, Jawerbaum A. Maternal diets enriched in olive oil regulate lipid metabolism and levels of PPARs and their coactivators in the fetal liver in a rat model of gestational diabetes mellitus. J Nutr Biochem. (2020) 78:108334. doi: 10.1016/j.jnutbio.2019.108334
72. Shi H, Luo J, Zhu J, Li J, Sun Y, Lin X, et al. PPARγ regulates genes involved in triacylglycerol synthesis and secretion in mammary gland epithelial cells of dairy goats. PPAR Res. (2013) 2013:e310948. doi: 10.1155/2013/310948
73. Zarei M, Barroso E, Palomer X, Escolà-Gil JC, Cedó L, Wahli W, et al. Pharmacological PPARβ/δ activation upregulates VLDLR in hepatocytes. Clín Investig Arterioscler Engl Ed. (2019) 31:111–8. doi: 10.1016/j.arteri.2019.01.004
74. Gao Y, Shen W, Lu B, Zhang Q, Hu Y, Chen Y. Upregulation of hepatic VLDLR via PPARα is required for the triglyceride-lowering effect of fenofibrate. J Lipid Res. (2014) 55:1622–33. doi: 10.1194/jlr.M041988
75. Sugden MC, Caton PW, Holness MJ, PPAR. control: it's SIRTainly as easy as PGC. J Endocrinol. (2010) 204:93–104. doi: 10.1677/JOE-09-0359
76. Basu-Modak S, Braissant O, Escher P, Desvergne B, Honegger P, Wahli W. Peroxisome proliferator-activated receptor β regulates acyl-CoA synthetase 2 in reaggregated rat brain cell cultures*. J Biol Chem. (1999) 274:35881–8. doi: 10.1074/jbc.274.50.35881
77. Li T, Li X, Meng H, Chen L, Meng F. ACSL1 affects triglyceride levels through the PPARγ pathway. Int J Med Sci. (2020) 17:720–7. doi: 10.7150/ijms.42248
78. Kadegowda AKG, Bionaz M, Piperova LS, Erdman RA, Loor JJ. Peroxisome proliferator-activated receptor-γ activation and long-chain fatty acids alter lipogenic gene networks in bovine mammary epithelial cells to various extents. J Dairy Sci. (2009) 92:4276–89. doi: 10.3168/jds.2008-1932
79. Zhang C, Li A, Zhang X, Xiao HA. Novel TIP30 protein complex regulates EGF receptor signaling and endocytic degradation *. J Biol Chem. (2011) 286:9373–81. doi: 10.1074/jbc.M110.207720
80. Liao BM, Raddatz K, Zhong L, Parker BL, Raftery MJ, Schmitz-Peiffer C. Proteomic analysis of livers from fat-fed mice deficient in either PKCδ or PKCε identifies Htatip2 as a regulator of lipid metabolism. Proteomics. (2014) 14:2578–87. doi: 10.1002/pmic.201400202
81. Cariello NF, Romach EH, Colton HM Ni H, Yoon L, Falls JG, Casey W, et al. Gene expression profiling of the PPAR-alpha agonist ciprofibrate in the cynomolgus monkey liver. Toxicol Sci. (2005) 88:250–64. doi: 10.1093/toxsci/kfi273
82. Guerre-Millo M, Gervois P, Raspé E, Madsen L, Poulain P, Derudas B, et al. Peroxisome proliferator-activated receptor α activators improve insulin sensitivity and reduce adiposity *. J Biol Chem. (2000) 275:16638–42. doi: 10.1074/jbc.275.22.16638
83. Strand DW, Jiang M, Murphy TA Yi Y, Konvinse KC, Franco OE, Wang Y, et al. γ isoforms differentially regulate metabolic networks to mediate mouse prostatic epithelial differentiation. Cell Death Dis. (2012) 3:e361. doi: 10.1038/cddis.2012.99
84. Aprile M, Cataldi S, Ambrosio MR, D'Esposito V, Lim K, Dietrich A, et al. PPARγΔ5, a naturally occurring dominant-negative splice isoform, impairs PPARγ function and adipocyte differentiation. Cell Rep. (2018) 25:1577–92.e6. doi: 10.1016/j.celrep.2018.10.035
85. Chui PC, Guan H-P, Lehrke M, Lazar MA. PPARγ regulates adipocyte cholesterol metabolism via oxidized LDL receptor 1. J Clin Invest. (2005) 115:2244–56. doi: 10.1172/JCI24130
86. Sun C, Liu C, Zhang Z. Cloning of OLR1 gene in pig adipose tissue and preliminary study on its lipid-accumulating effect. Asian-Australas J Anim Sci. (2009) 22:1420–8. doi: 10.5713/ajas.2009.90121
87. Chen Z, Yu H, Shi X, Warren CR, Lotta LA, Friesen M, et al. Functional screening of candidate causal genes for insulin resistance in human preadipocytes and adipocytes. Circ Res. (2020) 126:330–46. doi: 10.1161/CIRCRESAHA.119.315246
88. Ruppert PMM, Park J-G, Xu X, Hur KY, Lee A-H, Kersten S. Transcriptional profiling of PPARα-/– and CREB3L3–/– livers reveals disparate regulation of hepatoproliferative and metabolic functions of PPARα. BMC Genomics. (2019) 20:199. doi: 10.1186/s12864-019-5563-y
89. Nakagawa Y, Satoh A, Tezuka H, Han S, Takei K, Iwasaki H, et al. CREB3L3 controls fatty acid oxidation and ketogenesis in synergy with PPARα. Sci Rep. (2016) 6:39182. doi: 10.1038/srep39182
90. Djouadi F, Habarou F, Bachelier CL, Ferdinandusse S, Schlemmer D, Benoist JF, et al. Mitochondrial trifunctional protein deficiency in human cultured fibroblasts: effects of bezafibrate. J Inherit Metab Dis. (2016) 39:47–58. doi: 10.1007/s10545-015-9871-3
91. Guo Y, Jolly RA, Halstead BW, Baker TK, Stutz JP, Huffman M, et al. Underlying mechanisms of pharmacology and toxicity of a novel PPAR agonist revealed using rodent and canine hepatocytes. Toxicol Sci. (2007) 96:294–309. doi: 10.1093/toxsci/kfm009
92. Shumar SA, Kerr EW, Fagone P, Infante AM, Leonardi R. Overexpression of Nudt7 decreases bile acid levels and peroxisomal fatty acid oxidation in the liver. J Lipid Res. (2019) 60:1005–19. doi: 10.1194/jlr.M092676
93. Reilly S-J, Tillander V, Ofman R, Alexson SEH, Hunt MC. The nudix hydrolase 7 is an Acyl-CoA diphosphatase involved in regulating peroxisomal coenzyme A homeostasis. J Biochem. (2008) 144:655–63. doi: 10.1093/jb/mvn114
94. Marín-Garzón NA, Magalhães AFB, Mota LFM, Fonseca LFS, Chardulo LAL, Albuquerque LG. Genome-wide association study identified genomic regions and putative candidate genes affecting meat color traits in Nellore cattle. Meat Sci. (2021) 171:108288. doi: 10.1016/j.meatsci.2020.108288
95. Kim T, Yang Q. Peroxisome-proliferator-activated receptors regulate redox signaling in the cardiovascular system. World J Cardiol. (2013) 5:164–74. doi: 10.4330/wjc.v5.i6.164
96. Elshazly S, Soliman E, PPAR. gamma agonist, pioglitazone, rescues liver damage induced by renal ischemia/reperfusion injury. Toxicol Appl Pharmacol. (2019) 362:86–94. doi: 10.1016/j.taap.2018.10.022
97. Fischhuber K, Matzinger M, Heiss EH. AMPK enhances transcription of selected Nrf2 target genes via negative regulation of Bach1. Front Cell Dev Biol. (2020) 8:628. doi: 10.3389/fcell.2020.00628
98. Suzuki C, Ushijima K, Ando H, Kitamura H, Horiguchi M, Akita T, et al. Induction of Dbp by a histone deacetylase inhibitor is involved in amelioration of insulin sensitivity via adipocyte differentiation in ob/ob mice. Chronobiol Int. (2019) 36:955–68. doi: 10.1080/07420528.2019.1602841
99. Ushijima K, Suzuki C, Kitamura H, Shimada K, Kawata H, Tanaka A, et al. Expression of clock gene Dbp in omental and mesenteric adipose tissue in patients with type 2 diabetes. BMJ Open Diabetes Res Care. (2020) 8:e001465. doi: 10.1136/bmjdrc-2020-001465
100. Du K, Herzig S, Kulkarni RN, Montminy M. TRB3: a tribbles homolog that inhibits Akt/PKB activation by insulin in liver. Science. (2003) 300:1574–7. doi: 10.1126/science.1079817
101. Weismann D, Erion DM, Ignatova-Todorava I, Nagai Y, Stark R, Hsiao JJ, et al. Knockdown of the gene encoding Drosophila tribbles homologue 3 (Trib3) improves insulin sensitivity through peroxisome proliferator-activated receptor-γ (PPAR-γ) activation in a rat model of insulin resistance. Diabetologia. (2011) 54:935–44. doi: 10.1007/s00125-010-1984-5
102. Luo X, Zhong L, Yu L, Xiong L, Dan W, Li J, et al. TRIB3 destabilizes tumor suppressor PPARα expression through ubiquitin-mediated proteasome degradation in acute myeloid leukemia. Life Sci. (2020) 257:118021. doi: 10.1016/j.lfs.2020.118021
103. Fröhlich A, Kisielow J, Schmitz I, Freigang S, Shamshiev AT, Weber J, et al. IL-21R on T cells is critical for sustained functionality and control of chronic viral infection. Science. (2009) 324:1576–80. doi: 10.1126/science.1172815
104. Ratziu V, Harrison SA, Francque S, Bedossa P, Lehert P, Serfaty L, et al. Elafibranor, an agonist of the peroxisome proliferator-activated receptor-α and -δ, induces resolution of nonalcoholic steatohepatitis without fibrosis worsening. Gastroenterology. (2016) 150:1147–59.e5. doi: 10.1053/j.gastro.2016.01.038
105. Anderson AC. Tim-3, a negative regulator of anti-tumor immunity. Curr Opin Immunol. (2012) 24:213–6. doi: 10.1016/j.coi.2011.12.005
106. Jia J, Abudu YP, Claude-Taupin A, Gu Y, Kumar S, Choi SW, et al. Galectins control MTOR and AMPK in response to lysosomal damage to induce autophagy. Autophagy. (2019) 15:169–71. doi: 10.1080/15548627.2018.1505155
107. Milton FA, Lacerda MG, Sinoti SBP, Mesquita PG, Prakasan D, Coelho MS, et al. Dibutyltin compounds effects on PPARγ/RXRα activity, adipogenesis, and inflammation in mammalians cells. Front Pharmacol. (2017) 8:507. doi: 10.3389/fphar.2017.00507
108. Lu N, Li Y, Zhang Z, Xing J, Sun Y, Yao S, et al. Human Semaphorin-4A drives Th2 responses by binding to receptor ILT-4. Nat Commun. (2018) 9:742. doi: 10.1038/s41467-018-03128-9
109. Delgoffe GM, Woo S-R, Turnis ME, Gravano DM, Guy C, Overacre AE, et al. Stability and function of regulatory T cells is maintained by a neuropilin-1–semaphorin-4a axis. Nature. (2013) 501:252–6. doi: 10.1038/nature12428
110. Collet P, Domenjoud L, Devignes MD, Murad H, Schohn H, Dauça M. The human semaphorin 6B gene is down regulated by PPARs. Genomics. (2004) 83:1141–50. doi: 10.1016/j.ygeno.2004.01.002
111. Liu W, Li J, Liu M, Zhang H, Wang N. PPAR-γ promotes endothelial cell migration by inducing the expression of Sema3g. J Cell Biochem. (2015) 116:514–23. doi: 10.1002/jcb.24994
112. Ji Y, Liu J, Wang Z, Liu N, Gou W, PPAR. γ agonist, rosiglitazone, regulates angiotensin II-induced vascular inflammation through the TLR4-dependent signaling pathway. Lab Invest. (2009) 89:887–902. doi: 10.1038/labinvest.2009.45
113. Sun H, Zhu X, Cai W, Qiu L. Hypaphorine attenuates lipopolysaccharide-induced endothelial inflammation via regulation of TLR4 and PPAR-γ dependent on PI3K/Akt/mTOR signal pathway. Int J Mol Sci. (2017) 18:844. doi: 10.3390/ijms18040844
114. Poleni P-E, Etienne S, Velot E, Netter P, Bianchi A. Activation of PPARs α, β/δ, and γ impairs TGF-β1-induced collagens' production and modulates the TIMP-1/MMPs balance in three-dimensional cultured chondrocytes. PPAR Res. (2010) 2010:635912.
115. Alwayn IPJ, Andersson C, Lee S, Arsenault DA, Bistrian BR, Gura KM, et al. Inhibition of matrix metalloproteinases increases PPAR-α and IL-6 and prevents dietary-induced hepatic steatosis and injury in a murine model. Am J Physiol Gastrointest Liver Physiol. (2006) 291:G1011–9. doi: 10.1152/ajpgi.00047.2006
116. Cheng G, Zhang X, Gao D, Jiang X, Dong W. Resveratrol inhibits MMP-9 expression by up-regulating PPAR α expression in an oxygen glucose deprivation-exposed neuron model. Neurosci Lett. (2009) 451:105–8. doi: 10.1016/j.neulet.2008.12.045
117. Beck IM, Rückert R, Brandt K, Mueller MS, Sadowski T, Brauer R, et al. MMP19 is essential for T cell development and T cell-mediated cutaneous immune responses. PLoS ONE. (2008) 3:e2343. doi: 10.1371/journal.pone.0002343
118. Eiró N, Fernandez-Garcia B, González LO, Vizoso FJ. Cytokines related to MMP-11 expression by inflammatory cells and breast cancer metastasis. Oncoimmunology. (2013) 2:e24010. doi: 10.4161/onci.24010
119. Rodríguez-Baena FJ, Redondo-García S, Peris-Torres C, Martino-Echarri E, Fernández-Rodríguez R, del Plaza-Calonge M, et al. ADAMTS1 protease is required for a balanced immune cell repertoire and tumour inflammatory response. Sci Rep. (2018) 8:13103. doi: 10.1038/s41598-018-31288-7
120. Zimmermann M, Lampe J, Lange S, Smirnow I, Königsrainer A, Hann-von-Weyhern C, et al. Improved reproducibility in preparing precision-cut liver tissue slices. Cytotechnology. (2009) 61:145–52. doi: 10.1007/s10616-009-9246-4
121. Graaf IA de, Groothuis GM, Olinga P. Precision-cut tissue slices as a tool to predict metabolism of novel drugs. Expert Opin Drug Metab Toxicol. (2007) 3:879–98. doi: 10.1517/17425255.3.6.879
122. French PD. Dry matter intake and blood parameters of nonlactating holstein and jersey cows in late gestation. J Dairy Sci. (2006) 89:1057–61. doi: 10.3168/jds.S0022-0302(06)72173-7
123. Grummer RR, Mashek DG, Hayirli A. Dry matter intake and energy balance in the transition period. Vet Clin Food Anim Pract. (2004) 20:447–70. doi: 10.1016/j.cvfa.2004.06.013
124. Guretzky NAJ, Carlson DB, Garrett JE, Drackley JK. Lipid metabolite profiles and milk production for holstein and jersey cows fed rumen-protected choline during the periparturient period1. J Dairy Sci. (2006) 89:188–200. doi: 10.3168/jds.S0022-0302(06)72083-5
125. Pareek CS, Sachajko M, Jaskowski JM, Herudzinska M, Skowronski M, Domagalski K, et al. Comparative analysis of the liver transcriptome among cattle breeds using RNA-seq. Vet Sci. (2019) 6:36. doi: 10.3390/vetsci6020036
126. Gao ST, Girma DD, Bionaz M, Ma L, Bu DP. Hepatic transcriptomic adaptation from prepartum to postpartum in dairy cows. J Dairy Sci. (2021) 104:1053–72. doi: 10.3168/jds.2020-19101
Keywords: PPAR, nutrigenomics, PCLS, dairy cows, liver, peripartum
Citation: Busato S, Ford HR, Abdelatty AM, Estill CT and Bionaz M (2022) Peroxisome Proliferator-Activated Receptor Activation in Precision-Cut Bovine Liver Slices Reveals Novel Putative PPAR Targets in Periparturient Dairy Cows. Front. Vet. Sci. 9:931264. doi: 10.3389/fvets.2022.931264
Received: 28 April 2022; Accepted: 06 June 2022;
Published: 12 July 2022.
Edited by:
Rita Payan Carreira, University of Evora, PortugalReviewed by:
Juan J. Loor, University of Illinois at Urbana-Champaign, United StatesSaif ur Rehman, Guangxi University, China
Copyright © 2022 Busato, Ford, Abdelatty, Estill and Bionaz. This is an open-access article distributed under the terms of the Creative Commons Attribution License (CC BY). The use, distribution or reproduction in other forums is permitted, provided the original author(s) and the copyright owner(s) are credited and that the original publication in this journal is cited, in accordance with accepted academic practice. No use, distribution or reproduction is permitted which does not comply with these terms.
*Correspondence: Massimo Bionaz, bWFzc2ltby5iaW9uYXpAb3JlZ29uc3RhdGUuZWR1