
94% of researchers rate our articles as excellent or good
Learn more about the work of our research integrity team to safeguard the quality of each article we publish.
Find out more
ORIGINAL RESEARCH article
Front. Vet. Sci. , 13 June 2022
Sec. Veterinary Infectious Diseases
Volume 9 - 2022 | https://doi.org/10.3389/fvets.2022.906973
Escherichia coli is a gram-negative bacterium that is distributed widely throughout the world; it is mainly found in contaminated food, the poultry industry, and animal feces. The emergence of antibiotic-resistant E. coli poses a threat to human and animal health, which has led to renewed interest in phage-based therapy. E. coli biofilm control and prevention are of great importance. In this study, the isolated phages Flora and KM18 were found to belong to the family Myoviridae; the optimal preservation buffer was pH = 6~7, and the phage genome sizes were 168,909 (Flora) and 168,903 (KM18) bp. Phage Flora had a broader lytic spectrum than KM18. Phage Flora had a better antibiofilm effect than kanamycin sulfate in high-concentration E. coli cultures. A combination of the phage Flora and kanamycin sulfate showed better antibiofilm effects than Flora or kanamycin sulfate alone in low-concentration E. coli cultures. These characteristics can serve as a guideline for the selection of effective candidates for phage therapy, in this case antibiotic-resistant E. coli control in the poultry industry.
Escherichia coli is a gram-negative bacterium that is distributed widely worldwide; it is mainly found in contaminated food, the poultry industry, and animal feces, and some strains cause intestinal disease (1, 2). Moreover, E. coli O157:H7 is an important human pathogen causing abdominal pain, hemorrhagic colitis, gastroenteritis, diarrhea, and potentially fatal hemolytic-uraemic syndrome (HUS), hemorrhagic colitis, and death (3–5). The overuse of vancomycin, methicillin, trimethoprim, and sulfamethoxazole has led to the generation of many antibiotic-resistant E. coli strains (6–8). Furthermore, with the emergence of an increasing number of multidrug-resistant (MDR) bacteria, antibiotic substitutes are urgently needed (9, 10).
E. coli adhere and internalizes in epithelial cells. E. coli persistence in cattle mammary glands causes mastitis and biofilms formation related to recurrence (10). In addition, E. coli biofilms are related to antibiotic resistance and cattle mastitis. Bacterial biofilms are multicellular communities of microorganisms that embed within a self-produced extracellular matrix attached to non-biological, biological, and highly hydrated extracellular matrices on surfaces (11–13). The extracellular polymeric substances in the matrix of biofilms act as a barrier, reducing the penetration of antimicrobial agents into the interior of the biofilms (14, 15). Biofilms are highly resistant to desiccation, antibiotics, acidic conditions, and heat (16). Bacteria in biofilms are ~10–1,000 times less susceptible to antimicrobial agents than planktonic bacteria because the extracellular polymeric substances of the biofilm prevent contact with antimicrobial agents (17, 18). This makes the complete elimination of biofilms in animal husbandry, the food industry, and the clinic nearly impossible (19).
The abuse of antibiotics results in the problem of multiple resistant bacteria (MRB). In 2003, annually, 80,000 deaths were reported to be caused by the abuse of antibiotics in China (20). Phages and their derivatives are ideal candidates for replacing or compensating for antibiotic problems in the future (21). Phages have the ability to sterilize bacteria (22, 23). Phages appear to be a good alternative to antimicrobials and disinfectants for their ability to kill bacteria. Above all, phages only infect bacteria and are not harmful to humans, making them safe for application in the clinic and food products (24). A recent study found that phages have high efficiency in reducing and controlling bacterial biofilms on various surfaces, such as those produced by Pseudomanas aeruginosa, Salmonella, E. coli, and Listeria monocytogenes (25–28).
Gram-negative phages first attach to the surface receptor lipopolysaccharide via phage tail fiber proteins before they begin to infect bacteria (29). The narrow lytic spectrum restricts the application of phages. In this study, we isolated and characterized two lytic E. coli phages, flora and KM18. This study aimed to characterize the gene characteristics of the tail fiber of two different lytic spectrum phages. In addition, prevention and control of E. coli biofilm contamination are of great importance. The authors aimed to provide direction and a theoretical basis for the development and modification of broad-spectrum phages.
E. coli strains were isolated from a hennery in Yunnan, China, and were used as host bacteria for phage isolation. The host strain and phage host range determination strains were grown aerobically on LB plates or in LB broth (Difco, Detroit, MI, USA) and incubated at 37°C. Soft top agar containing 0.5% (w/w) agar in LB broth was used for phage plaque confirmation, and LB agar plates containing 1.8% (w/w) agar were used for bacterial growth. All E. coli strains were stored at −80°C (Difco, Detroit, MI, USA) in 20% (v/v) glycerol.
E. coli-targeting phages were isolated from a hennery and a foul water sewer. The phage isolation method was modified as follows (30). Briefly, 10 g of the hennery or foul water sewer sample was mixed with 30 ml of sterile normal saline (0.9% NaCl) buffered in a 50 ml sterile centrifuge tube and then shocked in an incubator at 180 rpm for 3 h at room temperature. Then, the samples were centrifuged at 4,500 × g for 10 min and filtered with a 0.22 μm filter membrane. A total of 15 ml of each filtered medium was added to 35 ml of LB broth containing 1% (v/v) of an E. coli overnight culture and then incubated for 2 d. After that, the cultures were centrifuged at 7, 000 × g for 10 min, and the supernatant was filtered with a 0.22 μm filter membrane. The filtrate was diluted by 10-fold serial dilutions, mixed with 6 ml of molten LB soft agar containing 200 μl E. coli (2 × 10⁸ cfu/ml), and immediately added to an LB plate. After overnight culture, plaque formation was observed. A single phage plaque was selected for phage purification, which was repeated three times.
The phage flora stock was diluted to 1 × 10⁸ pfu/ml with LB broth. Liquid buffer (0.99 ml) with pH values of 3, 4, 5, 6, 7, 8, 9, 10, and 11 (50 mmol/L citrate buffer for pH 3, 4, and 5; 50 mmol/L phosphate buffer for pH 6, 7, and 8; 50 mmol/L Tris-HCl buffer for pH 9; 50 mmol/L sodium carbonate buffer for pH 10 and 11) was placed in a 2 ml sterile centrifuge tube, and 0.01 ml of diluted phage Flora with a titer of 1 × 10⁶ pfu/ml was added to each tube. The mixture was placed at room temperature for 1.5 h, and then the titer of phage Flora was assessed in different pH buffers. The experiments were repeated three times. Thermotolerance assessment was performed by placing 1.5 mL diluted phage Flora in temperature controllers at 4, 25, 37, 42, 50, 60, and 90°C for 1.5 h, respectively. The multiplicity of infection (MOI) is the ratio of phages to host bacteria used for the initial infection. Phage Flora stocks were added to the E. coli culture at MOIs of 0.0001, 0.001, 0.01, 0.1 1, 10, and 100, followed by incubation at 37°C for 10 h. The culture was centrifuged at 12, 000 × g for 15 min at 4°C, the supernatant was filtered with a 0.22 μm filter, and the titers of the phage Flora solutions were determined through the double plate method. The experiment was repeated three times. For growth curve measurements, 1 × 10⁸ pfu/ml phage Flora was added to an LB culture containing 1/250 of an E. coli seed culture based on the optimum MOI, and the culture was shaken at 37°C. Intermittent sampling was performed to determine the titer of phage Flora.
The morphology of the phage Flora particles was observed by transmission electron microscopy (TEM). Briefly, each phage stock dilution (~3 × 10⁸ to 3 × 10⁹ pfu/ml) was deposited on copper grids with carbon-coated Formvar films and stained with 2% uranyl acetate (pH 4.0). Phage Flora samples were imaged using a Philips EM 300 electron microscope operated at 80 kV at Ningbo University (Ningbo, China). Phage Flora was classified and identified according to the International Committee on Taxonomy of Viruses.
First, phage Flora was purified by concentrating on a high titer stock with a 10 kDa filter (~109 to 1010 pfu/ml). Purified phage Flora was treated with DNase and RNase at 37°C for 1.5 h. Then, a Takara Minibest Viral RNA/DNA Extraction Kit (Cat# 9766) was used to obtain purified phage Flora genomic DNA. The restriction endonucleases EcorI, Not I, Hind III, and Xhol I were used for phage Flora genome digestion. Extracted phage Flora genomic DNA was sequenced using an Illumina HiSeq (Sangon Biotech, China). The original sequencing data were evaluated by FastQC and assembled with SPAdes assembler software. The NCBI Blast comparison with multiple databases of COG, KOG, CDD, NR, NT, PFAM, SwissProt, and TrEMBL were used for functional annotation information of the gene protein sequences.
The host ranges of phages flora and KM18 were determined by the spot test method (31). The reference strains were tested for susceptibility to phages Flora and KM18. Generally, 250 μl reference strains (109 cfu/ml) was added to 6 ml liquified LB soft agar (LB broth with 0.5% (w/w) agar) and poured over an LB 1.8% (w/w) agar plate. Four minutes later, single drops of the Flora and KM18 phage suspensions were added and incubated at 37 °C for 24 h. The antibiotic susceptibility of the E. coli strains was tested against 17 antibiotics by the minimal inhibitory concentration (MIC) method. The antimicrobials tested were penicillin, streptomycin, kanamycin sulfate, cefoxitin, ampicillin, ceftriaxone, gentamicin, ertapenem, aztreonam, amoxicillin, ciprofloxacin, imipenem, levofloxacin, cefepime, macrodantin, and amikacin.
The amino acid sequences of the E. coli phages Flora and KM18 tail fibers were obtained by genomic sequencing. E. coli phage tail fiber tertiary structure homology modeling was performed using the SWISS-MODEL online suite. Phage tail fiber gene specificity was studied with BioEdit software.
First, the phage preparations were made, and a 48-well-cell slide was placed into a 24-well-plate. The seed solution was inoculated into 100 ml of LB culture solution at a concentration of 4‰. About 1 ml of bacterial solution was inoculated into a 24-well-plate. In one group, phage Flora, kanamycin sulfate, or mixtures of kanamycin sulfate and phage Flora were added, with no addition used as a control (the phage was added at an MOI = 0.1; the final concentration of kanamycin sulfate was 10 μg/ml), followed by incubation (37 °C, 24 h). In the other group, E. coli were cultured first for 12 h, after which phage Flora, kanamycin sulfate, or mixtures of kanamycin sulfate and phage Flora were added, with no addition used as a control (the phage Flora was added at a MOI = 0.1; the final concentration of kanamycin sulfate was 10 μg/ml), followed by incubation (37°C, 12 h). The cfu count of each sample was measured through the plate counting method. Next, the recovered culture was washed twice with PBS buffer and fixed with 2.5% pre-cooled glutaraldehyde at room temperature for 2 h in the dark. The samples were washed twice with PBS buffer and then dehydrated with an increasing ethyl alcohol gradient (15, 30, 40, 50, 70, 100% v/v) for 15 min for each step. Afterward, the samples were dried overnight and gilt and the results were obtained through scanning electron microscopy with an accelerating voltage of 20 kV. The E. coli seed solution was inoculated in LB at a concentration of 4‰ for overnight culture. Then, a 200 times dilution with LB was performed in the 96-well-plate (200 μl/well), and each sample had three replicate wells. For one group, phage Flora, kanamycin sulfate, or mixtures of kanamycin sulfate and phage Flora were added, with no addition used as a control (the phage Flora was added at an MOI = 0.1; the final concentration of kanamycin sulfate was 10 μg/ml), followed by incubation (37 °C, 24 h). In the other group, E. coli was first cultured for 12 h, after which phage Flora, kanamycin sulfate, or mixtures of kanamycin sulfate and phage Flora were added, with no addition used as a control (the phage Flora was added at an MOI = 0.1; the final concentration of kanamycin sulfate was 10 μg/ml), followed by incubation (37°C, 12 h). The E. coli population density (OD600) was measured using an ELISA (Thermo Scientific, EUA), and the bacterial solution was discarded. Each well was washed twice with PBS to remove unattached E. coli, which was repeated three times. Then, 99% methanol was added, and the cells were fixed for 10 min. Then, the methanol was discarded, and the well was dried at room temperature, followed by the addition of 2% crystal violet for 10 min. The culture plate was rinsed with running water until the water was colorless. After drying, the absorbance was measured at a wavelength of 570 nm with a microplate reader. The experiment was repeated three times.
Virulent E. coli phage Flora and KM18 were isolated from a hennery and a foul water sewer in Yunnan, China. The plaques of phages Flora and KM18 appeared 6–8 and 5–7 mm in diameter, respectively, after overnight incubation at 37°C (Figure 1). Negative staining of purified E. coli phages Flora and KM18 was observed using an electron microscope. TEM revealed the phages Flora and KM18 virions to have an icosahedral head of 60 ± 2 nm in diameter and a contractile tail of 150 ± 5 nm in length (Figure 2). The morphology of phages Flora and KM18 indicated that they belong to the family Myoviridae. A one-step growth curve of the phages KM18 and Flora was obtained by inoculation of E. coli at an MOI of 1 at 37 °C (Figure 3). The latent period for the phages KM18 and Flora was 55 min. The titers of phages KM18 and Flora reached peaks very quickly in 20 h and appeared to decrease after 20 h. The burst size of phages KM18 and Flora was ~2000.
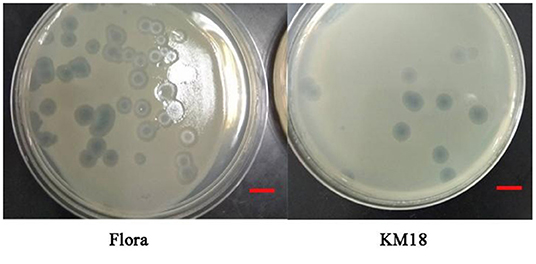
Figure 1. Plaques formed by E. coli phages KM18 and Flora; the host strain was E. coli BL21 incubated overnight at 37°C. The scale was 1 cm.
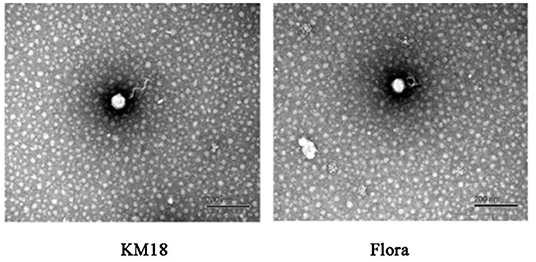
Figure 2. Morphological features of E. coli phages KM18 and Flora as demonstrated by transmission electron microscopy (TEM).
Phages KM18 and Flora had the highest viability after treatment for 1 h at 37°C, with a noticeable decline at 60 °C and complete inactivation at 90 °C (Figure 4). The results showed that phages KM18 and Flora were viable at low temperatures, which is consistent with the optimum survival temperature of E. coli. Phages KM18 and Flora showed the most plaques at pH = 7; furthermore, phages KM18 and Flora had a high activity at pH = 11 and pH = 3 (Figure 4). These results indicated that phages KM18 and Flora have good tolerance to alkali and acids. MOI refers to the ratio of the number of phages to bacterial cells. The optimum MOI of phages KM18 and Flora was 0.0001; among the MOIs tested, plaques of Flora and KM18 decreased significantly starting at MOI = 0.0001 and reaching a minimum at MOI = 100 (Figure 4).
The complete genome sizes of phages Flora and KM18 were 161,903 and 161,909 bp, respectively. We identified 263 protein-coding genes [open reading frames (ORFs)] in Flora. Genome analysis revealed that phages Flora and KM18 are virulent phages (Figure 5). The complete genomic sequences of phage Flora and KM18 were deposited into the NCBI GenBank database (https://www.ncbi.nlm.nih.gov/nuccore) (MT787017 and MT787018).
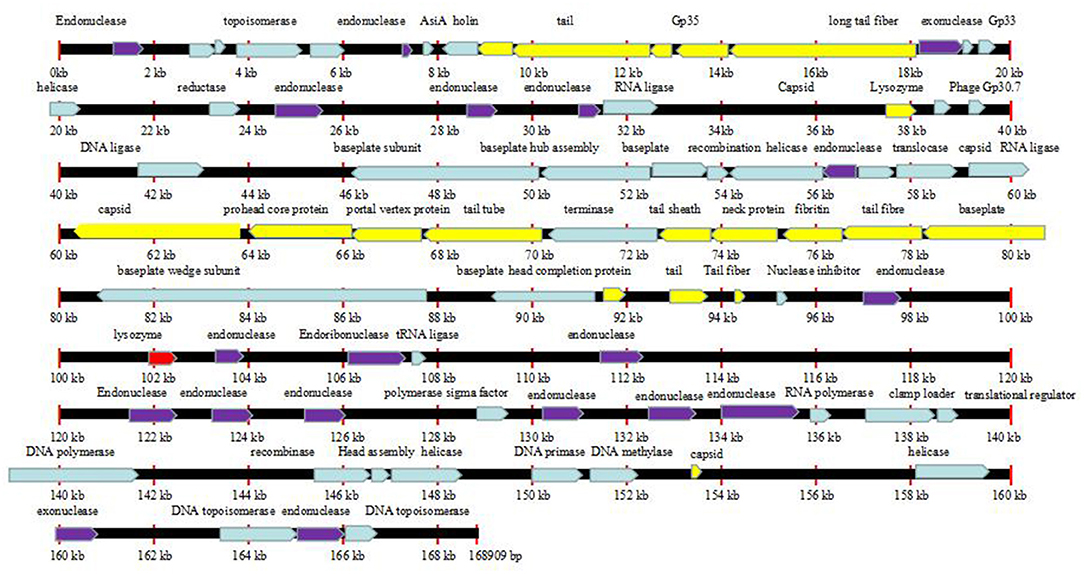
Figure 5. Line map of the phage Flora genome. In the Flora map, genes colored red represent lysozymes, genes colored purple represent endonucleases, and genes colored yellow represent tail structure genes. The arrows represent the ORFs and indicate the direction of transcription.
E. coli strains were isolated from a hennery in Yunnan, China. Unfortunately, they showed a broad spectrum of resistance (Table 1), but fortunately, some of them could be removed by phages Flora and KM18 (Table 2). All the E. coli strains possessed resistance to penicillin, streptomycin, kanamycin sulfate, ertapenem, amoxicillin, imipenem, cefepime, macrodantin, and amikacin but were susceptible to ampicillin and ceftriaxone. Lytic E. coli phage Flora was able to infect 4/10 E. coli strains that were isolated from the hennery in Yunnan, China (Table 2). This analysis demonstrated the wide host range of the isolated phage Flora.
Tail fiber adsorption to bacteria is the first step in phage infection. The E. coli phage tail fiber sequences and sizes have significantly different numbers of amino acids and homologies. Genome sequencing revealed that Flora has 10 different tail fiber genes of 8711-9262, 9290-12370, 12374-13044, 14234-18100, 67787-68278, 68395-70374, 72725-73543, 76778-78361, 92957-93487, and 94262-94504 bp in its genome. The identity and homology of the E. coli phage tail fiber genes were analyzed through BioEdit software. Amino acid differences between Flora and KM18 were located at positions 33 (Q-H), 60 (L-I), 61 (A-P), 220 (A-S), 289 (H-Q), 439 (K-I), and 457 (S-L) of 76,778-78,361 bp in the genome. Compared with the KM18 genome, the Flora Gly amino acid deletion was located at position 322 of 14,234-18,100 bp in the genome (Figure 6). The E. coli phage tail fiber tertiary structure was predicted by SWISS-MODEL (https://swissmodel.expasy.org/). The tail fiber tertiary structures were highly similar between Flora and KM18 and had the same modeling template (https://swissmodel.expasy.org/templates/5iv5.15.A). Compared with KM18 tail fiber homologous modeling, Flora has special β-strands (Figure 7).
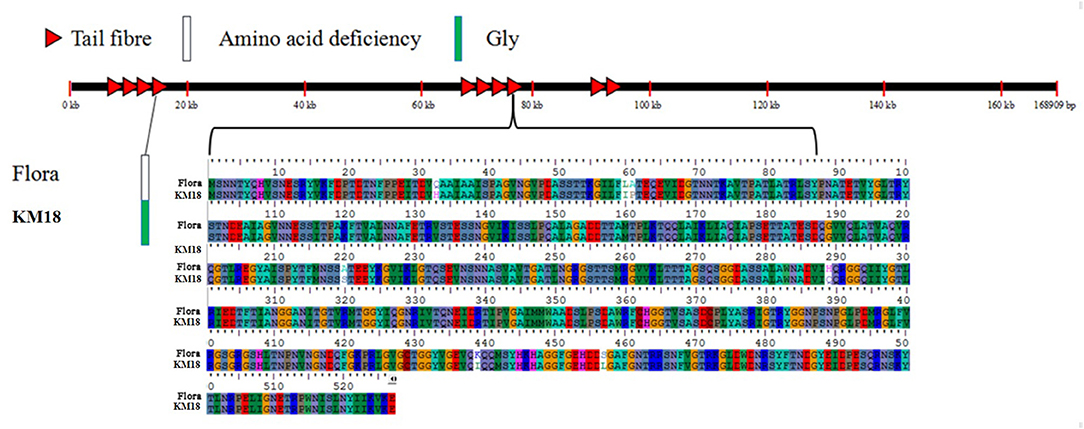
Figure 6. Location of mutated bases and amino acids in the E. coli phage tail fiber proteins of the Flora and KM18 genomes. There are eight base mutations in the whole genome tail fiber; these positions are 322(-/G) of the fourth tail fiber and 33(G/A), 60(A/G), 61(A/G), 220(A/G), 289(A/G), 439(A/G), and 457(A/G) of the eighth tail fiber.
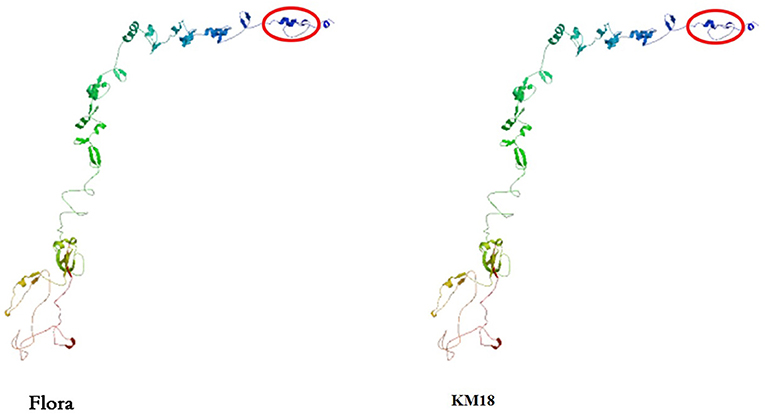
Figure 7. Predicted tertiary structure of the E. coli phage eighth tail fiber protein. Compared with the KM18 eighth tail fiber, Flora has special β strands in the eighth tail fiber.
SEM was used to assess E. coli biofilm formation on round coverslips treated with phage Flora (MOI = 0.1) and kanamycin sulfate (10 μg/ml). After E. coli inoculation at a concentration of 4‰, phage Flora (MOI = 0.1) and kanamycin sulfate (10 μg/ml) were added immediately and cultured for 24 h. Kanamycin sulfate showed a better eradication effect than phage Flora according to the results of the microplate reader OD570 of the E. coli biofilm, the scanning electron micrograph, and the OD600 of the bacterial culture solution (Figures 8–10). Nevertheless, when E. coli was inoculated at a concentration of 4‰ and cultured for 12 h, followed by the addition of phage Flora (MOI = 0.1) and kanamycin sulfate (10 μg/ml) and culturing for 12 h, phage Flora showed a better eradication effect than kanamycin sulfate according to the results of the microplate reader OD570 of the E. coli biofilm, the scanning electron micrograph and the OD600 of the bacterial culture solution (Figures 8–10). In addition, when E. coli was inoculated at a concentration of 4‰ and cultured for 12 h, followed by phage Flora (MOI = 0.1) and kanamycin sulfate (10 μg/ml) addition and culturing for 12 h, the combination of phage Flora and kanamycin sulfate showed a better eradication effect than phage Flora or kanamycin sulfate alone according to the results of the microplate reader OD570 of the E. coli biofilm, the scanning electron micrograph and the OD600 of the bacterial culture solution (Figures 8–10). The results of the E. coli colony-forming units indicated that the combination of phage Flora and kanamycin sulfate showed a better eradication effect than phage Flora or kanamycin sulfate alone (Figure 10).
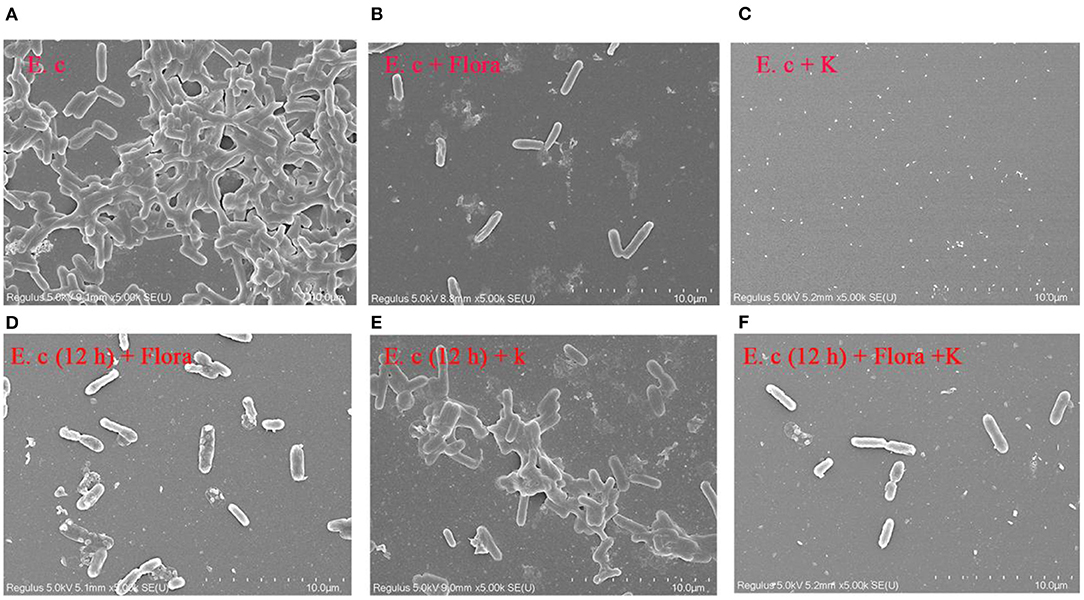
Figure 8. Scanning electron micrographs (SEM) of E. coli colonization before and after phage Flora (MOI = 1) and kanamycin sulfate (10 μg/ml) application to the biofilms formed on round coverslips. (A) E. coli was inoculated at a concentration of 4‰ and cultured for 24 h, followed by (B) addition of phage Flora (MOI = 1) or (C) addition of kanamycin sulfate (10 μg/ml). (D) E. coli was inoculated at a concentration of 4‰ and cultured for 12 h, after which phage Flora (MOI=1) was added and cultured for 12 h. (E) E. coli was inoculated at a concentration of 4‰ and cultured for 12 h, after which kanamycin sulfate (10 μg/ml) was added and cultured for 12 h. (F) E. coli was inoculated at a concentration of 4‰ and cultured for 12 h, after which phage Flora (MOI = 1) and kanamycin sulfate (10 μg/ml) was added and cultured for 12 h (5, 000× magnification).
The E. coli strains used in this study were isolated from a hennery in Yunnan, China; unfortunately, they were resistant to penicillin, streptomycin, kanamycin sulfate, ertapenem, amoxicillin, imipenem, cefepime, macrodantin, and amikacin. The emergence of MDR strains urgently requires new measures to inhibit pathogens. With the overuse of antibiotics, multi-drug-resistant bacteria and superbacteria have led to public health problems (1, 7, 8, 32). The isolated E. coli phage Flora was identified as an ideal substitute for antibiotics due to its strong lytic activity and wide lytic spectrum. Moreover, phage Flora showed a better eradication effect than kanamycin sulfate in a high-concentration culture, and the combination of phage Flora and kanamycin sulfate showed a better eradication effect than phage Flora or kanamycin sulfate alone in a low-concentration culture (Figures 8–10) (33).
The isolated E. coli phages Flora and KM18 belong to the family Myoviridae, and the genome sizes were 168,909 and 168,903 bp, respectively. In comparison, the E. coli phage phiLLS genome size is 107,263 bp, and the genome sizes of phage vB_EcoM-Ro111lw, vB_EcoS-Ro145lw, and vB_EcoM-Ro157lw are between 42 kb and 149 kb; moreover, they all belong to the family Myoviridae (32). Washizaki et al. constructed a phage T4 mutant strain Arl and identified that the amino acid changes at V941E, A955E, and G943S in the DT region of the phage tail fiber played an important role in the interaction with lipopolysaccharide, indicating that the terminal head domain of T4 tail fiber was interacting with lipopolysaccharide (34). The genome characteristics of E. coli phages Flora and KM18 revealed that Flora encodes a special endonuclease and a more unique exonuclease. The extra endonuclease and exonuclease in Flora may be the reason why it has a wider lytic spectrum. Another reason for the wider lytic spectrum of Flora could be its greater resistance than KM18 to restriction enzymes.
The ability to form biofilms on different food surfaces increases the risk of microorganism cross-contamination, particularly in poultry products, which is a serious problem for food industries, clinics, and public health (35–37). However, the significant problem of pathogen biofilm elimination is still challenging (38). Until now, there has been no ideal technology for biofilm control; hence, new control strategies for biofilms are constantly recommended (39). In this study, we demonstrated that phage Flora has better properties than antibiotics for reducing the biofilm formation of E. coli (Figures 8, 9).
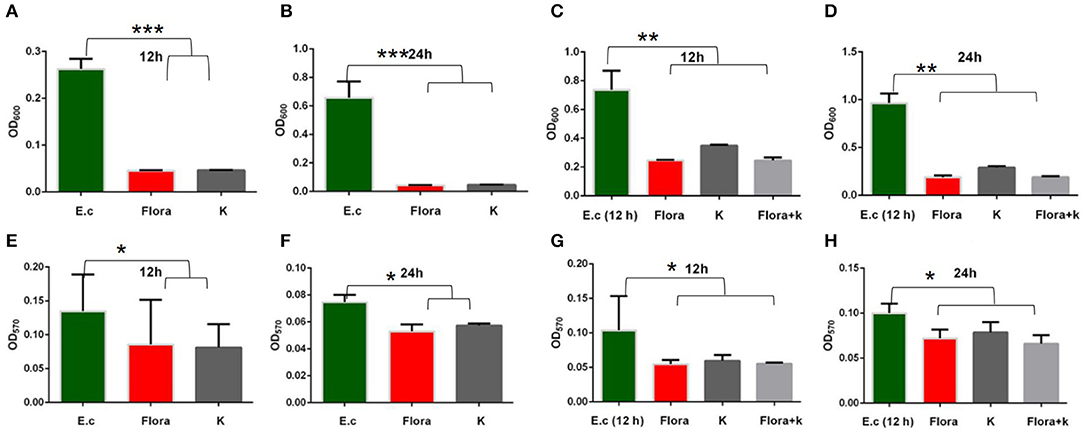
Figure 9. Effects of phages and kanamycin sulfate (10 μg/ml) on biofilms. (A,B) Effects of phage Flora and kanamycin sulfate (10 μg/ml) on E. coli (inoculated at a concentration of 4‰) growth after 12 and 24 h of culture (OD600). (E,F) Effects of phage Flora and kanamycin sulfate (10 μg/ml) on E. coli (inoculated at a concentration of 4‰) biofilms cultured for 12 and 24 h (OD570). (C,D) Effects of phage Flora and kanamycin sulfate (10 μg/ml) on E. coli (inoculated at a concentration of 4‰) growth after first being cultured for 12 h, followed by phage Flora and kanamycin sulfate (10 μg/ml) addition and culturing for 12 and 24 h (OD600). (G,H) Effects of phage Flora and kanamycin sulfate (10 μg/ml) on E. coli (inoculated at a concentration of 4‰) biofilms after first being cultured for 12 h, followed by phage Flora and kanamycin sulfate (10 μg/ml) addition and culturing for 12 and 24 h (OD570). *p < 0.05, **p < 0.01, ***p < 0.001.
The results showed that phage Flora and kanamycin sulfate have the ability to reduce E. coli biofilms. Kanamycin sulfate showed a better antibiofilm effect than phage Flora in low-concentration E. coli cultures (Figures 8–10). Nonetheless, phage Flora showed a better antibiofilm effect than kanamycin sulfate in high-concentration E. coli cultures (Figures 8–10). The data of this study provide strong evidence that the application of phage Flora could reduce the growth of E. coli biofilms, which is important for maintaining public health.
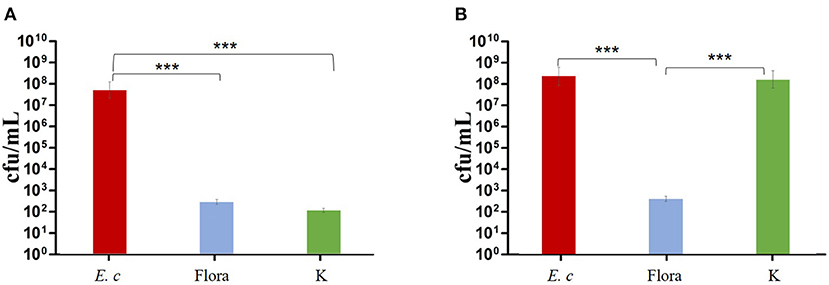
Figure 10. Effects of phage and kanamycin sulfate (10 μg/ml) on E. coli colony-forming units. (A) Effects of phage Flora and kanamycin sulfate (10 μg/ml) on E. coli (inoculated at a concentration of 4‰) cultured for 24 h. (B) Effects of phage Flora and kanamycin sulfate (10 μg/ml) on E. coli (inoculated at rate of 4‰) after first being cultured for 12 h, followed by phage Flora and kanamycin sulfate (10 μg/ml) addition and culturing for 12 h. ***p < 0.001.
In conclusion, we first isolated and characterized lytic E. coli phages and found that the combination of phage and antibiotics shows significantly better antibiofilm and bactericidal properties than either antibiotics or phages alone. The data of this study provide strong evidence that phage application could reduce E. coli biofilm growth, which is important for maintaining public health.
The original contributions presented in the study are included in the article/supplementary material, further inquiries can be directed to the corresponding author.
CL and RZ conceived and designed the experiments. LJ performed the experiments, analyzed the data, and wrote the paper. WL, YJ, and LJ contributed reagents, materials, and analysis tools. All authors read and approved the final manuscript.
This work was supported by the General project of Education Department of Zhejiang Province (Y202043742), the Research Fund Program of Guangdong Provincial Key Lab of Pathogenic Biology and Epidemiology for Aquatic Economic Animals (No. PBEA2020ZD01), the Natural Science Foundation of Ningbo (2021J118 and 2021J113), the National Natural Science Foundation of China (82160403), and the K.C. Wong Magna Fund at Ningbo University.
The authors declare that the research was conducted in the absence of any commercial or financial relationships that could be construed as a potential conflict of interest.
All claims expressed in this article are solely those of the authors and do not necessarily represent those of their affiliated organizations, or those of the publisher, the editors and the reviewers. Any product that may be evaluated in this article, or claim that may be made by its manufacturer, is not guaranteed or endorsed by the publisher.
1. Ahmed AM, Shimamoto T. Isolation and molecular characterization of Salmonella enterica, Escherichia coli O157:H7 and Shigella spp. from meat and dairy products in Egypt. Int J Food Microbiol. (2014) 168–9:57–62. doi: 10.1016/j.ijfoodmicro.2013.10.014
2. Croxen MA, Finlay BB. Molecular mechanisms of Escherichia coli pathogenicity. Nat Rev Microbiol. (2010) 8:26–38. doi: 10.1038/nrmicro2265
3. Jacob ME, Foster DM, Rogers AT, Balcomb CC, Shi X, Nagaraja TG. Evidence of non-O157 Shiga toxin-producing Escherichia coli in the feces of meat goats at a U. S slaughter plant. J Food Prot. (2013) 76:1626–9. doi: 10.4315/0362-028X.JFP-13-064
4. Abnavi MD, Alradaan A, Munther D, Kothapalli CR, Srinivasan P. Modeling of free chlorine consumption and Escherichia coli O157:H7 cross-contamination during fresh-cut produce wash cycles. J Food Sci. (2019) 84:2736–44. doi: 10.1111/1750-3841.14774
5. Karmali MA, Steele BT, Petric M, Lim C. Sporadic cases of haemolytic-uraemic syndrome associated with faecal cytotoxin and cytotoxin-producing Escherichia coli in stools. Lancet. (1983) 1:619–20. doi: 10.1016/S0140-6736(83)91795-6
6. Verstraete MA, Denys RM, Van Minnebruggen K, Hertelé S, De Waele W. Determination of CTOD resistance curves in side-grooved single-edge notched tensile specimens using fullfeld deformation measurements. Eng Fract Mech. (2013) 110:12–22. doi: 10.1016/j.engfracmech.2013.07.015
7. Kemper M. Outbreak of hemolytic uremic syndrome caused by E. coli O104:H4 in Germany: a pediatric perspective. Pediat Nephrol. (2011) 27:161–4. doi: 10.1007/s00467-011-2067-7
8. Yamasaki E, Watahiki M, Isobe J, Sata T, Nair GB, Kurazono H. Quantitative detection of Shiga toxins directly from stool specimens of patients associated with an outbreak of enterohemorrhagic Escherichia coli in Japan-quantitative Shiga toxin detection from stool during EHEC outbreak. Toxins. (2015) 7:4381–9. doi: 10.3390/toxins7104381
9. Tarr PI. Escherichia coli O157:H7: clinical, diagnostic, and epidemiological aspects of human infection. Clin Infect Dis. (1995) 20:1–10. doi: 10.1093/clinids/20.1.1
10. Ansari S, Nepal HP, Gautam R, Shrestha S, Neopane P, Gurung G, et al. Community acquired multi- drug resistant clinical isolates of Escherichia coli in a tertiary care center of Nepal. Antimicrob Resist Infect Control. (2015) 4:15. doi: 10.1186/s13756-015-0059-2
11. Branda SS, Vik S, Friedman L, Kolter R. Biofilms: the matrix revisited. Trends Microbiol. (2005) 13:20–6. doi: 10.1016/j.tim.2004.11.006
12. Flemming HC, Wingender J. The biofilm matrix. Nat Rev Microbiol. (2010) 8:623–33. doi: 10.1038/nrmicro2415
13. Hall-Stoodley L, Costerton JW, Stoodley P. Bacterial biofilms: from the natural environment to infectious diseases. Nat Rev Microbiol. (2004) 2:95–108. doi: 10.1038/nrmicro821
14. Donlan RM, Costerton JW. Biofilms: survival mechanisms of clinically relevant microorganisms. Clin Microbiol Rev. (2002) 15:167–93. doi: 10.1128/CMR.15.2.167-193.2002
15. Shen J, Wang H, Zhu C, Zhang M, Shang F, Xue T. Effect of biofilm on the survival of Staphylococcus aureus isolated from raw milk in high temperature and drying environment. Food Res Int. (2021) 149:110672. doi: 10.1016/j.foodres.2021.110672
16. Davies D. Understanding biofilm resistance to antibacterial agents. Nat Rev Drug Discov. (2003) 2:114–22. doi: 10.1038/nrd1008
17. Luppens SB, Reij MW, van der Heijden RW, Rombouts FM, Abee T. Development of a standard test to assess the resistance of Staphylococcus aureus biofilm cells to disinfectants. Appl Environ Microbiol. (2002) 68:4194–200. doi: 10.1128/AEM.68.9.4194-4200.2002
18. Kumari S, Sarkar PK. Bacillus cereus hazard and control in industrial dairy processing environment. Food Control. (2016) 69:20–9. doi: 10.1016/j.foodcont.2016.04.012
19. Kumar M, Jaiswal S, Sodhi KK, et al. Antibiotics bioremediation: perspectives on its ecotoxicity and resistance. Environ Int. (2019) 124:448–61. doi: 10.1016/j.envint.2018.12.065
20. Chapman B, Gunter C. Local food systems food safety concerns. Microbiol Spectr. (2018) 6:10. doi: 10.1128/microbiolspec.PFS-0020-2017
21. Endersen L, O'Mahony J, Hill C, Ross RP, McAuliffe O, Coffey A. Phage therapy in the food industry. Annu Rev Food Sci Technol. (2014) 5:327–49. doi: 10.1146/annurev-food-030713-092415
22. Chang Y, Shin H, Lee JH, Park CJ, Paik SY Ryu S. Isolation and genome characterization of the virulent Staphylococcus aureus bacteriophage SA97. Viruses. (2015) 7:5225–42. doi: 10.3390/v7102870
23. Sharma S, Chatterjee S, Datta S, et al. Bacteriophages and its applications: an overview. Folia Microbiol. (2017) 62:17–55. doi: 10.1007/s12223-016-0471-x
24. McCallin S, Alam Sarker S, Barretto C, Sultana S, Berger B, Huq S, et al. Safety analysis of a Russian phage cocktail: from metagenomic analysis to oral application in healthy human subjects. Virology. (2013) 443:187–96. doi: 10.1016/j.virol.2013.05.022
25. Ahn J, Kim S, Jung LS, Biswas D. In vitro assessment of the susceptibility of planktonic and attached cells of foodborne pathogens to bacteriophage p22-mediated salmonella lysates. J Food Prot. (2013) 76:2057–62. doi: 10.4315/0362-028X.JFP-13-183
26. Magri ME, Philippi LS, Vinnerås B. Inactivation of pathogens in feces by desiccation and urea treatment for application in urine-diverting dry toilets. Appl Environ Microbiol. (2013) 79:2156–63. doi: 10.1128/AEM.03920-12
27. de Ornellas Dutka Garcia KC, de Oliveira Corrêa IM, Pereira LQ, Silva TM, de Souza Ribeiro Mioni M, de Moraes Izidoro AC, et al. Bacteriophage use to control Salmonella biofilm on surfaces present in chicken slaughterhouses. Poult Sci. (2017) 96:3392–8. doi: 10.3382/ps/pex124
28. Gong C, Jiang X. Application of bacteriophages to reduce Salmonella attachment and biofilms on hard surfaces. Poult Sci. (2017) 96:1838–48. doi: 10.3382/ps/pew463
29. Veesler D, Cambillau C. A common evolutionary origin for tailed-bacteriophage functional modules and bacterial machineries. Microbiol Mol Biol Rev. (2011) 75:423–33. doi: 10.1128/MMBR.00014-11
30. Park M, Lee JH, Shin H, Kim M, Choi J, Kang DH, et al. Characterization and comparative genomic analysis of a novel bacteriophage, SFP10, simultaneously inhibiting both Salmonella enterica and Escherichia coli O157:H7. Appl Environ Microbiol. (2012) 78:58–69. doi: 10.1128/AEM.06231-11
31. Chopin MC, Chopin A, Roux C. Definition of bacteriophage groups according to their lytic action on mesophilic lactic streptococci. Appl Environ Microbiol. (1976) 32:741–6. doi: 10.1128/aem.32.6.741-746.1976
32. Amarillas L, Rubí-Rangel L, Chaidez C, González-Robles A, Lightbourn-Rojas L, León-Félix J. Isolation and characterization of phiLLS, a novel phage with potential biocontrol agent against multidrug-resistant Escherichia coli. Front Microbiol. (2017) 8:1355. doi: 10.3389/fmicb.2017.01355
33. Amézquita-López BA, Quiñones B, Soto-Beltrán M, Lee BG, Yambao JC, Lugo-Melchor OY, et al. Antimicrobial resistance profiles of Shiga toxin-producing Escherichia coli O157 and non-O157 recovered from domestic farm animals in rural communities in Northwestern Mexico. Antimicrob Resist Infect Control. (2016) 5:1. doi: 10.1186/s13756-015-0100-5
34. Washizaki A, Yonesaki T, Otsuka Y. Characterization of the interactions between Escherichia coli receptors, LPS and OmpC, and bacteriophage T4 long tail fibers. Microbiologyopen. (2016) 5:1003–15. doi: 10.1002/mbo3.384
35. AI-Shabib NA, Husain FM, Ahmad I, Khan MS, Khan RA, Khan JM. Rutin inhibits mono and multi-species biofilm formation by foodborne drug resistant Escherichia coli and Staphylococcus aureus. Food Control. (2017) 79:325–32. doi: 10.1016/j.foodcont.2017.03.004
36. Grant A, Hashem F, Parveen S. Salmonella and Campylobacter: antimicrobial resistance and bacteriophage control in poultry. Food Microbiol. (2016) 53:104–9. doi: 10.1016/j.fm.2015.09.008
37. Lianou A, Nychas GE, Koutsoumanis KP. Strain variability in biofilm formation: a food safety and quality perspective. Food Res Int. (2020) 137:109424. doi: 10.1016/j.foodres.2020.109424
38. Møretrø T, Hermansen L, Holck AL, Sidhu MS, Rudi K, Langsrud S. Biofilm formation and the presence of the intercellular adhesion locus ica among staphylococci from food and food processing environments. Appl Environ Microbiol. (2003) 69:5648–55. doi: 10.1128/AEM.69.9.5648-5655.2003
Keywords: Escherichia coli, phage, host range, biofilm, antibiotic
Citation: Jiang L, Jiang Y, Liu W, Zheng R and Li C (2022) Characterization of the Lytic Phage Flora With a Broad Host Range Against Multidrug-Resistant Escherichia coli and Evaluation of Its Efficacy Against E. coli Biofilm Formation. Front. Vet. Sci. 9:906973. doi: 10.3389/fvets.2022.906973
Received: 29 March 2022; Accepted: 28 April 2022;
Published: 13 June 2022.
Edited by:
Lixing Huang, Jimei University, ChinaReviewed by:
Xu-Jie Zhang, Huazhong Agricultural University, ChinaCopyright © 2022 Jiang, Jiang, Liu, Zheng and Li. This is an open-access article distributed under the terms of the Creative Commons Attribution License (CC BY). The use, distribution or reproduction in other forums is permitted, provided the original author(s) and the copyright owner(s) are credited and that the original publication in this journal is cited, in accordance with accepted academic practice. No use, distribution or reproduction is permitted which does not comply with these terms.
*Correspondence: Chenghua Li, bGljaGVuZ2h1YUBuYnUuZWR1LmNu
†These authors have contributed equally to this work
Disclaimer: All claims expressed in this article are solely those of the authors and do not necessarily represent those of their affiliated organizations, or those of the publisher, the editors and the reviewers. Any product that may be evaluated in this article or claim that may be made by its manufacturer is not guaranteed or endorsed by the publisher.
Research integrity at Frontiers

Learn more about the work of our research integrity team to safeguard the quality of each article we publish.