 Fenghua Zhu
 Yang Wang
94% of researchers rate our articles as excellent or good
Learn more about the work of our research integrity team to safeguard the quality of each article we publish.
Find out more
ORIGINAL RESEARCH article
Front. Vet. Sci., 24 May 2022
Sec. Veterinary Pharmacology and Toxicology
Volume 9 - 2022 | https://doi.org/10.3389/fvets.2022.898121
This article is part of the Research TopicAnimal Poisoning Related to Pathology and ToxicologyView all 4 articles
Fumonisin B1 (FB1), produced by Fusarium, is among the most abundant and toxic mycotoxin contaminations in feed, causing damages to the health of livestock. However, the mechanisms of FB1 toxicity in chickens are less understood. As splenic lymphocytes play important roles in the immune system, the aim of this study was to investigate the immunotoxic effects and mechanisms of FB1 on chicken splenic lymphocytes. In the present study, the chicken primary splenic lymphocytes were harvested and treated with 0, 2.5, 5, 10, 20 and 40 μg/mL FB1. Then, the cell proliferation, damage, ultrastructure, inflammation and apoptosis were evaluated. Results showed that the proliferation rate of splenic lymphocytes was decreased by FB1 treatments. The activity of lactate dehydrogenase (LDH) was increased by FB1 treatments in a dose-dependent manner, implying the induction of cell damage. Consistently, the ultrastructure of splenic lymphocytes showed that FB1 at all the tested concentrations caused cell structure alterations, including nuclear vacuolation, mitochondrial swelling and mitochondrial crest fracture. Besides, immunosuppressive effects of FB1 were observed by the decreased concentrations of interleukin-2 (IL-2), IL-4, IL-12 and interferon-γ (IFN-γ) in the cell culture supernatant. Furthermore, apoptosis was observed in FB1-treated cells by flow cytometry. The mRNA expressions of apoptosis-related genes showed that the expression of Bcl-2 was decreased, while the expressions of the P53, Bax, Bak-1, and Caspase-3 were increased with FB1 treatment. Similar results were found in the concentrations of apoptosis-related proteins in the cell supernatant by ELISA assay. Moreover, regression analysis indicated that increasing FB1 concentration increased LDH activity, concentrations of Bax, Bak-1 and mRNA expression of Bak-1 linearly, increased M1 area percentage quadratically, decreased concentration of IFN-γ, mRNA expression of Bcl-2 linearly, and decreased concentrations of IL-2 and IL-4 quadratically. Besides, regression analysis also showed reciprocal relationships between IL-12 concentration, Caspase-3 mRNA expression and increasing FB1 concentration. The increasing FB1 concentration could decrease IL-12 concentration and increase Caspase-3 mRNA expression. Altogether, this study reported that FB1 induced the immunotoxicity of chicken splenic lymphocytes and caused splenic lymphocytes apoptosis by the Bcl-2 family-mediated mitochondrial pathway of caspase activation.
Mycotoxin fumonisins (FBs) are the secondary metabolites produced by Fusarium verticillioides and Fusarium proliferatum (1). Among the fumonisin homologs, fumonisin B1 (FB1) is the most prevalent and abundant mycotoxin contamination in stale corn. It is reported that FB1 has great potential health hazards to humans and animals (2, 3). FB1 can lead to intestinal damage (4, 5), neurotoxity (6, 7) and various cancers (8–10). Moreover, in chickens, FB1 exposure lead to reduced performance, nutrient digestibility, immune function, and increased diarrhea as well as mortality (11–14).
The underlying cellular mechanisms of FB1-induced toxicity include the induction of oxidative stress, apoptosis and immunotoxicity (15, 16). The immunotoxicity of FB1 in chickens may partially be due to the impairment of lymphatic organs and lymphocyte (17, 18). Spleen, a secondary lymphoid organ, is the main filter for blood-borne pathogens and antigens, playing an important role in maintaining immune homeostasis. Circulating T and B cells often gain access to secondary lymphoid organs to search for their cognate antigens (19). Harmful substances, such as cadmium and atrazine can impair chicken spleens (20, 21). It is also reported that exposure to FB1 reduced basal rate of splenic lymphocyte proliferation in female mice (22). In chickens, although Todorova et al. showed that FB1 affected the immune function by damaging the ultrastructure of splenic lymphocyte (18), the detailed immunotoxicity and molecular mechanisms is still unclear. Thus, in this study, we investigated the immunotoxicity of FB1 on splenic lymphocytes by evaluating the proliferation rate, cell damage, the expressions of cytokines, and further tried to examine the potential molecular mechanisms related to apoptosis to provide reference for further research on the toxicity of FB1.
FB1 and RPMI 1640 medium were purchased from Sigma-Aldrich (St. Louis, Mo, USA). Fetal bovine serum (FBS) was purchased from Sijiqing Biological Engineering Materials Co. Ltd. (Hangzhou, China). The methyl thiazolyl tetrazolium (MTT) and lactate dehydrogenase (LDH) assay kits were obtained from Nanjing Jiancheng Bioengineering Institute (Nanjing, China). The chicken interleukin-2 (IL-2), IL-4, IL-6, IL-12, and interferon-γ (IFN-γ) ELISA kits were obtained from Nanjing Jiancheng Bioengineering Institute (Nanjing, China). The propidium iodide (PI) apoptosis detection kit was purchased from BD Pharmingen (Lexington, KY, USA). The chicken B cell CLL/lymphoma-2 (Bc1-2), P53, Bcl-2 associated X (Bax), Bcl-2 antagonist/killer 1 (Bak-1), and cysteinyl aspartate specific proteinase-3 (Caspase-3) ELISA kits were obtained from Qiyi Biological Technology Co. Ltd. (Shanghai, China). RNA extraction kit and the SYBR PremixScript RT-PCR Kit II were purchased from Takara (Shiga, Japan). All other reagents used were of analytical grade.
The 40-day-old healthy male specific pathogen free (SPF) White Leghorn chickens were obtained from Shandong Academy of Agricultural Sciences for splenic lymphocytes isolation and culture. The use of animals was approved and performed in accordance with the guidelines of Ethics and Animal Welfare Committee of Qingdao Agricultural University. Chickens were given intramuscular injections of ketamine-846 anesthesia mixture (Shengda Animal Medicine Co., Ltd., Dunhua, China) prior to splenic lymphocytes harvesting. Chicken splenic lymphocytes were prepared and cultured according to previous method (23). Briefly, spleen samples were removed from the chickens, washed with sterile cooled phosphate buffered saline (PBS) and ground on ice. The mixture was filtered through a 200-mesh sieve into a Petri dish to collect spleen cell suspension. The lymphocytes were collected by centrifuging at 2,000 g for 15 min at room temperature in Histopaque 1077 (Sigma-Aldrich, USA). Then, lymphocytes were washed twice with cooled PBS and re-suspended in RPMI-1640 medium supplemented with 10% FBS, 100 U/mL penicillin, and 100 U/mL streptomycin, and counted using a hemocytometer. Based on trypan blue dye exclusion, when the lymphocytes viability was more than 95%, the cells could be used for the experiments.
In this study, the splenic lymphocytes were treated with 0, 2.5, 5, 10, 20, and 40 μg/mL FB1 according to previous studies (24–26), in which 2.5–50 μg/mL FB1 suppressed the proliferation of chicken primary cells, such as splenocytes and peripheral lymphocytes. The FB1 was dissolved in deionized water to obtain a 40 mg/mL concentration solution. Then, various dilutions of the 40 mg/mL FB1 solution were added to cell cultures with final concentrations of 0, 2.5, 5, 10, 20 and 40 μg/mL FB1. For MTT assay, splenic lymphocytes were cultured in 96-well microplates (1× 10⁴ cells/mL) under 5% CO2 at 42°C, and stimulated with 10 μg/mL concanavalin A (ConA) to induce cell proliferation and treated with 0, 2.5, 5, 10, 20 and 40 μg/mL FB1 for 72 h, with 6 parallel holes in each treatment group. For other assays, splenic lymphocytes were cultured in 24-well microplates (1× 10⁵ cells/mL) under 5% CO2 at 42°C, and treated with 0, 2.5, 5, 10, 20, and 40 μg/mL FB1 for 48 h. Four parallel holes in each treatment group were set for quantitative real-time PCR (RT-PCR) and flow cytometry, and 6 parallel holes were set in each treatment group for the measurement of proliferation rate, inflammatory cytokine levels, LDH activity and apoptosis protein concentrations.
After 72 h treatment with ConA and FB1, 10 μL MTT solution (5 mg/mL) was added in each well and then incubated for 4 h. After incubated with 100 μL of DMSO, the optical density (OD) was measured at 490 nm using a microplate reader (ThermoFisher MK3, USA). Proliferation rate (%) = (OD of cells treated with FB1-OD of cells without FB1 treatment)/OD of cells without FB1 treatment × 100%.
Cells were fixed in a fresh solution of 0.1 M sodium cacodylate buffer containing 2.5% glutaraldehyde and 2% formaldehyde followed by a 2 h fixation at 4°C with 2% osmium tetroxide in 50 mM sodium cacodylate (pH 7.2). Staining was performed overnight with 0.5% aqueous uranyl acetate. Specimens were dehydrated, embedded in Epon 812 and sectioned into ultrathin slices. The sections were examined on CCD camera system (AMT Corp., USA) (27).
The concentrations of inflammatory cytokines, including IL-2, IL-4, IL-6, IL-12, IFN-γ and the activity of LDH were determined spectrophotometrically using commercial kits (Nanjing Jiancheng Bioengineering Institute, China) according to manufacturer's protocol.
After adding pancreatin (HyClone, USA), the cells were harvested by centrifuging at 1,000 g. The cell pellet was fixed in 1.5 mL cold 75% ethanol at 4°C for 8 h. Then, cells were centrifuged, washed in 1 mL PBS and re-suspended in 0.5 mL PBS. To a 0.5 mL cell sample, 0.5 mL RNase A (Sigma-Aldrich, USA) was added, followed by mixing by 1 mL PI (Sigma-Aldrich, USA) solution. The mixed cells were incubated in the dark at room temperature for 30 min and kept at 4°C in the dark until measured. The PI fluorescence was measured using a FC500 flow cytometer (Beckman Coulter, Fullerton, USA).
Total RNA extraction and reverse transcription were performed according to Mao et al. (28). Primer and Oligo softwares were used for PCR primer sequences (Table 1) design. RT-PCR was performed using Premix Ex TaqTM with SYBR Green (TaKaRa, Dalian, China) and ABI Stepone Real-Time PCR System 7500 Fast Real-Time PCR System (Applied Biosystems, Carlsbad, CA, USA). The thermocycle protocol was 30-s at 95°C followed by 40 cycles of 5-s denaturation at 95°C, 34-s annealing/extension at 60°C, and then a final melting curve analysis to monitor purity of the PCR product. The mRNA abundances of Bcl-2, Bax, Bak-1, P53 and Caspase-3 were determined by 2−ΔΔCq method. Relative gene expression concentrations were normalized by eukaryotic reference gene GAPDH.
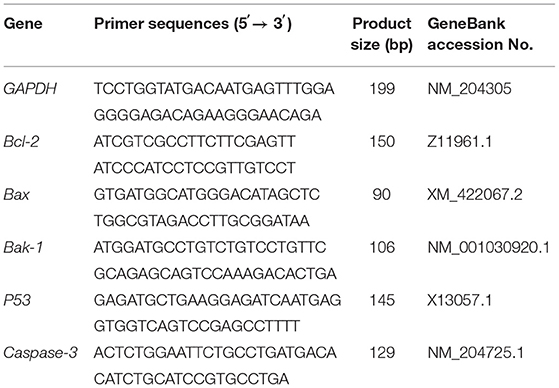
Table 1. RT-PCR primer sequences and products.
The concentrations of Bcl-2, Bax, Bak-1, P53 and Caspase-3 in the cell culture supernatant were measured by ELISA kits according to the manufacture instructions (Qiyi Biological Technology Co. Ltd., Shanghai, China). Briefly, standard solutions were prepared. Then, the specimens were thawed at room temperature and 50 μL aliquots were added to the wells covered with a layer of monoclonal antibody, then incubated at 37°C for 30 min together with the standard solutions. Subsequently, the wells were washed and 50 μL of conjugate reagent was added. The wells were further incubated at 37°C for 30 min at the end of which the wells were washed and 100 μL of streptavidin–horseradish peroxidase (HRP)-tagged antibodies were added. The wells were incubated at 37°C for 30 min. Following another round of washing, 100 μL of tetramethylbenzidine was added to the wells. The wells were incubated at room temperature for 30 min in the dark. The reaction was stopped by adding 50 μL stop solution to the wells. The absorbances of the solutions in the wells were measured by a spectrophotometer at 450 nm. A standard curve was plotted from the absorbance values of the standard solutions and the protein concentrations of the samples were calculated from the standard curve.
One-way ANOVA was performed with the GLM procedure by SAS (SAS Institute Inc, USA, version 9.3), and multiple comparisons were performed with Duncan's test. Results were presented as the means ± standard deviation (SD). The Reg procedure of SAS (SAS Institute Inc, USA, version 9.3) was used for performing the regression of increasing FB1 concentration on the measurements. One-dimensional linear equation, one-dimensional quadratic equation, and reciprocal equation were fit. The significant one with the largest R2 was selected as the most appropriate equation. The differences were considered significant at P < 0.05.
According to Figure 1, compared to the FB1-non-treated cells, the lymphocytes proliferation rate was significantly decreased by FB1 at 2.5, 5, 10, 20 and 40 μg/mL (P < 0.05). Moreover, compared to cells treated with 2.5 μg/mL FB1, cells treated with 10 and 40 μg/mL FB1 had much lower lymphocytes proliferation rate (P < 0.05).
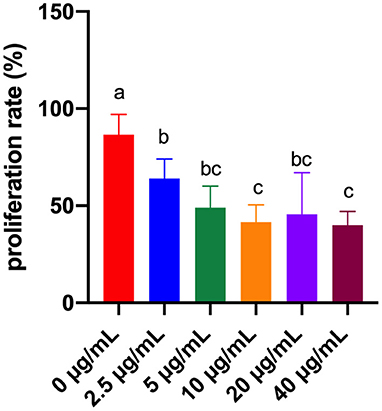
Figure 1. Effects of different concentrations of FB1 on the proliferation rate of splenic lymphocytes. Data are presented as the means ± SD for n = 6. End-point means without a common letter are significantly different (a, b, or c, P < 0.05).
As for the LDH, we found that 2.5, 5, 10, 20, and 40 μg/mL FB1 significantly increased the LDH activity (P < 0.05) in a dose-dependent manner, although there was no significant difference between the 10 and 20 μg/mL FB1 treatment groups (P > 0.05) (Figure 2).
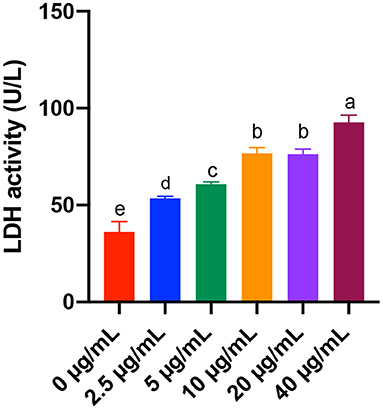
Figure 2. Effects of different concentrations of FB1 on the LDH activity in the culture supernatant of splenic lymphocytes. Data are presented as the means ± SD for n = 6. End-point means without a common letter are significantly different (a, b, c, d, or e, P < 0.05).
TEM results indicated that the non-treated cells had intact cell membrane and nucleus envelope. Moreover, mitochondria also had intact structure and were not swollen. However, 2.5, 5, 10, 20, and 40 μg/mL FB1 caused cell structure damage, including nuclear vacuolation, mitochondrial swelling and mitochondrial crest fracture (Figure 3).
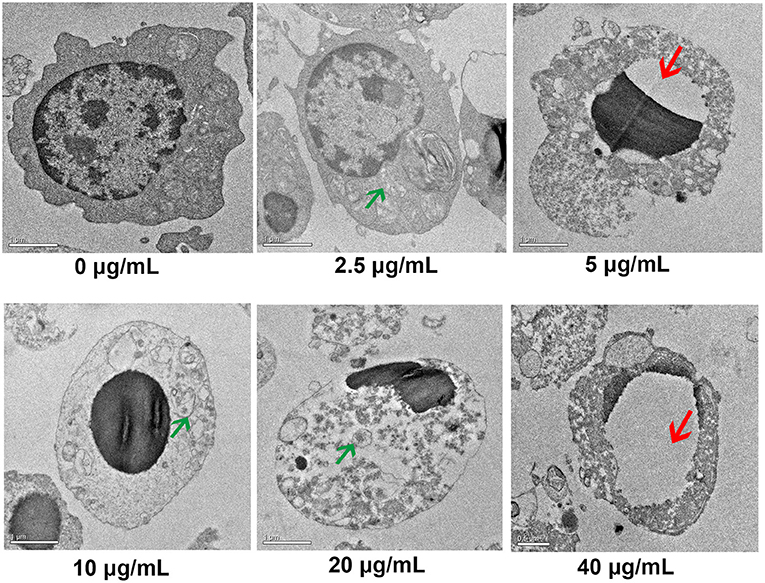
Figure 3. Ultrastructure of splenic lymphocytes by TEM. Green arrows indicate the mitochondrial swelling and mitochondrial crest fracture. Red arrows indicate nuclear vacuolation.
With the treatments of different concentrations of FB1, the concentration of IL-2 was significantly decreased compared to the non-treated group (P < 0.05). Moreover, a dose-dependent effects of FB1 were observed for the reduction of IL-2 concentration. In addition, 5, 10, 20, and 40 μg/mL FB1 also significantly down-regulated the concentration of IL-4 in a dose-dependent manner compared to the non-treated and 2.5 μg/mL FB1-treated cells (P < 0.05). Furthermore, the concentration of IL-12 was also significantly reduced by 5, 10, 20, and 40 μg/mL FB1 (P < 0.05). Compared to 5 and 10 μg/mL FB1, 40 μg/mL FB1 treatment led to a much lower IL-12 concentration (P < 0.05). Besides, the concentration of IFN-γ was significantly reduced by the FB1 at all the tested concentrations (P < 0.05), and 40 μg/mL FB1 induced the lowest IFN-γ concentration compared to that of other FB1 treatments (P < 0.05). However, the concentration of IL-6 was not significantly affected by the treatments of FB1 (P > 0.05) (Table 2).
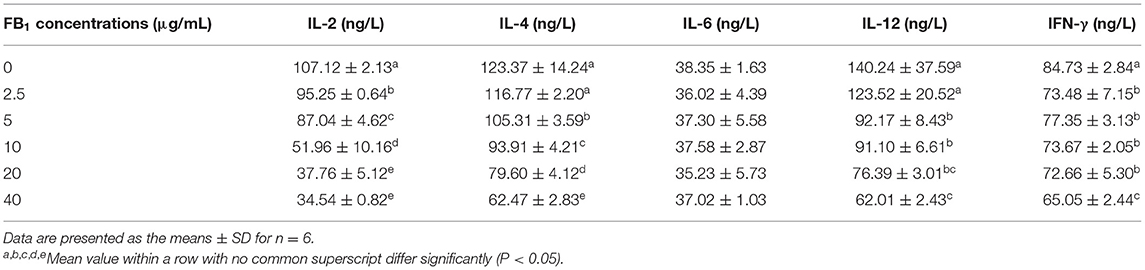
Table 2. Effects of different concentrations of FB1 on the inflammatory cytokines.
Apoptotic cells were quantified by flow cytometry analysis. Early apoptotic cells appear in the cell cycle distribution as cells with a hypodiploid DNA. This alteration in DNA content results from degradation of cellular DNA by activation of endogenous endonucleases during apoptosis (29). Thus, cells in the pre-G0/G1 phase (M1) were therefore defined as apoptotic cells (Figure 4). Results showed that the percentages of cells in M1 area of all the FB1 treatment groups were significantly increased compared to the non-treated ones (P < 0.05). Moreover, compared to the 2.5 and 5 μg/mL FB1 treatments, 10, 20, and 40 μg/mL FB1 treatments significantly increased the percentages of cells in M1 (P < 0.05).
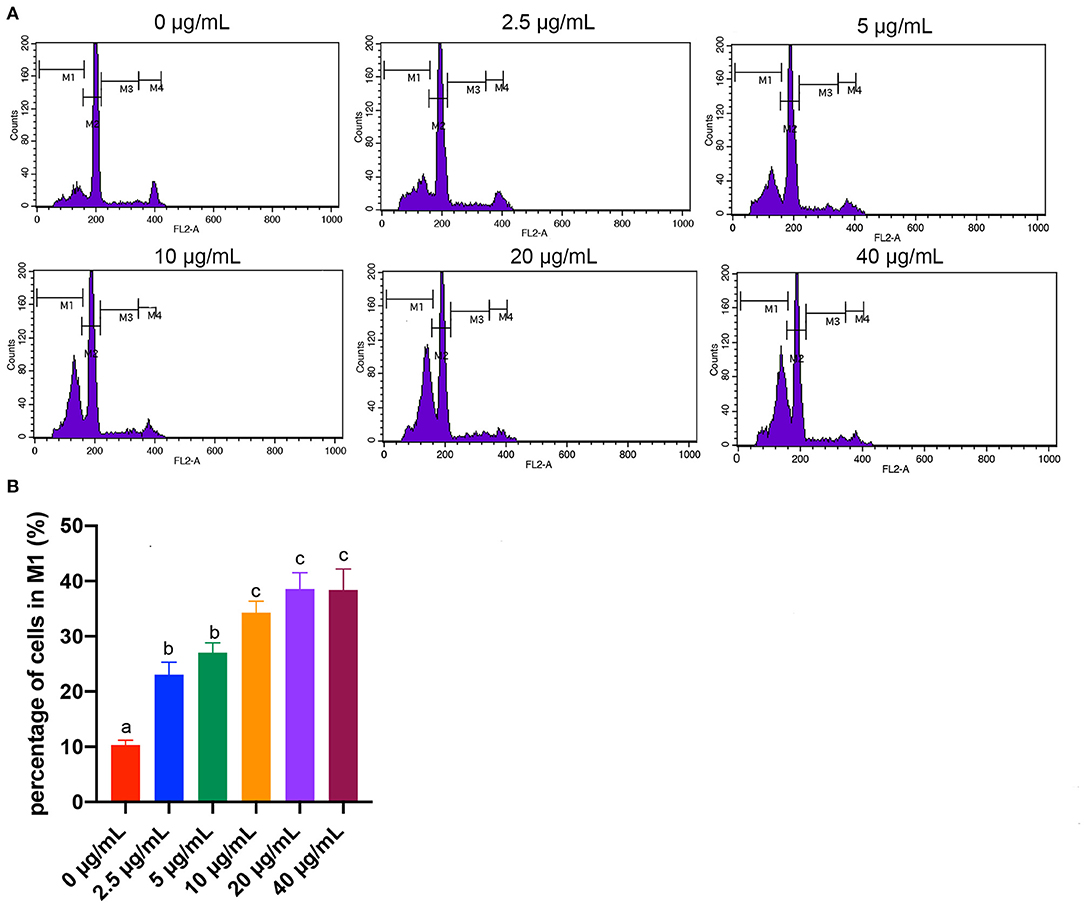
Figure 4. Effects of different concentrations of FB1 on the apoptosis of splenic lymphocytes. (A) Cell apoptosis was analyzed by flow cytometry. M1 gate indicates the pre-G0/G1 (apoptotic) population, M2 gate indicates the G0/G1 phase, M3 gate indicates the S phase and M4 gate indicates the G2/M phase. (B) Percentage of cells in M1 gate. Data are presented as the means ± SD for n = 4. End-point means without a common letter are significantly different (a, b, or c, P < 0.05).
The expression of Bcl-2 was significantly down-regulated by 5, 20, and 40 μg/mL FB1 compared to the cells treated with 0, 2.5 and 10 μg/mL FB1 (P < 0.05). And 40 μg/mL FB1 led to the lowest Bcl-2 mRNA expression (P < 0.05). The expression of P53 was only up-regulated in the 40 μg/mL FB1 treatment group (P < 0.05). Besides, the expression of Bax was significantly up-regulated by 10 and 40 μg/mL FB1 compared to other groups (P < 0.05). In addition, 10, 20 and 40 μg/mL FB1 significantly elevated the expression of Bak-1 (P < 0.05). And 40 μg/mL FB1 induced the highest expression of Bak-1 among groups (P < 0.05). Furthermore, 10 and 40 μg/mL FB1 significantly up-regulated the Caspase-3 expression compared to the non-treated cells (P < 0.05) (Table 3).
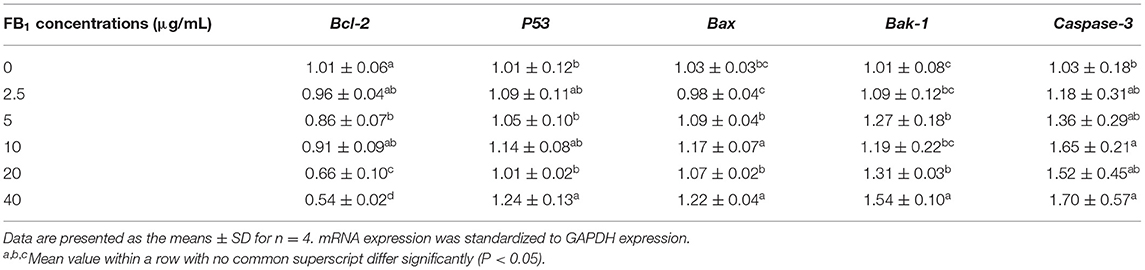
Table 3. Effects of different concentrations of FB1 on the relative expression of apoptosis-related genes.
ELISA results showed that the concentration of Bcl-2 in the cell supernatant was significantly decreased in 5 and 40 μg/mL FB1 treatment groups compared to the non-treated group (P < 0.05). But there was no significant difference for the Bcl-2 concentration among cells treated with FB1 (P > 0.05). Moreover, the concentration of P53 was significantly elevated by FB1 at all the tested concentrations compared to the non-treated group (P < 0.05), in addition, P53 concentration was much higher in 20 and 40 μg/mL FB1-treated groups than that of the 2.5 and 5 μg/mL FB1-treated groups (P < 0.05). FB1 at all the tested concentrations also significantly increased the Bax concentration (P < 0.05), and 40 μg/mL FB1 induced the highest Bax concentration among the groups. Besides, the Bak-1 concentration in the 20 and 40 μg/mL FB1-treated groups was much higher than that of the other groups (P < 0.05). Furthermore, 40 μg/mL FB1 significantly increased Caspase-3 concentration compared to other groups (P < 0.05) (Table 4).
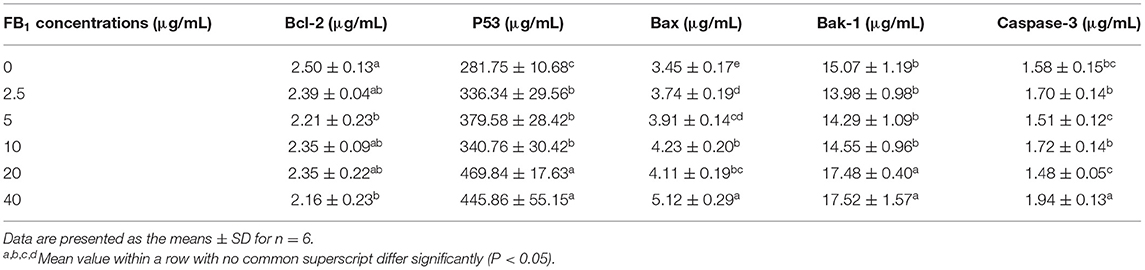
Table 4. Effects of different concentrations of FB1 on the apoptosis-related proteins.
Regression equations are presented in Table 5. Results indicated that increasing FB1 concentration increased the activity of LDH, the concentrations of Bax, Bak-1 and mRNA expression of Bak-1 linearly, increased percentage of M1 area quadratically, decreased concentration of IFN-γ, mRNA expression of Bcl-2 linearly, and decreased concentrations of IL-2 and IL-4 quadratically. Rregression analysis also showed reciprocal relationship between IL-12 concentration, Caspase-3 mRNA expression and increasing FB1 concentration. The increasing FB1 concentration could decrease IL-12 concentration and increase Caspase-3 expression. Proliferation rate tended to decrease with increasing FB1 concentration (P = 0.06).
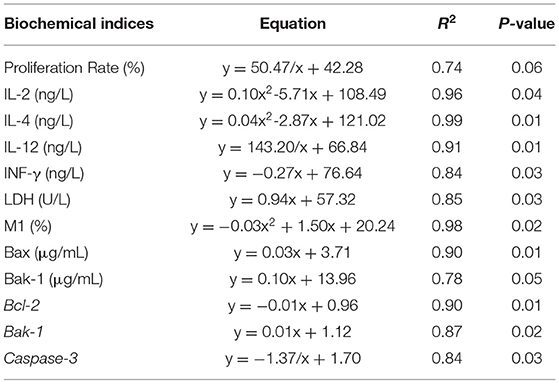
Table 5. Regression equations for FB1 concentrations as a function for biochemical indices of splenic lymphocytes.
Fusarium mycotoxins such as FB1 are the major contaminants in animal feed and induce subclinical symptoms. The spleen of birds is a central immune organ for the proliferation of T and B cells.
In the present study, we aimed to determine the toxic effects and mechanisms of FB1 on splenic lymphocytes. We found the proliferation rate of splenic lymphocytes was significantly decreased by treatments of FB1 at 2.5, 5, 10, 20, and 40 μg/mL. Similarly, Johnson and Sharma also reported that FB1 exposure was able to reduce the lymphocyte proliferation (22). LDH, a key feature of cells undergoing cellular damage, is a stable cytoplasmic enzyme that is found in all cells (30). In the present study, FB1 significantly increased the LDH activity in a dose-dependent manner. Regression
analysis also showed that the LDH activity was increased by increasing FB1 concentrations. Consistent with this result, the ultrastructure of FB1-treated lymphocytes indicated cell impairments, including the mitochondrial swelling, mitochondrial crest fracture and nuclear vacuolation. Cell ultrastructure changes were also observed in a study by Todorova et al. (31). According to this study, the splenic lymphatic nodules were with pale centers, reduced cell number and contained large undifferentiated lymphoblasts or cells with pycnotic nuclei in chickens consuming FB1 and deoxynivalenol.
The immunotoxicity of FB1 has been associated with decreased immune responses (32). Here, the concentrations of IL-2, IL-4, IL-12, and IFN-γ in the cell culture supernatant were decreased by FB1 treatments, and the reductions of IL-2 and IL-4 were in a dose-dependent manner. However, the concentration of IL-6 was not significantly changed by FB1. Regression analysis further demonstrated that the concentrations of IL-2, IL-4, IL-12, and IFN-γ were reduced by increasing FB1 concentrations. Studies demonstrated that splenocytes from female mice exposed to FB1 had a reduced expression of IL-2 mRNA (22). In vitro treatment of swine lymphocytes with FB1 significantly decreased IL-4 production (33). Moreover, the secretions of IL-12 induced by LPS exposure of murine bone marrow-derived dendritic cells were suppressed by FB1 in a dose dependent manner (34). The mRNA concentration of IFN-γ in macrophages was also reduced by supplementation of FB1 in chickens (35). Similar with our results, Bhandari et al. reported that the IL-6 concentration in the spleen of FB1-treated mice was not significantly altered (36). Unfortunately, no other studies have shown related data on splenic lymphocytes to serve for comparison with our results.
The decrease of cell proliferation might not only be associated with the FB1 direct cytotoxicity effects but also be due to apoptosis of lymphocytes (37). Therefore, the pro-apoptotic role of FB1 in splenic lymphocytes was further investigated. Previously, studies indicated that FB1 induced apoptosis of porcine kidney cells (38), human gastric epithelial cells (39) and turkey peripheral blood lymphocytes (40). Currently, we also observed splenic lymphocytes apoptosis with FB1 treatment. Two major apoptotic pathways have been identified: (i) the extrinsic pathway, in which activation of a death receptor by a ligand leads to the activation of initiator Caspase-8; and (ii) the intrinsic pathway, which is caused by cellular stress and cytochrome c release from mitochondria, leading to Caspase-9 activation (41). Once active, Caspase-9 directly cleave and activate Caspase-3 (42). The apoptotic processes that occur before cytochrome c release require a variety of effector molecules, including Bcl-2 family proteins (43, 44). The Bcl-2 family is composed of two subfamilies: one consisting of anti-apoptotic proteins (e.g., Bcl-2, Bcl-XL, Bcl-w, etc.) and the other of pro-apoptotic proteins (e.g., Bax, Bak, Bcl-XS, etc.) (45). In the current study, results of RT-PCR and ELISA demonstrated that the expression of Bcl-2 was decreased, while the expressions of the P53, Bax, Bak-1 and Caspase-3, which can promote apoptosis, were increased with FB1 treatment. Regression analysis suggested that the M1 area percentage, concentrations of Bax, Bak-1 and mRNA expressions of Bak-1 and Caspase-3 were increased, while the Bcl-2 mRNA expression was reduced by increasing FB1 concentrations. These results indicated that FB1 can induce splenic lymphocytes apoptosis by the Bcl-2 family-mediated mitochondrial pathway.
In conclusion, data in this study imply that FB1 strongly suppressed the chicken splenic lymphocytes proliferation and caused cell damage, especially the impairment of structure of mitochondria. The immunosuppressive effect of FB1 was also found by the decreased concentrations of inflammatory cytokines. Moreover, FB1 induced splenic lymphocytes apoptosis through the Bcl-2 family-mediated mitochondrial pathway of caspase activation. Overall, our data provide new evidence for the toxic effects and mechanisms of FB1 on chicken and provide new targets for regulating the FB1-related subclinical symptoms with possible unfavorable economic outcome.
The original contributions presented in the study are included in the article/supplementary material, further inquiries can be directed to the corresponding author/s.
The animal study was reviewed and approved by Ethics and Animal Welfare Committee of Qingdao Agricultural University.
FZ designed the study. YW analyzed data and wrote the manuscript. FZ and YW performed the research and contributed to revision of the manuscript. Both authors read and approved the final manuscript, contributed to the article and approved the submitted version.
This work was supported by the Public Sector Science and Technology Support Program of Qingdao (Grant No. 12-1-3-32-nsh), the National Modern Agricultural Industry Technology System Project of Shandong Province (SDAIT-11-07), National Natural Science Foundation of China (Grant No. 32102586), the Shandong Provincial Natural Science Foundation (Grant No. ZR2020QC183), and the Talents of High Concentration Scientific Research Foundation of Qingdao Agricultural University (Grant No. 663/1119042).
The authors declare that the research was conducted in the absence of any commercial or financial relationships that could be construed as a potential conflict of interest.
All claims expressed in this article are solely those of the authors and do not necessarily represent those of their affiliated organizations, or those of the publisher, the editors and the reviewers. Any product that may be evaluated in this article, or claim that may be made by its manufacturer, is not guaranteed or endorsed by the publisher.
1. Lumsangkul C, Chiang HI, Lo NW, Fan YK, Ju JC. Developmental toxicity of mycotoxin fumonisin B1 in animal embryogenesis: an overview. Toxins. (2019) 11:114. doi: 10.3390/toxins11020114
2. Schelstraete W, Devreese M, Croubels S. Comparative toxicokinetics of Fusarium mycotoxins in pigs and humans. Food Chem Toxicol. (2020) 137:111140. doi: 10.1016/j.fct.2020.111140
3. Ochieng PE, Scippo ML, Kemboi DC, Croubels S, Okoth S, Kang'ethe EK, et al. Mycotoxins in poultry feed and feed ingredients from sub-Saharan Africa and their impact on the production of broiler and layer chickens: a review. Toxins. (2021) 13:633. doi: 10.3390/toxins13090633
4. Oswald IP, Desautels C, Laffitte J, Fournout S, Peters SY, Odin M, et al. Mycotoxin fumonisin B1 increases intestinal colonization by pathogenic Escherichia coli in pigs. Appl Environ Microbiol. (2003) 69:5870. doi: 10.1128/AEM.69.10.5870-5874.2003
5. Bouhet S, Hourcade E, Loiseau N, Fikry A, Martinez S, Roselli M, et al. The mycotoxin fumonisin B1 alters the proliferation and the barrier function of porcine intestinal epithelial cells. Toxicol Sci. (2004) 77:165–71. doi: 10.1093/toxsci/kfh006
6. Doi K, Uetsuka K. Mechanisms of mycotoxin-induced neurotoxicity through oxidative stress-associated pathways. Int J Mol Sci. (2011) 12:5213–37. doi: 10.3390/ijms12085213
7. Domijan AM. Fumonisin B(1): a neurotoxic mycotoxin. Arh Hig Rada Toksikol. (2012) 63:531–44. doi: 10.2478/10004-1254-63-2012-2239
8. Wang H, Wei H, Ma J, Luo X. The fumonisin B1 content in corn from North China, a high-risk area of esophageal cancer. J Environ Pathol Toxicol Oncol. (2000) 19:139–41. Available online at: https://europepmc.org/article/med/10905519
9. Alizadeh AM, Rohandel G, Roudbarmohammadi S, Roudbary M, Sohanaki H, Ghiasian SA, et al. Fumonisin B1 contamination of cereals and risk of esophageal cancer in a high risk area in northeastern Iran. Asian Pac J Cancer Prev. (2012) 13:2625–8. doi: 10.7314/APJCP.2012.13.6.2625
10. Müller S, Dekant W, Mally A. Fumonisin B1 and the kidney: modes of action for renal tumor formation by fumonisin B1 in rodents. Food Chem Toxicol. (2012) 50:3833–46. doi: 10.1016/j.fct.2012.06.053
11. Sobrane Filho ST, Junqueira OM, de Laurentiz AC, da Silva Filardi, da Silva Rubio M, Duarte KF, et al. Effects of mycotoxin adsorbents in aflatoxin B 1-and fumonisin B 1-contaminated broiler diet on performance and blood metabolite. R Bras Zootec. (2016) 45:250–256. doi: 10.1590/S1806-92902016000500007
12. Henry MH, Wyatt RD, Fletchert OJ. The toxicity of purified fumonisin B1 in broiler chicks. Poult Sci. (2000) 79:1378–84. doi: 10.1093/ps/79.10.1378
13. Grenier B, Dohnal I, Shanmugasundaram R, Eicher SD, Selvaraj RK, Schatzmayr G, et al. Susceptibility of broiler chickens to coccidiosis when fed subclinical doses of deoxynivalenol and fumonisins—special emphasis on the immunological response and the mycotoxin interaction. Toxins. (2016) 8:231. doi: 10.3390/toxins8080231
14. Liu JD, Doupovec B, Schatzmayr D, Murugesan GR, Bortoluzzi C, Villegas AM, et al. The impact of deoxynivalenol, fumonisins, and their combination on performance, nutrient, and energy digestibility in broiler chickens. Poult Sci. (2020) 99:272–9. doi: 10.3382/ps/pez484
15. Stockmann-Juvala H, Savolainen K. A review of the toxic effects and mechanisms of action of fumonisin B1. Hum. Exp. Toxicol. (2008) 27:799–809. doi: 10.1177/0960327108099525
16. Bhatti SA, Khan MZ, Saleemi MK, Saqib M, Khan A, ul-Hassan Z. Protective role of bentonite against aflatoxin B1- and ochratoxin A-induced immunotoxicity in broilers. J Immunotoxicol. (2017) 14:66–76. doi: 10.1080/1547691X.2016.1264503
17. Mwanza M, Kametler L, Bonai A, Rajli V, Kovacs M, Dutton KMF. The cytotoxic effect of fumonisin B1 and ochratoxin A on human and pig lymphocytes using the Methyl Thiazol Tetrazolium (MTT) assay. Mycotoxin Res. (2009) 25:233–8. doi: 10.1007/s12550-009-0033-z
18. Todorova KS, Kril AI, Dimitrov PS, Gardeva EG, Toshkova RA, Tasheva YR, et al. Effect of fumonisin B1 on lymphatic organs in broiler chickens-pathomorphology. Bull Vet Inst Pulawy. (2011) 55:801–5. doi: 10.2376/0005-9366-124-83
19. Bronte V, Pittet MJ. The spleen in local and systemic regulation of immunity. Immunity. (2013) 39:806–918. doi: 10.1016/j.immuni.2013.10.010
20. Chen D, Zhang Z, Yao H, Liang Y, Xing H, Xu S. Effects of atrazine and chlorpyrifos on oxidative stress-induced autophagy in the immune organs of common carp (Cyprinus carpio L.). Fish Shellfish Immun. (2015). 44:12–20. doi: 10.1016/j.fsi.2015.01.014
21. Chen M, Li X, Fan R, Yang J, Jin X, Hamid S, et al. Cadmium induces BNIP3- dependent autophagy in chicken spleen by modulating miR-33-AMPK axis. Chemosphere. (2017) 194:396–402. doi: 10.1016/j.chemosphere.2017.12.026
22. Johnson VJ, Sharma RP. Gender-dependent immunosuppression following subacute exposure to fumonisin B1. Int Immunopharmacol. (2001) 1:2023–34. doi: 10.1016/S1567-5769(01)00131-X
23. Xiao Y, Xu S, Zhao S, Liu K, Lu Z, Hou Z. Protective effects of selenium against zearalenone-induced apoptosis in chicken spleen lymphocyte via an endoplasmic reticulum stress signaling pathway. Cell Stress Chaperon. (2019) 24:77–89. doi: 10.1007/s12192-018-0943-9
24. Wu W, Liu T, Vesonder RF. Comparative cytotoxicity of fumonisin B1 and moniliformin in chicken primary cell cultures. Mycopathologia. (1995) 132:111–6. doi: 10.1007/BF01103783
25. Li YC, Ledoux DR, Bermudez AJ, Fritsche KL, Rottinghaus GE. Effects of fumonisin B1 on selected immune responses in broiler chicks. Poult Sci. (1999) 78:1275–82. doi: 10.1093/ps/78.9.1275
26. Keck BB, Bodine AB. The effects of fumonisin B1 on viability and mitogenic response of avian immune cells. Poult Sci. (2006) 85:1020–4. doi: 10.1093/ps/85.6.1020
27. Hackenberg S, Friehs G, Kessler M, Froelich K, Ginzkey C, Koehler C, et al. Nanosized titanium dioxide particles do not induce DNA damage in human peripheral blood lymphocytes. Environ Mol Mutagen. (2011) 52:264–8. doi: 10.1002/em.20615
28. Mao Y, Wang B, Xu X, Du W, Li W, Wang Y. Glycyrrhizic acid promotes M1 macrophage polarization in murine bone marrow-derived macrophages associated with the activation of JNK and NF-kappaB. Mediators Inflamm. (2015) 2015:372931. doi: 10.1155/2015/372931
29. Liu KZ, Li J, Kelsey SM, Newland AC, Mantsch HH. Quantitative determination of apoptosis on leukemia cells by infrared spectroscopy. Apoptosis. (2001) 6:269–78. doi: 10.1023/A:1011383408381
30. Kumar P, Nagarajan A, Uchil D. Analysis of cell viability by the lactate dehydrogenase assay. Cold Spring Harb Protoc. (2018) 2018:6. doi: 10.1101/pdb.prot095497
31. Todorova K, Dimitrov P, Toshkova R, Lazaroza S, Gardeva E, Yossifova L, et al. Influence of fumonisin B1 and deoxynivalenol on the immune system of chickens after application in quantities, naturally presented in fodders. Medecine. (2014) 67:139–44. Available online at: https://www.researchgate.net/publication/281775009
32. Li YC, Ledoux DR, Bermudez AJ, Fritsche KL, Rottinghaus GE. The individual and combined effects of fumonisin B1 and moniliformin on performance and selected immune parameters in turkey poults. Poult Sci. (2000) 79:871–8. doi: 10.1093/ps/79.6.871
33. Taranu I, Marin DE, Bouhet S, Pascale F, Bailly JD, Miller JD, et al. Mycotoxin fumonisin B1 alters the cytokine profile and decreases the vaccinal antibody titer in pigs. Toxicol Sci. (2005) 84:301–7. doi: 10.1093/toxsci/kfi086
34. Li Y, Fan Y, Xia B, Xiao Q, Wang Q, Sun W, et al. The immunosuppressive characteristics of FB1 by inhibition of maturation and function of BMDCs. Int Immunopharmacol. (2017) 47:206–11. doi: 10.1016/j.intimp.2017.03.031
35. Cheng YH, Ding ST, Chang MH. Effect of fumonisins on macrophage immune functions and gene expression of cytokines in broilers. Arch Anim Nutr. (2006) 60:267–76. di: 10.1080/17450390600785079 doi: 10.1080/17450390600785079
36. Bhandari N, Brown CC, Sharma RP. Fumonisin B1-induced localized activation of cytokine network in mouse liver. Food Chem Toxicol. (2002) 40:1483–91. doi: 10.1016/S0278-6915(02)00075-3
37. Jones C, Ciacci-Zanella JR, Zhang Y, Henderson G, Dickman M. Analysis of fumonisin B1-induced apoptosis. Environ Health Perspect. (2001) 109(Suppl. 2):315–20. doi: 10.1289/ehp.01109s2315
38. Chen J, Yang S, Huang S, Yan R, Wang M, Chen S, et al. Transcriptome study reveals apoptosis of porcine kidney cells induced by fumonisin B1 via TNF signalling pathway. Food Chem Toxicol. (2020) 139:111274. doi: 10.1016/j.fct.2020.111274
39. Yu S, Jia B, Yang Y, Liu N, Wu A. Involvement of PERK-CHOP pathway in fumonisin B1-induced cytotoxicity in human gastric epithelial cells. Food Chem Toxicol. (2020) 136:111080. doi: 10.1016/j.fct.2019.111080
40. Dombrink-Kurtzman MA. Fumonisin and beauvericin induce apoptosis in turkey peripheral blood lymphocytes. Mycopathologia. (2003) 156:357–64. doi: 10.1023/B:MYCO.0000003607.69016.d2
41. Fuchsluger TA, Jurkunas U, Kazlauskas A, Dana R. Corneal endothelial cells are protected from apoptosis by gene therapy. Hum Gene Ther. (2011) 22:549–58. doi: 10.1089/hum.2010.079
42. Brentnall M, Rodriguez-Menocal L, De Guevara RL, Cepero E, Boise LH. Caspase-9, caspase-3 and caspase-7 have distinct roles during intrinsic apoptosis. BMC Cell Biol. (2013) 14:32. doi: 10.1186/1471-2121-14-32
43. Scorrano L, Korsmeyer SJ. Mechanisms of cytochrome c release by proapoptotic BCL-2 family members. Biochem Biophys Res Commun. (2003) 304:437–44. doi: 10.1016/S0006-291X(03)00615-6
44. Burlacu A. Regulation of apoptosis by Bcl-2 family proteins. J Cell MolMed. (2003) 3:249–57. doi: 10.1111/j.1582-4934.2003.tb00225.x
Keywords: fumonisin B1, chicken, splenic lymphocytes, immunotoxicity, apoptosis
Citation: Zhu F and Wang Y (2022) Fumonisin B1 Induces Immunotoxicity and Apoptosis of Chicken Splenic Lymphocytes. Front. Vet. Sci. 9:898121. doi: 10.3389/fvets.2022.898121
Received: 17 March 2022; Accepted: 03 May 2022;
Published: 24 May 2022.
Edited by:
Ziwei Zhang, Northeast Agricultural University, ChinaReviewed by:
Adil Mehraj Khan, Sher-e-Kashmir University of Agricultural Sciences and Technology, IndiaCopyright © 2022 Zhu and Wang. This is an open-access article distributed under the terms of the Creative Commons Attribution License (CC BY). The use, distribution or reproduction in other forums is permitted, provided the original author(s) and the copyright owner(s) are credited and that the original publication in this journal is cited, in accordance with accepted academic practice. No use, distribution or reproduction is permitted which does not comply with these terms.
*Correspondence: Yang Wang, eWFuZ3dhbmdAcWF1LmVkdS5jbg==
Disclaimer: All claims expressed in this article are solely those of the authors and do not necessarily represent those of their affiliated organizations, or those of the publisher, the editors and the reviewers. Any product that may be evaluated in this article or claim that may be made by its manufacturer is not guaranteed or endorsed by the publisher.
Research integrity at Frontiers
Learn more about the work of our research integrity team to safeguard the quality of each article we publish.