 Elisabeth-Lidwien J. M. M. Verdegaal1,2*
 Gordon S. Howarth1,3
 Todd J. McWhorter1
 Catherine J. G. Delesalle2
- 1Equine Health and Performance Centre, University of Adelaide, Adelaide, SA, Australia
- 2Department of Translational Physiology, Infectiology and Public Health, Research Group of Comparative Physiology, Faculty of Veterinary Medicine, Ghent University, Merelbeke, Belgium
- 3Gastroenterology Department, Women's and Children's Hospital, Adelaide, SA, Australia
Hyperthermia is a performance and welfare issue for exercising horses. The thermoregulatory stressors associated with exercise have typically been estimated by responses in the laboratory. However, monitoring surface skin temperature (Tsk) coincident with core temperature (Tc) has not previously been investigated in horses exercising in the field. We investigated the suitability of monitoring surface Tsk as a metric of the thermoregulatory response, and simultaneously investigated its relationship with Tc using gastrointestinal (GI) temperature. We evaluated Tsk in 13 endurance horses competing during four endurance rides over 40 km (n = 1) or a total of 80 km (n = 12) distance. Following each 40-km loop, the horses were rested for 60 min. Tsk and Tc were continuously recorded every 15 s by an infrared thermistor sensor located in a modified belt and by telemetric GI pill, respectively, and expressed as mean ± SD. The net area under the curve (AUC) was calculated to estimate the thermoregulatory response to the thermal load of Tsk over time (°C × minutes) using the trapezoidal method. The relationship between Tsk and Tc was assessed using scatterplots, paired t-test or generalized linear model ANOVA (delta Tsk) (n = 8). Ambient temperature ranged from 6.7°C to 18.4°C. No relationship was found between Tsk and Tc profiles during exercise and recovery periods, and no significant difference between delta Tsk results was detected when comparing exercise and rest. However, time to maximum Tsk (67 min) was significantly reduced compared to Tc (139 min) (p = 0.0004) with a significantly lesser maximum Tsk (30.3°C) than Tc (39°C) (p = 0.0002) during exercise. Net AUC Tsk was 1,164 ± 1,448 and −305 ± 388°C × minutes during periods of exercise and recovery, respectively. We conclude that Tsk monitoring does not provide a reliable proxy for the thermoregulatory response and horse welfare, most probably because many factors can modulate Tsk without directly affecting Tc. Those factors, such as weather conditions, applicable to all field studies can influence the results of Tsk in endurance horses. The study also reveals important inter-individual differences in Tsk and Tc time profiles, emphasizing the importance of an individualized model of temperature monitoring.
Introduction
In the face of climate change, hyperthermia and heat stress have become increasingly challenging issues for a wide array of equine sports disciplines, especially during field competitions (1, 2). An increase in core body temperature (Tc) leading to hyperthermia may cause widespread cytotoxicity as a direct effect of heat, while indirect effects related to decreased cardiac output cause neural and intestinal ischemia. If unchecked, these systemic inflammation processes eventually lead to exertional heat illness (EHI) (3–5). The clinical manifestations of EHI include neurological signs, varying from irritability, depression, ataxia, collapse, and may further progress to exertional heat stroke (EHS) with multi-organ dysfunction and death (3–5). In human athletes, EHS is among the top three causes of sudden death, and, in summer, it is the number one cause of athlete death in the USA (3). Similarly, both EHI and EHS are problematic conditions in equine athletes (6). The prevalence of metabolic disorders in, for example, endurance horses, triggered by thermoregulatory-induced physiological feedback failure and exhaustion, ranges from 4.2% to 15% (7–14). Recently, the prevalence of EHI in racehorses has been reported: two studies from Japan state prevalence of 0.09% during summer with a clear increase over the past few years (15, 16). Moreover, a study in Eastern Australia focused on selected EHI cases post-exercise at the racetrack and suggested an EHI incidence of up to 9.5% during hot summer months (17). The latter study used the four severity levels of EHI reported by Brownlow et al. (4) and concluded that 96% of horses could be categorized as Level 1. This suggests that a low level and thus discrete EHI cases may have been overlooked in the past.
Environmental conditions are the dominant risk factor in heat stress events, and EHI cases are expected to further increase in prevalence due to global warming (1, 4, 15–17). That worrying reality drives the ongoing efforts of research groups worldwide to develop reliable approaches to monitor and safeguard thermoregulatory wellbeing in horses (2, 18–21). We have previously reported on the continuous monitoring of the thermoregulatory response in endurance and trotter horses using a telemetric gastrointestinal (GI) pill (2). Briefly, the GI temperature pill is a non-invasive method to monitor Tc during exercise in the field. The GI pill was administered the night before the endurance competition to allow recording of a large temperature data set to establish Tc profiles of exercising horses. The data were telemetrically transferred to a device located in a belt under the saddle girth and supported continuous real-time monitoring. It was demonstrated that the GI telemetry pill is a reliable method to monitor Tc and assess the individual dynamic thermal response in exercising horses in the field. The study revealed important inter-individual differences in Tc time profiles, despite the horses performing the same exercise protocol. This finding emphasizes the importance of an individualized model of temperature monitoring. It can be concluded that the continuous monitoring approach allows for intervention at the early stages of heat accumulation and the possibility to take prompt and effective preventative measures.
Another elegant approach to monitoring the thermoregulatory response in exercising horses in the field could be continuous monitoring of surface skin temperature (Tsk) as a reliable proxy for monitoring thermoregulatory wellbeing. Advantages of using tools, such as infrared thermography (IRT), to assess Tsk include the non-invasive nature and easy collection of temperature data (22–24). Notably, most exercise studies use such monitoring methods to assess Tsk only pre- or post-exercise, not during exercise. To illustrate, a recent systematic review of Tsk studies performed in human endurance athletes has reported that only a few studies involved the continuous monitoring of Tsk; only two out of the 45 exercise studies monitored Tsk every 30 s, one study every 180 s, and four studies every 5 min (24). Also, these human studies highlight the existence of essential inter-individual differences with respect to the Tsk response time profile (24). Important inter-individual Tsk differences have been reported in all mammals (23, 25). For example, an equine study comparing Tsk in 21 horses at rest revealed significant inter-individual differences (26). Most existing equine thermoregulatory exercise studies (n = 12 studies) involving Tsk have focused on single point post-exercise measurements using a handheld IRT camera, leaving both the pre-exercise and intra-exercise periods out of their scope (21, 22, 27–37). An overview of all Tsk studies on horses at rest and during exercise is presented in Supplementary Table 1.
To date, only a few equine studies have focused on continuous monitoring of Tsk during exercise and recovery (n = 7, Supplementary Table 1). All were conducted in laboratory conditions, for example, on a treadmill (37–42). Only one study has recorded Tsk continuously during a short bout of field exercise of 4.5-min duration to investigate the effect of pre-exercise cooling in 10 horses (20). The study recorded surface Tsk using a microchip (i-Button®) attached to the skin with removable glue and simultaneously monitored rectal temperature (Tre) using a rectal probe; both Tsk and Tre reduced over time (3°C and 0.3°C, respectively).
From a physiological standpoint, it is essential to appreciate that a time lag exists between exercise-induced metabolic heat (MH) output and Tc evolvement. The Tc is subsequently translated into an additional temperature time-lag evolvement, expressed at several different anatomical locations, such as the rectum, the muscular compartment, and the skin surface, whether or not additionally complicated by environmental factors, such as hot and humid weather (1, 25, 39, 43–48). Most importantly, Tre evolvement has been reported to significantly lag behind the Tc both during and after exercise (19, 38, 49), which renders the Tre less suitable as a “whistle blower” for thermoregulatory instability. In our previous studies, we demonstrated that GI temperature is a more reliable proxy for the thermoregulatory response and Tc when compared to Tre, and that continuously monitoring GI temperature evolvement demonstrated how the equine body copes with exercise, challenging the thermoregulatory system (2, 19). Endurance horses, for example, reached their mean maximum Tc (39.0 ± 0.4°C) during exercise at 75% of completion of exercise, and Tc returned to the baseline within 60 min into recovery (2). However, the mean Tc was still 38.8 ± 0.4°C at a heart rate (HR) of 60 bpm, which currently governs “fit-to-continue” competition decisions (50), thus questioning the use of HR values to make such important decisions. However, contrary to this finding, trotter horses reached a comparable mean maximum Tc (38.8 ± 0.5°C) during recovery. Moreover, in 30% of trotters, Tc was still > 39°C at the end of the recovery period (40 ± 32 min), following exercise in a cool environment, findings that may have post-exercise management implications.
To identify a reliable proxy for thermoregulatory response in the field, a solid correlation must exist between that specific proxy and Tc evolvement, despite the existence of a time lag (24, 47). However, currently, very few equine studies have involved the simultaneous continuous monitoring of Tc (either using carotid artery temperature, or a GI pill, or the Tre), together with an additional temperature monitoring device during field exercise (19, 20, 51). On the other hand, with the ongoing development of new wearables and sensors, there are an increasing number of exercise studies investigating continuous Tsk, monitoring wearables (20, 37–40, 42, 52) (Supplementary Table 1 in Supplementary Material). These devices all provide data output, although the physiological meaning of these data is not always clear.
The MH produced during exercise needs to be dissipated from the horse to the surrounding environment through four main pathways, namely, radiation, conduction, convection, and evaporation, the last being the most essential and pivotal pathway in horses (23, 48, 53–56). Evaporation from the body surface is mainly achieved by increased blood flow, cutaneous vasodilation followed by evaporation of sweat from the skin (70–85% of the MH load) (25, 48, 54, 56–59). Heat loss by evaporation can be enhanced by cooling techniques (35, 40, 43). When focusing on Tsk as a temperature monitoring method, it is vital to keep in mind that all these pathways to dissipate MH to the environment may influence the Tsk data output.
Monitoring Tsk simultaneously with Tc using the GI temperature pill during field exercise has not yet been investigated. The relationship between Tsk and Tc is not well understood due to physiological, endocrine, or vasomotor influences on both temperatures (25, 56, 59). Some studies have tried to correlate both Tc and Tsk (39–42). The current study aimed to evaluate the usefulness of continuous monitoring of Tsk by means of a surface IR sensor device as a proxy for the thermoregulatory response. For this purpose, the Tsk relationship with Tc was investigated by simultaneous and continuous telemetric measurements during real-time field competitions under cool weather conditions. Endurance horses were equipped with several non-invasive telemetric monitoring devices—a Tsk device positioned in a girth belt, an orally administered GI pill (Tc), a global positioning system (GPS), and an HR monitor.
Materials and Methods
Horses
Thirteen mainly Arabian (n = 10) endurance horses participated in the study: 7 geldings; 6 mares; age, 9.5 ± 2.8 years; body mass (BM), 479 ± 68 kg; body condition scores varied from 2 to 3 out of 5. Two cross-Arabians and one crossbred (quarter horse—thoroughbred) were also involved (Table 1). Coat color included bay (n = 3), chestnut (n = 6), and gray (n = 4), and the color was scored as follows: dark (bay and chestnut, n = 9) compared to light (gray) (Table 1). Relevant rider and horse performance history and the Bureau of Meteorology (B.O.M.) (60) station output information were recorded (Table 1; Supplementary Material S1). All the horses were deemed to be fit and healthy based on the veterinary inspection conducted before the competition and following each 40-km loop according to AERA riding rules (50). The horses were sourced on a voluntary basis through the South Australian Endurance Riders Association (S.A.E.R.A.), and all the owners signed a written consent form. The study was approved by the University of Adelaide Animal Ethics Committee (project No. S-2011-224).
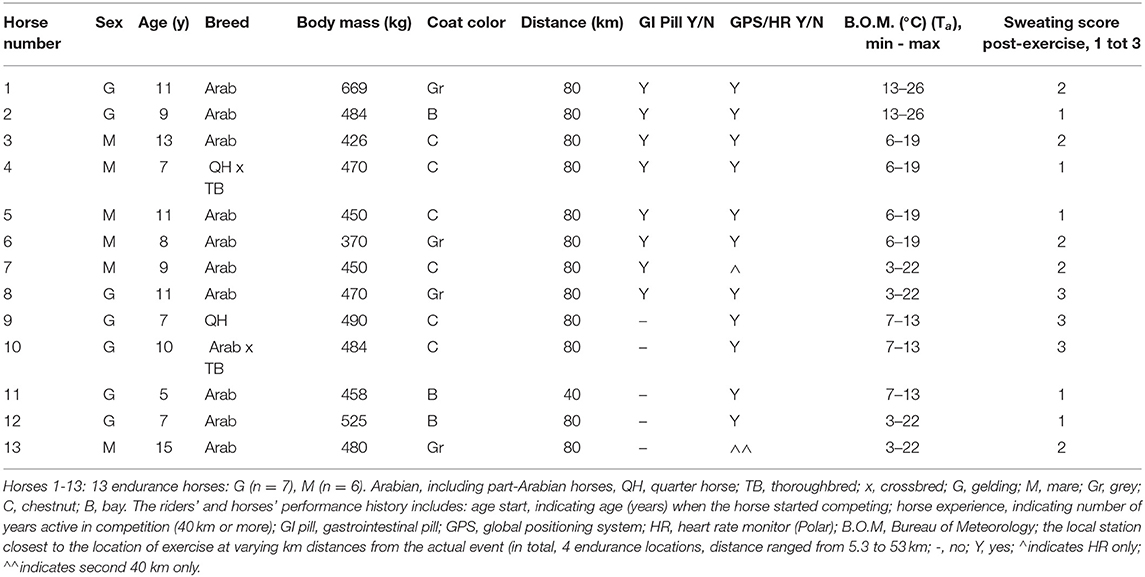
Table 1. Study population characteristics and monitoring devices.
Study Design
The horses competed over distances of 40 km (n = 1), 80 km (n = 10) or 100 km (n = 2), with each 40-km loop followed by a 60-min recovery period. The endurance horses exercised at four different locations with altitudes ranging from 4 to 462 meters above sea level. Following each 40-km exercise loop, the sweating response was graded, scoring from 1 to 3 (1: mild wet and white foam areas around head, neck, saddle, and inside hindlimbs, 2: moderate dripping sweat from the body, 3: extensive dripping sweat from the body; Table 1). In addition, the horses were immediately cooled down for average an duration of 10 min by pouring buckets of tap water (estimated average, 20°C) over their bodies and subsequently scraping it off. Following each loop, a recovery period of 60 min was allowed during which inspection of the horses for “fitness to continue” was performed, including checking for the presence of an HR below 60 beats per minute (bpm) by independent endurance veterinarians under the regulations of the Australian Endurance Riding Association (50). Horses were allowed to drink water and eat hay ad libitum during the 60-min rest period in a shaded area.
Simultaneous Continuous Monitoring of Skin Temperature (TSK) (°C) and Core GI Temperature (TC) (°C)
The Tsk (°C) was continuously recorded using an infrared (IR) sensor measuring 78 × 53 mm located in the Sensor Electronics Module (Figure 1B) (SEM, EQ02 Equivital data Logger®, Hidalgo, UK), with a 0–60°C temperature range, an emissivity of 1 and ± 0.3°C accuracy according to the manufacturer's specifications. The SEM device was located ventrally in a pocket of a modified Equivital Sensor Belt® fitted around the saddle girth (Figure 1C). The GI temperature (Tc) (°C) was continuously telemetrically recorded using the ingestible GI pill (n = 8) (Figure 1A) as previously described (Tc data are to be found in the Supplementary Material S1). The Tsk and Tc data were recorded every 15 s and uploaded and processed in the Equivital Software Manager®.
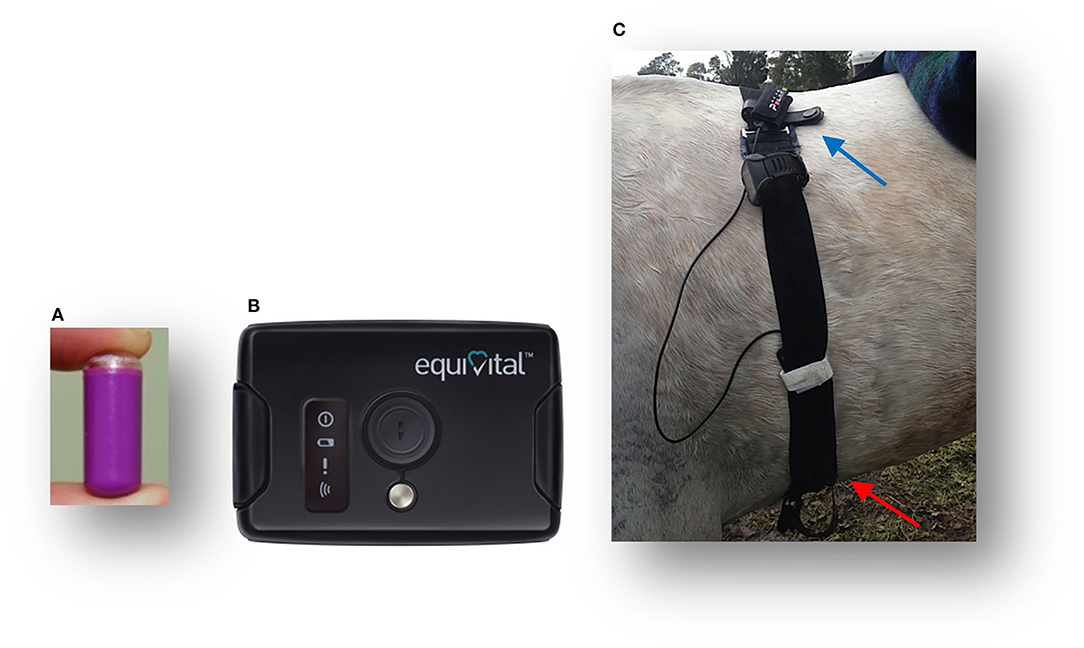
Figure 1. Tsk and Tc monitoring equipment: Jonah gastrointestinal temperature pill (A); an external receiver Equivital® Sensor Electronics Module (SEM) with an infrared sensor to measure Tsk (B); a modified belt for use on horses with the GPS Garmin®Watch and Polar® electrodes (identified by the blue pointer), with the red pointer, indicating the SEM device, including the Tsk thermistor position (C).
Monitoring of Traveled Distance, Speed, and Heart Rate Over Time
For each horse, the distance traveled and speed achieved were recorded telemetrically using GPS monitoring equipment (Garmin Forerunner 910XT GPS Watch® Garmin Ltd., Schaffhausen, Switzerland) attached to the gullet of the saddle (Figure 1C). In addition, the HR was recorded by the Garmin Watch using Polar electrodes (Polar Electro®, Kempele, Finland) (Figure 1C) (61). The GPS and HR data were recorded every second and uploaded from the Garmin watch to the Garmin Connect and processed in the Garmin Training Centre.1
Ambient Environment
Horses exercised under varying degrees of solar radiation during the Australian winter months (June–August). On each data collection day, the ambient temperature (Ta, °C) and relative humidity (RH, %) were recorded continuously every 30 s in a shaded section of the rest area using a data logger device (OnsetHOBO Pro V2 logger temp/RH U23-00®, Onset Computer Corporation, Bourne, Maine, USA). In addition, Ta data were obtained from the nearest B.O.M. weather station, presented in Table 1. The estimated wet bulb globe temperature (WBGT) was derived from a WBGT chart (B.O.M).
Data Processing
Recordings of each exercise period of 40 km and each recovery period following that exercise loop were processed. The net AUC (the baseline set at rest Tsk and Tc) was calculated using the trapezoidal method of Tsk (and Tc) over time expressed as °C × minutes. The net AUC was summated to present the cumulative Tsk – time distribution (62). The net AUC Tsk provided an estimate of the dynamic thermal response to the thermal load on the skin. This thermal load on the skin during exercise and the recovery included the Tc and Ta together with solar radiation.
Statistical Analysis
All data are presented as mean ± SD (range). Comparison and correlation analyses were performed using IBM SPSS Statistics 26.0 software or GraphPad Prism version 9.3.0 for MacOS, GraphPad Software, San Diego, California USA2. Different approaches were taken to evaluate the potential of the Tsk data as a reliable proxy to assess the thermoregulatory response. The relationship between Tsk and Tc was assessed using scatterplots (8 horses each performing two subsequent 40-km loops). In addition, maximum Tsk and Tc and the time to reach maximum Tsk and Tc were compared using the paired t-test. Delta Tsk during exercise and recovery periods was compared. The association between Tsk and Tc at different points in time and the association with HR or coat color were analyzed using a general linear model ANOVA (when no significant effects of horse identity and treatment interaction were indicated and subsequently removed using backward model selection). Statistical significance was set at α < 0.05.
Results
All the horses completed their exercise trials without any adverse occurences. The Equivital belt became dislodged in Horse 1 at the end of the first 40-km loop, causing Tsk and Tc data loss. As a result, additional modifications were applied to the belt for the subsequent recordings by fitting sturdy straps sandwiched into the belt to stabilize the girth position (Figure 1C). During recovery after the first loop, Tsk was not recorded in Horses 1 and 2 due to the owners' premature removal of the belt. The sweating response varied from 1 to 3 out of a score of 3 for all the horses (Table 1). The Tc was recorded in 8 horses over 80 km (previously published, Supplementary Material S1) (2).
Environmental Field Conditions
The Ta and RH were successfully recorded between 5.00 a.m. and 3.00 p.m. on all occasions. The Ta was relatively cool with a mean minimum of 6.7 ±.4°C and mean maximum of 18.4 ± 2.9°C (B.O.M.) (Table 1). More specifically, the Ta on the four separate days of endurance exercise showed a minimum value of 13.4, 6.3, 2.8, and 6.6°C, respectively, and a maximum value of 26.3, 19.0, 22.0, and 18.8°C, respectively (HOBO data). The minimum RH ranged from 47.1% to 61.7% to a maximum of 84.8–100% value. Overall mean calculated values were 15.3°C (Ta) and 75.6% (RH), respectively, while the approximate WBGT was <20°C. In summary, all the endurance horses competed in a cool environment.
Speed and Heart Rate Data
All the horses executed their endurance competition at a mean speed of 14.0 ± 1.4 km h−1 over the first 40 km (n = 11) and 14.2 ± 2.1 km h−1 over the second 40-km (n = 11) loop, with a mean HR of 114 ± 13 bpm. An overview of recorded speeds and HR data for individual horses can be found in Supplementary Material S1.
Individual Tsk and Tc Recordings During Endurance Exercise Over Time
An overview of the simultaneously recorded individual Tsk (°C) and Tc (°C) time profiles is provided for all the horses in Figure 2. All individual Tsk parameters, their respective descriptive analysis, and specific Tsk points in time during the 40-km endurance loops are presented in Table 2.
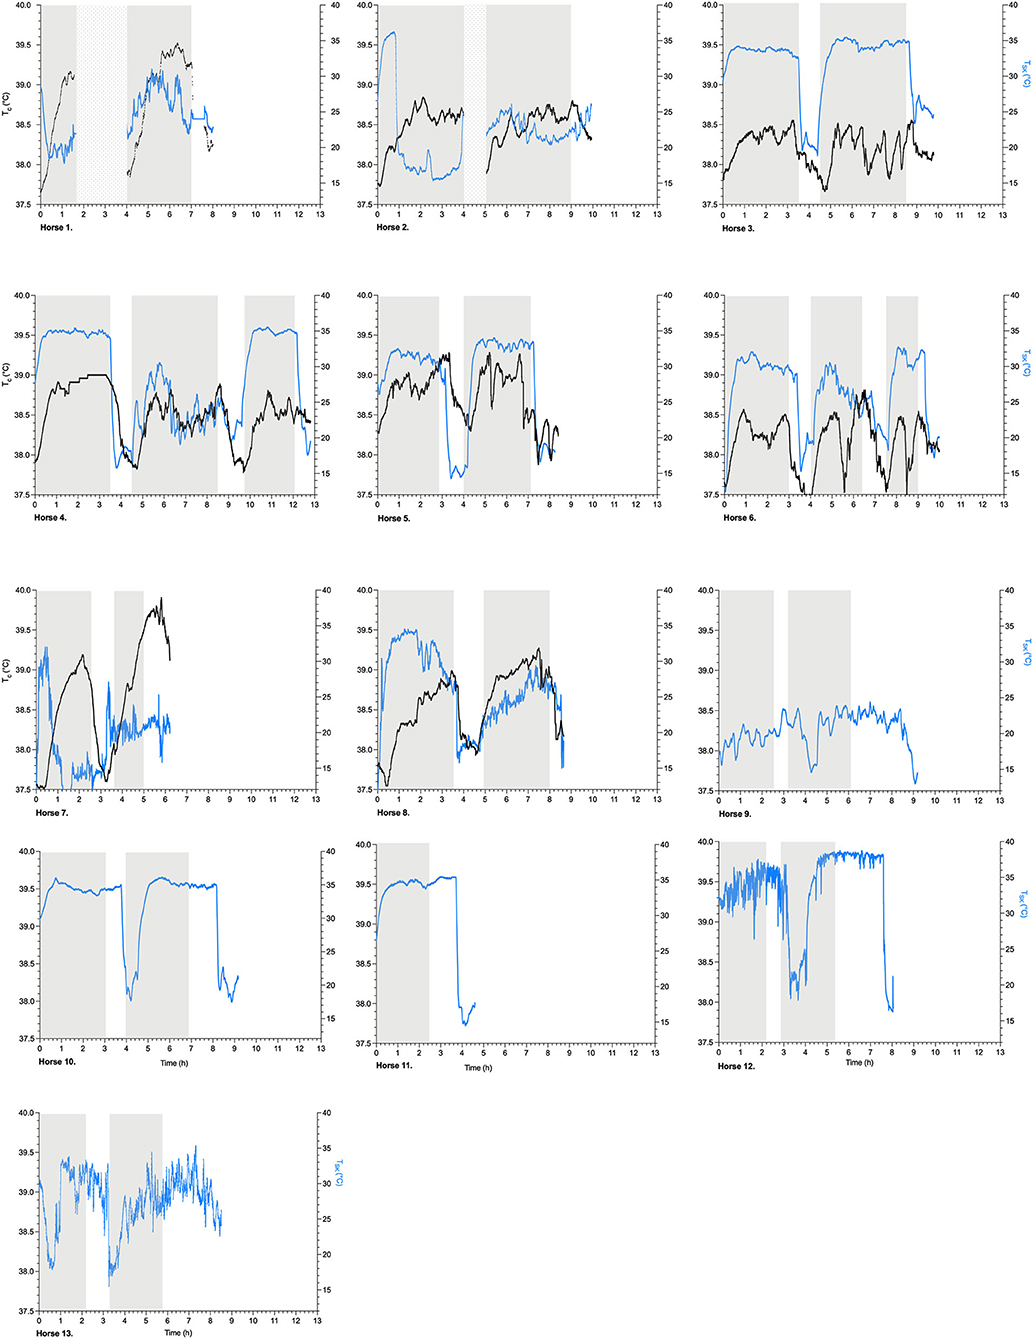
Figure 2. Scatterplots of Tsk, skin temperature (°C, identified as blue) and Tc, gastrointestinal temperature (°C, identified as black) (left y-axis) per subsequent exercise loop of 40 km (gray blocks) (h, hours, x-axis) in endurance horses, Horses 1–13; dotted blocks identify blocks of no data recording; after each exercise loop, the horses were cooled down by pouring buckets of water over their bodies, followed by scraping the water off the bodies for a period of ~10 min.
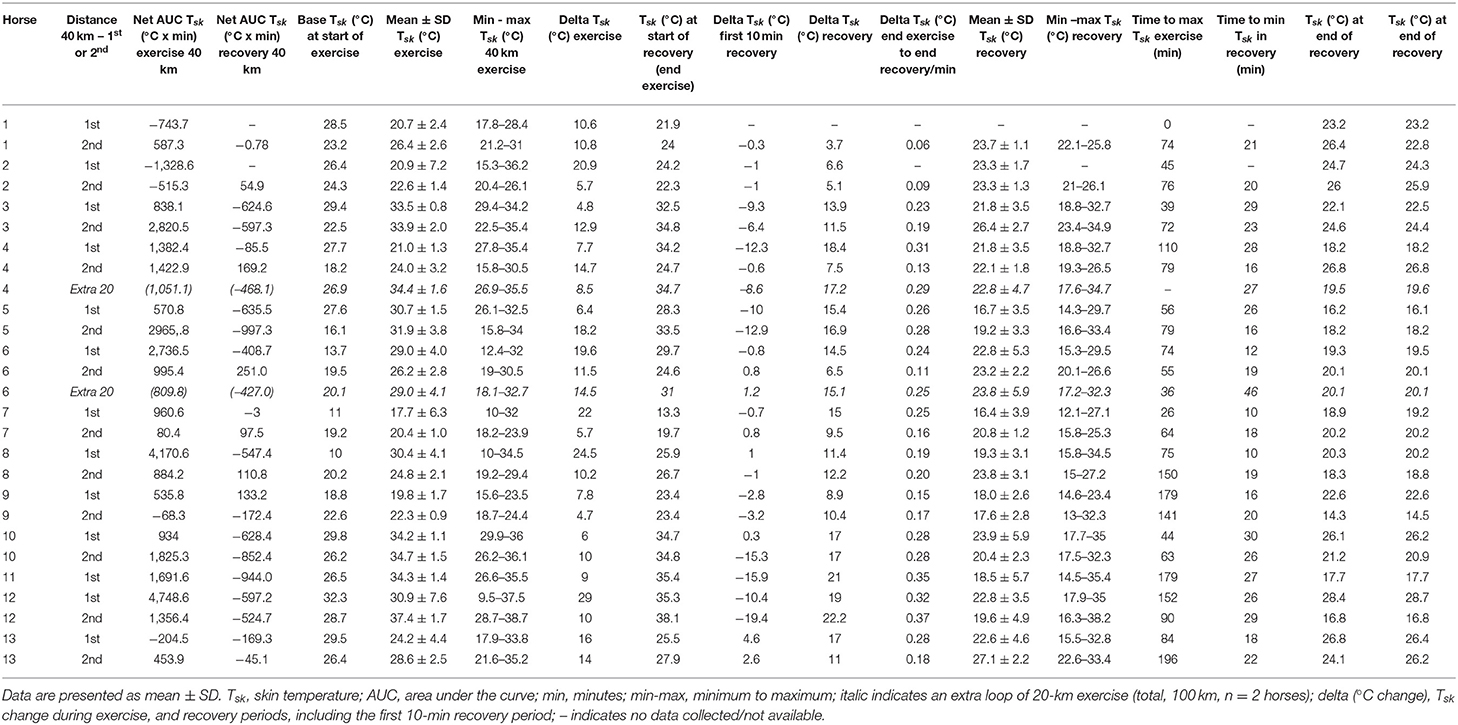
Table 2. Tsk (°C) parameters during 40-km exercise (or extra 20 km in 2 horses exercising over a total of 100 km) and recovery.
Overall Tsk Profiles and Comparison to Tc
The overall Tsk profiles during endurance exercise and recovery and their associated parameters are presented in Table 3, showing a mean time to maximum Tsk of 88 ± 51 min (n = 13). The mean maximum Tsk during exercise was 32.4 ± 4.3°C, and the mean minimum Tsk during recovery was 17.3 ± 3.1°C (n = 13). The mean overall response of Tsk was 1,164 ± 1,448°C × minutes for each 40-km exercise period. During recovery, the Tsk response was −305 ± 388°C × minutes (Table 3). The Tsk and Tc profiles over time were compared in the 8 horses, and no relationship was found (Figure 2).
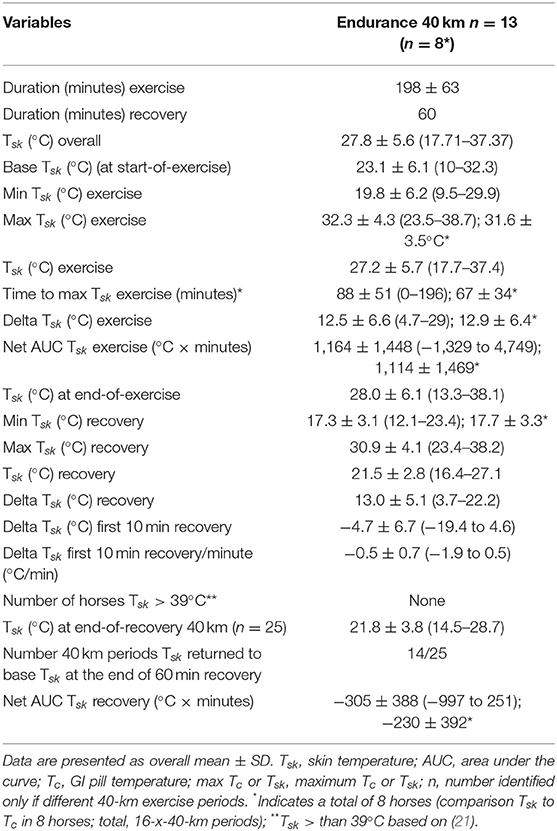
Table 3. Overall Tsk and Tc variables during exercise and recovery of endurance exercise in a cool environment.
Different Tsk and Tc points in time were compared to assess associations. Interestingly, the only significant correlation found was between the Tsk (°C) at the end-of-exercise period and the Tc (°C) at the end-of-recovery period (F1,14 = 5.519, p = 0.034). More precisely, a higher Tsk at the end-of-exercise period was associated with a lower Tc at the end-of-recovery period. The additional analyses revealed no significant correlations between Tsk (°C) and Tc (°C), including no correlation between Tsk at the start-of-exercise period (baseline Tsk) and the maximum Tc (F1,14 = 0.127, p = 0.727). The study could not identify a significant effect of time to maximum Tsk (67 min) during exercise on the maximum Tc (39°C) (F1,14 = 0.001, p = 0.978, n = 8). On all occasions, peak Tc values (39°C) were significantly greater than peak Tsk values (32°C) (p = 0.0002) (Figure 3A). In addition, in all cases, there was a significantly shorter time to maximum Tsk (88 min) compared to the time to maximum Tc (139 min) (p = 0.0004) (Figure 3B).
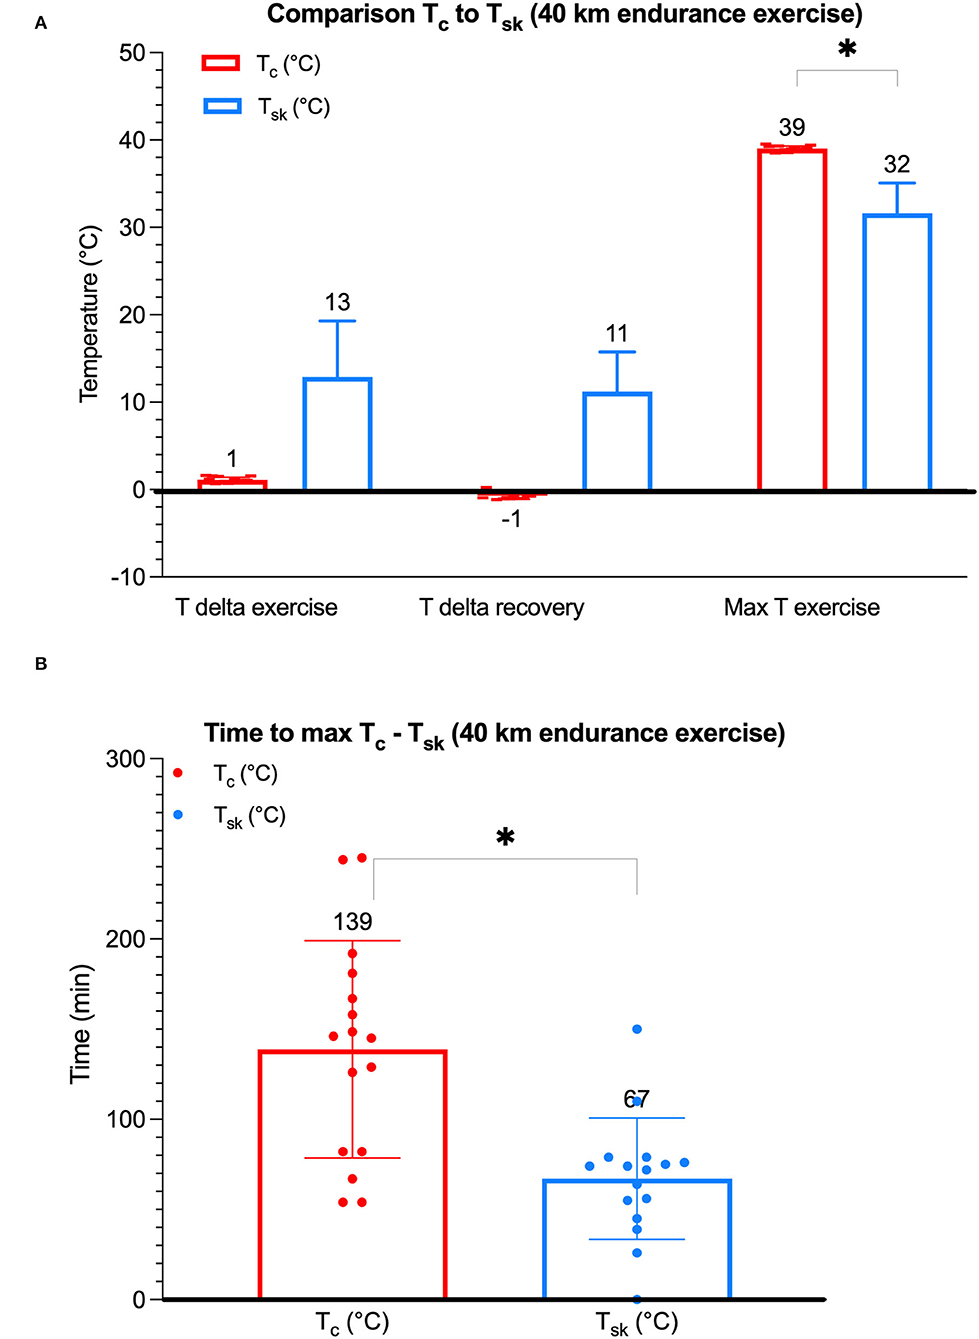
Figure 3. A boxplot diagram depicting Tc and Tsk, respectively, in endurance horses. Mean (a horizontal line) ± SD (error bars) of individual maximum Tc (°C, n = 8) and maximum Tsk (°C, n = 8) values. There was no significant association between Tsk and Tc; no significant difference between delta Tsk exercise and recovery (p = 0.41); a significantly greater maximum Tc when compared to maximum Tsk (p = 0.0002) (A); and a significantly increased time to maximum Tc than Tsk (p = 0.0004) (B); *indicates a significant difference.
Delta Tsk data were compared, and, when comparing exercise and recovery periods, no significant difference could be found between the two delta Tsk (°C) (mean 13°C and 11°C, respectively) (p = 0.41) (Figure 3A). The delta Tsk was greater when compared to delta Tc on all occasions (Figure 3A). Also, delta Tsk and Tc points in time were compared to assess associations. A correlation between the delta Tsk during cooling in the first 10 min of the recovery period and the Tc at the end of the recovery period was not identified (F1,13 = 1.348, p = 0.266).
Additionally, there were no significant effects of coat color on the maximum Tc (F1,14 = 0.010, p = 0.920) nor on the maximum Tsk (F1,22 = 0.015, p = 0.904). Furthermore, coat color was not associated either with delta Tsk during exercise (12.5 ± 6.6) (F1,22 = 1.098, p = 0.306) or delta Tsk during recovery (13.0 ± 5.1) (F1,21 = 1.246, p = 0.277).
Evaluation of Heart Rate in Relation to Tsk
Additional analysis to evaluate the relationship between the Tsk and HR < 60 bpm revealed no significant correlation between the Tsk at the end of exercise and the duration to HR < 60 bpm (F1,13 = 4.019, p = 0.066). In conclusion, the study did not identify an association between HR recovery and the recorded Tsk during endurance exercise and recovery.
Discussion
This is the first study to simultaneously monitor both Tsk and Tc continuously by means of several telemetric temperature recording devices on exercising horses in the field. The thermal sensors functioned correctly throughout the study, hence, there was little to no data loss. Consistent with our previous field study (2), the current study confirmed a substantial inter-individual variability in the Tsk time profiles despite execution of the same exercise protocol. Similar findings have been reported in human athlete studies and underline the physiological complexity of the mammalian thermoregulatory response, which is governed by a plethora of individually intrinsic variables (63–66).
With respect to Tsk and Tc monitoring in the current study, there was a lack of correlation between continuous monitoring of Tc and Tsk. Nevertheless, the association of a higher single point Tsk at the end-of-exercise period with a lower Tc at the end-of-recovery period is an interesting finding in the current study.
Up until now, a limited number of studies, almost all of which were treadmill based, monitored the Tsk continuously in the horses during the exercise and compared the Tsk to Tc (38–40, 42, 52). Only one recent field study has been performed, monitoring Tsk and Tre (20). The treadmill studies confirmed the lack of correlation between Tsk and Tc. For example, two submaximal exercise studies using arterial blood temperature compared the effect of different environments on thorax surface Tsk and showed Tsk was different from Tc (38, 42). Two high-intensity studies reported tail surface Tsk responses to cooling methods and acclimation, respectively, and both studies showed Tsk recordings were different from the Tc recordings (40, 41). Apart from those studies, only one laboratory-based high-intensity exercise study, comparing exercise in four horses in a cool vs. hot environment, suggested that the tail Tsk evolvement pattern seemed to follow the Tc pattern (using arterial blood temperature), although a statistical correlation was not investigated (39). A recent laboratory equine exercise study using the implantation of microchips, measuring muscle temperature (defined as “outer shell temperature” in that study) which may be extrapolated to field exercise in the future (67). There was a good correlation between central venous temperature (CVT) evolvement and outer shell temperature during a short bout of exercise (8–11.5 min) until CVT reached 41°C, although the outer shell temperature was reported to lag behind CVT during the recovery phase. While most of these experimental studies did not reveal a statistical correlation between Tsk and Tc, efforts to further investigate Tsk continue as the technique could easily be employed in the field. Consequently, wearable thermo-sensor techniques are being upgraded at an ever-increasing pace.
Continuous Tsk Sensor Recording During Field Exercise
Ongoing efforts to identify a reliable proxy for continuously monitoring the thermoregulatory response in horses during field exercise are not always successful or practical. A more invasive method with thermistors placed in blood and brain was used in three horses during free field exercise and reported a good correlation; however, for obvious reasons, this is not easily applicable in practice (51). Several field studies have investigated less-invasive continuously monitoring approaches, such as the intra-uterine temperature (two mares) or the GI temperature; both approaches (intra-uterine and GI) showed a good correlation with the Tc (18, 19, 68). A recent study has continuously monitored surface Tsk using i-Button® and simultaneous Tre during two canter bouts of 4.5 min of field exercise at a speed ranging from 6.7 to 7.5 meters per second (20). The Tsk was continuously monitored at the level of the rump and shoulder regions in 10 eventing horses using a cross-over study design. The study showed that pre-exercise cooling resulted in a delta Tsk ranging from −2.3 to −3.3°C and a reduced median Tre of 0.3°C, which peaked at 9 min into recovery, compared to the control group (20). Although the study did not investigate correlations between Tsk and Tc, the effect of lower Tsk pre-exercise on a reduced Tre is of interest, and consistent with previous human sports studies (69, 70).
In brief, the current reliance on continuous Tsk sensor recordings during field exercise has been proven to be inconsistent and unreliable as a proxy for the thermoregulatory response. This is consistent with a study comparing the effects of precooling in 10 human athletes to estimate the Tc (using a GI pill) (71).
Comparing Tsk With Tc
When comparing the delta Tc with delta Tsk in the current study, the delta Tsk was greater during endurance exercise as depicted in Figure 3A. However, a laboratory-based high-intensity equine exercise study using thermocouples attached to the skin with tape and located in pulmonary artery blood to continuously monitor Tsk and Tc in six horses revealed a delta Tsk of 2.5°C (42) similar to the delta Tc value in the current study (3°C). Associations between Tsk and Tc were not evaluated in that study; however, the difference in the exercise duration may indicate a difference in thermoregulatory activity over time, namely, 200 min of endurance exercise in the current study vs. average of 40 min in the former study evidenced by the end-of-exercise Tc > 41°C (42).
Another interesting finding was the significantly higher time to maximum Tc when compared to the time to maximum Tsk (Figure 3B). This finding suggests that the endurance horses in the current study performing in a cool environment were efficiently thermoregulating during exercise without the development of hyperthermia (Tc > 39°C) as has been documented previously (2). On the other hand, a short duration of high-intensity exercise in more challenging environmental conditions may trigger Tc > 41°C and, consequently, requires dissipation of excess MH to occur post-exercise (38, 42, 53).
Despite all these ongoing efforts to practically incorporate surface Tsk monitoring into thermoregulation and wellbeing monitoring in the field, researchers should always keep in mind the possible factors that challenge a potential correlation between Tsk and Tc. In addition, the monitoring device used must be able to correctly function and cope with the practical conditions under which horses exercise and compete. Important factors are environmental variables; among which are weather conditions, and whether or not additional cooling is applied. Furthermore, the type of temperature sensor equipment and the anatomical site at which the Tsk equipment is placed have their influence, together with individually intrinsic horse-related factors.
Environmental Factors
Factors Influencing Tsk and Tc Evolvement and How They Relate to Each Other
The Tsk at any site on the skin surface reflects a balance between heat being delivered to the skin by arterial blood, body, and local skin metabolism, and heat exchange with the environment by convection, radiation, and evaporation. Any factors that interfere with this balance can change the Tsk. Many factors that modulate Tc evolvement during exercise simultaneously influence Tsk, such as a plethora of performance capacity parameters, as well as environmental conditions. Environmental factors can easily and quickly change Tsk without directly affecting Tc (1, 47, 59, 72–74). These factors include the Ta, solar radiation, soil radiation, humidity, shade, and wind speed (air movement). For example, a varying Ta ranging from 20 to 30°C was directly related to the onset of skin vasodilation and sweat evaporation (72), while, on the other hand, a low Ta was shown to induce a lower sensitivity (50%) of percutaneous Tsk microchips in 52 foals and 30 adult horses to identify fever compared to measuring Tsk in a hotter Ta (29°C) (73). That would mean that, in case of fever (also known as an increased Tc set-point), a cool sunless environment renders Tsk monitoring using microchips less representative for Tc monitoring. In addition, Holcomb et al. (74) demonstrated that Tsk and Tre were highest at the peak solar radiation during the day. The Tsk sensor in the current study was located ventrally on the chest of the horse covered by the belt and the girth, thus avoiding Ta effects, such as solar radiation.
It is common practice to cool down endurance horses during the recovery period between subsequent exercise loops. Cooling down was also applied in the current study design in a real-life competition context. The goal was to challenge the temperature monitoring devices with real circumstances in which they would be required to function. With respect to cooling down approaches, the mechanism by which the thermoregulatory systems are challenged greatly depends on how the loss of heat counteracts MH production through non-evaporative pathways as well as evaporative methods. The evaporative exchange of heat of the skin with the environment depends on the thermal gradient between Tsk by local skin perfusion and its immediate environment, including vapor pressure, airflow, and solar radiation, especially during field exercise (17, 49, 75). At the end-of-exercise period, the cooling of sport horses is standard, especially in endurance and 3-day eventing competitions. However, post-race cooling methods are not standardized in the racing industry. The duration of cooling endurance horses in the field is, on average, 10 min based on each owner's judgment, which could include HR monitoring. The mean end-of-exercise Tsk in our study with endurance horses exercising in a cool environment (mean, 15.3°C) was 28°C, and no horses developed a Tsk higher than 39°C.
On the other hand, exercise studies in warmer environments documented a post-exercise Tsk higher than 39°C. For example, a recent report has revealed that 28 out of 38 horses exercising in a hot, dry environment (mean Ta, 38.8°C), and 6 out of 37 horses exercising in a warm, humid environment (mean Ta, 31.1°C) showed a post-exercise IRT Tsk higher than 39°C. These researchers suggested horses recording Tsk higher than 39°C were at risk of developing heat stress and EHI and used this Tsk response as an indicator for racehorses requiring cooling (21). The association between Tsk and EHI risk could be physiologically explained by a low Tc-to-Tsk gradient, therefore decreased capability to transfer MH to the skin, thus compromising the dissipation of MH by evaporation (21, 56).
A similar mean IRT Tsk of 40°C was recorded at the end of exercise in a recent study, evaluating cooling methods in racehorses in a warm environment (mean Ta, 31.8°C) (35). A Tsk higher than 39°C is consistent with earlier laboratory-based studies in a warm Ta (29.1°C and 31.1°C, respectively) (40, 45). In retrospect, scraping off water from the horses during cooling down was not the most optimal approach since Takahashi et al. (35) favored continuous application of cold water without subsequently scraping it off.
Tsk Equipment-Related Features and Location
Equipment to Measure Tsk
Within the rapidly expanding wearable digital device industry, surface Tsk monitoring devices are constantly being upgraded to provide data output. However, in that respect, the critical question remains: how should we interpret those data? Overall, three different types of temperature sensor equipment are reported: thermistors (such as microchips), thermocouples, and IRT devices, with IRT being the most studied device recently in horses (21, 22, 26, 32–37, 76–80). It is essential to understand that those sensors use different physical processes to obtain data, which may result in significant differences in data output. These sensor surface Tsk differences due to the type of equipment may show only a minor bias, which may prove to be clinically meaningful (75). For example, a study comparing IRT and thermocouples at single pre-exercise, intra-exercise and post-exercise points in 12 human athletes revealed a poor Bland Altman agreement and low reliability between the different methods (81).
To produce IRT imaging to picture surface Tsk of different parts or the whole body, a remote IRT camera positioned at 30-cm proximity to the skin surface has been recently evaluated with varying results (26, 37, 82). For example, a study compared IRT Tsk to Tre in 40 adult horses and concluded Tsk was not an accurate method to determine the Tc (82). The remote position of the IRT held far from the skin has the advantage of not interfering with the local Tsk balance, although the remote Tsk measurement will be partly affected by the adjacent environment surrounding the skin (22, 23, 75). The temperature sensors that were used in the current study were in direct contact with the skin and covered by a belt. This belt might have interfered with the local thermal conductivity and the local evaporative cooling capacity and thus might have delayed equilibration of the local Tsk with the surrounding skin. On the other hand, an adequate and essential sensor-to-skin contact was ensured by the position of the sensor in the belt. Furthermore, the skin surface covered by the sensor was small enough to prevent causing local skin changes (22, 75).
We were unable to calibrate and validate the IR sensor prior to the study; however, studies of different Tsk recording methods and comparisons with a certified thermocouple in a thermo-statically controlled water bath are extremely rare. One study evaluated sensor systems in human athletes during rest and exercise in a hot environment and revealed a good agreement for employing a telemetric thermistor system when compared to the standard hard-wired thermistor system and a poor agreement for using a thermal camera (83).
In summary, IRT techniques differ widely in human and equine medicine, including positioning of the camera and environmental control measures (22, 24, 75). A consensus guideline has been developed only recently, addressing the multiple data collection methods of the human Tsk using IRT (84), while Soroko and Howell (22) described a protocol using IRT in equine medicine.
Tsk Equipment Location
The anatomical location of the sensor on the horse to record Tsk measurements has been shown to influence Tsk results (22, 23, 26, 29, 37, 47). For example, remote IRT was used to evaluate differences between 10 locations on the body during two seasons in the year with the highest Tsk recorded at the level of the chest (22.5°C) and shoulders (20.4°C) in horses at rest in a cool Ta (mean, 6.7°C) (26). In another study, the IRT Tsk was greatest at the shoulder area when compared to three other Tsk locations measured at the start and the end of 20-min exercise (32.3°C and 34.2°C, respectively) in a moderate Ta (mean, 23°C) (37). The results of our study in a cool Ta (mean, 15.3°C) revealed a mean Tsk measured at the lower chest area of 23.1°C during an average of 200-min exercise and a mean Tsk of 21.8°C during recovery. The different Tsk values between the current study and Soroko et al. (37) illustrate the effect of exercise intensity (submaximal vs. maximal) and duration (long vs. short). The differences in Tsk over several body areas may relate to the varying networks of blood vessels in those body regions and their vasodilation to exchange thermal heat with the proximal environment (23, 55, 56, 59). It is essential to note that both monitoring methods share some vasomotor or endocrine mechanisms, although they present differences depending on the degree of heat dissipation or retention that the organism needs. Consequently, monitoring of Tsk in the current study revealed a physiological response of the local Tsk to the changes of Tc during endurance exercise over time, although the responses were not correlated.
While IRT cameras are increasingly used in equine sports medicine, this method involves a single point in time measurement. One exception is the study by Soroko et al. (37), who reported dynamic IRT monitoring every 15 s during treadmill exercise. To be precise, a review of the use of IRT in human endurance athletes reported that 25 of the 45 studies were conducted over the last 5 years (2017–2021), but, up until now, only five real-life field endurance studies have been performed (24). The latter review concluded that further analysis is required to assess whether Tsk could be used as a reliable proxy to describe real-time thermoregulation (24). Another important relevant finding is that surface Tsk may be low in human athletes with EHI and, hence, provide misleading information (85). A different IRT method approach is measuring eye surface temperature; that study revealed no relationship with Tc in horses (86).
Individual Horse-Related Factors
Horse-related factors include breed, body condition score, age, character (such as nervousness), and skin-related properties, such as sweat rate, skin thickness, blood vessel density, hair coat properties, clipping, and coat color (23, 27, 30, 36, 55, 77, 78, 80, 87). The sweat loss in the current study was subjectively scored from 1 to 3 by E-L.V., and, in retrospect, more accurate sweating scoring based on objective specific phenotypic descriptions would have been a better approach (88). The effect of breed on Tsk relates to the ratio of BM to the body surface area—the higher the body surface area in relation to the BM, the higher the heat dissipation (72). The low-surface-area-to-mass ratio of the horse results in greater demands being imposed on the thermoregulatory system during long-term submaximal exercise (30, 49, 53). Our study included mainly Arabian horses, known to have a lower BM and, hence, a higher-surface-area-to-mass ratio.
The hair coat length in the current study was similar (all clipped), which is essential as clipping the winter coat resulted in improved heat dissipation during and after exercise, resulting in decreased Tsk and Tre, as reported in previous studies (27, 30). One of those previous studies used a thermistor probe to evaluate the effect of coat clipping in three horses on both the surface Tsk and Tre. That study reported no effect of clipping on post-exercise Tsk, while Tre was ~0.2°C higher in unclipped horses (30). Indeed, a longer haircoat length limited the thermal imaging in a study assessing Tsk in mares (77). Furthermore, coat colors may be relevant (87); however, the current study of 13 horses revealed that light or dark coat color had no significant effect on Tsk, which is consistent with a previous study (73). Individual horse-related character differences may exist, such as nervousness that triggers sympathetic nerve activity associated with vasoconstriction of skin blood vessels. This neurophysiological response may explain varying reduced local Tsks, decreased heat loss, and hyperthermia (23, 55, 78, 89).
Modeling Using Tsk
While, generally, Tsk can be easily monitored, the Tsk in the current study did not provide data suitable for extrapolating to similar changes in the Tc. Consequently, the development of integrative models using Tsk to determine the heat balance during exercise has been investigated in human studies and in one equine study (87, 90, 91). However, no regression model could predict physiological stress load using single-point IRT Tsk in 17 human marathon runners in the field (92). A recent approach in human exercise research has investigated the application of models and algorithms using data and variables, such as HR and HR variability, to successfully estimate Tc (47, 90, 93–95). Physiologically, HR reflects the blood flow rate to the muscles (MH production) and blood flow to the skin (heat loss). For example, recent studies have concluded that combining continuous insulated Tsk and HR monitoring in 13 and 8 human athletes in a hot (35°C) and warm (25°C) environment, respectively, could provide a predictive model of Tre or Tc (using GI pills) (90, 94). In contrast in the current study, HR recovery in the endurance horses was not directly related to Tsk. Further investigation is required into the potential association of Tsk and HR for accurate predictive modeling of Tc in equine athletes.
Association Between Single-Point Tsk at the End-of-Exercise Period Compared With the Tc at the End-of-Recovery Period
An interesting finding of the current study performed with the endurance horses was the association of a greater Tsk at the end of exercise with a significantly lesser Tc at the end of recovery (60 min). Several theories could be considered to explain this association between Tsk and Tc: firstly, the raised Tsk indicates the launch of an active thermoregulatory response to anticipate the increased Tc, and, once the MH is successfully dissipated, the Tc decreases. This argument can be coupled with the effect of cooling post-exercise, which may be more prominent when Tsk is greater and, ultimately, results in higher dissipation of MH and a reduced Tc. Several other field exercise studies in horses have investigated correlations between single-point Tsk and other variables (21, 32). For example, a recent equine study involving 8 endurance horses has investigated the association between endurance training intensity (1 h at 19 km/h vs. 2 h at 16 km/h vs. 3 h at 20 km/h) and Tsk using an IRT camera measured at different locations and at different time points. The study identified that the Tsk at the coronary band increased with training intensity unlike the maximum Tsk (32).
Aside from the variance in hot vs. cool Ta in these studies the differences in exercise intensity could explain the dissimilarity between the racehorse study results of Brownlow and Mizzi (5) and the current study involving endurance horses. For racehorses undertaking high-intensity, short-duration exercise, the dissipation of MH occurs post-exercise as opposed to endurance horses, which manage their MH throughout their submaximal long-duration exercise (2, 5, 21, 56). For example, the Tsk and its evolvement pattern can be related to acute blood flow variances associated with a different type of exercise intensity (25, 95). Overall, in our study monitoring endurance horses conducting exercise during cooler months, the mean Tsk at the end of exercise was 28°C, while none of these horses had a Tsk higher than 39°C.
The end-of-recovery period Tsk showed a considerable individual variation (range, 14.5–28.7°C) despite the application of a uniform cooling protocol. The Tsk during the 60-min recovery period revealed that the Tsk returned to the baseline only in over 50% of the 40-km recovery periods. This is in contrast to other studies, which found that after 20 min of treadmill exercise in a hot (32–34°C) and dry Ta condition, all Tsk values returned to baseline Tsk after 60 min, and, after 45 min in a Ta of 20°C (without cooling), respectively (28, 42). The main difference between the current study and other laboratory-based studies was the continuous Tsk monitoring during a field exercise in an uncontrolled Ta.
Limitations
As in any study, there are several limitations that should be considered. Obviously, throughout this “in-the-field” study, not all research conditions could be controlled for 100% of the time, such as weather conditions involving Ta and the degree of solar radiation, the training, and the dietary management of participating horses. These factors may have affected the individual Tsk and Tc time profiles. However, this applies to all “in-the-field” competition studies and, under ideal conditions, should not interfere with the reliability of a solid thermoregulatory monitoring proxy suitable for assuring the thermoregulatory wellbeing of competition horses in the field (74). Endeavors to assess the thermal environmental variables were limited to BOM and HOBO recordings of the Ta and the RH, with the HOBO device placed at one location. Other essential external variables, such as wind speed, were not included in the Ta measurements (17). The current study involved only one type and location of the wearable Tsk sensor based on IR technology. In the future, other thermo-physical measuring approaches will prove to be more robust. However, on all occasions, the involvement of a validated “gold standard” against which the performance of new individual monitoring devices is set should be an essential part of future studies (75).
Conclusion
While the method of monitoring Tsk may be non-invasive and straightforward, our results have clearly shown that Tsk monitoring on its own does not reliably estimate the Tc evolvement during a field exercise in endurance horses since a correlation between Tc and Tsk could not be identified. Notably, a high Tsk at a single point during a field exercise in a cool Ta did not identify the endurance horses with an increased Tc. Further research into Tc monitoring in different equine sports and under differing weather conditions must be undertaken to create a baseline for further fine-tuning hot weather policies. Accordingly, veterinarians, trainers, and owners can be advised to continuously monitor Tc to ensure the health and welfare of all horses.
Data Availability Statement
The raw data supporting the conclusions of this article will be made available by the authors, without undue reservation.
Ethics Statement
The animal study was reviewed and approved by University of Adelaide Animal Ethics Committee. Written informed consent was obtained from the owners for the participation of their animals in this study.
Author Contributions
E-LV prepared and carried out the study design, data collection, preparation and creation of the database, descriptive and part of statistical analysis, interpretation of the data, and writing of the manuscript. CD was involved in study design, preparation and creation of the database, analysis and interpretation of the data, and writing of the manuscript. GH contributed to drafting and revising the manuscript. TM contributed to reviewing the manuscript and statistical analysis. The final manuscript was read and approved by all authors.
Funding
This study was partly financially supported by a grant from the University of Adelaide for the cost of monitoring equipment.
Conflict of Interest
The authors declare that the research was conducted in the absence of any commercial or financial relationships that could be construed as a potential conflict of interest.
Publisher's Note
All claims expressed in this article are solely those of the authors and do not necessarily represent those of their affiliated organizations, or those of the publisher, the editors and the reviewers. Any product that may be evaluated in this article, or claim that may be made by its manufacturer, is not guaranteed or endorsed by the publisher.
Acknowledgments
The authors are deeply grateful to all the participating endurance horse owners and the SAERA organization for their welcome and logistic support. The authors would like to acknowledge Honours Research Student Stacey E. Jonas for assistance with data collection.
Supplementary Material
The Supplementary Material for this article can be found online at: https://www.frontiersin.org/articles/10.3389/fvets.2022.894146/full#supplementary-material
Abbreviations
GI, Gastrointestinal; HR, heart rate; bpm, beats per minute; B.O.M., Bureau of Meteorology; GPS, Global Positioning System; A.E.R.A., Australian Endurance Riders Association; SAERA, South Australian Endurance Riders Association.
Footnotes
References
1. Raymond C, Matthews T, Horton RM. The emergence of heat and humidity too severe for human tolerance. Sci Advances. (2020) 6:eaaw1838. doi: 10.1126/sciadv.aaw1838
2. Verdegaal ELJMM, Howarth GS, Mcwhorter TJ, Boshuizen B, Franklin SH, Vidal Moreno De Vega C, et al. Continuous monitoring of the thermoregulatory response in endurance horses and trotter horses during field exercise: Baselining for future hot weather studies. Front Physiol. (2021) 12:708737. doi: 10.3389/fphys.2021.708737
3. Casa DJ, Demartini JK, Bergeron MF, Csillan D, Eichner ER, Lopez RM, et al. National athletic trainers' association position statement: exertional heat illnesses. J Athl Train. (2015) 50:986–1000. doi: 10.4085/1062-6050-50.9.07
4. Brownlow MA, Dart AJ, Jeffcott LB. Exertional heat illness: a review of the syndrome affecting racing Thoroughbreds in hot and humid climates. Aust Vet J. (2016) 94:240–7. doi: 10.1111/avj.12454
5. Brownlow M, Mizzi J. Exertional heat illness in thoroughbred racehorses – pathophysiology, case definition and treatment rationale. Equine Vet Ed. (2022) 34,5:259–71. doi: 10.1111/eve.13459
6. Geor RJ, McCutcheon LJ. Hydration effects on physiological strain of horses during exercise-heat stress. J Appl Physiol. (1998) 84:2042–51. doi: 10.1152/jappl.1998.84.6.2042
7. Barnes A, Kingston J, Beetson S, Kuiper C. Endurance veterinarians detect physiologically compromised horses in a 160 km ride. Equine Vet J Suppl. (2010) 42:6–11. doi: 10.1111/j.2042-3306.2010.00225.x
8. Nagy A, Murray JK, Dyson S. Elimination from elite endurance rides in nine countries: a preliminary study. Equine Vet J Suppl. (2010) 42:637–43. doi: 10.1111/j.2042-3306.2010.00220.x
9. Fielding CL, Meier CA, Balch OK, Kass PH. Risk factors for the elimination of endurance horses from competition. J Am Vet Med Assoc. (2011) 239:493–8. doi: 10.2460/javma.239.4.493
10. Nagy A, Murray JK, Dyson SJ. Descriptive epidemiology and risk factors for eliminations from Federation Equestre Internationale endurance rides due to lameness and metabolic reasons (2008-2011). Equine Vet J. (2014) 46:38–44. doi: 10.1111/evj.12069
11. Younes M, Robert C, Cottin F, Barrey E. Speed and cardiac recovery variables predict the probability of elimination in equine endurance events. PLoS ONE. (2015) 10:e0137013. doi: 10.1371/journal.pone.0137013
12. Fielding CL, Meier CA, Fellers GK, Magdesian KG. Ability of clinicopathologic variables and clinical examination findings to predict race elimination in endurance horses. Am J Vet Res. (2017) 78:50–6. doi: 10.2460/ajvr.78.1.50
13. Bennet ED, Parkin TDH. Federation equestre internationale endurance events: Risk factors for failure to qualify outcomes at the level of the horse, ride and rider (2010-2015). Vet J. (2018) 236:44–8. doi: 10.1016/j.tvjl.2018.04.011
14. Legg KA, Weston JF, Gee EK, Bolwell CF, Bridges JP, Rogers CW. Characteristics of endurance competitions and risk factors for elimination in new zealand during six seasons of competition (2010/11-2015/16). Animals. (2019) 9:611. doi: 10.3390/ani9090611
15. Nomura M, Shiose T, Ishikawa Y, Mizobe F, Sakai S, Kusano K. Prevalence of post-race exertional heat illness in Thoroughbred racehorses and climate conditions at racecourses in Japan. J Equine Sci. (2019) 30:17–23. doi: 10.1294/jes.30.17
16. Takahashi Y, Takahashi T. Risk factors for exertional heat illness in Thoroughbred racehorses in flat races in Japan (2005-2016). Equine Vet J. (2020) 52:364–8. doi: 10.1111/evj.13179
17. Brownlow MA, Brotherhood JR. An investigation into environmental variables influencing post-race exertional heat illness in Thoroughbred racehorses in temperate eastern Australia. Aus Vet J. (2021) 99:473–81. doi: 10.1111/avj.13108
18. Smith JE, Barnes AL, Maloney SK. A nonsurgical method allowing continuous core temperature monitoring in mares for extended periods, including during endurance exercise. Equine Vet J. (2006) 36:65–9. doi: 10.1111/j.2042-3306.2006.tb05515.x
19. Verdegaal EJMM, Delesalle C, Caraguel CGB, Folwell LE, Mcwhorter TJ, Howarth GS, et al. Evaluation of a telemetric gastrointestinal pill for continuous monitoring of gastrointestinal temperature in horses at rest and during exercise. Am J Vet Res. (2017) 78:778–84. doi: 10.2460/ajvr.78.7.778
20. Klous L, Siegers E, Van Den Broek J, Folkerts M, Gerrett N, Van Oldruitenborgh-Oosterbaan MS, et al. Effects of pre-cooling on thermophysiological responses in elite eventing horses. Animals. (2020) 10:1664. doi: 10.3390/ani10091664
21. Brownlow M, Smith T. The use of the hand-held infrared thermometer as an early detection tool for Exertional Heat Illness in Thoroughbred racehorses: a study at racetracks in eastern Australia. Equine Vet Ed. (2021) 33:296–305. doi: 10.1111/eve.13299
22. Soroko M, Howell K. Infrared thermography: Current applications in equine medicine. J Equine Vet Sci. (2018) 60:90–6. doi: 10.1016/j.jevs.2016.11.002
23. Mota-Rojas D, Pereira AMF, Wang D, Martínez-Burnes J, Ghezzi M, Hernández-Avalos I, et al. Clinical applications and factors involved in validating thermal windows used in infrared thermography in cattle and river buffalo to assess health and productivity. Animals. (2021) 11:2247. doi: 10.3390/ani11082247
24. Rojas-Valverde D, Tomás-Carús P, Timón R, Batalha N, Sánchez-Ureña B, Gutiérrez-Vargas R, et al. Short-term skin temperature responses to endurance exercise: A systematic review of methods and future challenges in the use of infrared thermography. Life. (2021) 11:1286. doi: 10.3390/life11121286
25. Mota-Rojas D, Titto CG, Orihuela A, Martínez-Burnes J, Gómez-Prado J, Torres-Bernal F, et al. Physiological and behavioral mechanisms of thermoregulation in mammals. Animals. (2021) 11:1733. doi: 10.3390/ani11061733
26. Meisfjord Jorgensen GH, Mejdell CM, Boe KE. Effects of hair coat characteristics on radiant surface temperature in horses. J Therm Biol. (2020) 87:102474. doi: 10.1016/j.jtherbio.2019.102474
27. Morgan K, Funkquist P, Nyman G. The effect of coat clipping on thermoregulation during intense exercise in trotters. Equine Vet J Suppl. (2002) 34:564–7. doi: 10.1111/j.2042-3306.2002.tb05484.x
28. Simon EL, Gaughan EM, Epp T, Spire M. Influence of exercise on thermographically determined surface temperatures of thoracic and pelvic limbs in horses. J Am Vet Med Assoc. (2006) 229:1940–4. doi: 10.2460/javma.229.12.1940
29. Jodkowska M, Oblacinska A, Tabak I, Radiukiewicz K. Differences in dietary patterns between overweight and normal-weight adolescents. Med Wieku Rozwoj. (2011) 15,3:266–73.
30. Wallsten H, Olsson K, Dahlborn K. Temperature regulation in horses during exercise and recovery in a cool environment. Acta Vet Scand. (2012) 54:42. doi: 10.1186/1751-0147-54-42
31. Yarnell K, Fleming J, Stratton TD, Brassington R. Monitoring changes in skin temperature associated with exercise in horses on a water treadmill by use of infrared thermography. J Therm Biol. (2014) 45:110–6. doi: 10.1016/j.jtherbio.2014.08.003
32. Redaelli V, Luzi F, Mazzola S, Bariffi GD, Zappaterra M, Nanni Costa L, et al. The use of infrared thermography (IRT) as stress indicator in horses trained for endurance: a pilot study. Animals. (2019) 9:84. doi: 10.3390/ani9030084
33. Soroko M, Spitalniak-Bajerska K, Zaborski D, Pozniak B, Dudek K, Janczarek I. Exercise-induced changes in skin temperature and blood parameters in horses. Arch Anim Breed. (2019) 62:205–13. doi: 10.5194/aab-62-205-2019
34. Soroko M, Zaborski D, Dudek K, Yarnell K, Gorniak W, Vardasca R. Evaluation of thermal pattern distributions in racehorse saddles using infrared thermography. PLoS ONE. (2019) 14:e0221622. doi: 10.1371/journal.pone.0221622
35. Takahashi Y, Ohmura H, Mukai K, Shiose T, Takahashi T. A comparison of five cooling methods in hot and humid environments in Thoroughbred horses. J Equine Vet Sc. (2020) 91:103130. doi: 10.1016/j.jevs.2020.103130
36. Wilk I, Wnuk-Pawlak E, Janczarek I, Kaczmarek B, Dybczynska M, Przetacznik M. Distribution of superficial body temperature in horses ridden by two riders with varied body weights. Animals. (2020) 10:340. doi: 10.3390/ani10020340
37. Soroko M, Howell K, Dudek K, Wilk I, Zastrzezyńska M, Janczarek I. A pilot study into the utility of dynamic infrared thermography for measuring body surface temperature changes during treadmill exercise in horses. J Equine Vet Sci. (2018) 62:44–6. doi: 10.1016/j.jevs.2017.12.010
38. Geor RJ, McCutcheon LJ, Ecker GL, Lindinger MI. Thermal and cardiorespiratory responses of horses to submaximal exercise under hot and humid conditions. Equine Vet J Suppl. (1995) 20:125–32. doi: 10.1111/j.2042-3306.1995.tb05018.x
39. Marlin DJ, Scott CM, Schroter RC, Mills PC, Harris RC, Harris PA, et al. Physiological responses in nonheat acclimated horses performing treadmill exercise in cool (20(C/40%RH), hot dry (30(C/40%RH) and hot humid (30 (C/80%RH) conditions. Equine Vet J Suppl. (1996) 22:70–84. doi: 10.1111/j.2042-3306.1996.tb05034.x
40. Marlin DJ, Scott CM, Roberts CA, Casas I, Holah G, Schroter RC. Post exercise changes in compartmental body temperature accompanying intermittent cold water cooling in the hyperthermic horse. Equine Vet J. (1998) 30:28–34. doi: 10.1111/j.2042-3306.1998.tb04085.x
41. Marlin DJ, Scott CM, Schroter RC, Harris RC, Harris PA, Roberts CA, et al. Physiological responses of horses to a treadmill simulated speed and endurance test in high heat and humidity before and after humid heat acclimation. Equine Vet J. (1999) 31:31–42. doi: 10.1111/j.2042-3306.1999.tb03788.x
42. Geor RJ, McCutcheon LJ, Ecker GL, Lindinger MI. Heat storage in horses during submaximal exercise before and after humid heat acclimation. J Appl Physiol. (2000) 89:2283–93. doi: 10.1152/jappl.2000.89.6.2283
43. Kohn CW, Hinchcliff KW. Physiological responses to the endurance test of a 3-day-event during hot and cool weather. Equine Vet J Suppl. (1995) 31–6. doi: 10.1111/j.2042-3306.1995.tb05005.x
44. Jeffcott LB, Kohn CW. Contributions of equine exercise physiology research to the success of the 1996 Equestrian Olympic games: a review. Equine Vet J Suppl. (1999) 30:347–55. doi: 10.1111/j.2042-3306.1999.tb05247.x
45. Kohn CW, Hinchcliff KW, Mckeever KH. Effect of ambient temperature and humidity on pulmonary artery temperature of exercising horses. Equine Vet J Suppl. (1999) 404–11. doi: 10.1111/j.2042-3306.1999.tb05256.x
46. Jeffcott L, Leung WM, Riggs C. Managing the effects of the weather on the equestrian events of the 2008 Beijing Olympic games. Vet J. (2009) 182:412–29. doi: 10.1016/j.tvjl.2009.07.037
47. Wartzek T, Muhlsteff J, Imhoff M. Temperature measurement. Biomed Tech. (2011) 56:241–57. doi: 10.1515/BMT.2011.108
48. Hodgson DR. Thermoregulation. In: The Athletic Horse, Principles and Practice of Equine Sport Medicine. 2nd ed. St. Louis: Saunders/Elsevier (2014). p. 108–124.
49. Hodgson DR, McCutcheon LJ, Byrd SK, Brown WS, Bayly WM, Brengelmann GL, et al. Dissipation of metabolic heat in the horse during exercise. J Appl Physiol. (1993) 74:1161–70. doi: 10.1152/jappl.1993.74.3.1161
50. AERA. AERA Rulebook. Australian Endurance Riding Association (2020). Available online at: http://aera.asn.au/national-rules/ (accessed December 20, 2020).
51. Mitchell G, Fuller A, Maloney SK, Rump N, Mitchell D. Guttural pouches, brain temperature and exercise in horses. Biol Letters. (2006) 2:475–7. doi: 10.1098/rsbl.2006.0469
52. Marlin DJ, Schroter RC, Scott CM, White S, Nyrop KA, Maykuth PL, et al. Sweating and skin temperature responses of normal and anhidrotic horses to intravenous adrenaline. Equine Vet J Suppl. (1999) 30:362–9. doi: 10.1111/j.2042-3306.1999.tb05249.x
53. Hodgson DR, Davis RE, Mcconaghy FF. Thermoregulation in the horse in response to exercise. Br Vet J. (1994) 150:219–35. doi: 10.1016/S0007-1935(05)80003-X
54. McCutcheon LJ, Geor RJ. Thermoregulation and exercise-associated heat stress. In: Equine Exerc. Physiol., The Science of Exercise in the Athletic Horse, Hinchcliff KW, Geor RJ, Kaneps AJ, editors. (2008). p. 382–396.
55. Bertoni A, Mota-Rojas D, Álvarez-Macias A, Mora-Medina P, Guerrero-Legarreta I, Morales-Canela A, et al. Scientific findings related to changes in vascular microcirculation using infrared thermography in the river buffalo. J An Behav Biometeorology. (2020) 8:288–97. doi: 10.31893/jabb.20038
56. Brownlow MA, Mizzi JX. Thermoregulatory capacity of the Thoroughbred racehorse and its relationship to the pathogenesis of exertional heat illness. Equine Vet Ed. (2022) 34:214–21. doi: 10.1111/eve.13433
57. Jones JH, Carlson GP. Estimation of metabolic energy cost and heat production during a 3-day-event. Equine Vet J Suppl. (1995) 27,S20:23–30. doi: 10.1111/j.2042-3306.1995.tb05004.x
58. McCutcheon LJ, Geor RJ, Hare MJ, Ecker GL, Lindinger MI. Sweating rate and sweat composition during exercise and recovery in ambient heat and humidity. Equine Vet J Suppl. (1995) 20:153–7. doi: 10.1111/j.2042-3306.1995.tb05022.x
59. Mota-Rojas D, Wang D, Titto CG, Gómez-Prado J, Carvajal-de la Fuente V, Ghezzi M, et al. Pathophysiology of fever and application of infrared thermography (IRT) in the detection of sick domestic animals: recent advances. Animals. (2021) 11:2316. doi: 10.3390/ani11082316
60. B.O.M. Bureau for Meteorology. (2020). Available online at: http://www.bom.gov.au/climate/data/ (accessed December 2, 2020).
61. Parker M, Goodwin D, Eager RA, Redhead ES, Marlin DJ. Comparison of polar® heart rate interval data with simultaneously recorded ecg signals in horses. Comp Exercise Physiol. (2009) 6:137–42. doi: 10.1017/S1755254010000024
62. Datta NR, Marder D, Datta S, Meister A, Puric E, Stutz E, et al. Quantification of thermal dose in moderate clinical hyperthermia with radiotherapy: a relook using temperature-time Area Under the Curve (AUC). Int J Hyperthermia. (2021) 38:296–307. doi: 10.1080/02656736.2021.1875060
63. Fenemor SP, Gill ND, Sims ST, Beaven CM, Driller MW. Validity of a tympanic thermometer and thermal imaging camera for measuring core and skin temperature during exercise in the heat. Measurement Phys Ed Exerc Sci. (2020) 24:49–55. doi: 10.1080/1091367X.2019.1667361
64. Foster J, Hodder SG, Lloyd AB, Havenith G. Individual responses to heat stress: Implications for hyperthermia and physical work capacity. Front Physiol. (2020) 11:541483. doi: 10.3389/fphys.2020.541483
65. De Korte JQ, Bongers CCWG, Hopman MTE, Eijsvogels TMH. Exercise performance and thermoregulatory responses of elite athletes exercising in the heat: outcomes of the thermo Tokyo study. Sports Med. (2021) 51:2423–36. doi: 10.1007/s40279-021-01530-w
66. Westwood CS, Fallowfield JL, Delves SK, Nunns M, Ogden HB, Layden JD. Individual risk factors associated with exertional heat illness: a systematic review. Exp Physiol. (2021) 106:191–9. doi: 10.1113/EP088458
67. Kang H, Zsoldos RR, Woldeyohannes SM, Gaughan JB, Sole Guitart A. The use of percutaneous thermal sensing microchips for body temperature measurements in horses prior to, during and after treadmill exercise. Animals. (2020) 10:2274. doi: 10.3390/ani10122274
68. Green AR, Gates SG, Lawrence LM. Measurement of horse core body temperature. J Therm Biol. (2005) 30:370–7. doi: 10.1016/j.jtherbio.2005.03.003
69. Bongers CCWG, Hopman MTE, Eijsvogels TMH. Cooling interventions for athletes: an overview of effectiveness, physiological mechanisms, and practical considerations. Temperature. (2017) 4:60–78. doi: 10.1080/23328940.2016.1277003
70. Racinais S, Ihsan M, Taylor L, Cardinale M, Adami PE, Alonso JM, et al. Hydration and cooling in elite athletes: Relationship with performance, body mass loss and body temperatures during the doha 2019 iaaf world athletics championships. Br J Sports Med. (2021) 55:1335–41. doi: 10.1136/bjsports-2020-103613
71. Faulkner SH, Hupperets M, Hodder SG, Havenith G. Conductive and evaporative precooling lowers mean skin temperature and improves time trial performance in the heat: conductive and evaporative precooling enhances performance. Scan J Med Sci Sports. (2015) 25:183–9. doi: 10.1111/sms.12373
72. Morgan EKM. Climatic energy demand of horses. Equine Vet J. (1995) 27:396–9. doi: 10.1111/j.2042-3306.1995.tb04960.x
73. Robinson TR, Hussey SB, Hill AE, Heckendorf CC, Stricklin JB, Traub-Dargatz JL. Comparison of temperature readings from a percutaneous thermal sensing microchip with temperature readings from a digital rectal thermometer in equids. J Am Vet Med Ass. (2008) 233:613–7. doi: 10.2460/javma.233.4.613
74. Holcomb KE, Tucker CB, Stull CL. Physiological, behavioral, and serological responses of horses to shaded or unshaded pens in a hot, sunny environment1. J An Sci. (2013) 91:5926–36. doi: 10.2527/jas.2013-6497
75. MacRae BA, Annaheim S, Spengler CM, Rossi RM. Skin temperature measurement using contact thermometry: a systematic review of setup variables and their effects on measured values. Front Physiol. (2018) 9:29–29. doi: 10.3389/fphys.2018.00029
76. Giannetto C, Arfuso F, Giudice E, Gianesella M, Fazio F, Panzera M, et al. Infrared methodologies for the assessment of skin temperature daily rhythm in two domestic mammalian species. J Therm Biol. (2020) 92:102677. doi: 10.1016/j.jtherbio.2020.102677
77. Maśko M, Witkowska-Piłaszewicz O, Jasiński T, Domino M. Thermal features, ambient temperature and hair coat lengths: Limitations of infrared imaging in pregnant primitive breed mares within a year. Repro Dom Animals. (2021) 56:1315–28. doi: 10.1111/rda.13994
78. Mota-Rojas D, Titto CG, de Mira Geraldo A, Martínez-Burnes J, Gómez J, Hernández-Ávalos I, et al. Efficacy and function of feathers, hair, and glabrous skin in the thermoregulation strategies of domestic animals. Animals. (2021) 11:3472. doi: 10.3390/ani11123472
79. Zielińska P, Soroko M, Howell K, Godlewska M, Hildebrand W, Dudek K. Comparison of the effect of high-intensity laser therapy (hilt) on skin surface temperature and vein diameter in pigmented and non-pigmented skin in healthy racehorses. Animals. (2021) 11:1965. doi: 10.3390/ani11071965
80. Domino M, Borowska M, Trojakowska A, Kozłowska N, Zdrojkowski Ł, Jasiński T, et al. The effect of rider: horse bodyweight ratio on the superficial body temperature of horse's thoracolumbar region evaluated by advanced thermal image processing. Animals. (2022) 12:195. doi: 10.3390/ani12020195
81. Fernandes ADA, Amorim PRDS, Brito CJ, De Moura AG, Moreira DG, Costa CMA, et al. Measuring skin temperature before, during and after exercise: a comparison of thermocouples and infrared thermography. Physiol Measure. (2014) 35:189–203. doi: 10.1088/0967-3334/35/2/189
82. Ramey D, Bachmann K, Lee ML. A comparative study of non-contact infrared and digital rectal thermometer measurements of body temperature in the horse. J Equine Vet Sci. (2011) 31:191–3. doi: 10.1016/j.jevs.2011.02.009
83. James CA, Richardson AJ, Watt PW, Maxwell NS. Reliability and validity of skin temperature measurement by telemetry thermistors and a thermal camera during exercise in the heat. J Therm Biol. (2014) 45:141–9. doi: 10.1016/j.jtherbio.2014.08.010
84. Moreira DG, Costello JT, Brito CJ, Adamczyk JG, Ammer K, Bach AJE, et al. Thermographic imaging in sports and exercise medicine: a delphi study and consensus statement on the measurement of human skin temperature. J Therm Biol. (2017) 69:155–62. doi: 10.1016/j.jtherbio.2017.07.006
85. Belval LN, Armstrong LE. Comparative physiology of thermoregulation. In: Sport and Physical Activity in the Heat. Casa DJ, editor (Springer IntPubl Switzerland) (2018). p. 3–14.
86. Soroko M, Howell K, Zwyrzykowska A, Dudek K, Zielińska P, Kupczyński R. Maximum eye temperature in the assessment of training in racehorses: correlations with salivary cortisol concentration, rectal temperature, and heart rate. J Equine Vet Sci. (2016) 45:39–45. doi: 10.1016/j.jevs.2016.06.005
87. Mostert HJ, Lund RJ, Guthrie AJ, Cilliers PJ. Integrative model for predicting thermal balance in exercising horses. Equine Vet J Suppl. (1996) 22:7–15. doi: 10.1111/j.2042-3306.1996.tb05026.x
88. Zeyner A, Romanowski K, Vernunft A, Harris P, Kienzle E. Scoring of sweat losses in exercised horses - a pilot study. J An Physiol An Nutr. (2014) 98:246–50. doi: 10.1111/jpn.12073
89. Hetem RS, Mitchell D, de Witt BA, Fick LG, Meyer LC, Maloney SK, et al. Cheetah do not abandon hunts because they overheat. Biol Lett. (2013) 9:20130472. doi: 10.1098/rsbl.2013.0472
90. Eggenberger P, MacRae BA, Kemp S, Burgisser M, Rossi RM, Annaheim S. Prediction of core body temperature based on skin temperature, heat flux, and heart rate under different exercise and clothing conditions in the heat in young adult males. Front Physiol. (2018) 9:1780. doi: 10.3389/fphys.2018.01780
91. Tanda G. A simplified approach to describe the mean skin temperature variations during prolonged running exercise. J Therm Biol. (2021) 99:103005. doi: 10.1016/j.jtherbio.2021.103005
92. Pérez-Guarner A, Priego-Quesada JI, Oficial-Casado F, Cibrián Ortiz De Anda RM, Carpes FP, Palmer RS. Association between physiological stress and skin temperature response after a half marathon. Physiol Measure. (2019) 40:034009. doi: 10.1088/1361-6579/ab0fdc
93. Cuddy JS, Buller M, Hailes WS, Ruby BC. Skin temperature and heart rate can be used to estimate physiological strain during exercise in the heat in a cohort of fit and unfit males. Mil Med. (2013) 178:e841–7. doi: 10.7205/MILMED-D-12-00524
94. Welles AP, Buller MJ, Looney DP, Rumpler WV, Gribok AV, Hoyt RW. Estimation of metabolic energy expenditure from core temperature using a human thermoregulatory model. J Therm Biol. (2018) 72:44–52. doi: 10.1016/j.jtherbio.2017.12.007
Keywords: skin surface temperature, thermoregulation, metabolic heat, endurance, exercise, performance, competition, hyperthermia
Citation: Verdegaal E-LJMM, Howarth GS, McWhorter TJ and Delesalle CJG (2022) Is Continuous Monitoring of Skin Surface Temperature a Reliable Proxy to Assess the Thermoregulatory Response in Endurance Horses During Field Exercise? Front. Vet. Sci. 9:894146. doi: 10.3389/fvets.2022.894146
Received: 11 March 2022; Accepted: 25 April 2022;
Published: 27 May 2022.
Edited by:
Severiano Silva, Universidade de Trás-os-Montes e Alto, PortugalReviewed by:
Mariana Almeida, University of Trás-os-Montes and Alto Douro, PortugalDaniel Mota-Rojas, Metropolitan Autonomous University, Mexico
Copyright © 2022 Verdegaal, Howarth, McWhorter and Delesalle. This is an open-access article distributed under the terms of the Creative Commons Attribution License (CC BY). The use, distribution or reproduction in other forums is permitted, provided the original author(s) and the copyright owner(s) are credited and that the original publication in this journal is cited, in accordance with accepted academic practice. No use, distribution or reproduction is permitted which does not comply with these terms.
*Correspondence: Elisabeth-Lidwien J. M. M. Verdegaal, bGlkd2llbi52ZXJkZWdhYWxAYWRlbGFpZGUuZWR1LmF1