 Ling Chen
 Xiaolin Liu
 Zhixiong Li3
- 1School of Modern Agriculture and Biotechnology, Ankang University, Ankang, China
- 2College of Animal Science and Technology, Northwest A&F University, Xianyang, China
- 3College of Life Science and Technology, Southwest University for Nationalities, Chengdu, China
Many studies have investigated the molecular crosstalk between mastitis-pathogens and cows by either miRNA or mRNA profiles. Here, we employed both miRNA and mRNA profiles to understand the mechanisms of the response of bovine mammary epithelial cells (bMECs) to lipopolysaccharide (LPS) by RNA-Seq. The total expression level of miRNAs increased while mRNAs reduced after LPS treatment. About 41 differentially expressed mRNAs and 45 differentially expressed miRNAs involved in inflammation were screened out. We found the NFκB-dependent chemokine, CXCL1, CXCL3, CXCL6, IL8, and CX3CL1 to be strongly induced. The anti-apoptosis was active because BCL2A1 and BIRC3 significantly increased with a higher expression. The effects of anti-microbe and inflammation were weakly activated because TNF, IL1, CCL20, CFB, S100A, MMP9, and NOS2A significantly increased but with a low expression, IL6 and β-defensin decreased. These activities were supervised by the NFKBIA to avoid excessive damage to bMECs. The bta-let-7a-5p, bta-miR-30a-5p, bta-miR-125b, and bta-miR-100 were essential to regulate infection process in bMECs after LPS induction. Moreover, the lactation potential of bMECs was undermined due to significantly downregulated SOSTDC1, WNT7B, MSX1, and bta-miR-2425-5p. In summary, bMECs may not be good at going head-to-head with the pathogens; they seem to be mainly charged with sending out signals for help and anti-apoptosis for maintaining lives after LPS induction.
Introduction
Mastitis is the most frequent disease afflicting dairy cows and it has well-known detrimental effects on animal wellbeing and dairy farm profitability, including decreased milk production and quality, increased discarded milk, cow mortality, and cull rate. Metagenomic studies indicate that diverse bacterial groups are found in the mammary secretions of clinically healthy quarters, whereas the microbiota of mastitic quarters, or those with a history of mastitis, are considerably less diverse (1), which is due to the ability of the majority of mastitis pathogens to survive and proliferate within the intramammary ecosystem at a relatively fast pace (2). For the host, mastitis outcomes depend not only on the virulence of the bacteria (3) but also on the strength and timely development of the defense mechanism of the host (4). Thus, genetic improvement of the host is considered to be an interesting option for diminishing the frequency of mastitis.
The immune response associated with mastitis is a very complex biological process, involving not only resident and recruited immune cells, but also mammary epithelial cells (5, 6). The mammary epithelium is not just a passive physical barrier, but a critical regulator within the establishment of the immune response toward mastitis, via major activation of the transcription factor, NFκB, and the intensity of the response of the mammary epithelial cells (MECs) depends upon the invading pathogen (7, 8). Escherichia coli and Staphylococcus aureus are well-studied major pathogens involved in mastitis and often cause different immune responses in bMECs (8). It has previously been reported that the induction of tumor necrosis factor-alpha (TNFα), interleukin 1 (IL1), and activated NF-κB in bMECs and udder stimulated with E. coli was stronger than that stimulated with S. aureus (8, 9). Lipopolysaccharide (LPS) is a glycolipid derived from the outer membrane of gram-negative bacteria (including E. coli) that is capable of eliciting a robust pro-inflammatory response in a wide variety of mammalian cells and is dose-dependent (10).
Following infection, an immune response is initiated by cell surface receptors, particularly toll-like receptors (TLRs). Multiple TLRs respond to different pathogens and trigger downstream signaling, which leads to the production of cytokines and chemokines (11). For example, TLR4 recognizes the LPS of gram-negative microbes, while TLR2, which forms a heterodimer with TLR1 or TLR6, responds to peptidoglycan (PGN) and lipoteichoic acid (LTA) of multiple gram-positive microbes. TLR4 requires the help of LPS binding protein (LBP), cluster of differentiation 14 (CD14), and myeloid differentiation protein 2 (MD2) (12) to activate downstream signaling, which can occur via an adaptor protein, myeloid differentiation factor 88 (MyD88)-dependent and -independent cascades (13) leading to (1) a rapid activation of nuclear factor, NF-κB and (2) interferon regulatory factor-3 or a more moderate, delayed NF-κB activation, respectively (14). Two adaptor proteins, MyD88 and TRIF, are the key regulators of the TLR signal transduction pathway.
Characterization of the transcriptomic response to infection in different tissues is an effective approach to understanding the response mechanism of dairy mastitis. In the past decades, a large number of mastitis-related mRNAs and miRNAs have been identified by the Transcriptome-Seq in infected bMECs (9, 15–17), udder tissues (18–20), milk whey (21), milk-derived exosomes (22), whole blood (23–25) and blood-isolated monocytes (26) in the context of S. aureus, Streptococcus uberis, Streptococcus agalactiae, and E. coli. MECs have a strong capacity to mount differing innate immune responses to gram-positive and gram-negative bacterial challenges in their own way. The initial response of these cells is probably crucial to delay invading bacteria while secreting large amounts of cytokines and chemokines for leukocyte recruitment and activation (27). However, they can also express factors contributing directly to fighting off pathogens, including the bactericidal defensins (LAP and BNBD5), some complement factors, and acute-phase proteins (5, 7).
The transcriptome is dynamic and responsive. Numerous biological and physical entities, as well as temporal and environmental factors, can alter the transcriptome signature. Capturing subtle transcriptomic changes can provide insight into molecular mechanisms underlying the biological processes. However, most of the data mentioned above, including mRNome and miRNome were acquired separately from different labs and conditions, such as different microarray platforms (28), non-standardized analysis tools, and statistical cutoffs (29); large biological variations in out-bred populations commonly used in challenge experiments, small sample size, and sampling bias in the mammary gland, make a direct comparison of transcriptome results among the results published by various labs difficult. Therefore, under identical experimental conditions, combining mRNome and miRNome analysis with bioinformatics is more appropriate to avoid these mutation conditions and generate a more complete and accurate gene network list (20).
Hence, the current investigation has examined the transcriptomic mRNAs and miRNAs profiles of MAC-T cells, an SV40-immortalized bovine mammary epithelial cell line to discover its innate immune responses, and lactation activity after LPS-challenge. The discovery and holistic analysis of an extensive systemic reaction in the mammary epithelial cells significantly expand the knowledge of host–pathogen interactions in mastitis which may be relevant for the development of novel therapies and genetic selection toward mastitis resistance.
Materials and Methods
Cell Culture and LPS Challenge
MAC-T cells were purchased from ATCC (Manassas, USA). The cells were seeded at a concentration of 1.5 × 10⁵ cells in 10 cm2 cell culture plate (Nunc, Denmark) and incubated in a growth medium at 37°C with 5% of CO2. The growth medium was RPMI 1640 (Hyclone, Logan, USA) containing 10% of fetal bovine serum (FBS; Sijiqing, Tianhang Biotechnology Co., Ltd, Hangzhou, China) and 1% of penicillin-streptomycin solution (Hyclone, USA). Adherent cells were released by 0.25% of trypsin (Hyclone, USA).
Crude LPS purified by phenol extraction from E. coli O55:B5 (L2880; Sigma, St. Louis, USA) was the induction agent, which is commonly used for the experimental modeling of the acute-phase response. Before stimulation, the growth medium was replaced by another medium containing RPMI 1640, 5% of FBS only for 24 h. Cells at 70% confluence were treated with a stimulation medium consisting of RPMI 1640, 5% FBS, and 20 μg/ml of crude LPS (O55:B5). After incubation for 0, 4, 8, and 12 h in triplicates, cell culture supernatant was removed, and cells were washed with 1 × PBS. Finally, cells were collected and suspended in 1 × PBS containing 0.5 M of EDTA for RNA extraction.
Bovine MEC RNA Isolation
Total RNA of bMECs was extracted using the Trizol reagent (Invitrogen, Carlsbad, CA, USA) following the manufacturer's procedure. The total RNA quantity and purity of bMECs were analyzed by Bioanalyzer 2100 and RNA 6000 Nano LabChip Kit (Agilent, CA, USA) with RIN number > 7.0. Each RNA sample was diluted with RNase-free ddH2O and was used either immediately or frozen at −80°C for future use. Total RNA of MECs at each time-point in triplicates was used for sequencing and QT-PCR experiments.
The mRNA Library Construction
Total RNA of MECs at each time-point in triplicates was mixed as 0 (control), 4, 8, and 12 h samples, respectively, for sequencing. Approximately, 10 μg of total RNA representing a specific LPS-challenged bMECs sample was subjected to isolate Poly (A) mRNA with poly-T oligo-attached magnetic beads (Invitrogen). Following purification, the mRNA is fragmented into small pieces using divalent cations under elevated temperatures. Then the cleaved RNA fragments were reverse-transcribed to create the final cDNA library in accordance with the protocol for the mRNA-Seq sample preparation kit (Illumina, San Diego, USA), and the average insert size of the paired-end libraries was 300 bp (±50 bp). Then, we performed the paired-end sequencing on an Illumina Hiseq2000/2500 at the LC Sciences (Houston, USA) following the vendor's recommended protocol.
Sequencing and Primary Analysis
A total of 35, 36, 91, and 85 million paired-end raw data reads were generated, respectively (Table 1). Prior to assembly, the low-quality reads were removed. After that, a total of 4.38, 4.42, 11.23, and 10.58 G bp of cleaned, paired-end reads representing 0, 4, 8, and 12 h LPS-challenged bMECs samples were produced. The clean/valid sequence data have been submitted to the NCBI short-read archive (SRA) with accession numbers, SRX6610783, SRX6610784, SRX6610785, and SRX6610786 for mRNA-Seq.
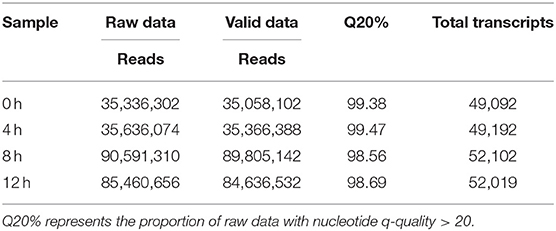
Table 1. The results of transcriptome sequencing data.
RNA-Seq Reads Mapping, Transcript Abundance Estimation, and Differential Expression Testing
We aligned reads of four bMEC samples to the UCSC (http://genome.ucsc.edu/) bovine reference genome using Tophat package. The aligned read files were processed by Cufflinks (https://github.com/santosjorge/cufflinks), which uses the normalized RNA-seq fragment counts to measure the relative abundances of the transcripts. The unit of measurement is fragment per kilobase of exon per million (FPKM) fragments mapped. Secondly, Cuffmerge was used to co-merge all transcripts of four bMEC samples to generate unique transcripts. The downloaded UCSC GTF file was passed to Cuffdiff along with the original alignment (SAM) files produced by Tophat. Cuffdiff re-estimates the abundance of the transcripts listed in the GTF file using alignments from the SAM file and concurrently tests for differential expression. Only the comparisons with a “q-value” < 0.01 and status marked as “OK” in the Cuffdiff output were regarded as showing differential expression (provided by LC Sciences, Houston, USA).
The differential genes are selected based on the following criteria: (1) if the change in gene expression levels between two samples is greater than or equal to two-fold (|log2(fold change) |≥1); (2) if p ≤ 0.05 in a Fisher's exact test based on the edgeR software; (3) if the transcripts level (FPKM) at each sample is ≥10.
Small RNA Library Construction, Sequencing, and Primary Analysis
Approximately, 1 ug of total RNA in each sample was used to prepare a small RNA library according to the protocol of TruSeq Small RNA Sample Prep Kits (Illumina, San Diego, USA). And then we performed the single-end sequencing (36 bp) on an Illumina Hiseq2500 at the LC-BIO (Hangzhou, China) following the recommended protocol.
Small RNA Data Processing
Data processing followed the procedures as provided by LC Sciences Service. Briefly, the raw reads were subjected to the Illumina pipeline filter, and then the dataset was further processed with an in-house program, ACGT101-miR (LC Sciences, Houston, USA) to remove adapter dimers, junk, low complexity, common RNA families (rRNA, tRNA, snRNA, and snoRNA), and repeats. The clean/valid sequence data have been submitted to the NCBI short read archive (SRA), and the accession numbers are SRX6610779, SRX6610780, SRX6610781, and SRX6610782 for miRNA-seq.
Subsequently, unique sequences with lengths in approximately 18–26 nucleotides were mapped to specific species precursors in miRbase 22.0 by BLAST search to identify known miRNAs and novel 3p- and 5p- derived miRNAs. Length variation at both 3′ and 5′ ends and one mismatch inside of the sequence were allowed in the alignment. The unique sequences mapping to specific species matured miRNAs in hairpin arms were identified as known miRNAs. The unique sequences mapping to the other arm of the known specific species precursor hairpin opposite to the annotated mature miRNA-containing arm were considered to be novel 5p- or 3p- derived miRNA candidates.
The remaining sequences were mapped to other precursors of selected species (with the exclusion of specific species) in miRBase 22.0 by BLAST search, and the mapped pre-miRNAs were further BLASTed against the specific species genomes to determine their genomic locations. We defined the above two as known miRNAs. The unmapped sequences were BLASTed against the specific genomes and were defined as new miRNAs (Provided by LC Sciences, Houston, Texas, USA).
Analysis of Differential Expressed miRNAs and Prediction of the Targeted Genes
The miRNA differential expression based on normalized deep-sequencing counts was analyzed by selectively using Fisher's exact test based on the edgeR software. The significance threshold was set to be 0.05 (p ≤ 0.05) in each test. The miRNAs were regarded as differentially expressed when |log2(fold change between samples)|≥1, and the miRNA counts at each sample were ≥10. To predict the targeted genes of differentially expressed miRNAs, two computational target prediction algorithms (TargetScan 7.1 and miRanda 3.3a) were used to identify the miRNA binding sites. Finally, the data predicted by both algorithms were combined and the overlaps were calculated.
Bioinformatics Analysis of Differentially Expressed mRNA/miRNA
Gene ontology (GO) annotation and Kyoto Encyclopedia of Genes and Genomes (KEGG) analysis were, respectively, performed with DAVID 6.8 (https://david.ncifcrf.gov/) and KOBAS 3.0 (http://kobas.cbi.pku.edu.cn/index.php). Then, the GO terms and KEGG pathways with adjusted p ≤ 0.05 were significantly enriched in differentially expressed mRNA (DEGs) or differentially expressed miRNAs (DEMs). The results of this study were visualized with the ggplot2 package of R software (version 4.1.1) except for the network diagram, which was depicted by Cytoscape software (version 3.7.0; https://cytoscape.org/), including the interactions between DEGs and DEMs, and the relationship of DEGs with GO/KEGG terms.
The cDNA Synthesis and Real-Time Quantitative PCR
The cDNAs for 12 bMECs samples (0, 4, 8, and 12 h in triplicates) were performed using the FastQuant RT Kit (with gDNase) (TIANGEN, Biotech Co., Ltd, Beijing, China) according to the manufacturer's instructions. Primers for mRNAs were designed on the basis of the published mRNA sequences. Primers for microRNAs were designed according to sequencing results. All primers were synthesized by Genscript Biotech Corporation (Nanjing, China) (Supplementary Table 1). Stem-loop real-time quantitative PCR (qPCR) was used to analyze miRNAs. The details of the process for cDNA synthesis were performed in two steps: (1) gDNA Eraser: the gDNA Eraser reaction mixture (10 μL of total volume contained 500 ng of total RNA, 2.0 μL of 5 × gDNA Buffer, 6.0–8.0 μL of RNase-free H2O) was mixed with the total RNA extracted from the bMEC. The mixture was incubated at 42°C for 3 min to promote the degradation of gDNA; (2) First-strand cDNA synthesis: 10 μL of total reverse transcription reaction mixture (2.0 μL of 50.0 pmol FQ-RT Primer (Oligo dT and R6 mix for mRNA, stem-loop primer for miRNA) mix, 2.0 μL of 10xFast RT Buffer, 1.0 μL of RT Enzyme Mix, and 5.0 μL of RNase-free ddH2O) was added to 10 μL of gDNA Eraser reaction mixture. Then, the mixture was incubated at 42°C for 15 min, 95°C for 3 min, and then immediately placed on ice. The cDNA was tested by PCR amplification with β-actin primer, then frozen at −20°C for further use.
The qPCR was performed in three independent experiments. β-actin was used as the internal control for qPCR detection of miRNAs and mRNAs. The qPCR was performed in a CFX96 Touch Real-Time PCR Instrument (BIO-RAD, USA) with the UltrSYBR Mixture kit (ComWin, Biotech Co., Ltd., Beijing, China) in a total volume of 25 μL (12.5 μL of 2 × UltraSYBR Mixture, 1.0 μL of PCR Forward Primer (10 μM), 1.0 μL of PCR Reverse Primer (10 μM), 100 ng of cDNA, and Rnase-free H2O to a final volume of 25 μL). The reaction mixtures were incubated at 95°C for 10 min, followed by 39 cycles of 95°C for 10 s, 60°C for 30 s, and 72°C for 32 s. The primers used in this assay are listed in Supplementary Table 1. At the end of each run, a dissociation melting curve of the product was determined. All melting curves showed a single peak and were consistent with the presence of a single amplicon. All amplifications were run in triplicate, and any ambiguous curves were excluded.
Data Analysis for qPCR
The relative expression levels of mRNAs and miRNAs were calculated using 2−ΔΔct(Samples−0h) = 2−[Δct(Samples)−Δct(0h)]. Gene expression levels were evaluated in three replicates. All gene expression data were expressed as mean ± SD. GraphPad Prism 6.0 software (GraphPad Software, Inc., La Jolla, CA, USA) was used for statistical analysis and the Student's t-test was used to test the significance of differences. If the corrected P-value was <0.05, the difference was deemed significant; if the corrected P-value was <0.01, then the difference was deemed extremely significant.
Results
Overview of Transcriptome Sequencing Data in LPS-Induced Bovine MEC
The proportion of raw data with nucleotide q-quality > 20 was more than 98% at four-time points. A total of 35,058,102; 35,366,388; 89,805,142, and 84,636,532 corresponding clean reads were produced from LPS-induced bMECs at 0, 4, 8, and 12 h, respectively (Table 1). The number of transcripts in 8 and 12 h group were far more than that of the 0 and 4 h group, and the expression level was more focused (Figures 1A,B). Correspondingly, 49,092; 49,192; 52,102, and 52,019 transcripts were obtained in LPS-induced bMECs at 0, 4, 8, and 12 h, respectively. For the genome distribution results, most clean reads were located in the exonic region, and only a few reads were found in the intergenic and intronic regions in the four-time points (Figure 1C).
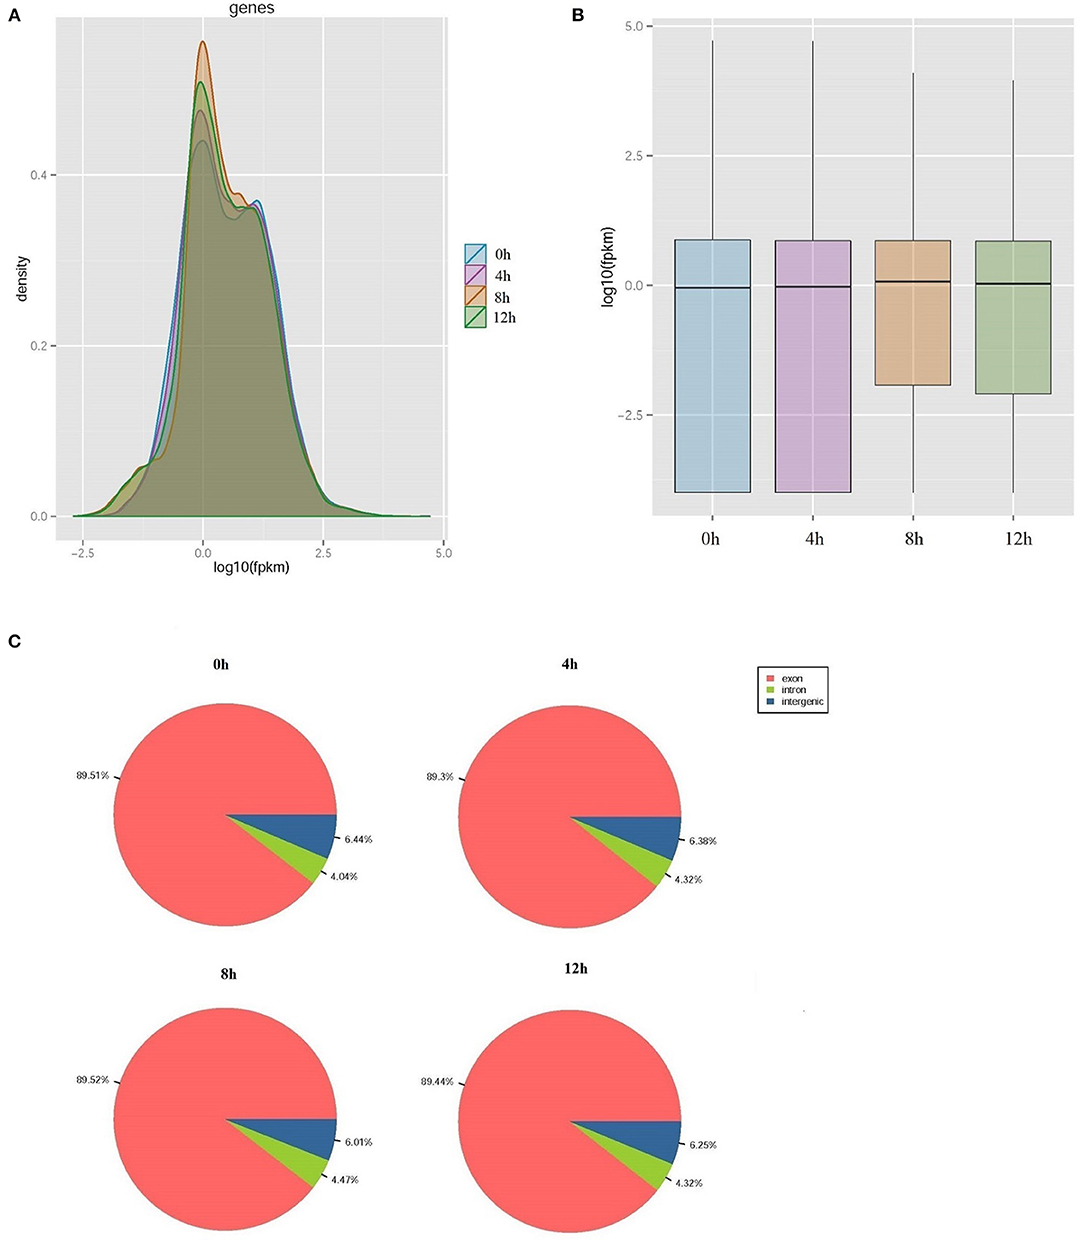
Figure 1. Overview of transcriptome sequencing data. (A) The relative expression density of transcripts; (B) The relative expression level of transcripts; (C) The genome distribution of clean reads in lipopolysaccharide (LPS)-induced bovine mammary epithelial cells at 0, 4, 8, and 12 h, respectively.
Gene Ontology and KEGG Enrichment Analysis of DEGs
About 291, 456, and 379 DEGs at 4, 8, and 12 h compared to 0 h were obtained according to the |log2(fold change) | ≥ 1, p <0.05 and FPKM ≥ 10 in LPS-induced bMECs and 200, 303, and 222 genes were downregulated, whereas 91, 153, and 157 were upregulated at 4, 8, and 12 h, respectively (Supplementary Table 2); more genes were differentially regulated at 8 and 12 h. Then functional enrichment analysis of the DEGs was performed. A total of 39, 47, and 47 GO terms belonging to biological process, cellular component, and molecular function were significantly enriched at 4, 8, and 12 h cells (p < 0.05), respectively (Figures 2A–C). It was noteworthy that the immune response (GO:0006955) and positive regulation of reactive oxygen species (ROS) and metabolic process (GO:2000379) were more significantly enriched than cell cycle (GO:0007049) and neutrophil chemotaxis (GO:0030593) at 4 h bMECs (Figure 2A). The ROS is one of the inflammatory mediators, and the release of ROS is an important part of the inflammatory response during dairy mastitis (30). Further, several key terms were enriched simultaneously in 4, 8, and 12 h cells, such as regulation of cell proliferation (GO:0042127), cellular response to interleukin-4 (GO:0071353), negative regulation of NF-κB transcription factor activity (GO:0032088), inflammatory response (GO:0006954), ubiquitin-protein ligase binding (GO:0031625), cytokine activity (GO:0005125), symporter activity (GO:0015293), and chemokine activity (GO:0008009) (Figures 2A–C).
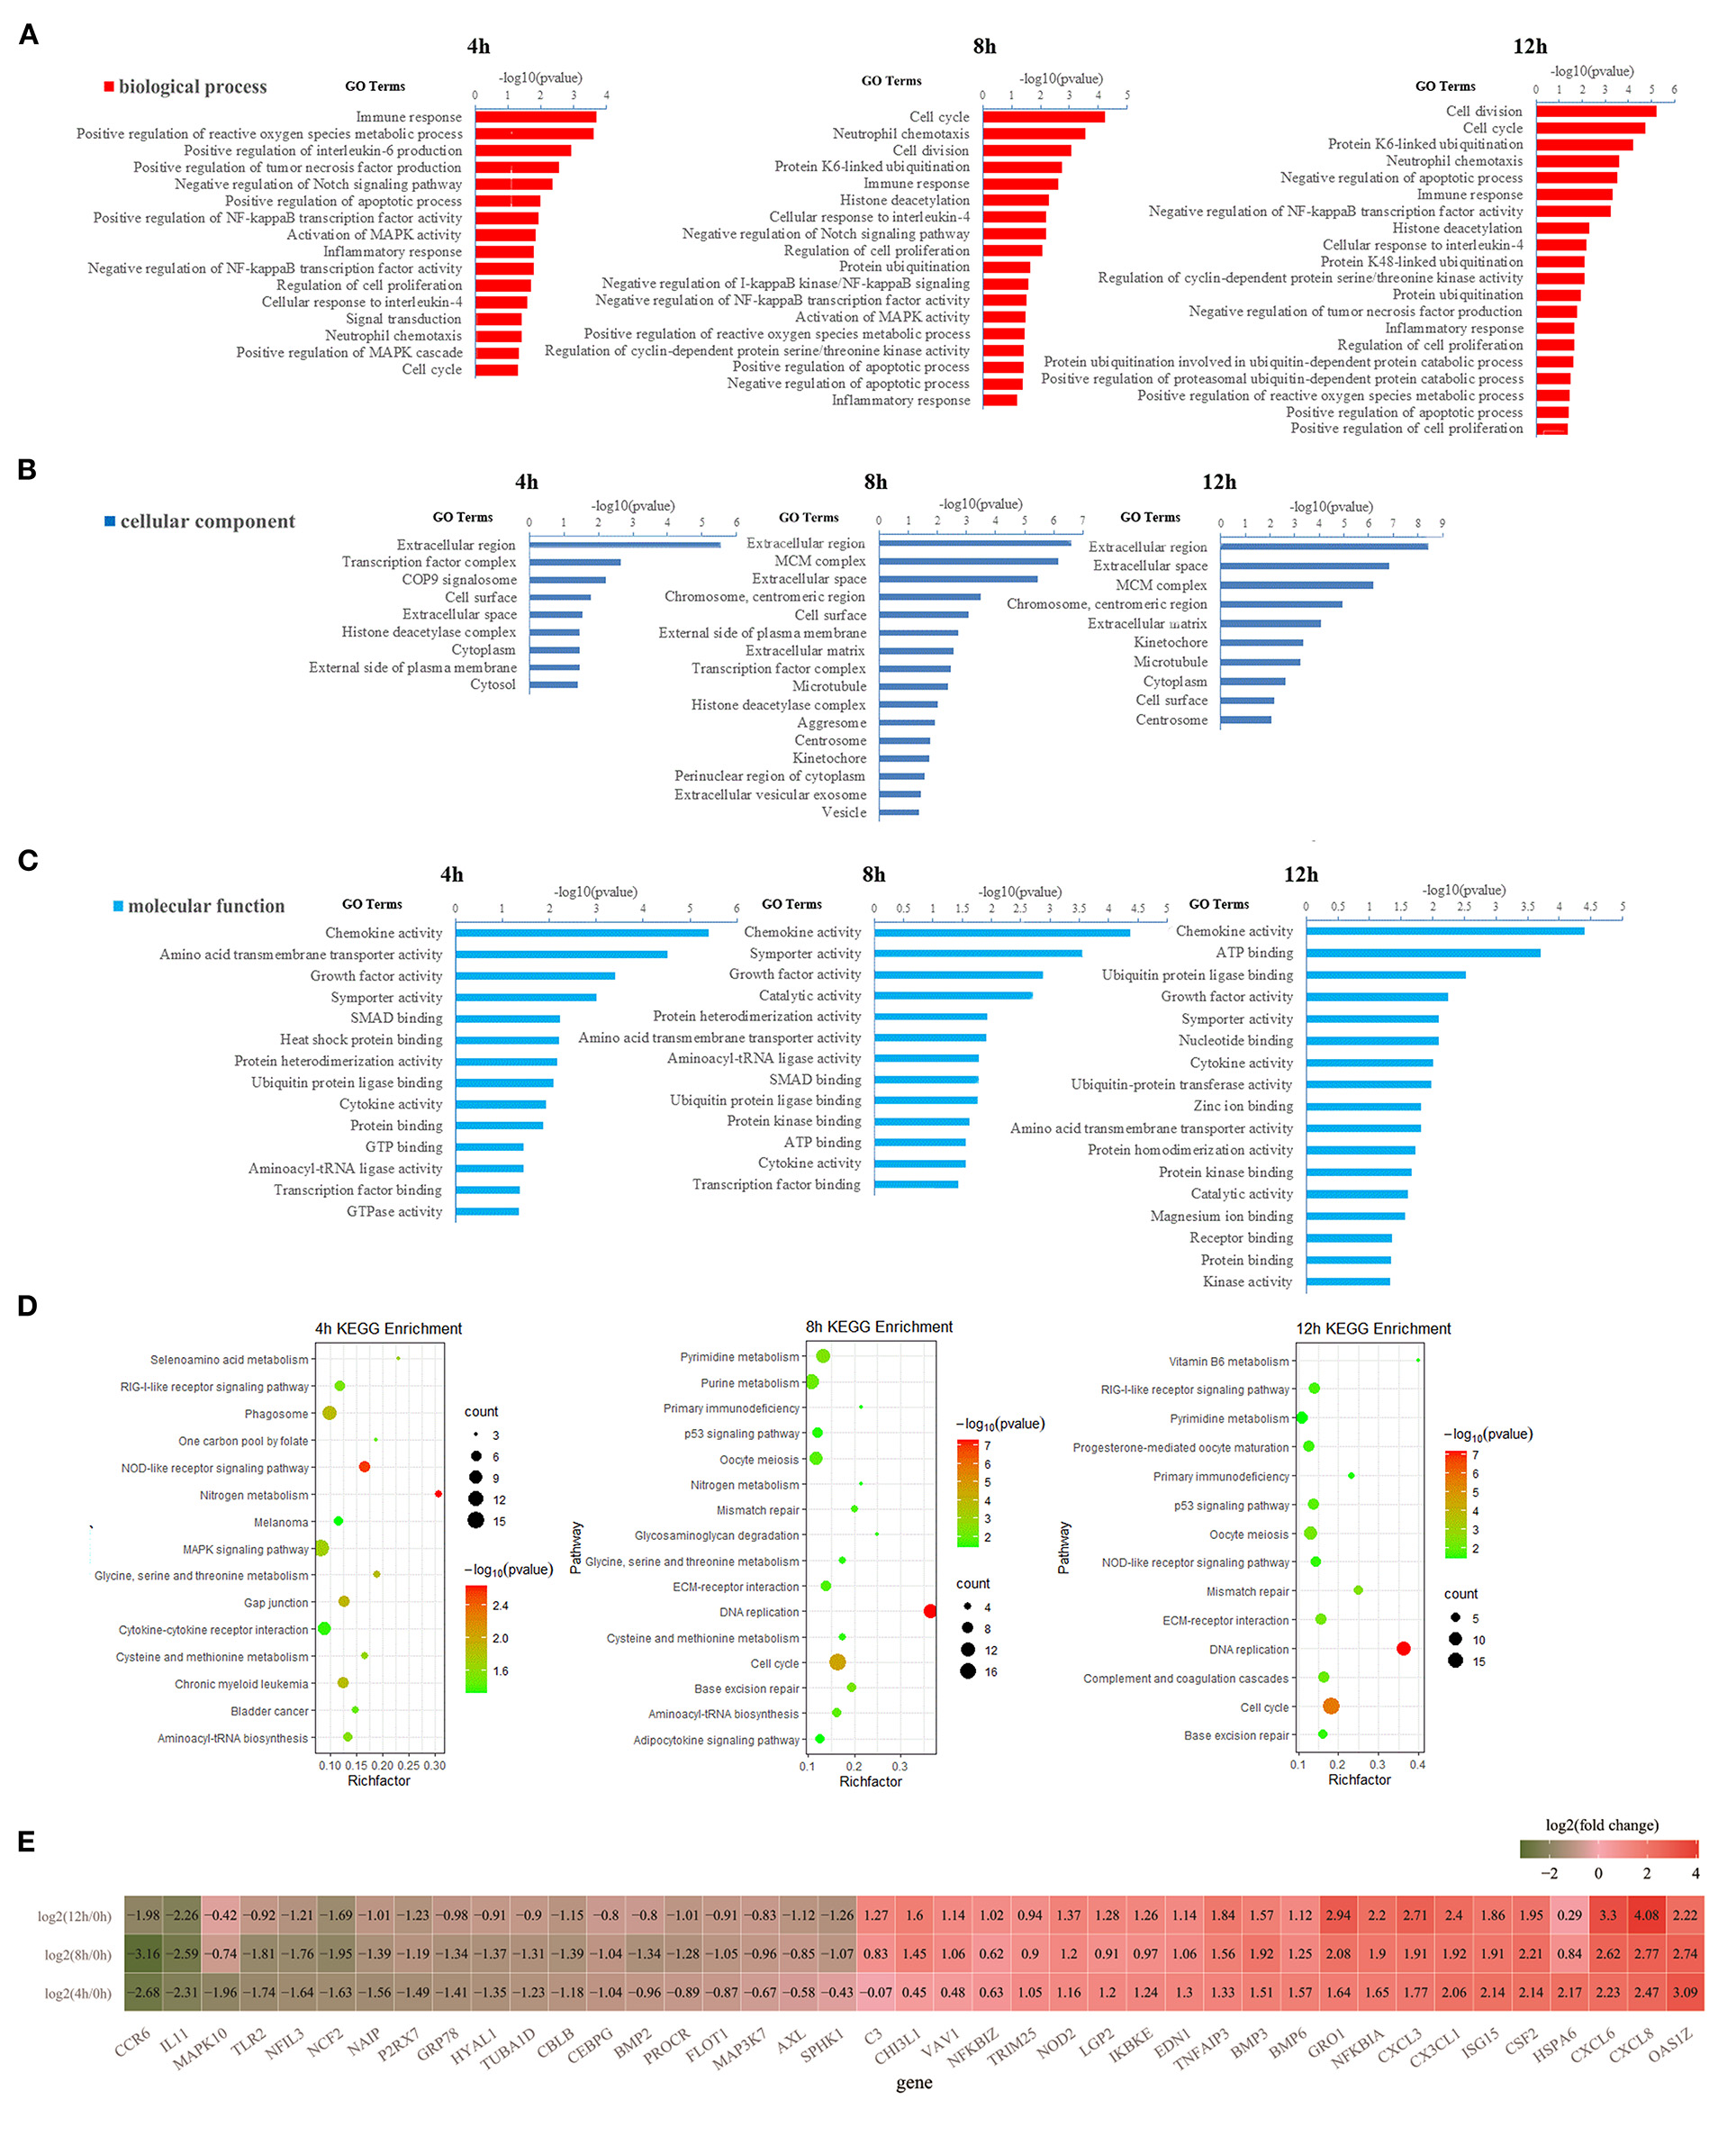
Figure 2. Gene ontology (GO) and Kyoto Encyclopedia of Genes and Genomes (KEGG) enrichment analysis of DEGs. (A) The significantly enriched GO terms in the biological process at 4, 8, and 12 h, respectively. (B) The significantly enriched GO terms in cellular components at 4, 8, and 12 h, respectively. (C) The significantly enriched GO terms in molecular function at 4, 8, and 12 h, respectively. (D) The significantly enriched KEGG pathway at 4, 8, and 12 h, respectively. (E) The heatmap of differentially expressed genes (DEGs) involved in immune response, inflammatory response, chemokine activity, cytokine activity, NOD-like receptor (NLR) signaling pathway, phagosome, RIG-I-like receptor signaling pathway, and COP9 signalosome. In (E), the dark green represents down-regulationand the red represents upregulation.
Positive regulation of NF-κB transcription factor activity (GO:0051092), positive regulation of interleukin-6 production (GO:0032755), positive regulation of MAPK cascade (GO:0043410), positive regulation of tumor necrosis factor (TNF) production (GO:0032760), and COP9 signalosome (GO:0008180) were only significantly enriched at 4 h (Figures 2A–C). The NFκB pathway significantly regulated the process of mastitis (9, 31). The TNF plays a key role in the synchronization of the immune response of the mammary parenchyma of cow against mastitis-causing bacteria (18). In contrast, negative regulation of TNF production (GO:0032720), positive regulation of proteasomal ubiquitin-dependent protein catabolic process (GO:0032436), and protein K48-linked ubiquitination (GO:0070936), were only significantly enriched at 12 h cells (Figure 2A). The process of ubiquitination has recently emerged as an important regulator of inflammasome assembly, which is the critical component of the immune system to sense and respond to danger appropriately maintaining immune homeostasis (32).
Meanwhile, KEGG enrichment results of the DEGS indicated that the NOD-like receptor (NLR) signaling pathway (ko04621) is the most significantly enriched at 4 h LPS-induced bMECs compared to 8 and 12 h, while the process of cytokine-cytokine receptor interaction (ko04060) and phagosome (ko04145) are only significantly enriched at 4 h (Figure 2D). As known, NLRs specifically sense pathogen-associated molecular patterns and respond by activating other signaling regulators, including Rip2 kinase, NF-κB, MAPK, and ASC/caspase-1, leading to the secretion of various cytokines (33), which is a response from the early stage of LPS induction. Additionally, the p53 signaling pathway (ko04115) is significantly enriched at 8 h and 12 h cells (Figure 2D). The p53 regulates a wide variety of cellular processes including apoptosis, cell cycle arrest, and acceleration of DNA repair following cellular stress. It seems that bMECs put more focus on balancing the pro-apoptosis and anti-apoptosis at the late stage of LPS-induced bMECs from 8 to 12 h.
The Differentially Expressed mRNAs Involved in Inflammation and Immunity of bMECs
The expression pattern of genes involved in immune response, inflammatory response, chemokine activity, cytokine activity, NLR signaling pathway, phagosome, RIG-I-like receptor signaling pathway, and COP9 signalosome is displayed in Figure 2E and Supplementary Figure 1. Among these genes, CCR6, IL11, MAPK10, TLR2, NFIL3, NCF2, NAIP, P2RX7, GRP78, HYAL1, TUBA1D, CBLB, CEBPG, BMP2, PROCR, FLOT1, MAP3K7, AXL, and SPHK1 are significantly downregulated [log2(fold change) ≤ −1 and p ≤ 0.05] after LPS-induction; meanwhile C3, CHI3L1, VAV1, NFKBIZ, TRIM25, NOD2, LGP2, IKBKE, EDN1, TNFAIP3, BMP3, BMP6, GRO1, NFKBIA, CXCL3, CX3CL1, ISG15, CSF2, HSPA6, CXCL6, CXCL8, and OAS1Z are significantly upregulated [log2(fold change) ≥ 1 and p ≤ 0.05] (Figure 2E).
For the upregulated genes, the mRNA level of NOD2, TNFAIP3, GRO1, NFKBIA, CXCL3, CX3CL1, CXCL6, and CXCL8 are significantly increasing in turn at 4 h, 8 h, and 12 h bMECs compared to 0 h; the expression of CXCL8, CXCL6, and GRO1 at 12 h are even significantly higher than that at 4 h and/or 8 h {log2[12 h/(4 or 8 h)] ≥ 1 and p ≤ 0.05} (Supplementary Figure 1). Although the mRNA level of OAS1Z, CSF2, ISG15, BMP6, BMP3, and EDN1 at 4, 8, and 12 h are significantly higher than that at 0 h LPS-induced bMECs [log2(fold change) ≥ 1 and p ≤ 0.05], they began to regress at 8 or 12 h compared to 4 h, such as OAS1Z and ISG15 began to regress at 8 h {−1 <log2[(12 and 8 h)/4 h] < 0}, and CSF2 and BMP3 began to regress at 12 h {−1 <log2[12 h/(8 or 4 h)] < 0} (Supplementary Figure 1). Meanwhile, C3 and NFKBIZ are only significantly higher at 12 h, HSPA6 and TRIM25 are significantly upregulated at 4 h, CHI3L1 and VAV1 are significantly upregulated at 8 and 12 h (Figure 2E; Supplementary Figure 1).
For the downregulated genes, the expression of CCR6, IL11, NFIL3, NCF2, NAIP, P2RX7, and CBLB at 4, 8, and 12 h are significantly less than that at 0 h cells [log2(fold change) ≤ −1 and p ≤ 0.05]. MAPK10 only significantly decreased at 4 h. AXL is significantly downregulated at 12 h. BMP2 and FLOT1 are significantly reduced at 8 h cells. TLR2, GRP78, HYAL1, TUBA1D, and CEBPG are significantly downregulated at 4 and 8 h cells, while SPHK1 and PROCR are just not significantly downregulated at 4 h cells (Figure 2E; Supplementary Figure 1).
The Relative Expression Level of mRNAs by qPCR
The relative expression of 12 mRNAs was analyzed by qPCR at 0, 4, 8, and 12 h LPS-induced bMECs. Overall, the qPCR results showed an identical trend with the sequencing results in 0, 4, 8, and 12 h cells, CTH, KLF4, MAP3K7, NOD1, and TLR2 decreased, while IL18RAP, ISG15, MX1, NFKBIA, TNFAIP3, and TRIM25 increased (Figure 3), but the discrepancy still exists. For example, the expression of KLF4 at 8 h was not significantly downregulated and even increased, and TLR2 did not significantly downregulate at 8 h; these discrepancies between the qPCR and sequencing results may be due to experimental errors.
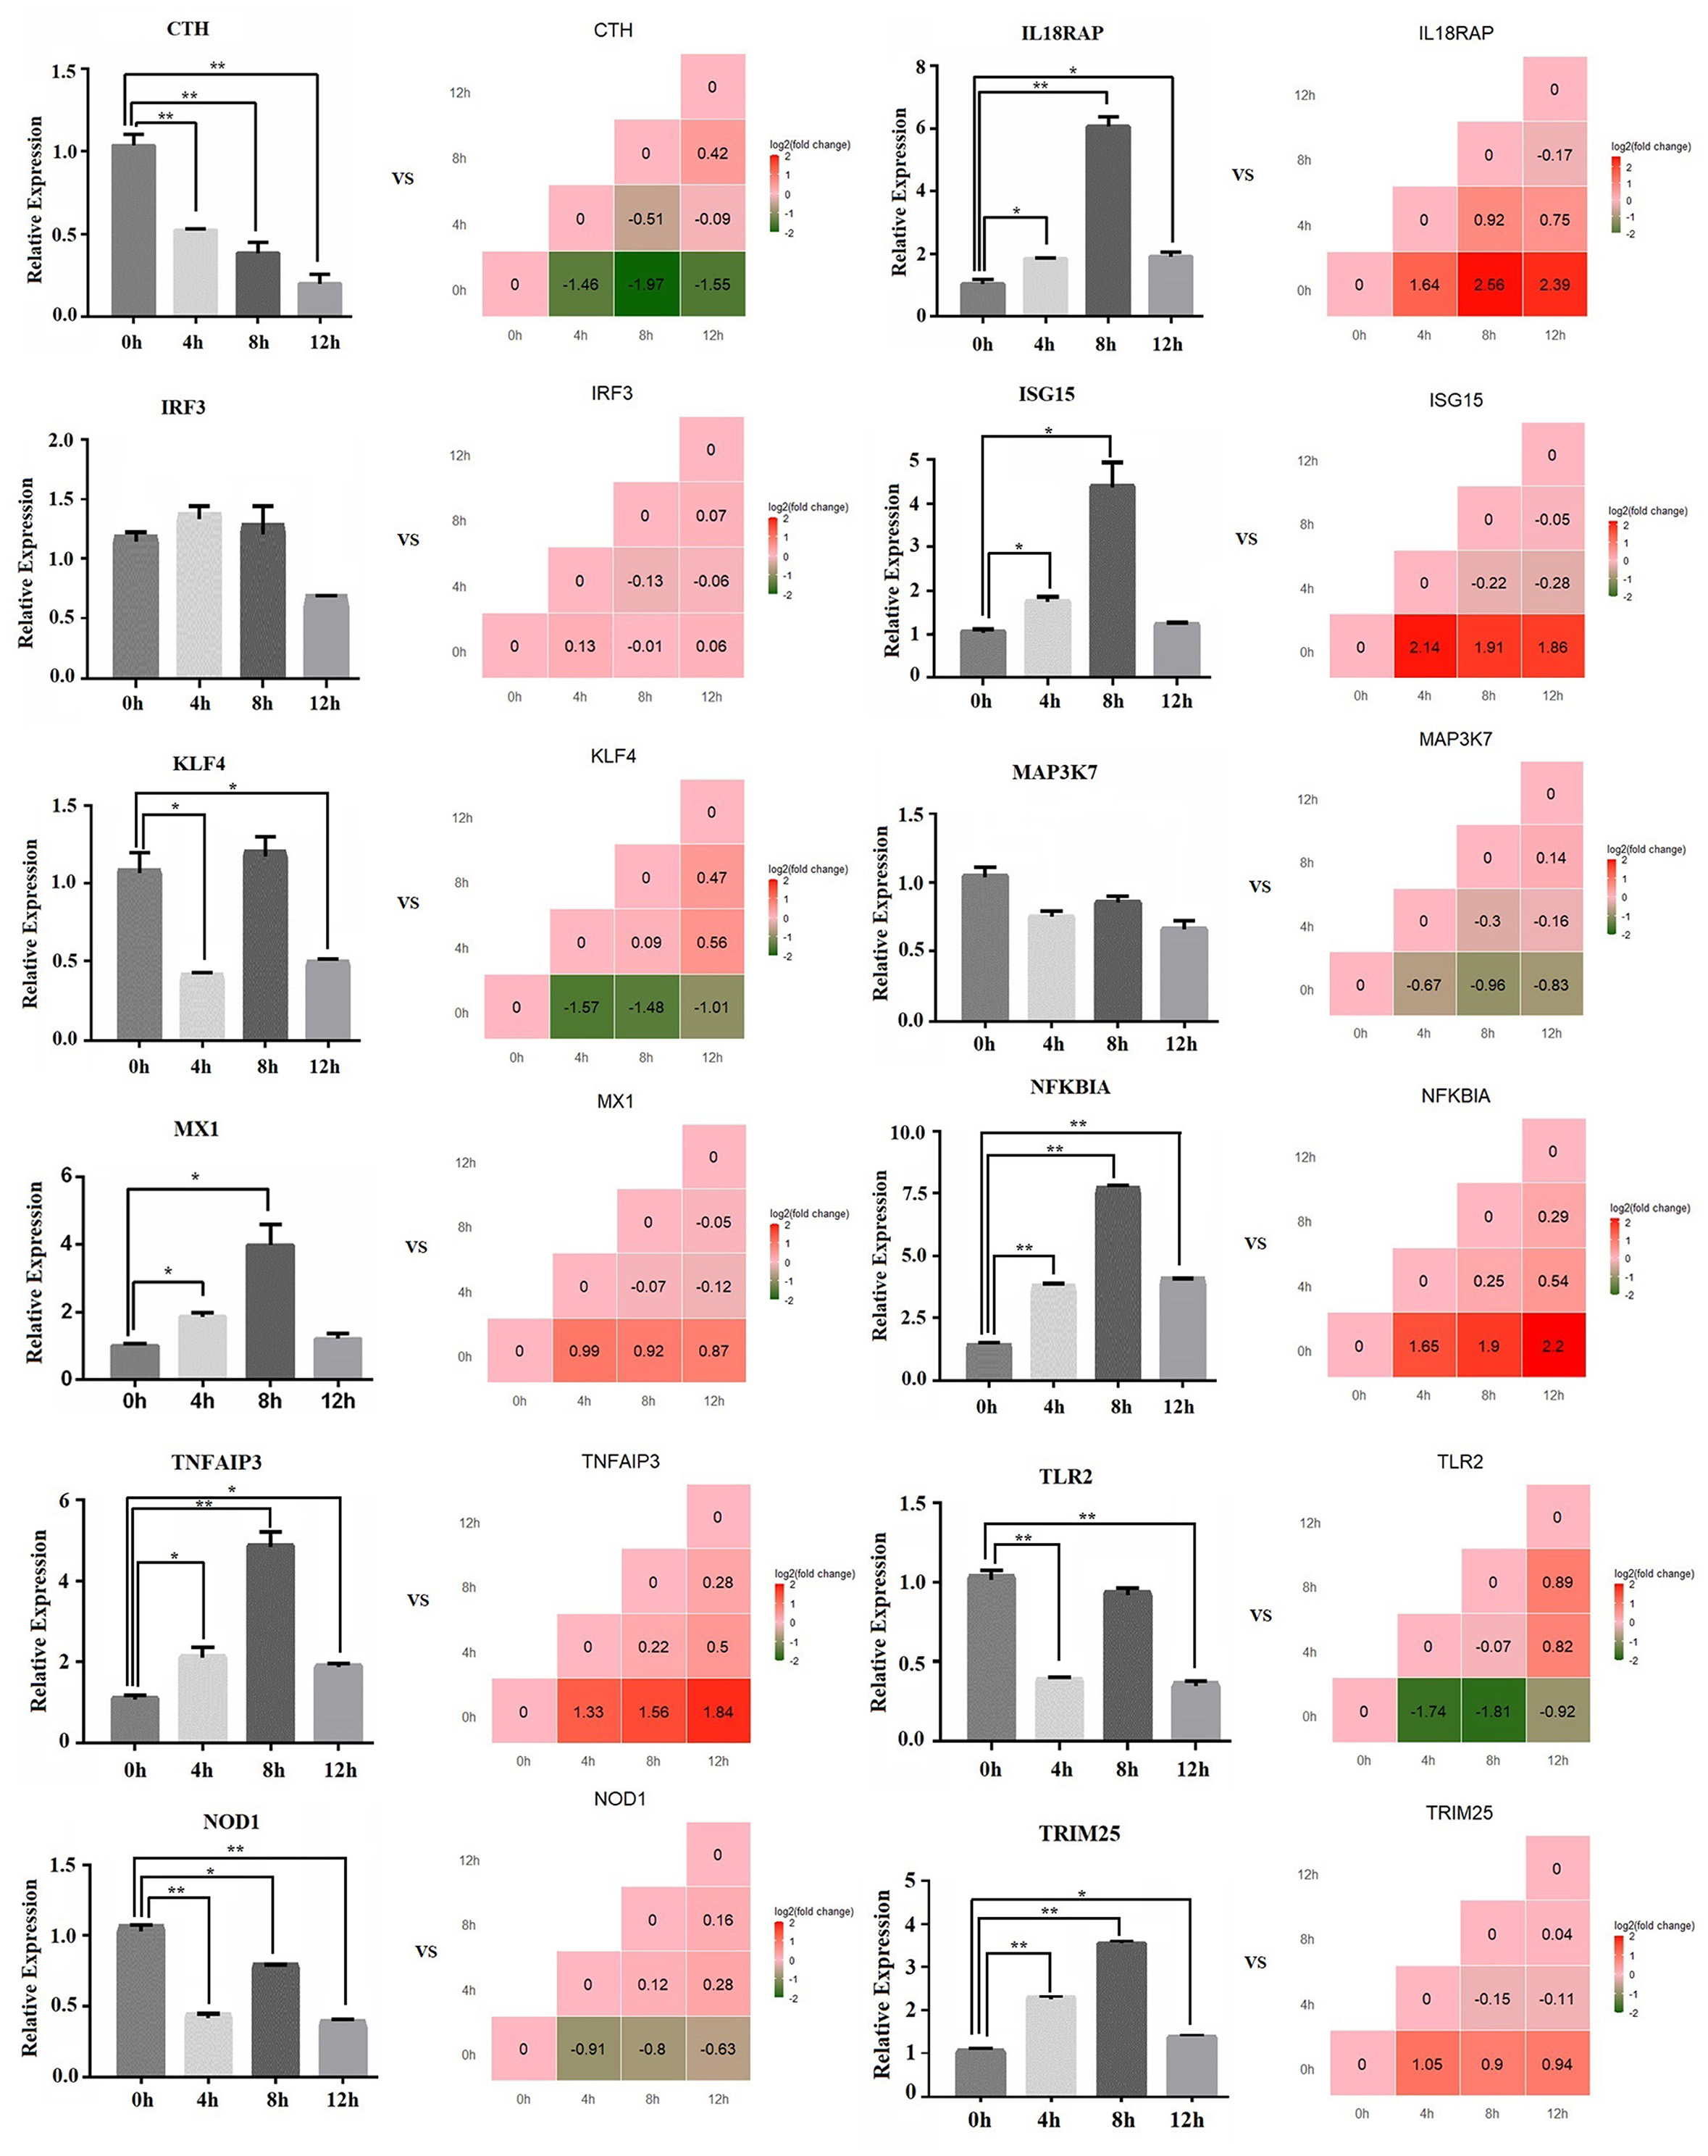
Figure 3. The relative expression level of mRNA by qPCR. The bar graph shows the qPCR result, and the stair graph shows the sequencing result; 0, 4, 8, and 12 h represent the LPS-induced 0, 4, 8, and 12 h bMECs; “*” represents P ≤ 0.05; “**” represents P ≤ 0.01.
An Overview of miRNA Profile
To further characterize the transcriptome in bMECs after LPS stimulation, a total of 12.5, 13, 12, and 11 million raw reads of miRNAs were obtained from 0, 4, 8, and 12 h LPS-induced bMECs, and the valid reads accounted for 91.99, 88.84, 87.97, and 80.63%, respectively (Table 2). About 1,215 unique miRNAs were identified including 247 known miRNAs, 460 novel miRNAs, and 508 miRNAs with differences. And the number of types for miRNA was slightly different at 0, 4, 8, and 12 h (Table 3; Supplementary Table 3). Comparing miRNAs and mRNAs, the total expression level of miRNAs increased while mRNA reduced after LPS induction (Table 4).
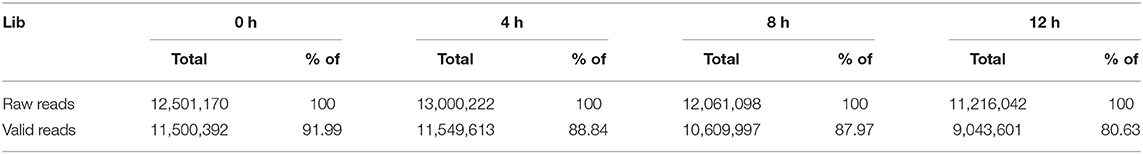
Table 2. Statistics of transcriptomic small RNA reads.
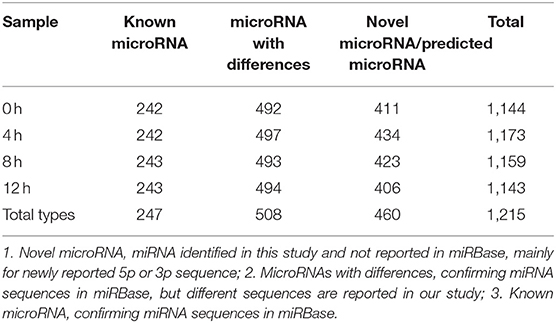
Table 3. The number of types for miRNA at 0, 4, 8, and 12 h, respectively.

Table 4. The total expression level of miRNAs and mRNAs at 0, 4, 8, and 12 h, respectively.
Additionally, 29 top-expressed miRNAs account for 81, 84, 83, and 85% in the expression of total miRNAs at 0, 4, 8, and 12 h cells, respectively (Figure 4), which are similar to the previous results in bovine MAC-T cells challenged with E. coli or S. aureus (16). The expression of bta-miR-21-5p_R-1 is more than 30% in total miRNAs and is the highest one (Figure 4), which is also in line with the result in primary bMECs (15), while bta-miR-21-5p_R-1 is not the highest expressed miRNAs at peripheral blood in Chinese Holstein cows (23, 24), bovine milk-derived exosomes (22), bovine milk (21), and bovine mammary glands (19). This indicated that bta-miR-21-5p_R-1 was the unique and essential miRNA to maintain the function of bMECs.
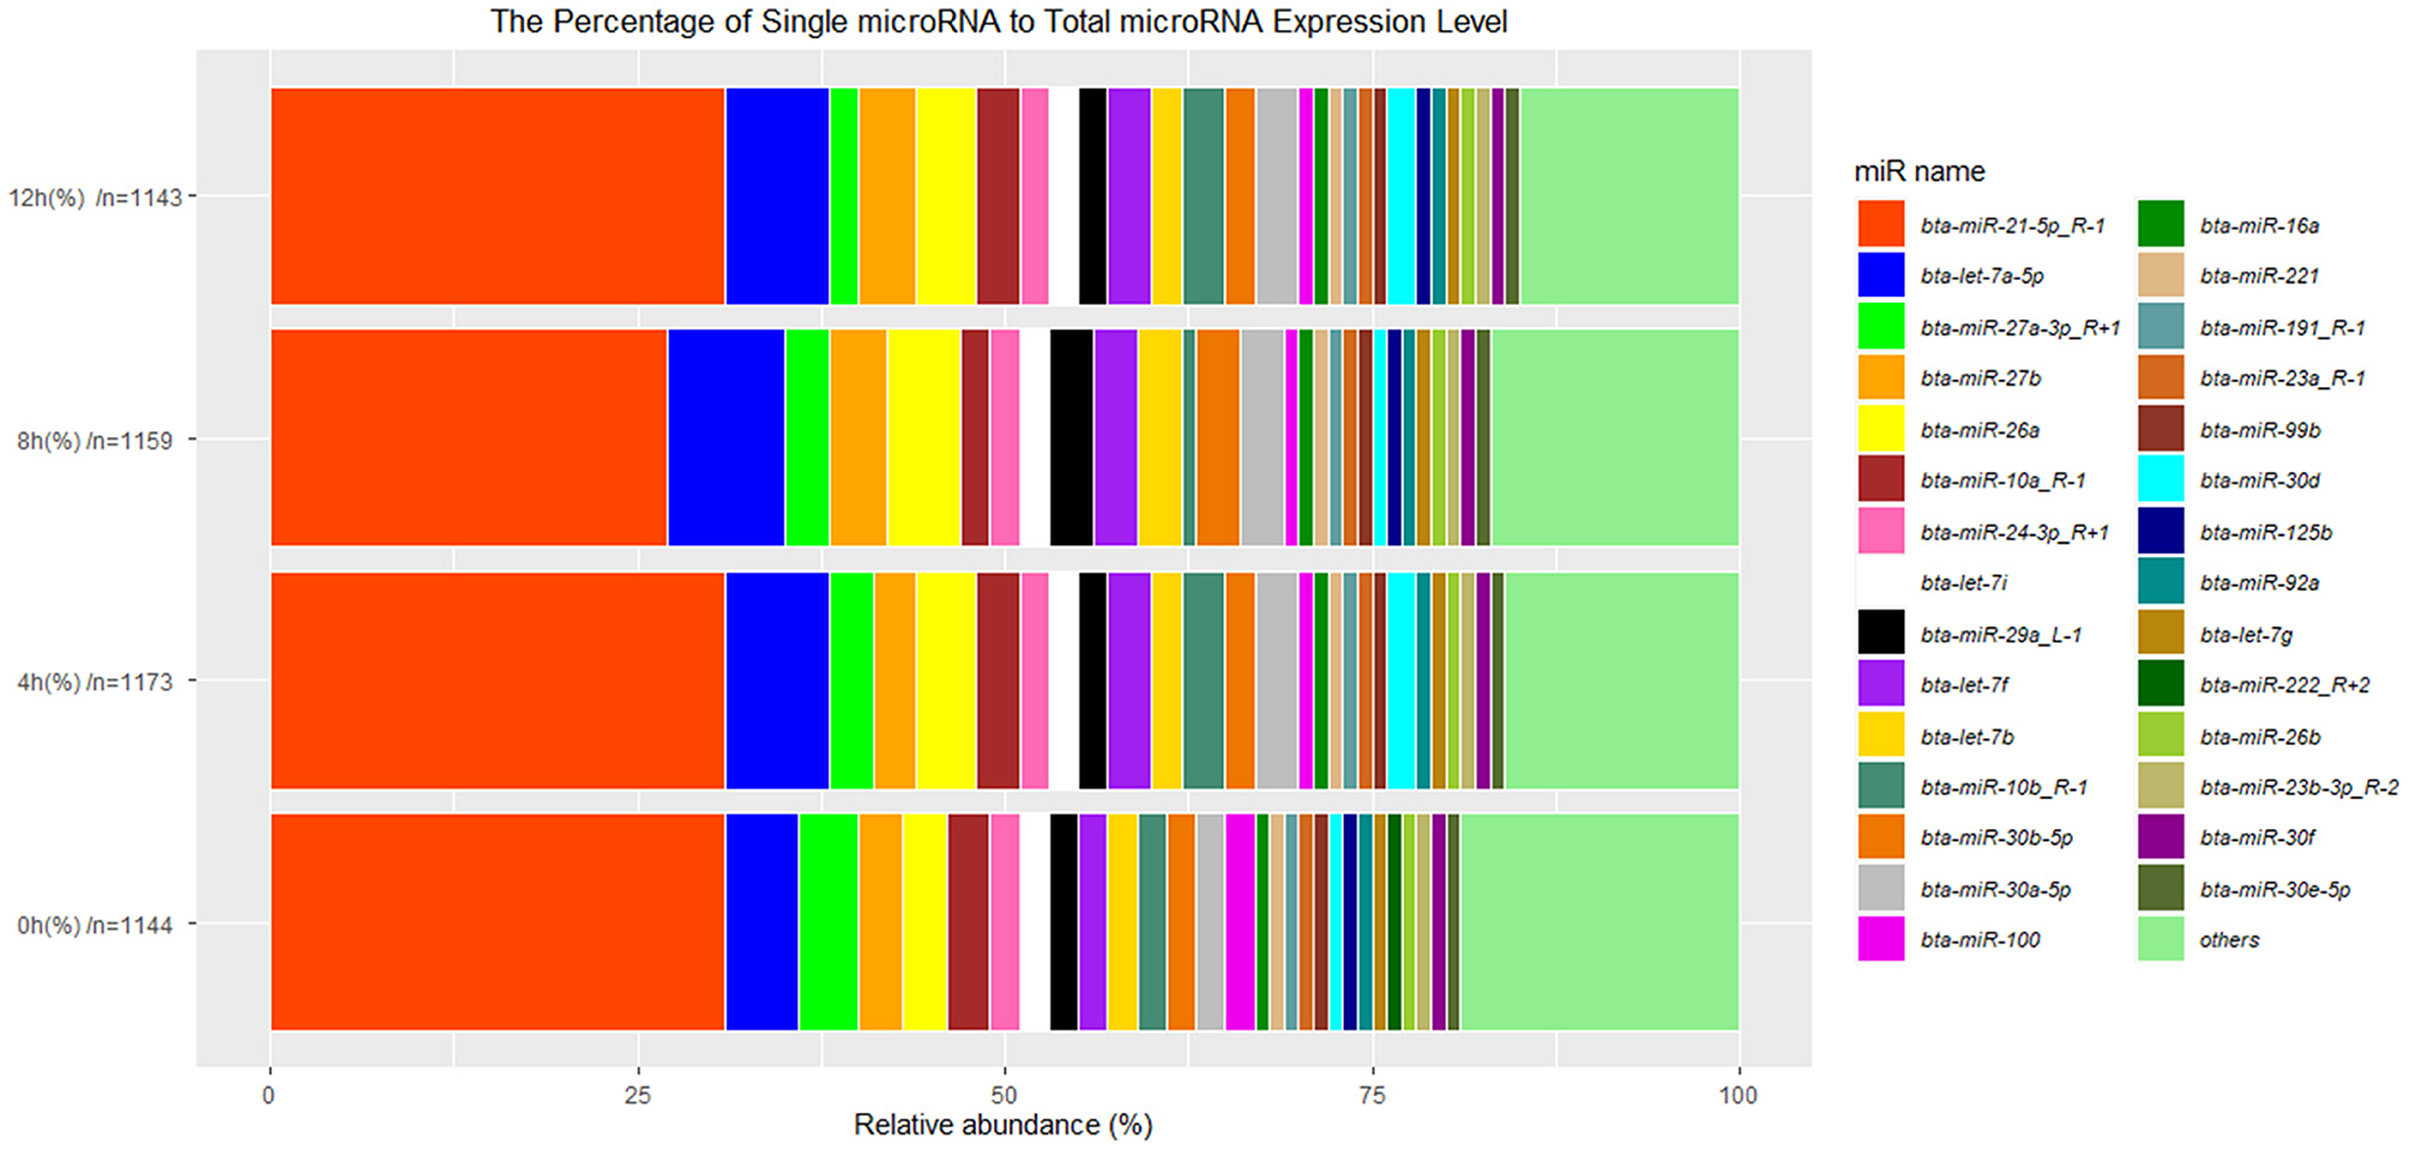
Figure 4. The 29 top-expressed miRNAs at 0, 4, 8, and 12 h LPS-induced bMECs. “n” represents the number of identified miRNAs at 0, 4, 8, and 12 h LPS induced bMECs.
Differentially Expressed miRNAs and Inflammation/Immunity-Related Differentially Expressed miRNAs
About 119, 112, and 128 significantly DEMs at 4, 8, and 12 h LPS-induced bMECs compared to 0 h were obtained (Supplementary Table 4), and genes potentially targeted by DEMs were predicted. Together with the DEMS (Supplementary Table 2), 65 upregulated miRNAs along with 71 downregulated targeted mRNAs and 29 down-regulated miRNAs along with 39 upregulated targeted mRNAs at 4 h (Figure 5A), 39 upregulated miRNAs along with 106 downregulated targeted mRNAs, and 57 down-miRNAs along with 61 upregulated targeted mRNAs at 8 h (Figure 5B), 63 upregulated miRNAs along with 92 downregulated targeted mRNAs and 48 downregulated miRNAs along with 54 upregulated targeted mRNAs at 12 h (Figure 5C) were screened out in LPS-induced bMECs.
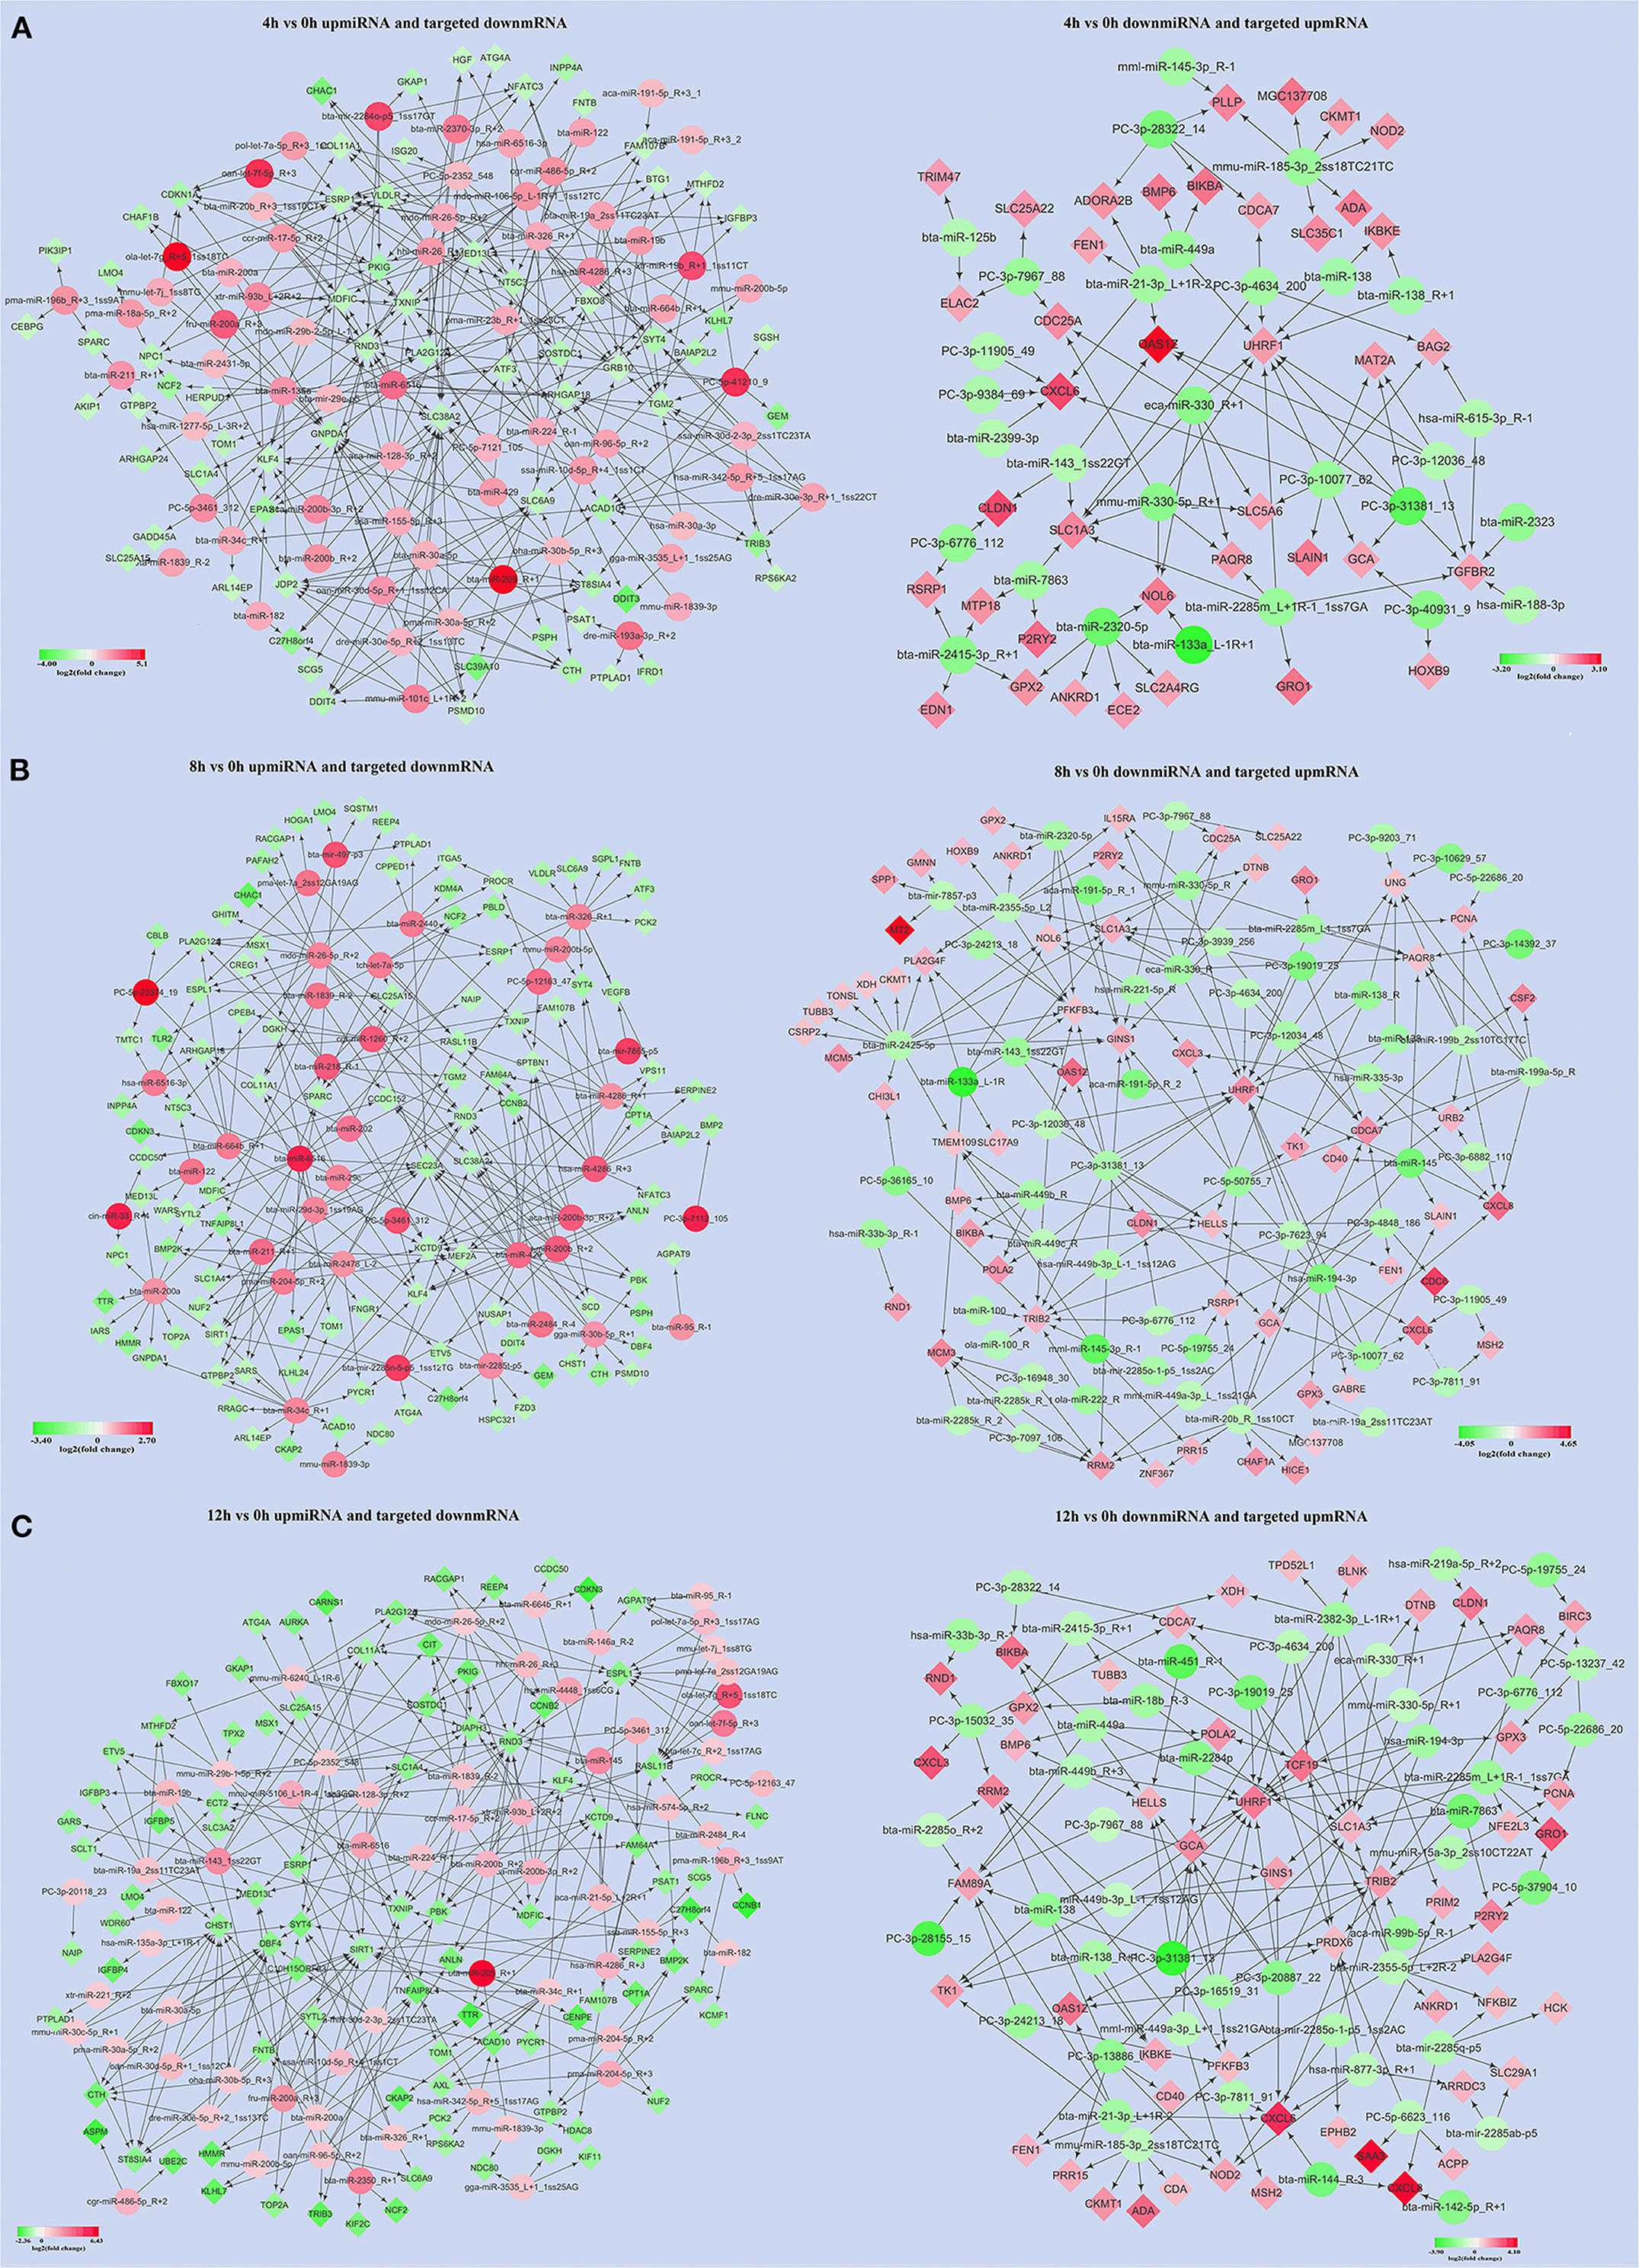
Figure 5. The significantly up/downregulated miRNAs along with significantly down/upregulated targeted mRNAs were screened out at 4, 8, and 12 h LPS-induced bMECs compared to 0 h, respectively. (A) The results were at 4 h; (B) the results were at 8 h; (C) the results were at 12 h. Green represents downregulation and red represents upregulation.
Subsequently, 18 significantly upregulated and 27 significantly downregulated miRNAs involved in inflammation and immunity were picked out. These miRNAs targeted 8 significantly downregulated mRNAs (CBLB, CEBPG, PROCR, TLR2, BMP2, NCF2, AXL, and NAIP) and 12 upregulated mRNAs (OAS1Z, BMP6, GRO1, CHI3L1, CXCL6, CXCL3, CXCL8, CSF2, EDN1, NFKBIA, NOD2, IKBKE) (Figure 6A). The expression levels of the 45 significantly up/downregulated miRNAs were analyzed (Figure 6B; Supplementary Figure 2).
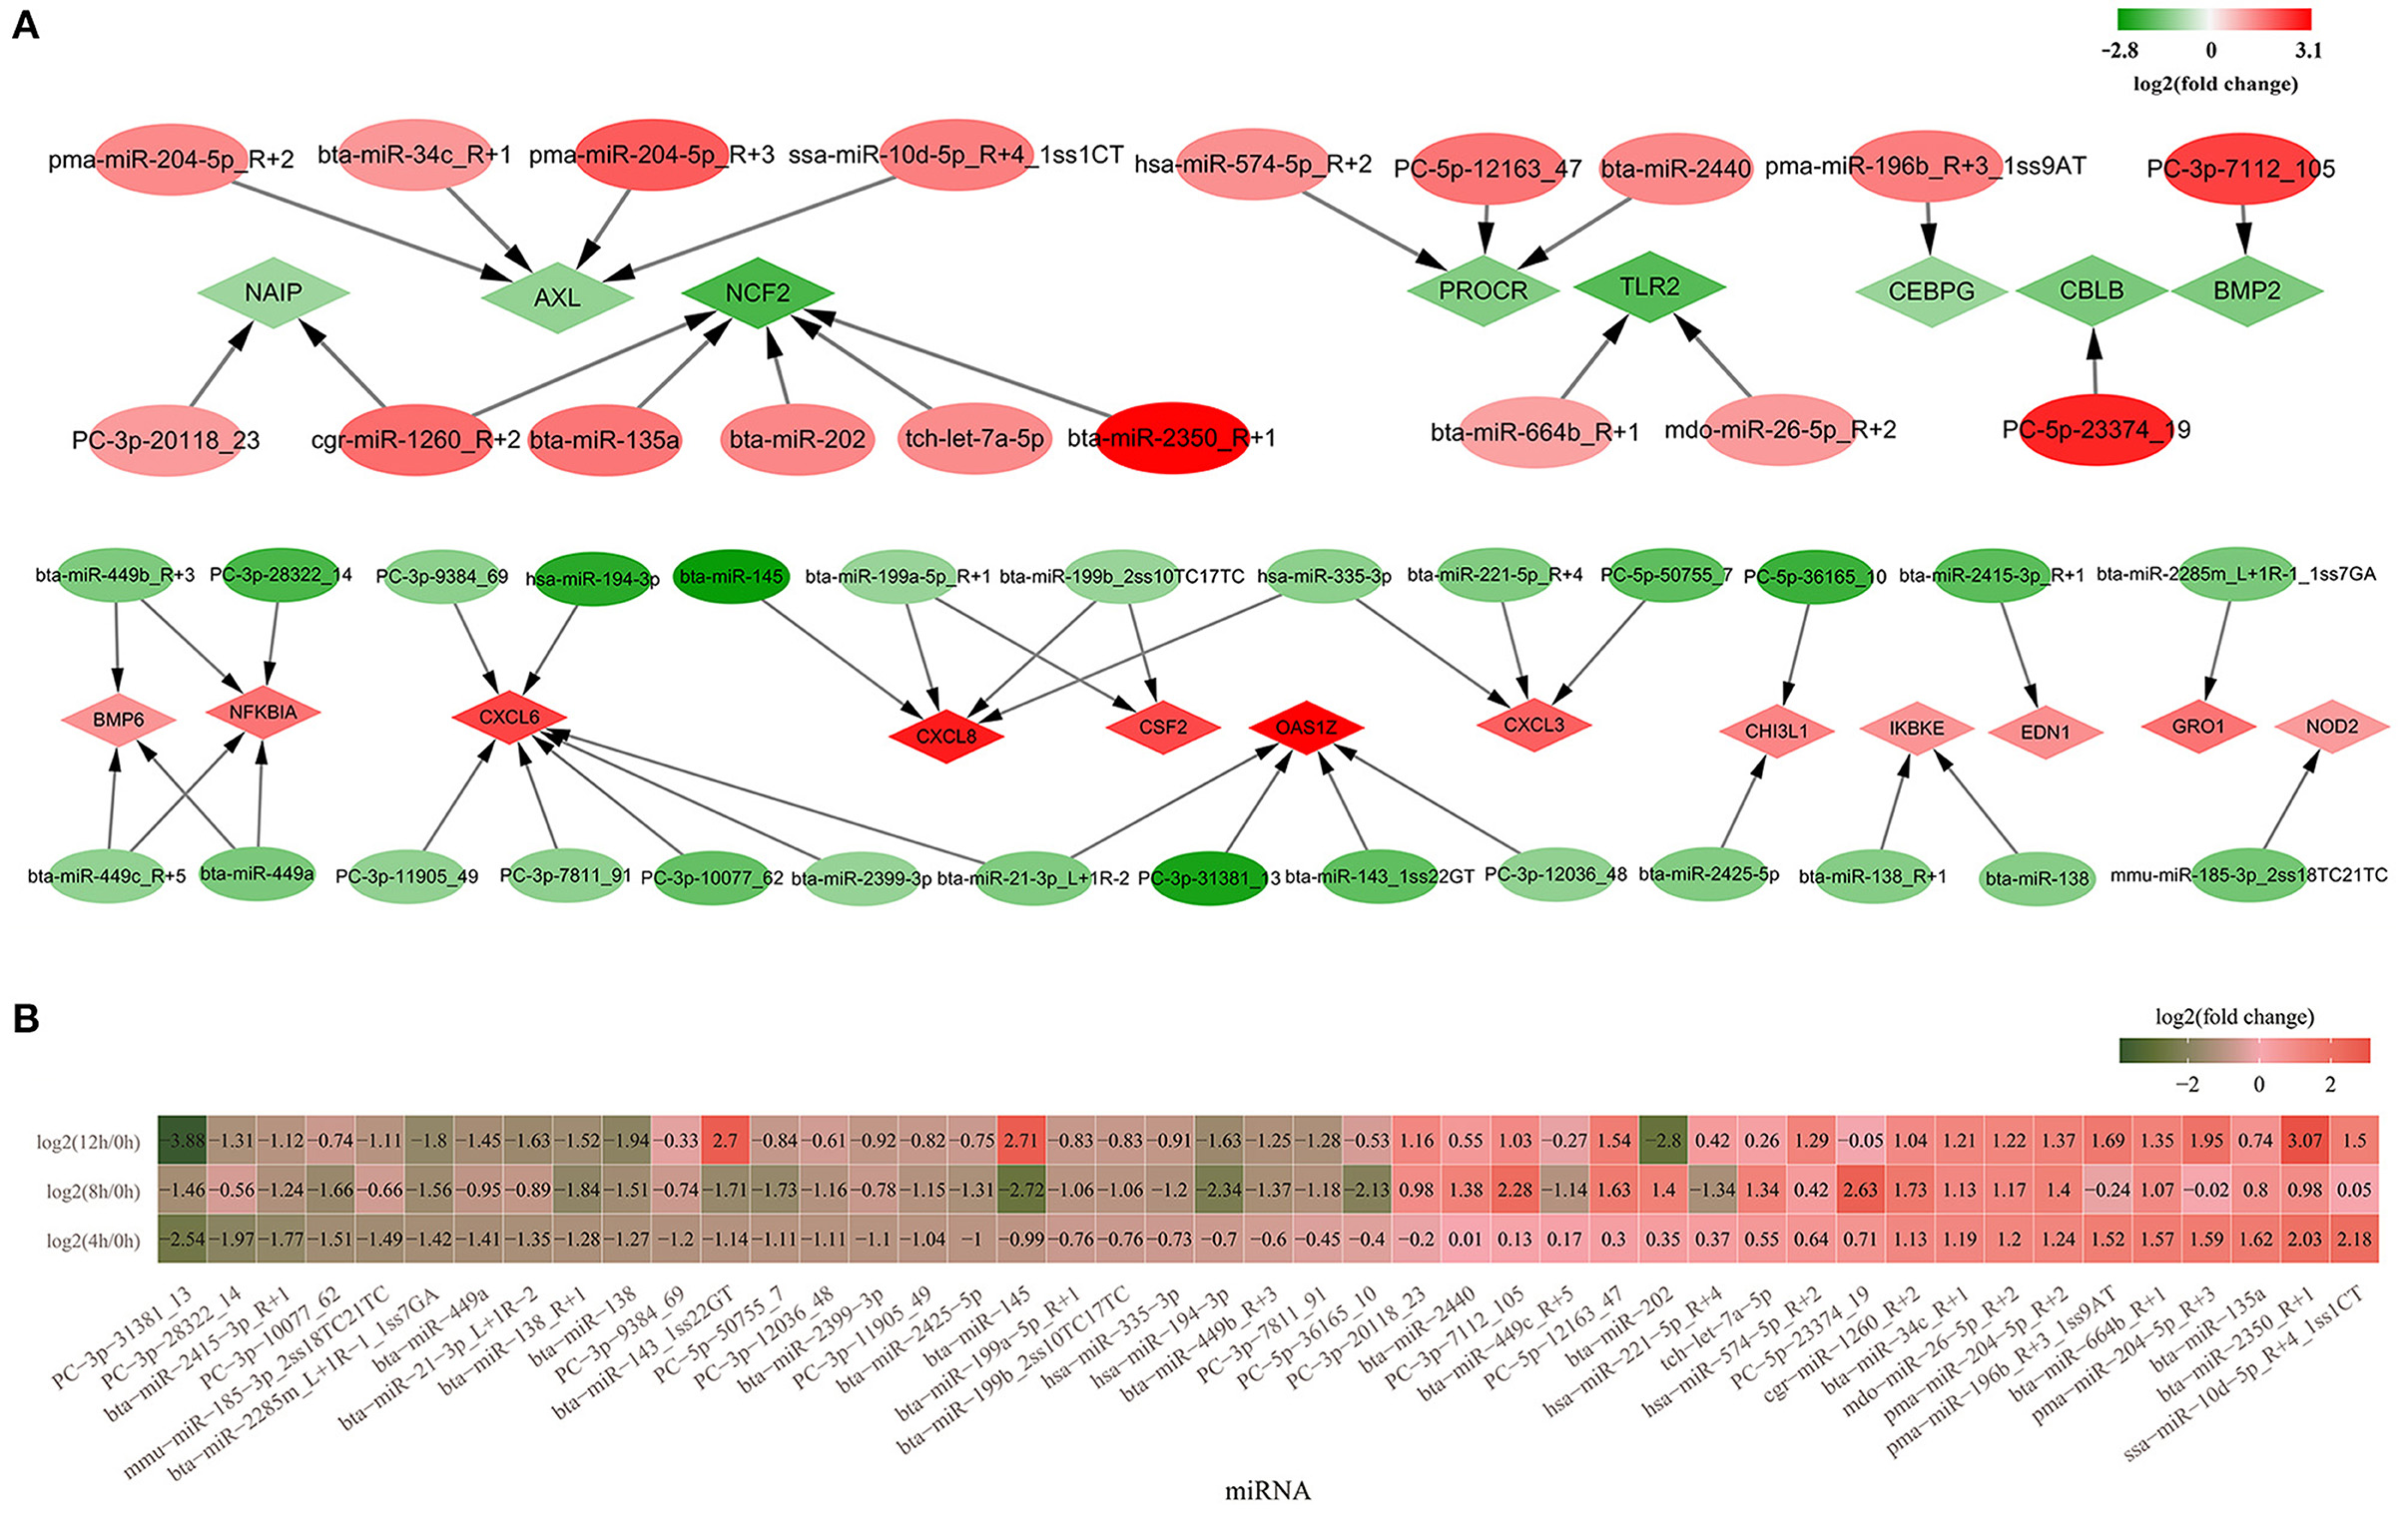
Figure 6. The differentially expressed miRNAs involved in inflammation and immunity. (A) Forty-five significantly up- or down regulated miRNAs involved in inflammation and immunity and their targeted mRNAs. Diamond represents mRNAs and the oval represents miRNAs; (B) The heatmap of relative expression for 45 significantly up/downregulated miRNAs in 4, 8, and 12 h bMECs. Green represents the downregulation and red represents the upregulation.
Among the 27 significantly downregulated miRNAs, PC-3p-31381_13, bta-miR-2415-3p_R+1, bta-miR-2285m_L+1R-1_1ss7GA, bta-miR-138_R+1, and bta-miR-138 significantly decreased throughout the LPS induction period. PC-3p-10077_62, PC-5p-50755_7, PC-3p-12036_48, PC-3p-11905_49, bta-miR-2425-5p, bta-miR-145, and bta-miR-143_1ss22GT were significantly downregulated at 4 and 8 h. Moreover, it was suddenly increased at 12 h cells for bta-miR-143_1ss22GT [log2(12/0 h) = 2.7, log2(12/4 h) = 3.7, log2(12/8 h) = 4.41] and bta-miR-145 [log2(12/0 h) = 2.71, log2(12/4 h) = 3.84, log2(12/8 h) = 5.43] (Figure 6B; Supplementary Figure 2). Hsa-miR-194-3p, bta-miR-449b_R+3, and PC-3p-7811_91 were downregulated at 8 and 12 h cells. PC-3p-9384_69 and bta-miR-2399-3p were significantly decreased only at 4 h, while bta-miR-199a-5p_R+1, bta-miR-199b_2ss10TC17TC, hsa-miR-335-3p, PC-5p-36165_10, bta-miR-449c_R+5, and hsa-miR-221-5p_R+4 significantly went down at 8 h cells. There is a deviation in the expression levels of PC-3p-28322_14, mmu-miR-185-3p_2ss18TC21TC, bta-miR-449a, and bta-miR-21-3p_L+1R-2, which were decreased significantly at 4 and 12 h corresponding to 0 h, but not at 8 h cells (Figure 6B; Supplementary Figure 2).
For the 18 significantly upregulated miRNAs, bta-miR-664b_R+1, pma-miR-204-5p_R+2, mdo-miR-26-5p_R+2, bta-miR-34c_R+1, and cgr-miR-1260_R+2 were significantly higher at 4, 8, and 1 2h. PC-3p-7112_105 and PC-5p-12163_47 were significantly increased from 8 to 12 h. But the expression levels of pma-miR-196b_R+3_1ss9AT, pma-miR-204-5p_R+3, bta-miR-2350_R+1, and ssa-miR-10d-5p_R+4_1ss1CT at 8 h differed from that at 4 and 12h, which were not significantly upregulated at 8 h LPS-induced cells (Figure 6B). There is a striking difference for bta-miR-202, which was significantly increased at 8 h [log2 (8/0 h) = 1.4] while significantly reduced at 12 h cells [log2 (12/0 h) = −2.8; log2 (12/4 h) = −3.15; log2(12/8 h) = −4.2] (Supplementary Figure 2). In a word, there is a great variability for the expression level of several miRNAs during LPS induced bMECs.
The Relative Expression Level of miRNAs by qPCR
The expression level of 12 miRNAs (bta-miR-664b_R+1, bta-miR-21-3p_L+1R-2, bta-miR-2313-3p_R+1, bta-miR-2285j_L-1R+1, bta-miR-199a-5p_R+1, bta-miR-339b_R+1, bta-miR-429, bta-miR-200b_R+2, bta-miR-135a, bta-miR-15a_R+1, bta-miR-138_R+1, and bta-miR-449a) were measured in LPS-induced bMECs by qPCR. We found that the qPCR results coincide with the sequencing results in LPS-induced bMECs, although there are still some deviations between sequencing and qPCR results. For example, the expression of bta-miR-15a_R+1 significantly decreased at 12 h by qPCR while not by sequencing, bta-miR-135a significantly increased at 8 h by qPCR and it went up at 4 h by sequencing; bta-miR-138_R+1 was significantly reduced after LPS induction by sequencing while not at 8 h cells by qPCR. These deviations may be due to two reasons, the one is the experiment error, and the second is that significance criteria are inconsistent in the processing of sequencing data and quantitative data by different software (Figure 7).
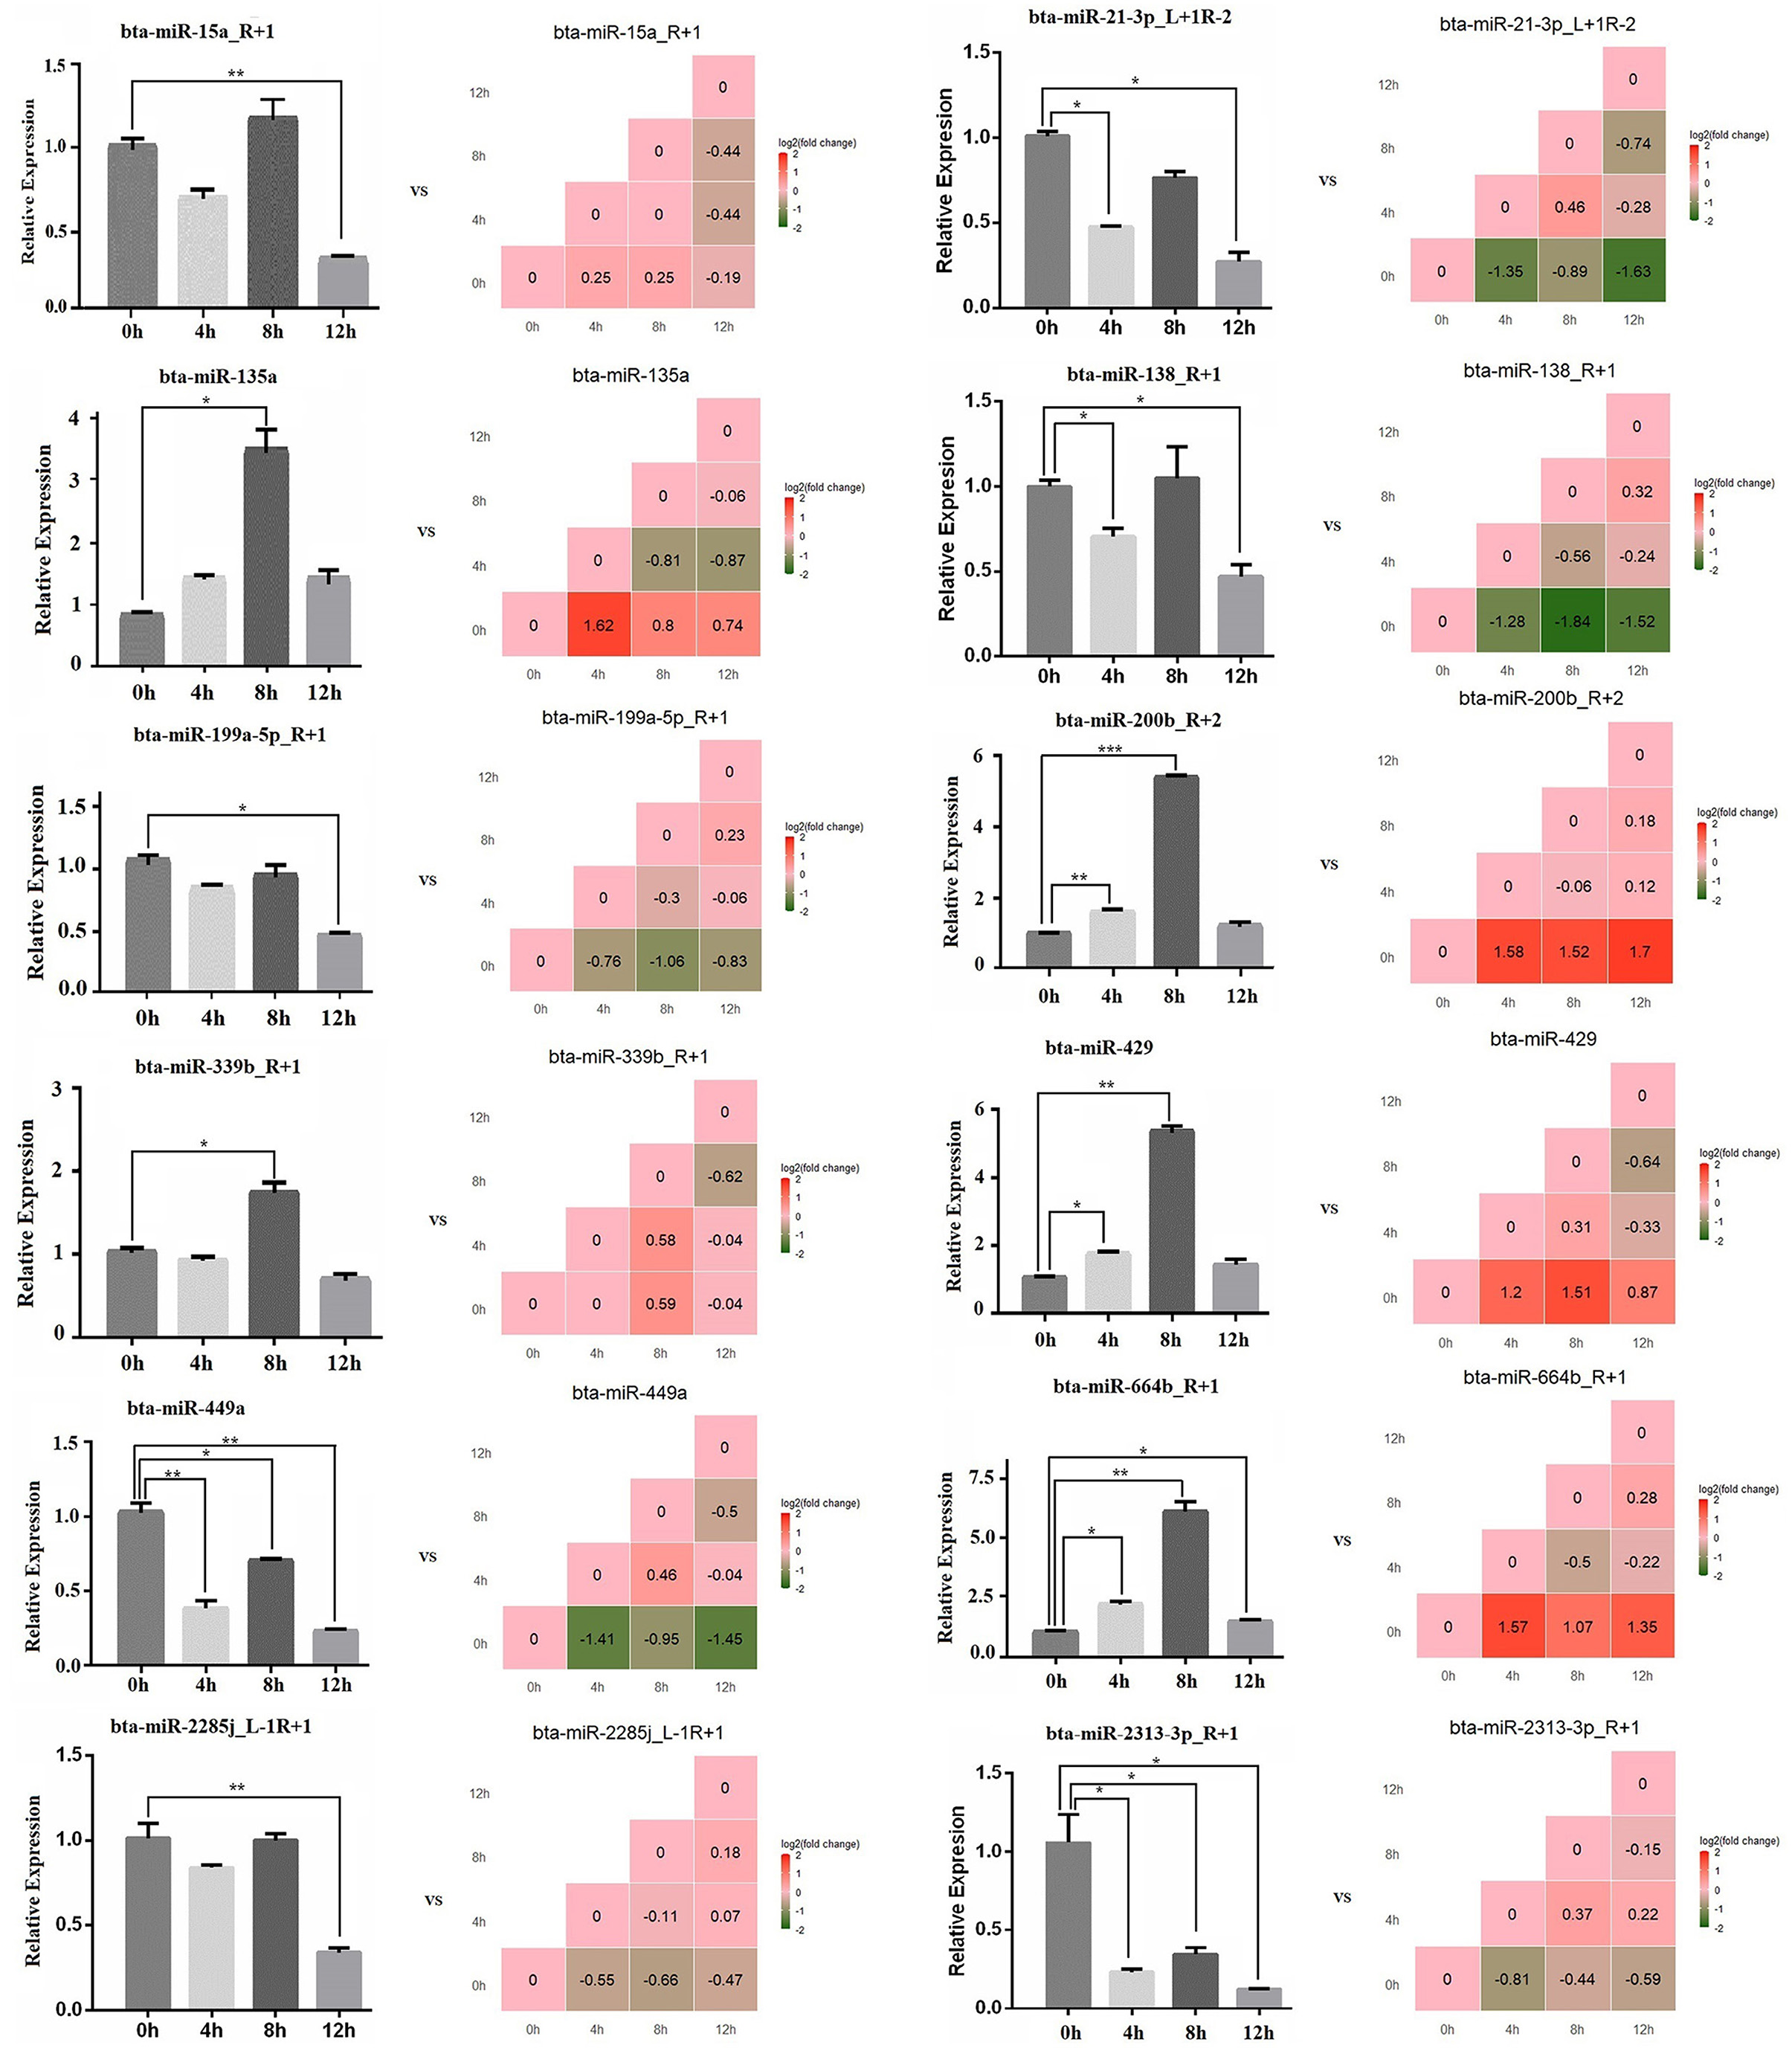
Figure 7. The relative expression level of microRNA by qPCR. The bar graph is the qPCR result, and the stair graph is the sequencing result; 0, 4, 8, and 12 h represent the LPS-induced 0, 4, 8, and 12 h bMECs; “*” represents P ≤ 0.05; “**” represents P ≤ 0.01; “***” represents P ≤ 0.001.
The GO Terms Related to Mammary Development and Milk Synthesis in LPS-Induced BMECs
The GO terms about the nutrition metabolism were also screened out for analyzing the milk synthesis ability of bMECs during the LPS-induced period. The number of significantly downregulated mRNAs was far more than the upregulated (Figure 8A), including 26 down- and 6 upregulated mRNAs at 4 h, 42 down- and 8 upregulated mRNAs at 8 h, and 20 down- and 6 upregulated mRNAs at 12 h. Especially at 8 h, most of the nutrition metabolism related-mRNAs showed a significant decrease, which resulted in inactive biosynthetic processes, such as the cellular amino acid biosynthesis process (GO:0008652), gluconeogenesis (GO:0006094), pyruvate biosynthetic process (GO:0042866), L-asparagine biosynthesis process (GO:0070981), L-serine biosynthesis process (GO:0006564), long-chain fatty acid metabolic process (GO:0001676), regulation of glucose metabolic process (GO:0010906), positive regulation of glucose import (GO:0046326), and galactose metabolic process (GO:0006012) (Figure 8A).
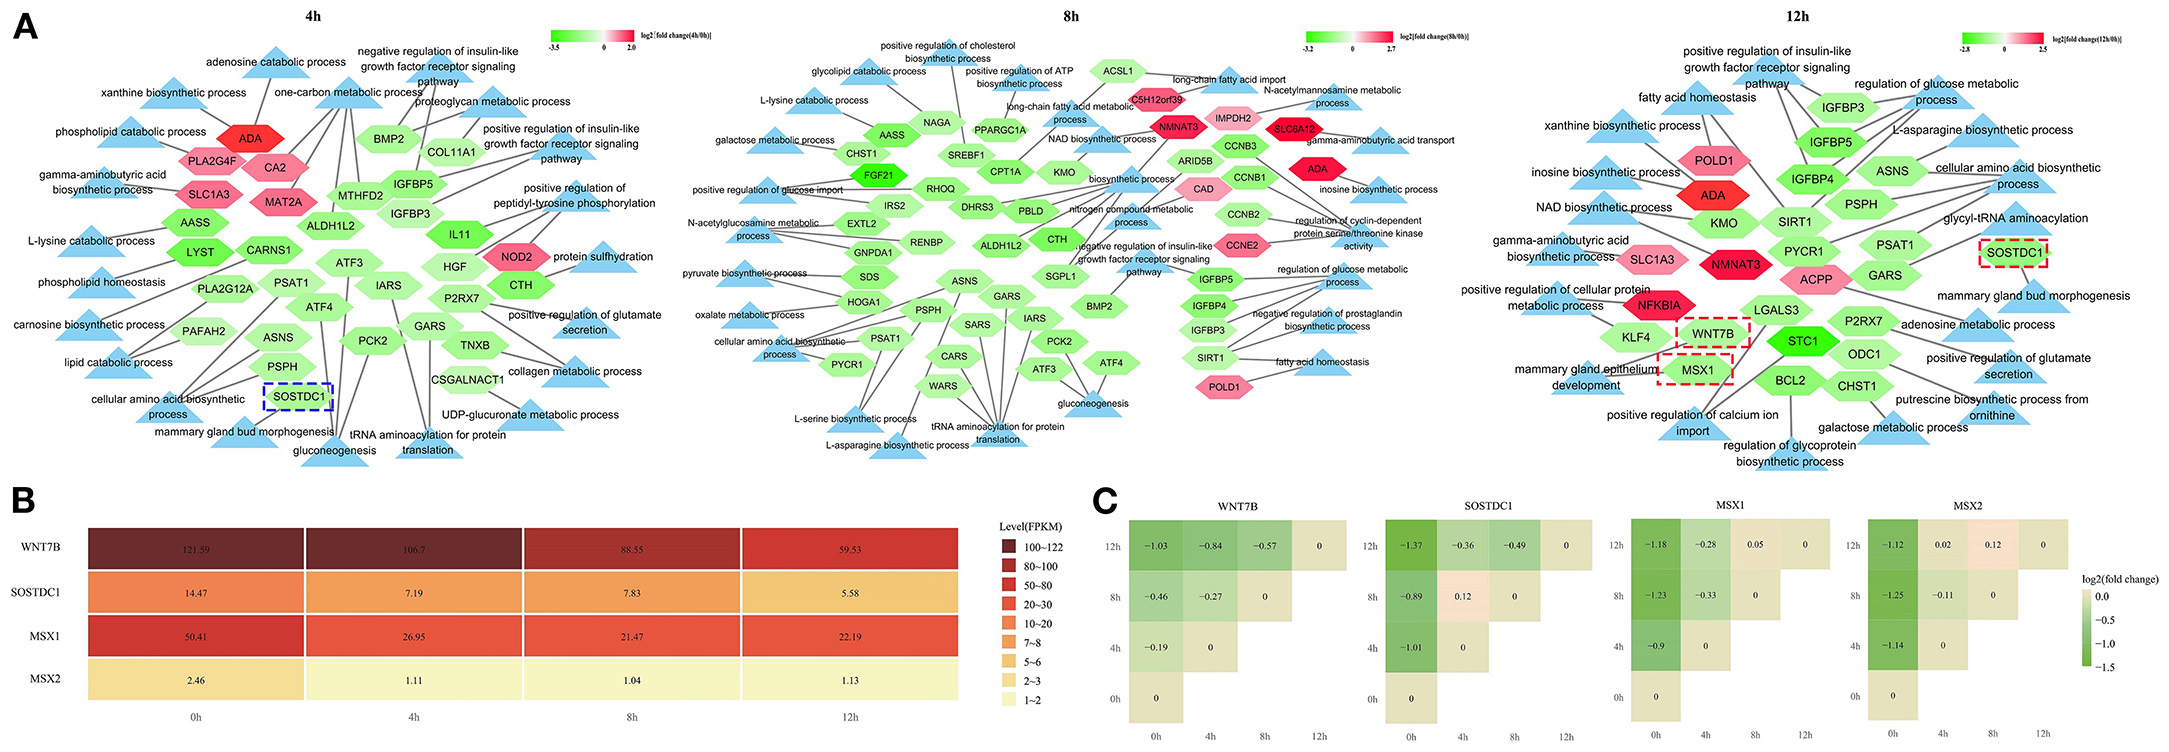
Figure 8. The expression network of the nutrition metabolism pathway-related genes. (A) The light blue triangle represents GO term related to the nutrition metabolism; the pentagon represents the differentially expressed mRNAs related to the nutrition metabolism pathway; (B) The expression level in fragment per kilobase of exon (FPKM), of 4 genes in LPS-induced bMECs; (C) The stair graphic of the relative differential relationship for 4 genes between different timepoints, such as log2(12/0 h), log2(8/0 h), log2(4/0 h), log2(12/8 h), log2(12/4 h), and log2(8/4 h) values. 0, 4, 8, and 12 h represent the LPS-induced 0, 4, 8, and 12 h bMECs; Green represents downregulation and red represents upregulation in (A,C).
Notably, the SOSTDC1 gene enriched at the mammary gland bud morphogenesis (GO:0060648) was significantly downregulated at 4 h and 12 h (Figures 8B,C). SOSTDC1 regulates the number and size of mammary buds (34). The mammary gland bud morphogenesis is important for the early stages of the mammary pool and mammary duct development that will directly determine the lactation capacity of the mammary. Furthermore, the WNT7B and MSX1 genes enriched in the mammary gland epithelium development (GO:0061180) were significantly downregulated at 12 h cells (Figures 8B,C). During puberty, the expression of WNT7B is enriched in the terminal end bud epithelium and plays a role in mammary duct branching morphogenesis (35). MSX1 and MSX2 appear to have necessary but redundant functions during the formation of the buds (36). In the present study, MSX2 is also significantly decreased after LPS induction although the expression level is lower than the MSX1 gene (Figures 8B,C).
These results demonstrated that the milk synthesis ability of bMECs will be undermined after LPS challenge and SOSTDC1, WNT7B, MSX1, and MSX2 may be the important regulated genes for lactation capacity.
The Expression of TLR Signaling Cascades in LPS-Induced bMECs
Crude LPS also contains bacterial lipoproteins and stimulates both the TLR4 and TLR2 activation pathways (9). In the present study, TLR2 significantly decreased, and the expression level is low in LPS-induced bMECs, while the expression level of TLR4 is much higher with a slight increase at 12 h (Figure 9A). So, TLR4 pathway may be the main regulatory signaling in bMECs after the crude LPS challenge.
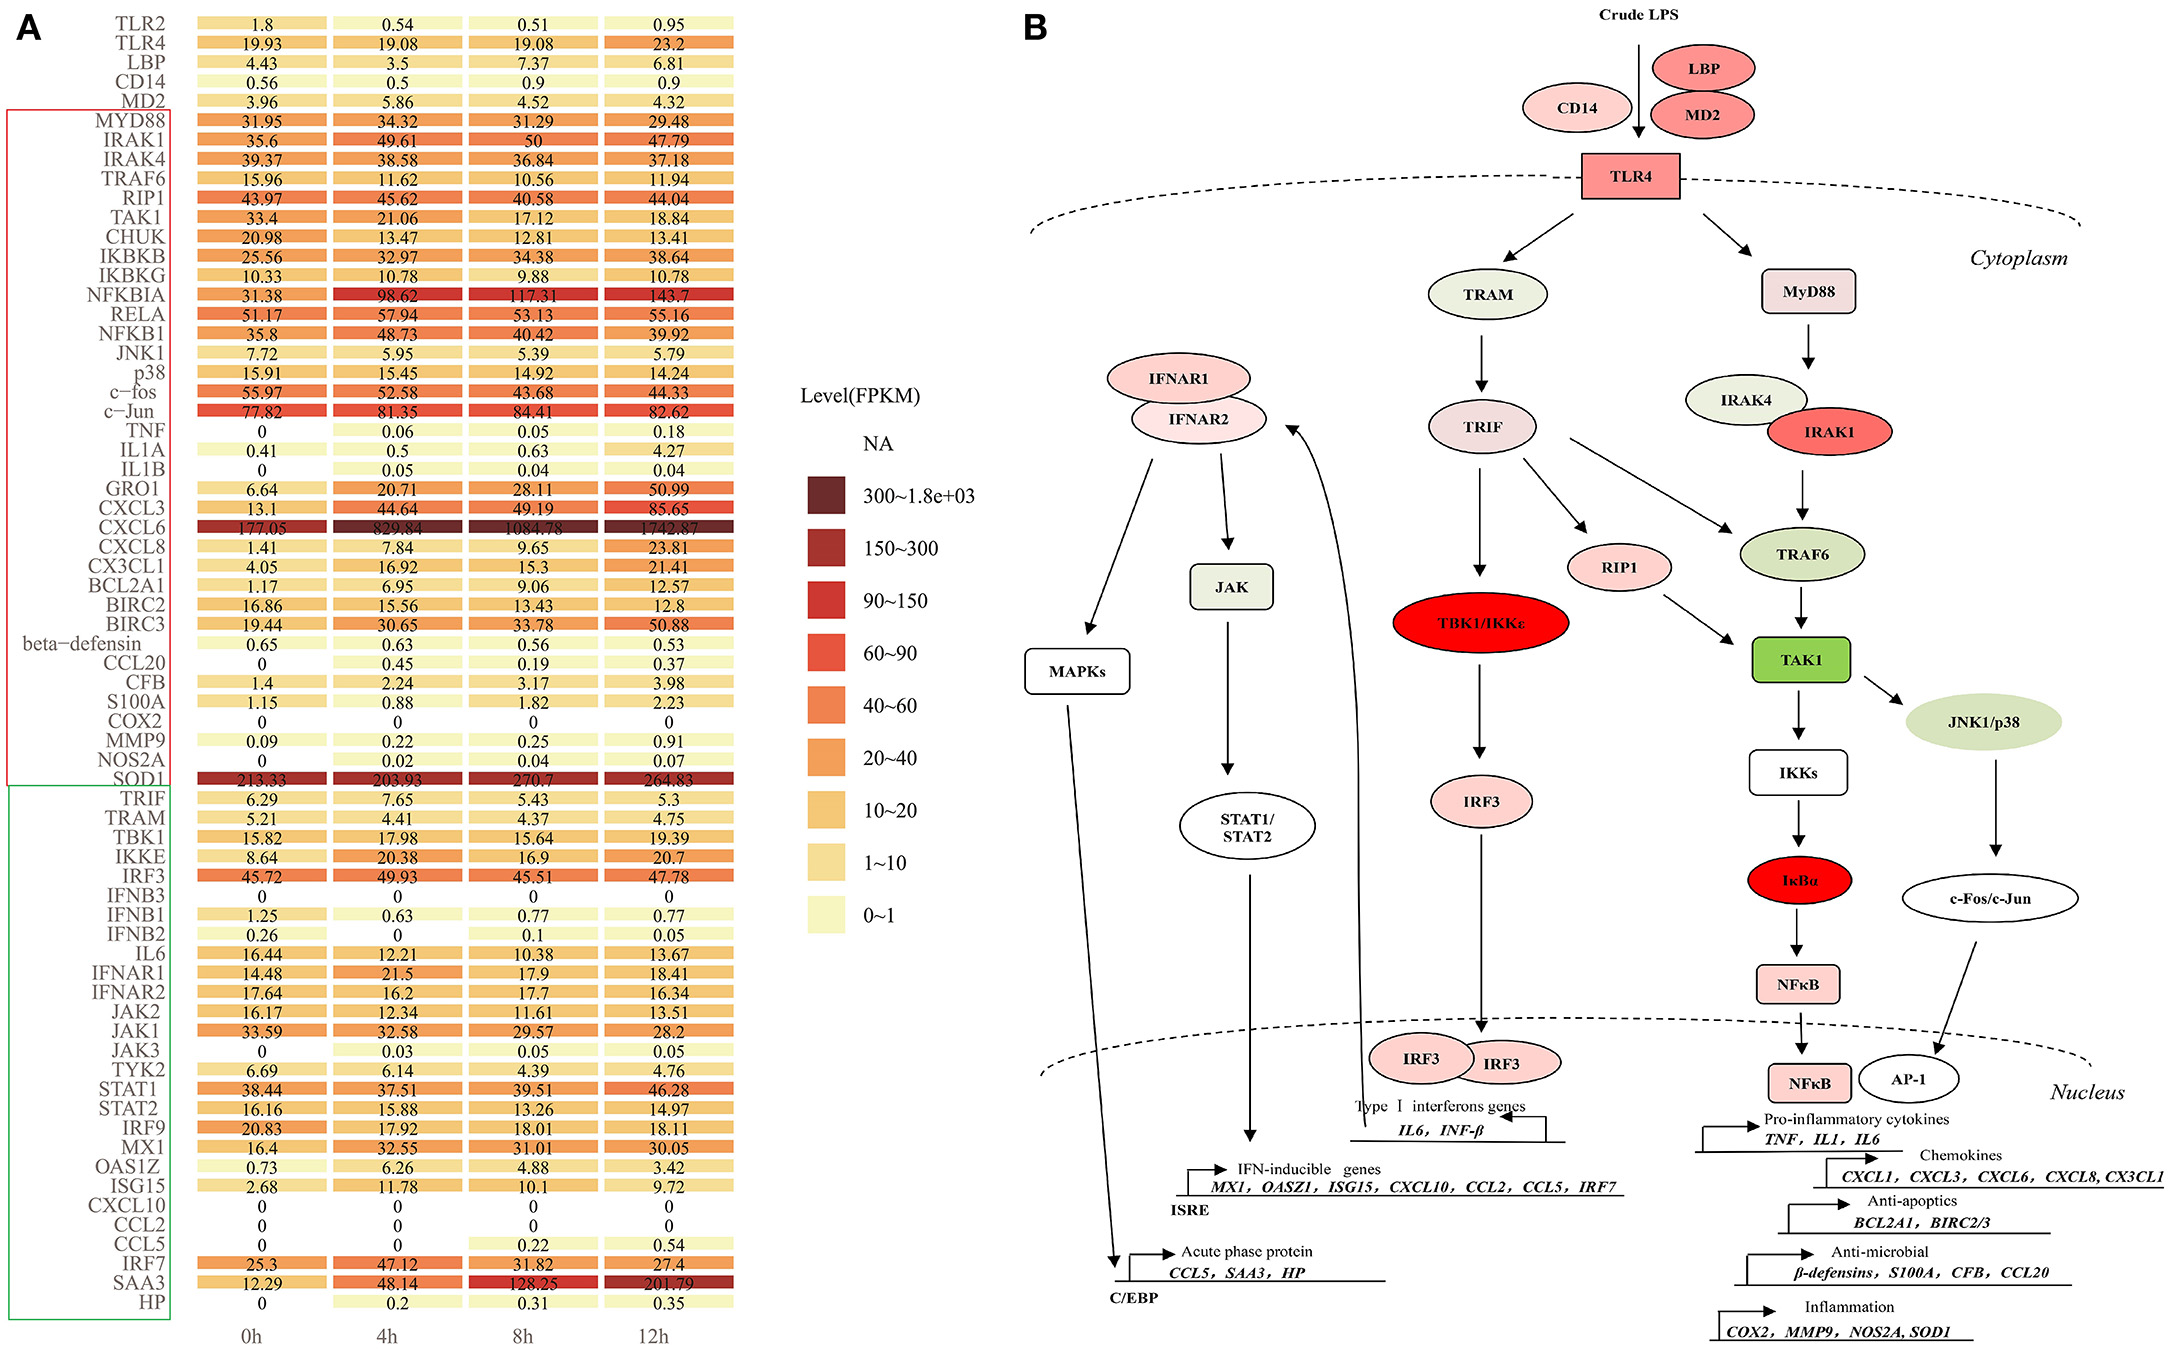
Figure 9. The TLR4 signaling cascades in LPS-induced bMECs. (A) The expression level (FPKM) of all members involved in myeloid differentiation factor 88 (MyD88)-dependent and independent pathway in LPS-induced bMECs; (B) TLR4 signaling following MyD88- dependent and independent pathways. First, signaling via MyD88 subsequently recruits IRAK1, IRAK4 (IL1R associated kinase family), and TNF receptor-associated factor 6 (TRAF6), forms a complex with TAK1 (mitogen-activated protein kinase kinase kinase 7, MAP3K7), then activate TAK1, which phosphorylates IκB kinases (IKKs, IKK1/IKK2/NEMO complex) and MAP kinases (e.g., JNK, p38). TAK1 can also be induced by receptor-interacting protein 1 (RIP1). IKKs phosphorylate the IκBα, then leads to IκBα degradation, enabling the nuclear translocation of NFκB, ultimately beginning the transcription activation of pro-inflammatory cytokines (TNFα, IL1, and IL6), chemokines (GRO1, CXCL3, CXCL6, CXCL8, and CX3CL1), anti-apoptotic genes (BCL2A1 and BIRC2/3), anti-microbial genes (β-defensins, S100A, CFB, and CCL20) and inflammatory genes (COX2, MMP9, SOD, and NOS2A). Another pathway AP-1 transcription factor formed by c-Fos and c-Jun can be activated by JNK1/p38 complex, then initiate the production of cytokines and chemokines like NF-kB signaling. Second, the TRIF-dependent cascade through the bridging adaptor, TRIF-related adaptor molecule (TRAM) by the delayed mode in either a TRAF6 or RIP1-dependent manner activate TAK1 and trigger NFκB and AP-1 pathway. TRIF also interacts with TRAF-associated NFκB activator-binding kinase 1 (TBK1) and IκB kinase epsilon (IKKε), which phosphorylate IRF3, leading to induction of typeIIFN genes (IFNβ/IL6). The IL6 or IFNβ binds to its receptor, IFNAR1/2 causing the activation of JAKs, eventually activating STAT1. The STAT1 binds as a homodimer to the gamma interferon-activating sequence or trimerizes with STAT2 and IRF9 to form interferon-stimulated transcription factor 3 (ISGF3), which can bind to interferon-stimulated response element (ISRE)-mediated expression of secondary response genes, such as MX1, OASZ1, ISG15, CXCL10, CCL2, CCL5, and IRF7. Binding IFNAR1/2 also activates MAPKs, then trigger C/EBPβ to induce the expression of acute-phase proteins, such as CCL5, SAA3, and HP. Red represents increased expression; green represents decreased expression in (B).
Here, we display the expression level of all the members involved in TLR4 signaling cascades (Figure 9A). After LPS induction, bMECs should respond to the stimulation through the TLR4 pathway following MyD88-dependent and TRAM/TRIF-dependent signaling cascades (13) (Figure 9B). For extracellular signal transduction, LPS-signal presenting molecules LBP, CD14, MD2, and TLR4 all showed increased expression.
The expression of MyD88, IRAK1, IRAK4, and TRAF6 changed non-significantly, while the hub molecular TAK1 for AP-1 and NFκB pathways was significantly downregulated (Figure 2E). The RIP1 shows no significant change but with a slight increase (Figure 9A). The expression levels of IKBKB, NFKBIA, RELA, and NFKB1 increased, while that of CHUK (IKK1) was decreased. Kinases IKK1 is believed to be a negative regulator of TLR signaling by sequestering NEMO (IKBKG) away from IKK2 (IKBKB), and IKK1 knockout cells show overt inflammatory cytokine production (37). So decreased CHUK promotes inflammation in LPS-induced bMECs. In contrast, AP-1 pathway is less active, because the kinases complex JNK1/p38 and c-fos all were decreased, although c-Jun slightly was increased (Figure 9A). Thus, the downstream response genes are mainly induced by the transcription factor NF-κB (Figure 9B).
Pro-inflammatory cytokines (IL1α, IL1β, and TNFα) were significantly increased but the expression level was lower in induced cells, especially IL1α. The expression of IL6 was relatively higher in control cells, but it decreased after the LPS challenge. Chemokines GRO1, CXCL3, CXCL6, CXCL8, and CX3CL1 significantly upregulated after LPS induction and kept higher expression, particularly CXCL6. The anti-apoptotic effect may be significantly active because BCL2A1 and BIRC3 significantly increased with a higher expression. The anti-microbial and inflammatory effects were also activated but weak because the involved genes significantly increased while in a low expression, such as CCL20, CFB, S100A, MMP9, and NOS2A. The β-defensin even slightly decreased (Figure 9A). After the LPS was challenged, the oxidative stress activity of bMECs is strengthened with the increasing SOD1 (Cu, Zn-superoxide dismutase) (Figure 9A), which helps protect mitochondria from oxidative damage during disease.
After LPS induction, TRIF increased at 4 h LPS-induced bMECs but decreased at 8 h and 12 h cells, and TRAM slightly decreased after LPS induction (Figure 9A). TBK1 and IRF3 increased but not significantly and with a high expression level at bMECs (Figure 9A), while IKBKE significantly increased (Figure 2E; Supplementary Figure 1). However, the primary response genes IL6, IFNB1, and IFNB2 showed decreased, IL6 with a relatively higher expression as previously mentioned (Figure 9A). The basic existing IL6 or IFNB in bMECs will bind to its receptor, IFNAR1 and IFNAR2 causing the activation of the Janus tyrosine kinases (JAKs), eventually activating STAT1 (Figure 9B). The expression of JAK1, JAK2, and TYK2 decreased, while JAK3 was expressed in trace after LPS induction. The STAT1 is slightly increased from LPS-induced 8 h cells (Figure 9A).
The STAT1 binds as a homodimer to the gamma interferon-activating sequence or trimerizes with STAT2 and IRF9 to form ISGF3 (interferon-stimulated transcription factor 3), which will mediate the expression of IFN-inducible secondary response genes (Figure 9B). STAT2 and IRF9 slightly decreased with relatively higher expression, while secondary response genes, such as MX1, OASZ1, ISG15, CCL5, and IRF7 increased; apparently, CXCL10 and CCL2 were not detected. Moreover, SAA3 and HP also significantly increased, especially SAA3 with a high expression level (Figure 9A). The chemokines, CXCL10, CCL2, and CCL5 are optimal productions of the type I IFN pathway, which is a part of the “type I IFN chemokine signature”, and mainly attract monocytes, natural killer cells, and activated lymphocytes (38). We found the NFκB dependent- chemokine CXCL1, CXCL3, CXCL6, CXCL8, and CX3CL1 are early and strongly induced by the LPS in our bMEC model. Only at later times did LPS induce CCL5, but not CCL2 and CXCL10 (Figure 9A).
In brief, bMECs mainly play a role in secreting chemokines for recruiting the neutrophil to fight against pathogens and anti-apoptosis for protecting themselves from dying during mastitis; they were charged with weak anti-microbial and proinflammatory effects. The NF-κB pathway plays a key role in recruiting neutrophils, not the Type I IFN pathway for bovine mammary epithelial cells (bMECs).
Discussion
Mastitis causes significant losses in the dairy industry and its susceptibility is a multifactorial complex phenotype, which is not the result of single genes acting in isolation but rather is attributable to perturbation at a network or systems level. Heritability for mastitis traits (clinical, subclinical, SCC) is relatively low (from 0.003 to 0.18); genetic selection for mastitis resistance is nevertheless has been demonstrated to reduce the incidence of mastitis, particularly when genetic markers of mastitis traits are used (39). The bovine mammary epithelium is the first line of defense after a bacterial infection. Revealing the functional mechanism of mammary epithelial cells during mastitis will help to find key mastitis of genetic marker molecules.
The Molecules Regulated TLR Signaling in LPS-Induced bMECs
The expression of TLR2 is differentially upregulated in E. coli-incubated pbMECs (8), but it is significantly downregulated either by qPCR or sequencing in LPS-induced bMECs (Figure 3), which may be due to the fact that crude LPS mainly triggers the TLR4 signaling while not the TLR2 signaling. Nevertheless, most of the genes showed a consistent expression trend between MAC-T cells induced by LPS and pbMECs induced by E. coli, such as GRO1, CXCL3, CX3CL1, CXCL6, CXCL8, OAS1Z, NFIL3, TNFAIP3, IKBKE, NFKBIZ, CHI3L1, C3, MX1, and ISG15 (8).
The proinflammatory cytokines, TNFα and IL1β are key components of the innate immune response to infection. They accelerate the inflammatory response either by directly or indirectly regulating the functions of infiltrating neutrophils, monocytes, and the cytokines produced by these cells. Although the mRNA of TNFα and IL1β were significantly augmented upon stimulation with LPS/E.coli, and to some extent upon stimulation with SaS/ heat-inactivated S. aureus in primary bMECs (8–10). Gilbert et al. demonstrated that pbMECs are unable to secrete TNFα and IL1β at protein level by detecting the supernatants of bMEC incubated with LPS or with SaS (9). In this study, the expression level of TNFα and IL1β are relatively low but increase after LPS treatment (Figure 9A).
In addition, the secretion of IL-1β is not equivalent to expression at the RNA level, as secretion requires cleavage of pro-IL-1β by activated caspase-1, which results from inflammasome activation. Meanwhile, activation of purinergic P2X7 receptors (P2X7R) by extracellular ATP is a key physiological inducer of rapid IL-1β release. P2X7R antagonism prevents IL-1β release from salivary epithelial cells and reduces inflammation in a mouse model of autoimmune exocrinopathy (40). The P2X7R significantly decreased after LPS induction in bMECs (Figure 2E), Overall, TNFα and IL1β are likely to be mainly produced by the resident or recruited leucocytes rather than by MEC in mammary during mastitis.
The CBLB is a TLR4 antagonist, which can degrade phosphorylated MyD88 and TRIF, then inhibits TLR signaling in innate immune responses (41). Significantly decreased CBLB may promote the MyD88- and TRIF-dependent signaling in LPS-induced bMECs (Figures 2E, 9B).
The bta-miR-138 and bta-miR-138_R+1 were predicted to target on the 3′UTR of IKBKE, and the expression level of the two miRNAs was significantly downregulated. The level of miR-138 was markedly reduced in the cartilage tissues of osteoarthritis and the overexpression of miR-138 suppressed the protein levels of p65 (42), which is the key transcription factor of the NFκB pathway. Correspondingly, the expression level of the mRNA p65 (RELA) was increased after LPS induction in bMECs (Figure 9A). Upregulation of miR-143-3p expression reduced TNFα, MyD88, p50, and alveolar epithelial cell apoptosis in mycoplasma pneumonia mice by inhibiting TLR4/MyD88/NF-κB axis (43). The bta-miR-143_1ss22GT is predicted to target OAS1Z (Figure 6A). decreased bta-miR-143_1ss22GT may promote TLR4/MyD88/NF-κB cascade and increase the expression of TNFα, and OAS1Z in LPS-induced bMECs (Figures 9A,B).
The Chemokines and Related miRNAs of bMECs After LPS Induction
Mammary epithelial cells (MECs) challenged by a bacterial infection should have the capacity to attract polymorphonuclear leukocytes into mammary tissue and mount an innate immune response. After LPS-challenged, the early chemokine and cytokine production preceded the defense and stress responses in bMECs. bMECs can secrete the chemokines, such as GRO1(CXCL1), CXCL3, CXCL6, and CXCL8, which have strong chemoattractant activities that attract mainly neutrophils. All of the chemokines showed significant and rapid increases in MECs after LPS treatment (Figure 2E; Supplementary Figure 1). These results are generally consistent with the results in cow udders infected with E. coli (44) and S. aureus (18), as well as in the LPS-induced primary MECs (9). In particular, CXCL6 had the highest expression level among chemokines in bMECs. The CXCL6 usually significantly altered the expression level at bMECs after infection (6, 8, 45) but not at mammary tissues with mastitis (18, 46). The C-X3-C motif chemokine ligand 1 (CX3CL1) is a unique chemokine functioning both in a transmembrane and soluble form. The transmembrane form of CX3CL1 primarily serves as an adhesion molecule, but when cleaved to a soluble form, CX3CL1 predominantly functions as a chemotactic cytokine (47). After LPS induction, CX3CL1 showed a significant increase at 4, 8, and 12 h (Figure 2E), and may serve a unique role during the inflammation of bMECs.
On the contrary, the miRNAs targeting these chemokines, such as bta-miR-221-5p_R+4–CXCL3 axis, hsa-miR-335-3p–CXCL3/CXCL8 axis, bta-miR-145–CXCL8 axis, bta-miR-199a-5p_R+1–CXCL8 axis, bta-miR-199b_2ss10TC17TC–CXCL8 axis, bta-miR-21_3p_L+1R-2–CXCL6 axis, hsa-miR-194-3p–CXCL6 axis, etc., significantly decreased (Figure 6A). Downregulation of miR-221-5p significantly promoted the expression of TNFα, IL8, and IL1β during acute gouty arthritis, and IL1β was proved to be targeted by miR-221-5p (48). MiR-335-5p elevation inhibited the inflammation, as evidenced by decreased levels of TNFα, IL6, and IL8 (49). The LPS repressed the transcription of miR-143/145 cluster and decreased the miR-145 levels; attenuation of miR-145 activity triggered inflammation and increased serum chemokines in C57BL/6J mice (50).
Both miR-199a-3p and miR-199b can control apoptosis and inflammation by targeting IKKβ to regulate the NF-κB pathway (51, 52). In this study, decreased bta-miR-199a and bta-miR-199b may relieve the inhibition effects of IKKβ to trigger NF-κB signaling, increasing the IKKβ (IKBKB) with the LPS-induced time (Figure 9A). STAT3 was a direct target of miR-21-5p, and miR-21-5p can mediate the IL-6/STAT3 pathway to regulate the levels of inflammation and apoptosis (53). In the present study, downregulated bta-miR-21 and increased STAT3 may be another reason for significantly upregulated IFN-inducible genes.
In short, the upregulation of chemokines and downregulation of miRNAs may promote the recruitment of neutrophils in the mammary tissue. Increased neutrophils can mount a rapid non-specific phagocytic response and respiratory burst activity that kills invading bacteria.
The Phagocytosis in bMECs After LPS Induction
The neutrophil cytosolic factor 2 (NCF2) and tubulin alpha-1D chain (TUBA1D) are two molecules involved in phagocytosis which are significantly decreased after LPS induction (Figure 2E). The NCF2 is known to participate in ROS metabolism-regulating neutrophil respiratory burst (54). Tubulin is the major constituent of microtubules that facilitate the maturation of phagosomes and control the phagosome movement and shape; reduced TUBA1D is not conducive to stabilizing phagosome structures for playing phagocytosis. Epithelial cells engage in phagocytosis, which is an essential defense mechanism of innate immunity, but phagocytosis is not the salient property of bMECs after LPS stimulation.
Decreased NCF2 may be controlled by significantly upregulated cgr-miR-1260_R+2, bta-miR-2350_R+1, bta-miR-202, bta-miR-135a, tch-let-7a-5p, respectively (Figure 6A). Among them, miR-135a overexpression inhibited p-p65 levels and restrains NF-κB activation in lung tissues by targeting TLR4 to alleviate inflammatory response (55). Increased bta-miR-135a may be one of the factors that balances the NF-κB pathway activity in LPS-induced bMECs. High miR-202-5p expression increased proliferation and prevented apoptosis and autophagy in oxygen-glucose deprivation/reoxygenation-treated N2a cells (56). Increased bta-miR-202 may also prevent the apoptosis of LPS-induced bMECs. Let-7a inhibitor significantly reduced the expression level of TNFα, IL1β, IL6, and IL8 during LPS-induced cartilage inflammatory injury (57). Upregulated bta-let-7a-5p and tch-let-7a-5p, especially bta-let-7a-5p, which is the second top-expressed miRNA (Figure 4), may play essential roles in increased TNFα, IL1β, and IL8 in LPS-induced bMECs.
The Anti-inflammatory and Anti-apoptotic Activity of LPS-Induced bMECs
Endothelial protein C receptor (EPCR, encoded by PROCR gene) plays a key role in the protein C anticoagulant pathway, and the procoagulant clotting factor VIIa (FVIIa) can bind to EPCR and elicits anti-inflammation via suppression of TNFα- and LPS-induced expression of cellular adhesion molecules and IL6, while inhibition of EPCR can abolish the anti-inflammatory effect (58). Here, PROCR gene is decreased which may lead to the weakened anti-inflammatory effect of EPCR in LPS-induced bMECs (Figure 2E). Interleukin 11 (IL11) is a pleiotropic cytokine with antiapoptotic and anti-inflammatory; it can attenuate IL1-mediated catabolic and inflammatory processes (59). Significantly downregulated IL11 (Figure 2E) may play a weak role in anti-apoptosis and anti-inflammatory effects in LPS-induced bMECs.
Sphingosine kinase 1 (SPHK1) catalyzes the formation of sphingosine-1-phosphate (S1P), which is essential for the production of the multifunctional NFκB-regulated cytokine IL6 (60). Significantly downregulated SPHK1 may result in decreased expression of IL6, but the basal existing IL6 also can induce the second response genes of the Type I IFN pathway, such as ISG15, MX1, OAS1Z, IRF7 (Figures 9A,B). The AXL is a cell surface receptor tyrosine kinase; activation of AXL attenuates neuroinflammation by inhibiting the TLR/TRAF/NF-κB pathway (61). In the present study, downregulated AXL may promote the NF-κB pathway in bovine MECs.
Neuronal apoptosis inhibitory protein (NAIP) is a member of both IAPs (inhibitory apoptosis proteins) and NLR families and has two different biological functions: pro-inflammatory and anti-apoptosis (62). The impaired regulation of apoptosis is considered to be a prominent event in the development and progression of tumor cells. As a result, significantly reduced NAIP will promote the death of bMECs and prevent them from being developed into tumor cells. The NOD2 is another member of NLR family and was proved to prevent inflammation (63). Significantly downregulated NAIP and upregulated NOD2 were beneficial for the anti-inflammatory effects of bMECs after LPS treatment.
Oxidative stress molecule, HSPA6 significantly and rapidly rises at 4 h, then has a sharp decrease at 8 h cells (Figure 2E), which demonstrated that HSPA6 is an “early response” factor for LPS-induced bMECs. The HSPA6 is also significantly upregulated in circulating leucocytes of clinical mastitis, but not in the subclinical mastitis (25). The key member C3 of the canonical and alternative route of the complement system is significantly upregulated at 12 h cell (Supplementary Figure 1). In Gilbert et al.'s (9) research, C3 was significantly downregulated in S. aureus culture supernatant (SaS)-induced 6 h bMECs, but not significantly differentially expressed in SaS-induced 3 h and LPS-induced 3 and 6 h bMECs. The C3 seems to be a “late response gene” after infection.
Both CCL20 and β-defensins display antimicrobial activity and bind to the CCR6 receptor, which is also known as macrophage inflammatory protein-3α (MIP-3α). The bMECs can express CCR6, but it was rapidly and significantly downregulated after they were LPS-induced (Figure 2E). Notably, the low upregulation of CCL20 disagrees with its strong induction of bMECs/pbMECs response to LPS (9) or E. coli (5, 8), which could be a MAC-T cell bias. This result represents the weak protective mechanism against the invading bacteria of MAC-T cells.
Colony-stimulating factor 2 (CSF2) plays a critical role in the resolution of inflammatory responses as well as in the development of chronic inflammation (64) by promoting the differentiation and maturation of macrophages. The CSF2 was significantly upregulated at the beginning of LPS induction (Figure 2E), which was also confirmed in Gilbert et al.'s (9) research at LPS but not in SaS-induced bMECs.
NFKBIA Is the Hub Gene for Balancing the Inflammatory Response of bMECs After LPS Induction
The intensity and duration of NFκB and Type I IFN pathway activation have to be controlled to avoid excessive inflammatory tissue damage, and a range of regulatory factors are set in motion to restrict activation, such as increased NFKBIA (IκBα) after LPS challenge (Figure 2E). The IκBα acts as the most important and key suppressor of NFκB pathway; increased IκBα will suppress the activity of NFκB pathway during inflammation response. Meanwhile, LPS can induce the degradation of the negative regulator IκBα, allowing for the translocation of p65/p50 into the nucleus, which in turn triggers a negative feedback loop by promoting the resynthesis of IκBα through NF-κB (65). Unlike NFKBIZ, which is significantly increased at post-induction 12 h and is “the late response gene”, NFKBIA is “the early response gene” (Figure 2E). The expression of NFKBIA significantly increased in staphylococci- and in the mammary gland parenchyma of E. coli-infected cow (18, 66) or in the bovine mammary epithelial cells (9). But the expression level of NFKBIA did not significantly alter in blood monocyte-derived macrophages infected with S. agalactiae (67), blood leukocytes infected with Staphylococcus aureus (68) and E. coli (69), circulating leukocytes with clinical or subclinical mastitis in the UK (25), and the Chinese Holstein mammary fibroblasts infected with S. aureus (70). Meanwhile, the expression level of CXCL8, CCL5, IL6, CXCL3, IL1A, NOD2, TNF, CCL2, IL17A, IL10, and CCL20 were significantly upregulated and showed a strong inflammatory response in these pathological tissues and cells, especially in monocyte-derived macrophages (67).
In conclusion, NFKBIA is the hub gene to regulate the expression of pro-inflammatory cytokines, chemokines, anti-apoptotic genes, anti-microbial genes, and inflammatory genes by controlling the NF-κB pathway to maintain a mild inflammatory response after infection in bovine mammary epithelial cells and mammary gland parenchyma (Figure 9B).
The Top-Expressed Differentially Expressed miRNAs
Among the 29 top expressed miRNAs (Figure 4), bta-miR-30a-5p is differentially upregulated at 4 h and 12 h; bta-miR-125b and bta-miR-100 are differentially downregulated at 4 and 8 h, respectively (Supplementary Tables 3, 4). Luoreng et al. (71) verified that bta-miR-125b targets and inhibits NKIRAS2 gene expression, decreased miR-125b in LPS-induced MAC-T cells leading to NKIRAS2 increase, then inhibits NF-κB activity, leading to a low expression of the inflammatory factors, IL6 and TNFα.
The TNFAIP3 protein (A20) has emerged as an important negative regulator of TLR and retinoic acid-inducible gene 1 (RIG-I) signaling, restricts and terminates the ubiquitination status of central components in NF-κB, IRF3, and apoptosis signaling cascades, resulting in the downregulation of interferon (IFN1/2) production during inflammatory response (72). This conclusion was in line with our results; the relatively low and decreased IFNβ1/2 (Figure 9A) may be regulated by significantly increased TNFAIP3 in LPS-induced bMECs (Figure 2E), to restrict and terminate inflammatory responses.
The MiR-30a was related to the stress response of Holstein cattle (73) and proved to target the 3′UTR of GRP78 to regulate the endoplasmic reticulum (ER) stress, then controlling the autophagy (74). Significantly upregulated miR-30a and downregulated GRP78 axis may control the ER stress response in LPS-challenged bMECs (Figure 6A). Overexpression of miR-100 inhibited matrix metalloproteinase-9 (MMP9) expression in H2O2-induced human umbilical vein endothelial cells, limited cell inflammation, oxidative stress, and cell apoptosis (75). However, significantly downregulated miR-100 and upregulated MMP9 (Figure 9A) will facilitate the activity of cell inflammation, oxidative stress, and cell apoptosis in LPS-induced bMECs.
The Milk Synthesis Ability of bMECs After LPS Induction
The mammary gland is a specialized organ providing nutrition for mammalian offspring and commences during embryogenesis with the formation of an epithelial thickening known as placode (76). Mammary epithelial cells are the main constituent cells of epithelial, which is the secretory part of the mammary gland. Mastitis directly impacts the production performance of MECs. In the present study, the mammary development specification of bMECs may get changed after LPS treatment due to significantly downregulated SOSTDC1, WNT7B, MSX1, and MSX2, which are involved in the mammary gland bud morphogenesis and mammary gland epithelium development (Figures 8A–C), which will affect the normal development of mammary epithelial cells and affect their lactation function.
Furthermore, upregulated chitinase 3 like protein 1 (CHI3L1) should play a critical role in the cytokine signaling in LPS-induced bMECs; the function was proved during E. coli-triggered inflammation of the mammary gland (77). Bta-miR-2425-5p was predicted to target the 3′UTR of CHI3L1 and significantly downregulated after LPS induction (Figure 6A). The Bta-miR-2425-5p can inhibit triglyceride synthesis by regulating ADAMTS1, which is involved in milk fat metabolism within the lactation system. The bta-miR-2425-5p is significantly downregulated in low-fat milk percentage bMECs (78). The expression level of ADAMTS1 has also dropped in this study (data not shown). Altogether, these results reflect the undermined synthesis ability of milk fat in LPS-induced bMECs.
Data Availability Statement
The datasets presented in this study can be found in online repositories. The names of the repository/repositories and accession number(s) can be found below: https://www.ncbi.nlm.nih.gov/, SRX6610779; https://www.ncbi.nlm.nih.gov/, SRX6610780; https://www.ncbi.nlm.nih.gov/, SRX6610781; https://www.ncbi.nlm.nih.gov/, SRX6610782; https://www.ncbi.nlm.nih.gov/, SRX6610783; https://www.ncbi.nlm.nih.gov/, SRX6610784; https://www.ncbi.nlm.nih.gov/, SRX6610785; https://www.ncbi.nlm.nih.gov/, SRX6610786.
Ethics Statement
Ethical review and approval was not required for the animal study because this study didn't use any animals.
Author Contributions
LC performed the experiments, analyzed the data, and prepared the draft of the manuscript. ZL and RT performed the experiments. XL contributed to the conception and design of the study. XL, HZ, and JW contributed to the manuscript revision. All authors read and approved the final manuscript.
Funding
We would like to thank the 13115 Sci-Tech Innovation Program of Shaanxi Province (No. 2015KTCL02-11), the High-level Talents Start-up Project Fund of Ankang University (2020AYQDZR09), and the Shaanxi Provincial Department of Education Project (20JK0477) for funding this research.
Conflict of Interest
The authors declare that the research was conducted in the absence of any commercial or financial relationships that could be construed as a potential conflict of interest.
Publisher's Note
All claims expressed in this article are solely those of the authors and do not necessarily represent those of their affiliated organizations, or those of the publisher, the editors and the reviewers. Any product that may be evaluated in this article, or claim that may be made by its manufacturer, is not guaranteed or endorsed by the publisher.
Supplementary Material
The Supplementary Material for this article can be found online at: https://www.frontiersin.org/articles/10.3389/fvets.2022.890043/full#supplementary-material
Supplementary Figure 1. The relative differential relationship of each gene between different timepoints, such as log2(12/0 h), log2(8/0 h), log2(4/0 h), log2(12/8 h), log2(12/4 h), log2(8/4 h),values. Dark green represents downregulation and red represents upregulation.
Supplementary Figure 2. The relative differential relationship of each miRNA between different timepoints, such as log2(12/0 h), log2(8/0 h), log2(4/0 h), log2(12/8 h), log2(12/4 h), and log2(8/4 h) values. Dark green represents downregulation and red represents upregulation.
Supplementary Table 1. The primers of mRNA and microRNA for QT-realtime PCR.
Supplementary Table 2. The differentially expressed genes (DEGs) in LPS-induced 4, 8, and 12 h bMECs. (A) DEGs in LPS-induced 4 h bMECs. (B) DEGs in LPS-induced 8 h bMECs. (C) DEGs in LPS-induced 12 h bMECs.
Supplementary Table 3. The expression level of miRNA in LPS-induced bMEC at 0, 4, 8, and 12 h.
Supplementary Table 4. The differentially expressed miRNAs (DEMs) in LPS-induced 4, 8, and 12 h bMECs. (A) DEMs in LPS-induced 4 h bMECs. (B) DEMs in LPS-induced 8 h bMECs. (C) DEMs in LPS-induced 12 h bMECs.
References
1. Derakhshani H, Fehr KB, Sepehri S, Francoz D, De Buck J, Barkema HW, et al. Invited review: microbiota of the bovine udder: contributing factors and potential implications for udder health and mastitis susceptibility. J Dairy Sci. (2018) 101:10605–25. doi: 10.3168/jds.2018-14860
2. Rainard P. Mammary microbiota of dairy ruminants: fact or fiction? Vet Res. (2017) 48:1–10. doi: 10.1186/s13567-017-0429-2
3. Fernandes JBC, Zanardo LG, Galvão NN, Carvalho IA, Nero LA, Moreira MAS. Escherichia coli from clinical mastitis: serotypes and virulence factors. J Vet Diagn Investig. (2011) 23:1146–52. doi: 10.1177/1040638711425581
4. Heimes A, Brodhagen J, Weikard R, Becker D, Meyerholz MM, Petzl W, et al. Cows selected for divergent mastitis susceptibility display a differential liver transcriptome profile after experimental Staphylococcus aureus mammary gland inoculation. J Dairy Sci. (2020) 103: 6364–73. doi: 10.3168/jds.2019-17612
5. Günther J, Koczan D, Yang W, Nürnberg G, Repsilber D, Schuberth HJ, et al. Assessment of the immune capacity of mammary epithelial cells: comparison with mammary tissue after challenge with Escherichia coli. Vet Res. (2009) 40:448–64. doi: 10.1051/vetres/2009014
6. Gondaira S, Higuchi H, Iwano H, Nishi K, Nebu T, Nakajima K, et al. Innate immune response of bovine mammary epithelial cells to Mycoplasma bovis. J Vet Sci. (2018) 19:79–87. doi: 10.4142/jvs.2018.19.1.79
7. Yang W, Zerbe H, Petzl W, Brunner RM, Günther J, Draing C, et al. Bovine TLR2 and TLR4 properly transduce signals from Staphylococcus aureus and E. coli, but S. aureus fails to both activate NF-κB in mammary epithelial cells and to quickly induce TNFα and interleukin-8 (CXCL8) expression in the udder. Mol. Immunol. (2008) 45:1385–97. doi: 10.1016/j.molimm.2007.09.004
8. Günther J, Esch K, Poschadel N, Petzl W, Zerbe H, Mitterhuemer S, et al. Comparative kinetics of Escherichia coli-and Staphylococcus aureus-specific activation of key immune pathways in mammary epithelial cells demonstrates that S. aureus elicits a delayed response dominated by interleukin-6 (IL-6) but not by IL-1A or tumor necrosis factor alpha. Infect Immun. (2011) 79:695–707. doi: 10.1128/IAI.01071-10
9. Gilbert FB, Cunha P, Jensen K, Glass EJ, Foucras G, Robert-Granié C, et al. Differential response of bovine mammary epithelial cells to Staphylococcus aureus or Escherichia coli agonists of the innate immune system. Vet Res. (2013) 44:1–23. doi: 10.1186/1297-9716-44-40
10. Günther J, Liu S, Esch K, Schuberth HJ, Seyfert HM. Stimulated expression of TNF-α and IL-8, but not of lingual antimicrobial peptide reflects the concentration of pathogens contacting bovine mammary epithelial cells. Vet Immunol Immunopathol. (2010) 135:152–7. doi: 10.1016/j.vetimm.2009.11.004
11. Beutler BA. TLRs and innate immunity. Blood. (2009) 113:1399–407. doi: 10.1182/blood-2008-07-019307
12. Fitzgerald KA, Rowe DC, Golenbock DT. Endotoxin recognition and signal transduction by the TLR4/MD2-complex. Microb Infect. (2004) 6:1361–7. doi: 10.1016/j.micinf.2004.08.015
13. Akira S, Hoshino K. Myeloid differentiation factor 88—dependent and—independent pathways in toll-like receptor signaling. J Infect Dis. (2003) 187 (Suppl. 2):S356–63. doi: 10.1086/374749
14. Günel A. Modelling the interactions between TLR4 and IFNβ pathways. J Theor Biol. (2012) 307:137–48. doi: 10.1016/j.jtbi.2012.04.026
15. Lawless N, Foroushani AB, McCabe MS, O'Farrelly C, Lynn DJ. Next generation sequencing reveals the expression of a unique miRNA profile in response to a gram-positive bacterial infection. PLoS ONE. (2013) 8:e57543. doi: 10.1371/journal.pone.0057543
16. Jin W, Ibeagha-Awemu EM, Liang G, Beaudoin F, Zhao X, Guan LL. Transcriptome microRNA profiling of bovine mammary epithelial cells challenged with Escherichia coli or Staphylococcus aureus bacteria reveals pathogen directed microRNA expression profiles. BMC Genom. (2014) 15:1–16. doi: 10.1186/1471-2164-15-181
17. Islam MA, Takagi M, Fukuyama K, Komatsu R, Albarracin L, Nochi T, et al. Transcriptome analysis of the inflammatory responses of bovine mammary epithelial cells: exploring immunomodulatory target genes for bovine mastitis. Pathogens. (2020) 9:200. doi: 10.3390/pathogens9030200
18. Kosciuczuk EM, Lisowski P, Jarczak J, Majewska A, Rzewuska M, Zwierzchowski L, et al. Transcriptome profiling of Staphylococci-infected cow mammary gland parenchyma. BMC Vet Res. (2017) 13:1–12. doi: 10.1186/s12917-017-1088-2
19. Luoreng ZM, Wang XP, Mei CG, Zan LS. Comparison of microRNA profiles between bovine mammary glands infected with Staphylococcus aureus and Escherichia coli. Int J Biol Sci. (2018) 14:87–99. doi: 10.7150/ijbs.22498
20. Wang X, Fan Y, He Y, Han Z, Gong Z, Peng Y, et al. Integrative analysis of miRNA and mRNA expression profiles in mammary glands of holstein cows artificially infected with Staphylococcus aureus. Pathogens. (2021) 10:506. doi: 10.3390/pathogens10050506
21. Lai YC, Lai YT, Rahman MM, Chen HW, Husna AA, Fujikawa T, et al. Bovine milk transcriptome analysis reveals microRNAs and RNU2 involved in mastitis. FEBS J. (2020) 287:1899–918. doi: 10.1111/febs.15114
22. Cai M, He H, Jia X, Chen S, Wang J, Shi Y, et al. Genome-wide microRNA profiling of bovine milk-derived exosomes infected with Staphylococcus aureus. Cell Stress Chaperones. (2018) 23:663–72. doi: 10.1007/s12192-018-0876-3
23. Li Z, Wang H, Chen L, Wang L, Liu X, Ru C, et al. Identification and characterization of novel and differentially expressed microRNAs in peripheral blood from healthy and mastitis Holstein cattle by deep sequencing. Anim Genet. (2014) 45:20–7. doi: 10.1111/age.12096
24. Luoreng ZM, Yang J, Wang XP, Wei DW, Zan LS. Expression profiling of microRNA from peripheral blood of dairy cows in response to Staphylococcus aureus-infected mastitis. Front Vet Sci. (2021) 8:691196. doi: 10.3389/fvets.2021.691196
25. Cheng Z, Buggiotti L, Salavati M, Marchitelli C, Palma-Vera S, Wylie A, et al. Global transcriptomic profiles of circulating leucocytes in early lactation cows with clinical or subclinical mastitis. Mol Biol Rep. (2021) 48:4611–23. doi: 10.1007/s11033-021-06494-8
26. Lawless N, Reinhardt TA, Bryan K, Baker M, Pesch B, Zimmerman D, et al. MicroRNA regulation of bovine monocyte inflammatory and metabolic networks in an in vivo infection model. G3 Genes Genomes Genet. (2014) 4:957–71. doi: 10.1534/g3.113.009936
27. Rainard P, Riollet C. Innate immunity of the bovine mammary gland. Vet Res. (2006) 37:369–400. doi: 10.1051/vetres:2006007
28. Rinaldi M, Li R, Capuco AV. Mastitis associated transcriptomic disruptions in cattle. Vet Immunol Immunopathol. (2010) 138:267–79. doi: 10.1016/j.vetimm.2010.10.005
29. Sharifi S, Pakdel A, Ebrahimi M, Reecy JM, Fazeli Farsani S, Ebrahimie E. Integration of machine learning and meta-analysis identifies the transcriptomic bio-signature of mastitis disease in cattle. PLoS ONE. (2018) 13:e0191227. doi: 10.1371/journal.pone.0191227
30. Turk R, Koledić M, Maćešić N, Benić M, Dobranić V, Duričić D, et al. The role of oxidative stress and inflammatory response in the pathogenesis of mastitis in dairy cows. Mljekarstvo: časopis za unaprjedenje proizvodnje i prerade mlijeka. (2017) 67:91–101. doi: 10.15567/mljekarstvo.2017.0201
31. Chen L, Liu X, Li Z, Wang H, Liu Y, He H, et al. Expression differences of miRNAs and genes on NF-kappaB pathway between the healthy and the mastitis Chinese Holstein cows. Gene. (2014) 545:117–25. doi: 10.1016/j.gene.2014.04.071
32. Lopez-Castejon G. Control of the inflammasome by the ubiquitin system. FEBS J. (2020) 287:11–26. doi: 10.1111/febs.15118
33. Platnich JM, Muruve DA. NOD-like receptors and inflammasomes: a review of their canonical and non-canonical signaling pathways. Arch Biochem Biophys. (2019) 670:4–14. doi: 10.1016/j.abb.2019.02.008
34. Närhi K, Tummers M, Ahtiainen L, Itoh N, Thesleff I, Mikkola ML. Sostdc1 defines the size and number of skin appendage placodes. Dev Biol. (2012) 364:149–61. doi: 10.1016/j.ydbio.2012.01.026
35. van de Grift YBC, Heijmans N, van Amerongen R. How to use online tools to generate new hypotheses for mammary gland biology research: a case study for Wnt7b. J Mammary Gland Biol Neoplasia. (2020) 25:319–35. doi: 10.1007/s10911-020-09474-z
36. Hens JR, Wysolmerski JJ. Key stages of mammary gland development: molecular mechanisms involved in the formation of the embryonic mammary gland. Breast Cancer Res. (2005) 7:1–5. doi: 10.1186/bcr1306
37. Biswas SK, Tergaonkar V. Myeloid differentiation factor 88-independent Toll-like receptor pathway: sustaining inflammation or promoting tolerance?. Int J Biochem Cell Biol. (2007) 39:1582–92. doi: 10.1016/j.biocel.2007.04.021
38. Lee PY, Li YI, Kumagai Y, Xu Y, Weinstein JS, Kellner ES, et al. Type I interferon modulates monocyte recruitment and maturation in chronic inflammation. Am J Pathol. (2009) 175:2023–33. doi: 10.2353/ajpath.2009.090328
39. Cai Z, Guldbrandtsen B, Lund MS, Sahana G. Prioritizing candidate genes post-GWAS using multiple sources of data for mastitis resistance in dairy cattle. BMC Genomics. (2018) 19:1. doi: 10.1186/s12864-018-5050-x
40. Khalafalla MG, Woods LT, Camden JM, Khan AA, Limesand KH, Petris MJ, et al. P2X7 receptor antagonism prevents IL-1β release from salivary epithelial cells and reduces inflammation in a mouse model of autoimmune exocrinopathy. J Biol Chem. (2017) 292:16626–37. doi: 10.1074/jbc.M117.790741
41. Han C, Jin J, Xu S, Liu H, Li N, Cao X. Integrin CD11b negatively regulates TLR-triggered inflammatory responses by activating Syk and promoting degradation of MyD88 and TRIF via Cbl-b. Nat Immunol. (2010) 11:734–42. doi: 10.1038/ni.1908
42. Wei ZJ, Liu J, Qin J. miR-138 suppressed the progression of osteoarthritis mainly through targeting p65. Eur Rev Med Pharmacol Sci. (2017) 21:2177–84.
43. Wang Y, Li H, Shi Y, Wang S, Xu Y, Li H, et al. miR-143-3p impacts on pulmonary inflammatory factors and cell apoptosis in mice with mycoplasmal pneumonia by regulating TLR4/MyD88/NF-κB pathway. Biosci Rep. (2020) 40:BSR20193419. doi: 10.1042/BSR20193419
44. Buitenhuis B, Røntved CM, Edwards SM, Ingvartsen KL, Sørensen P. In depth analysis of genes and pathways of the mammary gland involved in the pathogenesis of bovine Escherichia coli-mastitis. BMC Genomics. (2011) 12:130. doi: 10.1186/1471-2164-12-130
45. Cheng J, Zhang J, Han B, Barkema HW, Cobo ER, Kastelic JP, et al. Klebsiella pneumoniae isolated from bovine mastitis is cytopathogenic for bovine mammary epithelial cells. J Dairy Sci. (2020) 103:3493–504. doi: 10.3168/jds.2019-17458
46. Herry V, Gitton C, Tabouret G, Répérant M, Forge L, Tasca C, et al. Local immunization impacts the response of dairy cows to Escherichia coli mastitis. Sci Rep. (2017) 7:1–8. doi: 10.1038/s41598-017-03724-7
47. Conroy MJ, Lysaght J. CX3CL1 signalling in the tumor microenvironment. Tumor Microenviron. (2020) 1231:1–12. doi: 10.1007/978-3-030-36667-4_1
48. Li G, Zhang H, Ma H, Qu S, Xing Q, Wang G. MiR-221-5p is involved in the regulation of inflammatory responses in acute gouty arthritis by targeting IL-1β. Int J Rheum Dis. (2021) 24:335–40. doi: 10.1111/1756-185X.14028
49. Gu X, Yao X, Liu D. Up-regulation of microRNA-335-5p reduces inflammation via negative regulation of the TPX2-mediated AKT/GSK3β signaling pathway in a chronic rhinosinusitis mouse model. Cell Signal. (2020) 70:109596. doi: 10.1016/j.cellsig.2020.109596
50. He M, Wu N, Leong MC, Zhang W, Ye Z, Li R, et al. miR-145 improves metabolic inflammatory disease through multiple pathways. J Mol Cell Biol. (2020) 12:152–62. doi: 10.1093/jmcb/mjz015
51. Zhang R, Qin L, Shi J. MicroRNA-199a-3p suppresses high glucose-induced apoptosis and inflammation by regulating the IKKβ/NF-κB signaling pathway in renal tubular epithelial cells. Int J Mol Med. (2020) 46:2161–71. doi: 10.3892/ijmm.2020.4751
52. Zhou HJ, Wang LQ, Xu QS, Fan ZX, Zhu Y, Jiang H, et al. Downregulation of miR-199b promotes the acute spinal cord injury through IKKβ-NF-κB signaling pathway activating microglial cells. Exp Cell Res. (2016) 349:60–7. doi: 10.1016/j.yexcr.2016.09.020
53. Lu X, Yu Y, Tan S. The role of the miR-21-5p-mediated inflammatory pathway in ulcerative colitis. Exp Ther Med. (2020) 19:981–9. doi: 10.3892/etm.2019.8277
54. Liu Y, Xia H, Xia G, Lin S, Guo L, Liu Y. The effect of an isoquinoline alkaloid on treatment of periodontitis by regulating the neutrophils chemotaxis. J Leukoc Biol. (2021) 110:475–84. doi: 10.1002/JLB.3MA0321-736R
55. Xie B, Lu C, Chen C, Zhou J, Deng Z. miR-135a alleviates silica-induced pulmonary fibrosis by targeting NF-κB/Inflammatory signaling pathway. Mediators Inflamm. (2020) 2020:1231243. doi: 10.1155/2020/1231243
56. Li B, Huang Z, Meng J, Yu W, Yang H. MiR-202-5p attenuates neurological deficits and neuronal injury in MCAO model rats and OGD-induced injury in Neuro-2a cells by targeting eIF4E-mediated induction of autophagy and inhibition of Akt/GSK-3β pathway. Mol Cell Probes. (2020) 51:101497. doi: 10.1016/j.mcp.2019.101497
57. Sui C, Zhang L, Hu Y. MicroRNA-let-7a inhibition inhibits LPS-induced inflammatory injury of chondrocytes by targeting IL6R. Mol Med Rep. (2019) 20:2633–40. doi: 10.3892/mmr.2019.10493
58. Kondreddy V, Wang J, Keshava S, Esmon CT, Rao LVM, Pendurthi UR. Factor VIIa induces anti-inflammatory signaling via EPCR and PAR1. Blood. (2018) 131:2379–92. doi: 10.1182/blood-2017-10-813527
59. Yan D, Kc R, Chen D, Xiao G, Im HJ. Bovine lactoferricin-induced anti-inflammation is, in part, via up-regulation of interleukin-11 by secondary activation of STAT3 in human articular cartilage. J Biol Chem. (2013) 288:31655–69. doi: 10.1074/jbc.M112.440420
60. Liang J, Nagahashi M, Kim EY, Harikumar KB, Yamada A, Huang WC, Sphingosine-1-phosphate links persistent STAT3 activation chronic intestinal inflammation and and development of colitis-associated cancer. Cancer Cell. (2013) 23:107–20. doi: 10.1016/j.ccr.2012.11.013
61. Wu G, McBride DW, Zhang JH. Axl activation attenuates neuroinflammation by inhibiting the TLR/TRAF/NF-κB pathway after MCAO in rats. Neurobiol Dis. (2018) 110:59–67. doi: 10.1016/j.nbd.2017.11.009
62. Mazrouei S, Ziaei A, Tanhaee AP, Keyhanian K, Esmaeili M, Baradaran A. Apoptosis inhibition or inflammation: the role of NAIP protein expression in Hodgkin and non-Hodgkin lymphomas compared to non-neoplastic lymph node. J Inflamm. (2012) 9:1–9. doi: 10.1186/1476-9255-9-4
63. Ramanan D, San Tang M, Bowcutt R, Cadwell K. Bacterial sensor Nod2 prevents inflammation of the small intestine by restricting the expansion of the commensal Bacteroides vulgatus. Immunity. (2014) 41:311–24. doi: 10.1016/j.immuni.2014.06.015
64. Dougan M, Dranoff G, Dougan SK. GM-CSF, IL-3, and IL-5 family of cytokines: regulators of inflammation. Immunity. (2019) 50:796–811. doi: 10.1016/j.immuni.2019.03.022
65. Vallabhapurapu S, Karin M. Regulation and function of NF-κB transcription factors in the immune system. Annu Rev Immunol. (2009) 27:693–733. doi: 10.1146/annurev.immunol.021908.132641
66. Mitterhuemer S, Petzl W, Krebs S, Mehne D, Klanner A, Wolf E, et al. Escherichia coli infection induces distinct local and systemic transcriptome responses in the mammary gland. BMC Genomics. (2010) 11:138. doi: 10.1186/1471-2164-11-138
67. Lewandowska-Sabat AM, Kirsanova E, Klopp C, Solberg TR, Heringstad B, Østerås O, et al. Transcription profiling of monocyte-derived macrophages infected in vitro with two strains of Streptococcus agalactiae reveals candidate pathways affecting subclinical mastitis in cattle. Front Genet. (2019) 10:689. doi: 10.3389/fgene.2019.00689
68. Wang D, Liu L, Augustino SMA, Duan T, Hall TJ, MacHugh DE, et al. Identification of novel molecular markers of mastitis caused by Staphylococcus aureus using gene expression profiling in two consecutive generations of Chinese Holstein dairy cattle. J Anim Sci Biotechnol. (2020) 11:1–17. doi: 10.1186/s40104-020-00494-7
69. Ju Z, Jiang Q, Wang J, Wang X, Yang C, Sun Y, et al. Genome-wide methylation and transcriptome of blood neutrophils reveal the roles of DNA methylation in affecting transcription of protein-coding genes and miRNAs in E. coli-infected mastitis cows. BMC Genomics. (2020) 21:1–14. doi: 10.1186/s12864-020-6526-z
70. Miao Z, Ding Y, Zhao N, Chen X, Cheng H, Wang J, et al. Transcriptome sequencing reveals fibrotic associated-genes involved in bovine mammary fibroblasts with Staphylococcus aureus. Int J Biochem Cell Biol. (2020) 121:105696. doi: 10.1016/j.biocel.2020.105696
71. Luoreng ZM, Wei DW, Wang XP. MiR-125b regulates inflammation in bovine mammary epithelial cells by targeting the NKIRAS2 gene. Vet Res. (2021) 52:1–10. doi: 10.1186/s13567-021-00999-7
72. Arguello M, Paz S, Ferran C, Moll HP, Hiscott J. Anti-viral tetris: modulation of the innate anti-viral immune response by A20. Adv Exp Med Biol. (2014) 809:49–64. doi: 10.1007/978-1-4939-0398-6_4
73. Zheng Y, Chen K, Zheng X, Li HX, Wang GL. Identification and bioinformatics analysis of microRNAs associated with stress and immune response in serum of heat-stressed and normal Holstein cows. Cell Stress Chaperones. (2014) 19:973–81. doi: 10.1007/s12192-014-0521-8
74. Shi Q, Jin X, Fan R, Xing M, Guo J, Zhang Z, et al. Cadmium-mediated miR-30a-GRP78 leads to JNK-dependent autophagy in chicken kidney. Chemosphere. (2019) 215:710–5. doi: 10.1016/j.chemosphere.2018.10.019
75. Wang C, Zhang Y, Jiang Z, Bai H, Du Z. miR-100 alleviates the inflammatory damage and apoptosis of H2O2-induced human umbilical vein endothelial cells via inactivation of Notch signaling by targeting MMP9. Vascular. (2022) 30:151–61. doi: 10.1177/1708538121989854
76. Trela E. Molecular and Cellular Basis of Early Development of the Mammary Gland (Helsinki: Helsingin yliopisto) (2021).
77. Breyne K, Steenbrugge J, Demeyere K, Lee CG, Elias JA, Petzl W, et al. Immunomodulation of host chitinase 3-like 1 during a mammary pathogenic Escherichia coli infection. Front Immunol. (2018) 9:1143. doi: 10.3389/fimmu.2018.01143
Keywords: LPS, bMEC, mastitis, mRNA profile, miRNA profile, self-protection
Citation: Chen L, Liu X, Li Z, Wang J, Tian R and Zhang H (2022) Integrated Analysis of Transcriptome mRNA and miRNA Profiles Reveals Self-Protective Mechanism of Bovine MECs Induced by LPS. Front. Vet. Sci. 9:890043. doi: 10.3389/fvets.2022.890043
Received: 05 March 2022; Accepted: 04 May 2022;
Published: 23 June 2022.
Edited by:
Massimo Amadori, Italian Network of Veterinary Immunology, ItalyReviewed by:
Pascal Rainard, Institut National de la Recherche Agronomique (INRA), FranceHuimin Zhang, Yangzhou University, China
Copyright © 2022 Chen, Liu, Li, Wang, Tian and Zhang. This is an open-access article distributed under the terms of the Creative Commons Attribution License (CC BY). The use, distribution or reproduction in other forums is permitted, provided the original author(s) and the copyright owner(s) are credited and that the original publication in this journal is cited, in accordance with accepted academic practice. No use, distribution or reproduction is permitted which does not comply with these terms.
*Correspondence: Xiaolin Liu, bGl1eGlhb2xpbkBud3N1YWYuZWR1LmNu