 Tom Menaker
 Joke Monteny2
 Anna Zamansky
- 1Information Systems Department, University of Haifa, Haifa, Israel
- 2Department of Biotechnology, Vives University College, Ghent, Belgium
Traditional methods of data analysis in animal behavior research are usually based on measuring behavior by manually coding a set of chosen behavioral parameters, which is naturally prone to human bias and error, and is also a tedious labor-intensive task. Machine learning techniques are increasingly applied to support researchers in this field, mostly in a supervised manner: for tracking animals, detecting land marks or recognizing actions. Unsupervised methods are increasingly used, but are under-explored in the context of behavior studies and applied contexts such as behavioral testing of dogs. This study explores the potential of unsupervised approaches such as clustering for the automated discovery of patterns in data which have potential behavioral meaning. We aim to demonstrate that such patterns can be useful at exploratory stages of data analysis before forming specific hypotheses. To this end, we propose a concrete method for grouping video trials of behavioral testing of animal individuals into clusters using a set of potentially relevant features. Using an example of protocol for testing in a “Stranger Test”, we compare the discovered clusters against the C-BARQ owner-based questionnaire, which is commonly used for dog behavioral trait assessment, showing that our method separated well between dogs with higher C-BARQ scores for stranger fear, and those with lower scores. This demonstrates potential use of such clustering approach for exploration prior to hypothesis forming and testing in behavioral research.
1. Introduction
Measuring behavior is key to behavioral testing, as well as many other behavior-related research methods in ecology, neuroscience, veterinary science, psychology, and many more. Traditionally, it is done through direct observation, and involves carefully designed steps: choosing the behavioral categories to observe, defining them in precise terms (usually they can have types of either event or state), deciding on the type of measurement, sampling method, etc. The seminal book “Measuring Behavior: an Introductory Guide” by Martin and Bateson (1) provides an excellent introduction to this topic.
However, it has long been acknowledged that relying on human observation imposes severe limitations on behavioral data acquisition and analysis. As highlighted by Anderson and Perona (2), it is first of all a laborious and tedious task, limiting the volumes of processed data, as well as the number of analyzed behaviors or behavioral variables. But even more importantly, human analysis of behavior is prone to subjectivity. It strongly depends on human perceptual abilities, leaving lots of room for human error and making efficient tacit knowledge transfer in training. Moreover, human understanding and interpretation of behavior is in itself subjective and sometimes inconsistent.
The need for promoting objective and quantifiable assessment and measurement of behavior [cf. (3–5)] pushes forward the emerging field of computational animal behavior analysis (2, 6), in which a variety of machine learning (ML) techniques are employed for animal behavior analysis. The release of the deep learning framework DeepLabCut (7) has unleashed the potential of video-based motion tracking and pose recognition in many animal species. Additional tools such as EZtrack (8), LEAP (9), DeepPoseKit (10), idtracker.ai (11) provide more light-weight options, large group tracking and more features.
Yet even our AI-supported abilities to analyze animal behavior remain inherently human-biased in a number of aspects. First of all, most of the tools mentioned above are based on supervised learning approaches, meaning that they learn from data annotated by human experts. But humans also choose the behavioral parameters for AI to recognize, usually based on some a-priori hypotheses. As highlighted by Forkosh (12), “We can now track the position of every fly's leg or immerse a tiny fish inside a virtual world by monitoring its gaze in real time. Yet capturing animals' posture or gaze is not like understanding their behavior. Instead, behaviors are still often interpreted by human observers in an anthropomorphic manner. Even newer tools that automatically classify behaviors rely on human observers for the choice of behaviors”. Forkosh suggests focusing on animal personality as a roadmap to human-free interpretation of behavior, as personality is linked to behavior and can be quantified objectively.
Hsu and Yttri (13) refer to methods in which pre-established (by humans) criteria are applied to behavioral data as “top-down”, reiterating the problematic aspects of supervised machine learning classifiers are trained to replicate their user's annotations. They suggest unsupervised learning algorithms as an alternative route to overcoming this gap. Such methods allow for searching hidden patterns in data without making a-priori hypotheses or deciding on specific parameters to measure. One of the most important unsupervised learning problems is clustering (14, 15), which aims to find structure in a collection of unlabeled data by extracting useful features. Clustering means in a sense organizing objects into groups, the members of which share some similarity, and discovering the characteristics of this similarity. A cluster is therefore a collection of objects which are “similar” between them, and are “dissimilar” to the objects in other clusters.
A paradigm shift toward less supervised and more “human-free” automated analysis methods can recently be observed in many animal-related fields. In neuroscience, for instance a new generation of tools such as MotionMapper (16) and MoSeq (17) allow for “human-free” discovery of behaviors through clustering sophisticated motion representations and have been applied in neuroscience for the study of behaviors of mice (17), zebrafish (18), fruit flies (16), and more. A similar shift can be observed in ecology, where unsupervised approaches are applied to analyze animal movement trajectories (19–21).
While more attention is turned toward unsupervised approaches in neuroscience and ecology, this topic remains under-explored in the context of dog behavior, and specifically—behavioral testing. As a consequence of their living close to humans as pets, working or sheltered animals, dogs exhibit immense behavioral variability, stemming from their innate capacities as well as from environmental influence (22). Therefore, methods of canine behavioral testing are popular in research and practice. They are extensively used in cognitive science, veterinary science, working dog organizations, shelters for various purposes such as selection for breeding (23), learning abilities (24), prediction of suitability for work (25), adoptability in shelters (26), animal models for human diseases (27), welfare (28), and many more.
Machine learning approaches are only beginning to be applied in the context of canine behavioral testing. As such testing usually involves dogs freely moving in a room or outside, in naturalistic settings. Automating those approaches present additional challenge as they have mainly been applied in a “top-down” manner, i.e., for supporting manual coding and checking specific hypotheses. For instance in (29), automated analysis was used to support behavioral testing analysis in a multi-method study on canine attachment to care-giver. In (30), supervised machine learning methods were used to classify hyperactive behavior of dogs visiting a veterinary clinic.
To the best of our knowledge, the route of unsupervised learning in the context of behavioral testing has not yet been explored. Yet, similarly to the advantages discussed above, it has potential to reduce human bias and allow the exploration of a huge space of patterns without making a-priori hypotheses about the data. In contrast to traditional methods of data analysis in animal behavior research, where a hypothesis is made to identify parameters for coding, using unsupervised exploration one can discover many new options and combinations.
This study aims to explore this idea, providing a concrete framework for its implementation in the context of behavioral testing. Due to the exploratory nature of this research, we apply clustering techniques to movement trajectories, which present a simplified representation of the dog behavior during testing. These trajectories can be obtained by automated tracking, therefore providing a completely automated pipeline. We evaluate our approach on a case study of “stranger test” behavioral testing, aimed to detect aggression and fear toward strangers. We demonstrate that our approach is able to identify clusters of dogs which are aggressive and fearful toward a stranger and those who are less so, providing concrete characterization of these groups in terms of objective features related to their movement. However, these results can only be viewed as preliminary work in progress due to the small amount of samples that were available to us in this dataset, and future extension of the validation to larger datasets is needed.
The rest of this article is structured as follows. Section 2 presents our case study, which will be also used as a running example for demonstrating the different aspects of our approach: a dataset of 30 dogs, tested in a “stranger test” protocol aiming to test aggression and fear toward strangers. In Section 3, we describe the proposed clustering method and its implementation, using the “stranger test” case study as a running example. Finally, Section 4 summarizes and discusses some directions for future research.
2. The “Stranger Test” Case Study
Behavioral traits in animals are consistent patterns of behaviors exhibited in similar situations (31, 32). They are believed to be driven by personality (33), which is a combination of genetic, cognitive, and environmental factors (34). Assessment of personality traits in dogs is increasingly investigated due to its many practical applications in applied behavior. Some examples are determining suitability of working dogs [see, e.g., (23, 35–37)], identifying problematic behaviors (38, 39), adoption-related issues for shelter dogs (32). Jones and Gosling (40) provide a comprehensive review of past research into temperament and personality traits of dogs.
Questionnaires and rating scales are the most common way for assessing behavioral traits in dogs. The Canine Behavioral Assessment and Research Questionnaire (C-BARQ) is one of the most commonly used canine behavioral questionnaires (41, 42). However, this and other owner-administered questionnaires are very costly in terms of time both for filling and processing efforts.
The “stranger test”, developed by Joke Monteny, who also performed data collection at VIVES, Belgium, is a simple protocol aimed to test stranger-directed behavior of dogs in a simple, standardized setting. We present a short overview, while the full details of the protocol are out of scope of the current study. The test was conducted indoors, in a fenced arena, with the stranger sitting in the center in a marked, fixed location, with a GoPro video camera fixed on the ceiling, covering the whole test area.
The testing phase lasts 40 s, with the dog unleashed in the arena, and the initial contact between the dog and an unfamiliar person is recorded. No actions of the test person are performed straightly toward the dog.
Our initial dataset consists of 30 trials. The dog participants were recruited via social media in Belgium. The inclusion criteria were: between 1 and 2 years old, and properly vaccinated and no known health issues. The participants' owners were requested to fill a Dutch version (43) of the C-BARQ questionnaire. The questionnaire identifies the following factors, which will be used in our study: (1) Stranger directed aggression (SDA), (2) Owner directed aggression (ODA), (3) Stranger directed fear (SDF), (4) Non social fear (NSF), (5) Separation related behavior (SRB), (6) Attachment seeking behavior (ASB), (7) Excitability (EXC), and (8) Pain sensitivity (PS).
3. The Clustering Method
The suggested method takes as input a set of video recordings, representing behavioral testing trials of different animal individuals. Based on the testing protocol, a set of potentially relevant features are decided upon by domain experts. To make the discovery of patterns fully automatic, we assume the features can be automatically extracted from the video (we demonstrate a concrete way of doing so below). However, also manual coding could be appropriate in this context.
The method is an implementation of a commonly used data analysis pipeline based on unsupervised clustering techniques from Data Science. To build the bridge from Animal Behavior research methods to Data Science research methods, we make the observation that behavioral parameters, (manually or automatically) coded in behavioral studies, can be thought of as machine learning features which can be used for clustering. This shift is not only related to terminology, but is deeply rooted in different research methods in the two disciplines. While behavioral parameters are a small set, carefully chosen by human experts, usually serving to prove or refute a certain hypothesis (1), unsupervised approaches in Data Science do not assume a fixed hypothesis and do not require a-priori choice of features—there are numerous ways for automatic feature selection, some of which we employ in our approach.
Figure 1 presents a high level overview of the pipeline, taking as input a set of video trials, and potentially relevant behavioral parameters which can be turned into features for clustering. Examples of such parameters are, e.g., trajectory length or time until a certain event in the trial. The output of the pipeline is the identification of “similarly behaving” individuals, together with a pattern: e.g., animals in cluster 1 have higher speed of movement and shorter trajectories. Such patterns can then be linked to behaviorally meaningful insights in the context of the specific protocol.
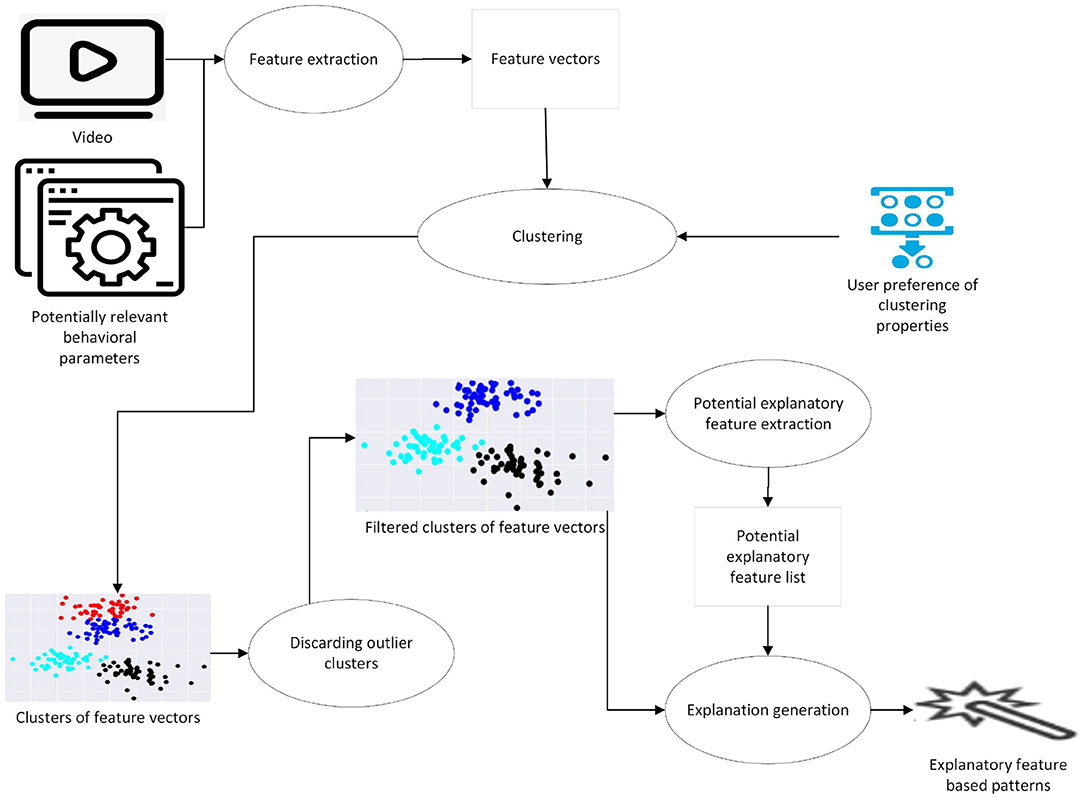
Figure 1. A high level overview of the general approach.
Next we describe the pipeline stages and how they are implemented in more details.
3.1. Feature Extraction
Building a bridge from the notion of behavioral parameters in Animal Behavior to features in Data Science, we ask: what makes a behavioral parameter a good feature? Since our main goal is to automatically produce insights into patterns found in the data, what makes a behavioral parameter a good feature is measurability: e.g., the availability of a method for accurately measuring the feature values for each video is important. In our case study, all of the chosen features were derived from movement trajectories, that were automatically tracked using the BLYZER tool (29, 44–46). The tool gets as input videos of trials, automatically identifies dog in a frame, and produces its movement trajectory, in the form of time series data saved in a machine-readable data (JSON format). It also has a module for computation of features from a library of available features, (such as average speed of the object, average distance between two objects, etc.). Figure 2 shows the automated detection of objects dog and stranger, and the visualized trajectory traveled by the dog in the trial.
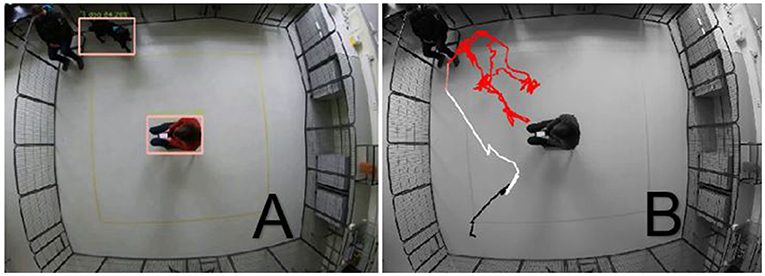
Figure 2. (A) detection; (B) trajectory extraction.
For the purposes of our cases study, we extended this module with features identified as potentially relevant for the “Stranger Test” protocol, as shown on Table 1.
Remarks:
1. Start point S is the location of the dog at the beginning of the trial; approach point A is the location of the earliest point found in proximity (below a chosen threshold) to stranger; end point F is the location at the end of the trial.
2. Intensity of use is an animal movement metric used in (47). We decided to include this feature due to its usefulness in (30) in the context of dog behavior analysis.
3. Stranger proximity is defined as being found within a certain threshold from a circle surrounding the stranger.
Figure 3 presents some descriptive statistics of the considered features.
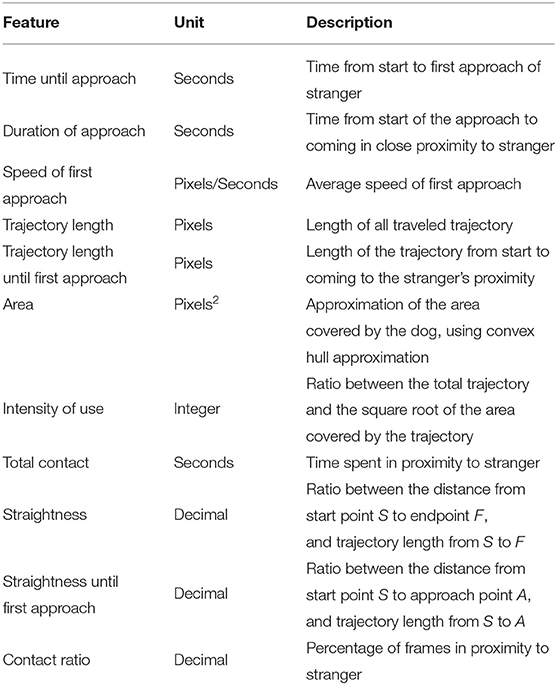
Table 1. Features for stranger test.
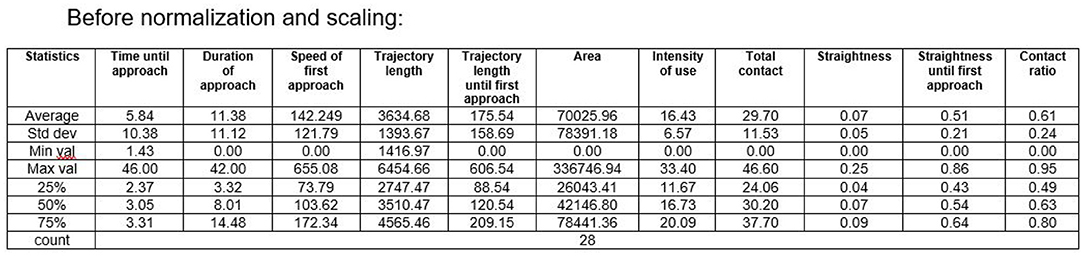
Figure 3. Descriptive statistics (before normalization and scaling).
3.2. Clustering
We use one of the most commonly used clustering algorithms, k-means (48) with the usual Euclidean distance. However, applying clustering as is will result in clusters which will not be characterizable in terms of the chosen features due to the high dimensionality. To reduce the number of dimensions (see (49, 50) on common ways to deal with the curse of dimensionality), we use PCA analysis (51). PCA analysis produces linear combinations of the original variables as a set of x/y axes, also known as principal components, or PCs. Thus, after a PCA model is created, we have a set of PCs that serve as a mean to reduce the dimensionality of the original variables. In our implementation, we start first by generating all possible scenarios of dimensionality reduction using PCA. Thus, Each scenario includes a particular case of dimensionality reduction using PCA. This follows by the training of a k-means model with a discovered optimal k on the created PC's, i.e., for each PC we perform clustering with its optimal k (52). More specifically, we run each scenario described above and produce as an outcome a table with the results of the different scenarios, the table contains the following information per each scenario denoted in different rows per each scenario:
1 Amount of PC'S—the amount of PC's used for training the k-means model
2 Silhouette score—the silhouette score (53) of the trained k-means model
3 Number of clusters generated, i.e., the chosen k for the k-means model optimized by the elbow method (52)
Although we did not put any limits on the number of clusters, only scenarios where an optimal k could be found using the elbow method are included in the final list of possible clustering scenarios. Moreover, at this stage, clusters smaller than a pre-defined threshold are discarded as outliers.
3.2.1. Clustering “Stranger Test” Trials
Preprocessing. The cut videos were pre-processed to validate the videos encoding, aspect ratio (width × height) and frames-per-second (FPS). Each video was re-encoded, using FFmpeg81, with ending result of MP4 encoding, aspect ratio of 1280 × 960 and 30 FPS, respectively. Additionally, to remove noise and increase the detection rate across the video frames, post-processing operations supported by the BLYZER platform (such as smoothing and extrapolation) were applied to each video. We then used BLYZER to track the dogs movement from the videos and save their trajectory data. In the final dataset we included only trials which satisfied the following criteria: (a) The dog was identified by BLYZER with average certainty threshold above 70% across all the video frames. (b) The dog had full C-BARQ data. After this stage, 2 participants were filtered and we were left with 28 videos. Feature vectors from the pre-selected features shown on Table 1 were created for each video. They were then normalized and scaled with the standard sklearn python libraries (54).
Clustering. Table 2 presents the generated cluster scenario list. We only chose the first scenario for further analysis due to the maximal silhouette score, indicating a good separation between clusters, and a low number of clusters: after filtering, only two clusters were left. We present in the appendix a more in-depth analysis of the scenarios, showing plot and matrix representations of the data projections along the PCs.

Table 2. Generated clustering scenarios list.
Pattern Discovery. In the chosen scenario, 2 clusters remained after filtering: C0 of size 14, and C3 of size 7.
The next stage is generating a list of potential explanatory features, i.e., includes all features that have a high (above certain threshold; we chose it as the median importance across all the features used in the PCA model) importance in the created PCs. We choose only the features that have importance above the median for at least one of the PC's in the model.
The features from the list that “explain” one or more of the clusters produce explanations (patterns) in the way formalized below. To provide intuition, for instance, in our example the explanations look as follows:
• Cluster 0 - High intensity of use, High total contact, High duration of approach and High contact ratio
• Cluster 3 - Low intensity of use, Low total contact, Low duration of approach and Low contact ratio
Figure 4 shows the distribution of the feature values among the two clusters of scenario 1, showing a good separation in terms of the four selected features. Figures 5, 6 demonstrate the clusters' distribution along two chosen explanatory features for scenarios 1 and 2, respectively.
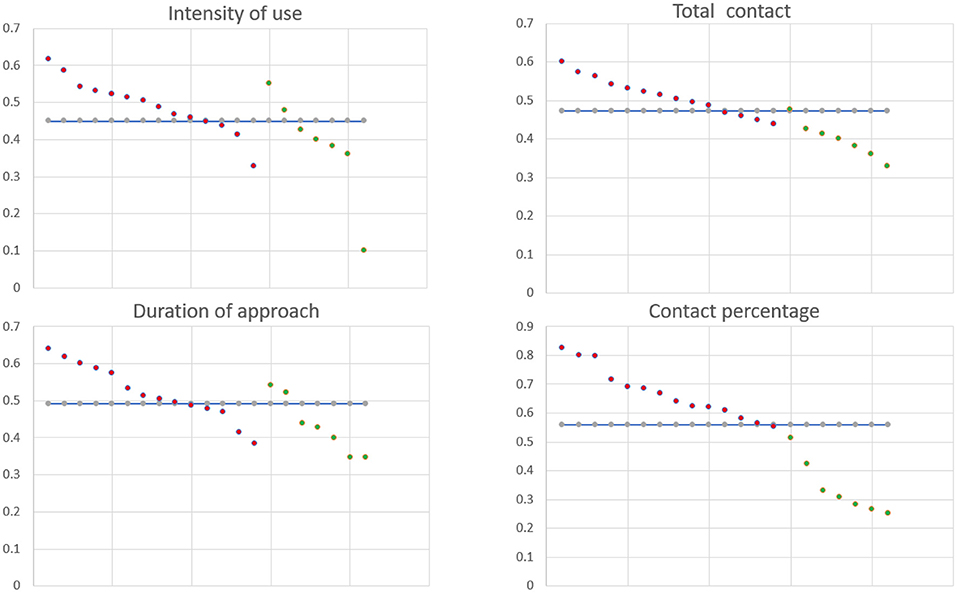
Figure 4. Patterns of Scenario 1: Cluster 0 red dots, Cluster 3 green dots.
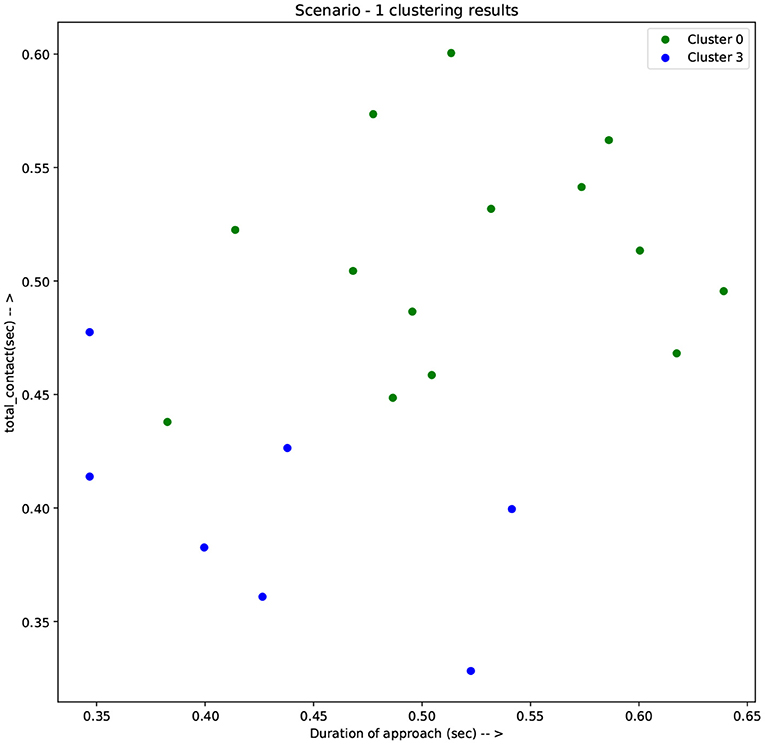
Figure 5. Results of clustering scenario 1 along the axes of total contact and duration of approach.
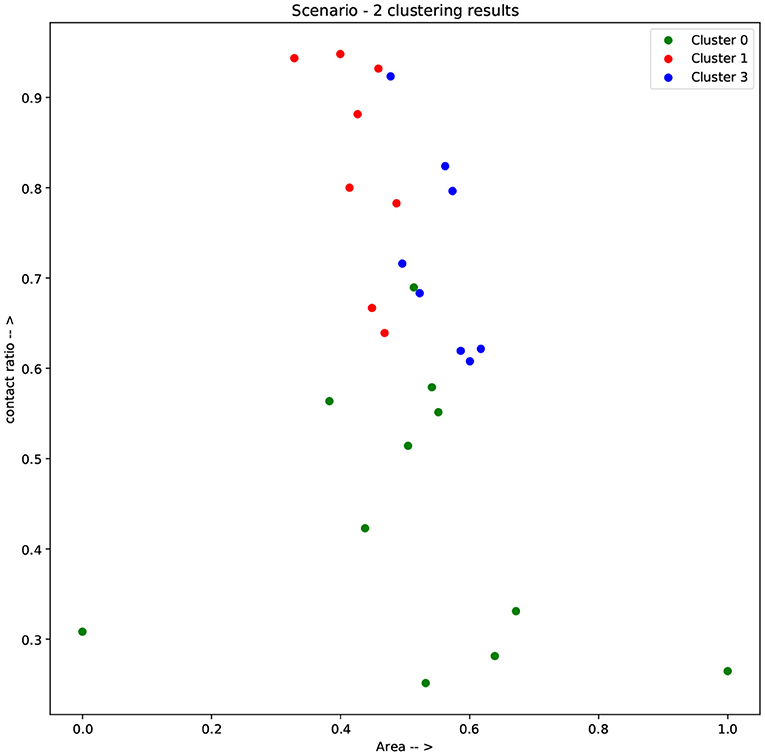
Figure 6. Results of clustering scenario 2 along the axes of contact ratio and area.
Formalization of explanatory features.
The output of our approach is a list of clustering scenarios, i.e., suggested divisions of the samples into clusters (some samples may be discarded due to belonging to outlier clusters), together with (whenever possible) a characterization of the clusters in terms of explanatory features, which we define next. Intuitively, explanatory features provide an intuition for what is different in each identified cluster.
Definition 1. (cluster) Let V be a set of video samples, representing behavioral testing trials, F = {f1, …, fk} a set of features. A cluster is a subset of the set of feature vectors.
Notation: For a feature f∈F and a cluster C, we denote by mean(f)C the mean value of f in C. For a set of clusters C, we denote by mean(f)C the mean value of f across C∈C.
Definition 2. (cluster separation by features and explanatory features) Let C = {C1, …, Cn} be a set of clusters over the set of feature vectors F(V). Let C∈C.
• Let H(f) be the number of samples c∈C, such that cf≥mean(f)C, and L(f) the number of samples c∈C, such that cf<mean(f)C.
• We say that f ↑-explains C if H(f)>L(f), and f ↓-explains C if L(f)>H(f). We denote by Exp(f) H(f) in the former case, and L(f) in the latter.
• We say that f is ↑-explanatory for C if f ↑-explains C and ↓-explains C′ for every C≠C′∈C.
• We say that f is ↓-explanatory for C if f ↓-explains C and ↑-explains C′ for every C≠C′∈C.
• f is explanatory for C if it is either ↑-explanatory or ↓-explanatory for it.
Intuitively, if a feature f is explanatory for a cluster C, the majority of members of C have values either higher than the rest of the clusters, or lower than the rest; thus f lends itself to provide a justification (or “explanation”) for C being chosen as a separate cluster from the rest.
Comparison of patterns to C-BARQ. We have considered a clustering scenario, in which well-separated clusters were found and characterized in terms of features related to objective parameters such as time until approach, trajectory length, etc. The most crucial question, however, is what behavioral meaning these clusters have, if at all. Finding an answer is highly protocol-specific, a general recipe clearly does not exist. In our case, however, we can use the C-BARQ questionnaire data for better understanding the nature of the clusters and linking them to such behavioral characteristics as fear of stranger, using the SDF and SDA factors of the C-BARQ.
The differences among clusters were not found significant (Mann Whitney U test). This could be explained by small sample sizes. However, Figure 7 presents the descriptive statistics for the different C-BARQ factors for scenario 1 (clusters C0 and C3), from which it is evident that C0 contains dogs scoring more in SDF (stranger directed fear), SDA (stranger directed aggression), and PS (pain sensitivity) than cluster C3. While the first two factors are clearly related to stranger-related behaviors, pain sensitivity relates to fearful responses to potentially painful procedures (e.g., during veterinary examination), and is also potentially related to fearfulness. Figures 7–10 further demonstrate the differences in SDF, SDA and PS for scenario 1, the largest one being SDF. This confirms that our method separated well between dogs with higher SDF, and lower ones in terms of objective features: less dogs fearful to strangers had lower values of intensity of use, total contact, duration of approach and contact percentage. Thus, these features are potentially interesting for forming and testing further hypotheses.
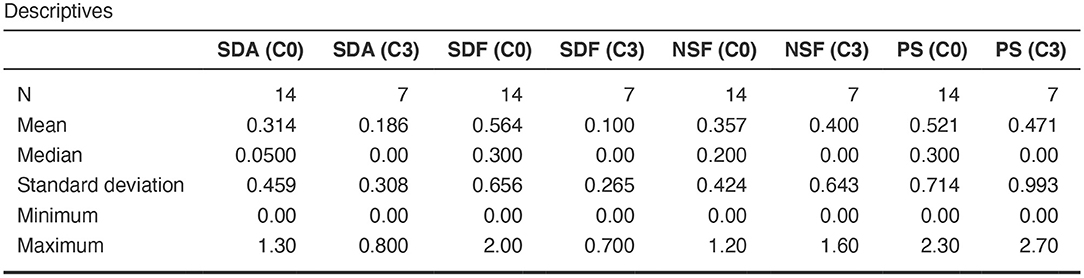
Figure 7. C-BARQ factors descriptive statistics for scenario 1.
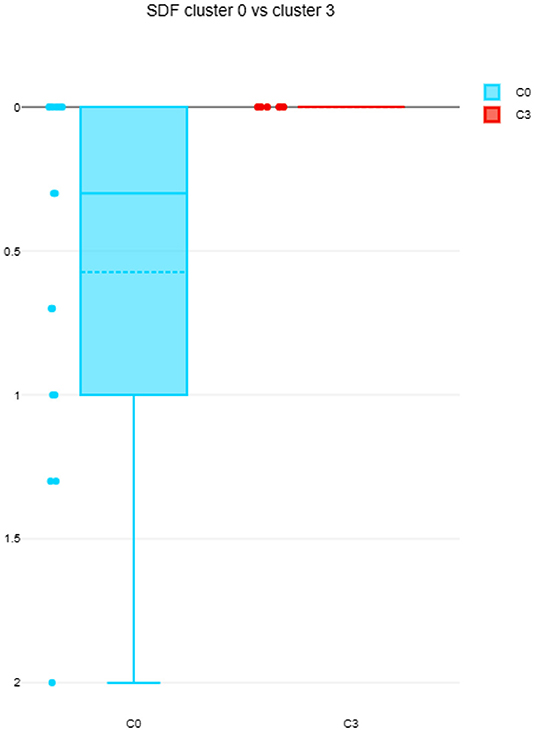
Figure 8. SDF comparison between C0 and C3 (scenario 1), dotted line is the median, solid line in the box is the mean.
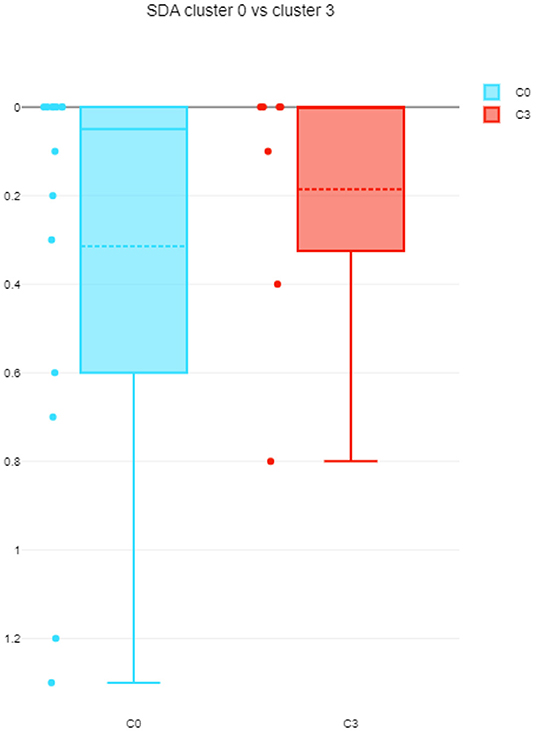
Figure 9. SDA comparison between C0 and C3 (scenario 1), dotted line is the median, solid line in the box is the mean.
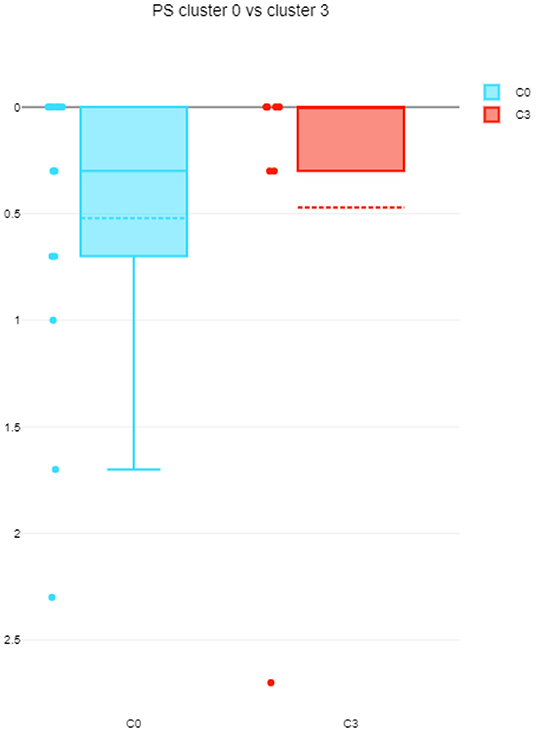
Figure 10. PS comparison between C0 and C3 (scenario 1), dotted line is the median, solid line in the box is the mean.
4. Summary and Future Research
In this study we investigated the potential of unsupervised clustering techniques for discovering and explaining patterns in behavioral testing data obtained by analyzing animal trajectories. We have suggested a general approach which can be fully automatized (except for the choice of meaningful features that should be done by domain experts). Based on this framework, we implemented a method using k-means clustering algorithm, which provided a list of potentially relevant features: (1) finds “good” clustering scenarios based on commonly used metrics, and (2) generates “explanations” (characterizations) of these clusters based on these features. We evaluated the usefulness of our framework in a case study of 30 dogs tested in a “stranger test” for discovering aggression and fear toward stranger. The resulting clustering scenario discovered two clusters which were characterized by high/low intensity of use, total contact time and duration of approach. We compared the clusters against the C-BARQ owner-filled questionnaire which is a standard way for measuring stranger-directed aggression and fear, concluding that the two clusters were characterized by high/low scores on several factors of the questionnaire, specifically SDF, SDA, and PS.
Summing up, we would like to reiterate the benefits of using unsupervised clustering on trajectories of behavioral testing. Provided that a set of potentially relevant features is chosen, the method allows us to discover not only which trials are similar to which, but also in what sense they are similar, i.e., it characterizes the found similarity in terms of a small subset of the features. In the particular case of the “stranger test”, out of trajectories of 28 dogs, (in the first scenario) two clusters of 14 and 7 dogs were discovered and characterized: the former dogs contacted the stranger more and approached him quickly, while the latter dogs contacted less and approached slower. The C-BARQ data revealed that the former cluster are the dogs scoring higher with stranger directed fear and aggression. Thus the clustering method not only found a separation between these two groups, but also “explained” potential higher aggressiveness to stranger in terms of, e.g., higher speed of approach.
This provides some indication that our method was able to capture clusters that are behaviorally meaningful, and can be applied as exploratory method before forming and testing specific hypotheses concerning a behavioral testing protocol. One such exploratory finding could be that it would be important to look at speed of approach and time of contact if we are interested in aggression and fear of strangers.
We hope that this study can help promote a bridge between the disciplines of Data Science and Animal Behavior, by showing the potential use of unsupervised approaches which are under-explored in the latter discipline.
Despite the encouraging results mentioned above, it should be stressed that the low number of available samples in our dataset is a notable limitation of our study. Therefore, the clustering results cannot be viewed as validated, but rather as work in progress which requires further validation with larger number of data samples. The pipeline presented in the article, however, serves as a demonstration of the idea behind the approach, and a concrete way to implement this idea.
The results of this exploratory study open up numerous directions for future research. First of all, the k-means algorithm used in our tool can be replaced by more sophisticated methods, that will also allow for a more fine-grained analysis of the clustering outcomes. Secondly, ways to (semi)-automate the feature selection process can be explored. Thirdly, explore ways for outlier analysis and extract information from the samples that are considered as belonging to an outlier cluster, one way might be the usage of learning outlier ensembles (55, 56), Finally, we only considered here spatio-temporal data of a simple type of trajectories extracted from videos. Much more complex representations such as landmarks, segments, or fusion of audio and video data can be explored.
Data Availability Statement
The raw data supporting the conclusions of this article will be made available by the authors, without undue reservation.
Ethics Statement
The study was reviewed and approved by Vives University College of Roeselare, Belgium. Written informed consent was obtained from the owners for the participation of their dog in this study.
Author Contributions
JM and LB: data collection. TM and AZ: data analysis and manuscript writing. All authors contributed to the article and approved the submitted version.
Conflict of Interest
The authors declare that the research was conducted in the absence of any commercial or financial relationships that could be construed as a potential conflict of interest.
Publisher's Note
All claims expressed in this article are solely those of the authors and do not necessarily represent those of their affiliated organizations, or those of the publisher, the editors and the reviewers. Any product that may be evaluated in this article, or claim that may be made by its manufacturer, is not guaranteed or endorsed by the publisher.
Acknowledgments
The research was partially supported by the Ministry of Science and Technology of Israel and RFBR according to the research project no. 19-57-06007, the Israel Ministry of Agriculture, the Animal Welfare division of the Flemish department of Environment and an internal research project from VIVES University College (PWO development and testing of an observation and scoringstool for social skills of pups toward humans). We thank Nareed Farhat for her help with data analysis. Many thanks go to the dog owners and their dogs for their participation in the study.
Supplementary Material
The Supplementary Material for this article can be found online at: https://www.frontiersin.org/articles/10.3389/fvets.2022.884437/full#supplementary-material
Footnotes
1. ^See: http://ffmpeg.org//
References
1. Martin P, Bateson P. Measuring Behavior: An Introductory Guide. Cambridge, UK: Cambridge University Press (2007). doi: 10.1017/CBO9780511810893
2. Anderson DJ, Perona P. Toward a science of computational ethology. Neuron. (2014) 84:18–31. doi: 10.1016/j.neuron.2014.09.005
3. Overall KL. The ethogram project. J Vet Behav Clin Appl Res. (2014) 9:1–5. doi: 10.1016/j.jveb.2013.12.001
4. Hall C, Roshier A. Getting the measure of behavior is seeing believing? Interactions. (2016) 23:42–6. doi: 10.1145/2944164
5. Miklósi Á. Dog Behaviour, Evolution, and Cognition. Oxford: OUP (2014) doi: 10.1093/acprof:oso/9780199646661.001.0001
6. Egnor SR, Branson K. Computational analysis of behavior. Annu Rev Neurosci. (2016) 39:217–36. doi: 10.1146/annurev-neuro-070815-013845
7. Mathis A, Mamidanna P, Cury KM, Abe T, Murthy VN, Mathis MW, et al. DeepLabCut: markerless pose estimation of user-defined body parts with deep learning. Nat Neurosci. (2018) 21:1281–9. doi: 10.1038/s41593-018-0209-y
8. Pennington ZT, Dong Z, Feng Y, Vetere LM, Page-Harley L, Shuman T, et al. ezTrack: an open-source video analysis pipeline for the investigation of animal behavior. Sci Rep. (2019) 9:1–11. doi: 10.1038/s41598-019-56408-9
9. Pereira TD, Aldarondo DE, Willmore L, Kislin M, Wang SSH, Murthy M, et al. Fast animal pose estimation using deep neural networks. Nat Methods. (2019) 16:117–25. doi: 10.1038/s41592-018-0234-5
10. Graving JM, Chae D, Naik H, Li L, Koger B, Costelloe BR, et al. DeepPoseKit, a software toolkit for fast and robust animal pose estimation using deep learning. eLife. (2019) 8:e47994. doi: 10.7554/eLife.47994
11. Romero-Ferrero F, Bergomi MG, Hinz RC, Heras FJ, de Polavieja GG. Idtracker. AI: tracking all individuals in small or large collectives of unmarked animals. Nat Methods. (2019) 16:179–82. doi: 10.1038/s41592-018-0295-5
12. Forkosh O. Animal behavior and animal personality from a non-human perspective: getting help from the machine. Patterns. (2021) 2:100194. doi: 10.1016/j.patter.2020.100194
13. Hsu AI, Yttri EA. B-SOiD, an open-source unsupervised algorithm for identification and fast prediction of behaviors. Nat Commun. (2021) 12:1–13. doi: 10.1038/s41467-021-25420-x
15. Celebi ME, Aydin K. Unsupervised Learning Algorithms. Springer (2016). doi: 10.1007/978-3-319-24211-8
16. Berman GJ, Choi DM, Bialek W, Shaevitz JW. Mapping the stereotyped behaviour of freely moving fruit flies. J R Soc Interface. (2014) 11:20140672. doi: 10.1098/rsif.2014.0672
17. Wiltschko AB, Johnson MJ, Iurilli G, Peterson RE, Katon JM, Pashkovski SL, et al. Mapping sub-second structure in mouse behavior. Neuron. (2015) 88:1121–35. doi: 10.1016/j.neuron.2015.11.031
18. Mearns DS, Donovan JC, Fernandes AM, Semmelhack JL, Baier H. Deconstructing hunting behavior reveals a tightly coupled stimulus-response loop. Curr Biol. (2020) 30:54–69. doi: 10.1016/j.cub.2019.11.022
19. Garriga J, Palmer JR, Oltra A, Bartumeus F. Expectation-maximization binary clustering for behavioural annotation. PLoS ONE. (2016) 11:e0151984. doi: 10.1371/journal.pone.0151984
20. Cleasby IR, Wakefield ED, Morrissey BJ, Bodey TW, Votier SC, Bearhop S, et al. Using time-series similarity measures to compare animal movement trajectories in ecology. Behav Ecol Sociobiol. (2019) 73:1–19. doi: 10.1007/s00265-019-2761-1
21. Edelhoff H, Signer J, Balkenhol N. Path segmentation for beginners: an overview of current methods for detecting changes in animal movement patterns. Movement Ecol. (2016) 4:1–21. doi: 10.1186/s40462-016-0086-5
22. Diederich C, Giffroy JM. Behavioural testing in dogs: a review of methodology in search for standardisation. Appl Anim Behav Sci. (2006) 97:51–72. doi: 10.1016/j.applanim.2005.11.018
23. Wilsson E, Sundgren PE. The use of a behaviour test for the selection of dogs for service and breeding, I: Method of testing and evaluating test results in the adult dog, demands on different kinds of service dogs, sex and breed differences. Appl Anim Behav Sci. (1997) 53:279–95. doi: 10.1016/S0168-1591(96)01174-4
24. Pongrácz P, Miklósi Á, Vida V, Csányi V. The pet dogs ability for learning from a human demonstrator in a detour task is independent from the breed and age. Appl Anim Behav Sci. (2005) 90:309–23. doi: 10.1016/j.applanim.2004.08.004
25. Brady K, Cracknell N, Zulch H, Mills DS. A systematic review of the reliability and validity of behavioural tests used to assess behavioural characteristics important in working dogs. Front Vet Sci. (2018) 5:103. doi: 10.3389/fvets.2018.00103
26. Ledger R, Baxter M. The Development of a Validated Test to Assess the Temperament of Dogs in a Rescue Shelter. Universities Federation for Animal Welfare (UFAW) (1997).
27. Head E, Milgram N. Changes in spontaneous behavior in the dog following oral administration of L-deprenyl. Pharmacol Biochem Behav. (1992) 43:749–57. doi: 10.1016/0091-3057(92)90404-4
28. Beerda B, Schilder MB, van Hooff JA, de Vries HW. Manifestations of chronic and acute stress in dogs. Appl Anim Behav Sci. (1997) 52:307–19. doi: 10.1016/S0168-1591(96)01131-8
29. Karl S, Boch M, Zamansky A, van der Linden D, Wagner IC, Völter CJ, et al. Exploring the dog-human relationship by combining fMRI, eye-tracking and behavioural measures. Sci Rep. (2020) 10:1–15. doi: 10.1038/s41598-020-79247-5
30. Fux A, Zamansky A, Bleuer-Elsner S, van der Linden D, Sinitca A, Romanov S, et al. Objective video-based assessment of ADHD-like canine behavior using machine learning. Animals. (2021) 11:2806. doi: 10.3390/ani11102806
31. Ilska J, Haskell MJ, Blott SC, Sánchez-Molano E, Polgar Z, Lofgren SE, et al. Genetic characterization of dog personality traits. Genetics. (2017) 206:1101–11. doi: 10.1534/genetics.116.192674
32. Dowling-Guyer S, Marder A, D'arpino S. Behavioral traits detected in shelter dogs by a behavior evaluation. Appl Anim Behav Sci. (2011) 130:107–14. doi: 10.1016/j.applanim.2010.12.004
33. Svartberg K. Individual differences in behavior–dog personality. In: The Behavioural Biology of Dogs. Oxfordshire: CAB International (2007). p. 182–206. doi: 10.1079/9781845931872.0182
34. Krueger RF, Johnson W. Behavioral genetics and personality: a new look at the integration of nature and nurture. In: John OP, Robins RW, Pervin LA, editors. Handbook of Personality: Theory and Research. The Guilford Press (2008). p. 287–310.
35. Arata S, Momozawa Y, Takeuchi Y, Mori Y. Important behavioral traits for predicting guide dog qualification. J Vet Med Sci. (2010). doi: 10.1292/jvms.09-0512
36. Sinn DL, Gosling SD, Hilliard S. Personality and performance in military working dogs: Reliability and predictive validity of behavioral tests. Appl Anim Behav Sci. (2010) 127:51–65. doi: 10.1016/j.applanim.2010.08.007
37. Maejima M, Inoue-Murayama M, Tonosaki K, Matsuura N, Kato S, Saito Y, et al. Traits and genotypes may predict the successful training of drug detection dogs. Appl Anim Behav Sci. (2007) 107:287–98. doi: 10.1016/j.applanim.2006.10.005
38. Netto WJ, Planta DJ. Behavioural testing for aggression in the domestic dog. Appl Anim Behav Sci. (1997) 52:243–63. doi: 10.1016/S0168-1591(96)01126-4
39. Christensen E, Scarlett J, Campagna M, Houpt KA. Aggressive behavior in adopted dogs that passed a temperament test. Appl Anim Behav Sci. (2007) 106:85–95. doi: 10.1016/j.applanim.2006.07.002
40. Jones AC, Gosling SD. Temperament and personality in dogs (Canis familiaris): a review and evaluation of past research. Appl Anim Behav Sci. (2005) 95:1–53. doi: 10.1016/j.applanim.2005.04.008
41. Hsu Y, Sun L. Factors associated with aggressive responses in pet dogs. Appl Anim Behav Sci. (2010) 123:108–23. doi: 10.1016/j.applanim.2010.01.013
42. Serpell JA, Hsu Y. Development and validation of a novel method for evaluating behavior and temperament in guide dogs. Appl Anim Behav Sci. (2001) 72:347–64. doi: 10.1016/S0168-1591(00)00210-0
43. Van den Berg L, Schilder M, De Vries H, Leegwater P, Van Oost B. Phenotyping of aggressive behavior in golden retriever dogs with a questionnaire. Behav Genet. (2006) 36:882–902. doi: 10.1007/s10519-006-9089-0
44. Amir S, Zamansky A, van der Linden D. K9-Blyzer-towards video-based automatic analysis of canine behavior. In: Proceedings of Animal-Computer Interaction. (2017). doi: 10.1145/3152130.3152142
45. Zamansky A, Bleuer-Elsner S, Masson S, Amir S, Magen O, van der Linden D. Effects of anxiety on canine movement in dog-robot interactions. Anim Behav Cogn. (2018) 5:380–7. doi: 10.26451/abc.05.04.05.2018
46. Zamansky A, Sinitca AM, Kaplun DI, Plazner M, Schork IG, Young RJ, et al. Analysis of dogs' sleep patterns using convolutional neural networks. In: International Conference on Artificial Neural Networks. Springer (2019). p. 472–83. doi: 10.1007/978-3-030-30508-6_38
47. Loretto D, Vieira MV. The effects of reproductive and climatic seasons on movements in the black-eared opossum (Didelphis aurita Wied-Neuwied, 1826). J Mammal. (2005) 86:287–93. doi: 10.1644/BEH-117.1
48. Hartigan JA, Wong MA. Algorithm AS 136: a k-means clustering algorithm. J R Stat Soc Ser C. (1979) 28:100–8. doi: 10.2307/2346830
49. Ding C, He X. K-means clustering via principal component analysis. In: Proceedings of the Twenty-First International Conference on Machine Learning. (2004). p. 29. doi: 10.1145/1015330.1015408
50. Verleysen M, François D. The curse of dimensionality in data mining and time series prediction. In: International Work-Conference on Artificial Neural Networks. Springer (2005). p. 758–70. doi: 10.1007/11494669_93
51. Wold S, Esbensen K, Geladi P. Principal component analysis. Chemometr Intell Lab. systems. (1987) 2:37–52. doi: 10.1016/0169-7439(87)80084-9
52. Syakur MA, Khotimah BK, Rochman EMS, Satoto BD. Integration k-means clustering method and elbow method for identification of the best customer profile cluster. In: IOP Conference Series: Materials Science and Engineering. IOP Publishing (2018), 336, 012017.
53. Rousseeuw PJ. Silhouettes: a graphical aid to the interpretation and validation of cluster analysis. J Comput Appl Math. (1987) 20:53–65. doi: 10.1016/0377-0427(87)90125-7
54. Bisong E. Introduction to Scikit-learn. In: Building Machine Learning and Deep Learning Models on Google Cloud Platform. Springer (2019). p. 215–29. doi: 10.1007/978-1-4842-4470-8_18
55. Aggarwal CC. Outlier ensembles. In: Outlier Analysis. Springer (2017). p. 185–218. doi: 10.1007/978-3-319-47578-3_6
Keywords: machine learning, clustering, animal behavior, behavioral testing, Data Science
Citation: Menaker T, Monteny J, de Beeck LO and Zamansky A (2022) Clustering for Automated Exploratory Pattern Discovery in Animal Behavioral Data. Front. Vet. Sci. 9:884437. doi: 10.3389/fvets.2022.884437
Received: 26 February 2022; Accepted: 13 April 2022;
Published: 23 June 2022.
Edited by:
Clara Mancini, The Open University, United KingdomReviewed by:
Lior Shamir, Kansas State University, United StatesMohamed Bennasar, The Open University, United Kingdom
Copyright © 2022 Menaker, Monteny, de Beeck and Zamansky. This is an open-access article distributed under the terms of the Creative Commons Attribution License (CC BY). The use, distribution or reproduction in other forums is permitted, provided the original author(s) and the copyright owner(s) are credited and that the original publication in this journal is cited, in accordance with accepted academic practice. No use, distribution or reproduction is permitted which does not comply with these terms.
*Correspondence: Anna Zamansky, YW5uYXphbUBpcy5oYWlmYS5hYy5pbA==