 Longfei Zhang
 Hongbing Xie2
- 1Postdoctoral Research Station, Henan Agriculture University, Zhengzhou, China
- 2College of Animal Science and Veterinary Medicine, Henan Institute of Science and Technology, Xinxiang, China
- 3Postdoctoral Research Base, Henan Institute of Science and Technology, Xinxiang, China
Pharmacokinetic/pharmacodynamic (PK/PD) integration models are used to investigate the antimicrobial activity characteristics of drugs targeting pathogenic bacteria through comprehensive analysis of the interactions between PK and PD parameters. PK/PD models have been widely applied in the development of new drugs, optimization of the dosage regimen, and prevention and treatment of drug-resistant bacteria. In PK/PD analysis, minimal inhibitory concentration (MIC) is the most commonly applied PD parameter. However, accurately determining MIC is challenging and this can influence the therapeutic effect. Therefore, it is necessary to optimize PD indices to generate more rational results. Researchers have attempted to optimize PD parameters using mutant prevention concentration (MPC)-based PK/PD models, multiple PD parameter-based PK/PD models, kill rate-based PK/PD models, and others. In this review, we discuss progress on PD parameters for PK/PD models to provide a valuable reference for drug development, determining the dosage regimen, and preventing drug-resistant mutations.
Introduction
The excessive use of antibiotics has promoted the emergence and selection of multi-drug-resistant (MDR) pathogenic bacteria. MDR cause infections that threaten the health of humans, livestock, and wild animals. Some Gram-negative (G−) bacteria harboring the mobilized colistin resistance (mcr) gene are resistant to colistin, and this is leading to fewer and fewer antibiotics available for clinical treatment of MDR infections (1, 2). Indeed, in the future there may be no drugs available to treat bacterial infections caused by MDR pathogens. The main approaches to address this include the development of new drugs, optimization of dosage regimen, revision of susceptible breakpoints, and drug combinations. Pharmacokinetic/pharmacodynamic (PK/PD) models can comprehensively investigate interactions between hosts, pathogens, and drugs, and the obtained PK/PD parameters can predict the clinical antibacterial efficacy (3, 4). Thus, PK/PD integration is an effective and practical method for addressing MDR bacterial infections, and it has been widely applied to optimize the dosage regimen and reset the bacterial susceptible breakpoints. Theoretically, the appropriate application of PK/PD integration has potential to improve the outcomes on recovering antimicrobial activity, extending the usage life of an antimicrobial, and preventing the emergence and spread of resistant bacteria (5–9).
In PK/PD integration models, the most commonly applied PK/PD parameters are based on minimal inhibitory concentration (MIC). MIC is a standard in vitro value for a given antibacterial against a specific microorganism after a fixed time period (16–18 h). In other words, MIC is a net result when the growth rate of microorganisms (the population of inoculum) equal to the kill rate of a given drug at the fixed concentration which different from the dynamic character of drug concentrations in vivo. So, MIC is a hybrid and contextual PD variable due to its nature and the conditions for obtaining it (10, 11). The test medium play an important influence on the numerical value of a MIC because of a possible large matrix effect. In standard test, the Mueller Hinton Broth (MHB) was chosen because it ensures the rapid growth of bacteria. But the growth rate can be much slower in vivo which will inevitably change the value of the MIC because the difference of the growth rate, the duration of the incubations, and the size of the starting inoculum. For example, the macrolides have a large difference between in vitro MIC and effective in vivo plasma concentrations because of a very significant matrix effect which has been demonstrated for all veterinary macrolides and well explained by the fact that the MHB promotes the overexpression of efflux pump (12). The test method of MIC may also result in treatment failure and emergence of resistant mutations in bacterial infections (13–15). (a) The determination of MIC is an all-or-nothing result; a drug will exhibit antibacterial activity when its concentration is above the MIC, and have no antibacterial effect when its concentration is below the MIC. This does not reflect the real antibacterial activity of low drug concentrations against pathogens because different types of drugs have different antibacterial characteristics based on their antibacterial mechanisms. (b) MIC is typically determined using the double dilution method, which may result in estimated values that are higher than real values. Administration of a dosage regimen based on MIC may result in drug residues and ecological damage after a long time. (c) MIC is determined using static drug concentrations, which does not reflect the dynamic antibacterial activities of drugs against pathogens, such as changes in kill rate and growth rate in the presence of different drug concentrations over different time periods. (d) The bacterial cell density is typically ~105 CFU/mL for MIC determination. Although this density not representative of in vivo infectious situations (the bacterial number may exceed 108 CFU/mL in serious infection), the mutant frequency (the natural mutant occurrence frequency is ~10−6) may largely increase when amount of bacteria is exposed to antibacterial drugs, such as fluoroquinolones. These limitations may result in the emergence of MDR bacteria. Thus, developing new drugs and designing dosage regimens based only on MIC for PK/PD simulation is not sufficient. Therefore, it is necessary to explore PD parameters to more accurately investigate the antibacterial activities of drugs against pathogens.
In order to overcome the limitations of MIC-based PK/PD integration in clinical treatment, researchers have conducted numerous studies to optimize PD parameters, including mutant prevention concentration (MPC)-based PK/PD models, multiple PD parameter-based PK/PD models, and kill rate-based PK/PD models. Therefore, this review firstly covers the basic methods, concepts, and mathematical models of MIC-based PK/PD integration. And then introduces other PD parameter-based PK/PD integration approaches. This work provides a valuable guidance for optimizing the dosage regimen, developing new drugs, and preventing the emergence of MDR bacteria.
Basic Methods of PK/PD Integration
PK/PD integration models include in vitro, ex vivo, and in vivo PK/PD models. For in vitro PK/PD studies, peristaltic pump and hollow fiber models are the most commonly used methods for simulating PK processes of drugs in hosts. The peristaltic pump model was applied to simulate one-compartment, two-compartment model, and multiple-compartment models. The simplest peristaltic pump model consists of a storage compartment (blank medium), a central compartment (drug, bacteria, and medium), and an elimination compartment (waste medium) connected by rubber pipe, and the PK characteristics (elimination rate) of drugs in hosts are simulated by a peristaltic pump. A magnetic bar is applied to mix the medium, and a thermostat is used to ensure the optimal growth temperature for pathogens. After measuring the drug concentration and bacterial cell density, the antibacterial effect and PK/PD parameters are calculated and simulated to guide the design of the dosage regimen (16–21). The hollow fiber model consists of thousands of hollow fiber tubes that simulate multiple compartments (22–29). The in vitro PK/PD model is simple, economical, and easy to operate, and it can directly describe the dynamic interaction between drugs and pathogens.
The ex vivo PK/PD model is used to investigate the antibacterial activities of hosts, drugs, and bacteria in drug-containing body fluids rather than artificial medium. The most commonly applied body fluids are plasma, serum, and tissue cage fluid (TCF). After collecting these samples at different timepoints following drug administration, drug concentrations and time-kill curves are determined, and a mathematical equation is applied to analyze the relationships between PK/PD parameters and antibacterial effect. TCF is a type of extracellular fluid that is typically targeted during bacterial infection. Thus, TCF is an ideal medium for ex vivo PK/PD integration studies. TCF can be acquired through surgery by implanting a tissue cage between muscle and skin. After ~4 weeks, granulation tissue surrounds the tissue cage and produces TCF. The TCF model has been widely applied in pig, rabbit, cattle, camel, goat, and other animals (30–39). Uterine fluid (40) and intestinal juice (41) have also been used for ex vivo PK/PD studies. However, although drug concentrations are still static when study ex vivo kill curves, this model can enable sampling of the extracellular fluid at different times after dosing which allow collection of samples as the concentration changes and partially consider the influence of the host.
Previous in vivo PK/PD models have been used to study interactions between hosts, drugs, and pathogens. The most commonly used are the tissue cage infection model (TCIM) and the target organ infection model (TOIM). The TCIM was established by adding pathogens to the tissue cage model, a series of dosage regimens were subsequently administrated for treatment, and TCF samples were collected for drug concentration measurement and bacterial population counting at different timepoints. After calculating the PK/PD parameters and antibacterial effect (the change in bacterial population), the relationship between PK/PD parameters and antibacterial effect was fitted and the dosage was predicted (42–49). The TOIM approach can simulate clinical infection by directly inoculating bacteria into target organs, then administering drugs at different dosages and intervals. Finally, animals are killed at different timepoints for bacterial population counting and antibacterial concentration determination at infected sites. The obtained PK/PD parameters and antibacterial effect are then analyzed and evaluated. These in vivo PK/PD models can comprehensively study the interactions between hosts, drugs, and pathogenic bacteria, and the results are typically consistent with clinical treatment (50–62).
Basic PK/PD Parameters and Mathematical Models
For PK/PD integration, MIC is the most commonly applied PD variable used to calculate PK/PD indices such as AUC/MIC (area under the curve of concentration divided by MIC), Cmax/MIC (maximum concentration divided by MIC), and %T >MIC (percentage of time that drug concentrations exceed MIC during the dosage interval) (50, 63–67) (Figure 1). Actually, all PK/PD indices must be calculated with free concentrations and not with total plasma concentrations because MIC is a free concentration. Based on the closeness of the relationship between PK/PD parameters and antibacterial effect, antibacterial drugs can generally be divided into time-dependent drugs, concentration-dependent, and co-dependent drugs (3, 68–70). The represented PK/PD parameter for time-dependent drugs is %T >MIC. This reflects an antibacterial effect that is closely related to the duration of the drug concentration above MIC; the longer the duration of the drug concentration above MIC, the better the antibacterial activity. Time-dependent drugs include β-lactam antibiotics and macrolides. However, different members of macrolides have different PK/PD dependencies (71), so, the antibacterial activity should be evaluated prudently. For concentration-dependent drugs, representative PK/PD parameters are AUC/MIC and Cmax/MIC. These reflect antibacterial effects that are closely related to drug concentrations above MIC; the higher of drug concentration, the better of the antibacterial activity. Well-known concentration-dependent drugs are aminoglycosides and fluoroquinolones. However, for aminoglycosides, the more appropriate PK/PD parameter is AUC/MIC rather than Cmax/MIC, because the Cmax/MIC criterion was historically proposed for rodents and can not reflect the over time process (72, 73). For co-dependent drugs, the PK/PD parameter were AUC/MIC or %T >MIC against different bacteria, such as tetracycline and glycopeptides.
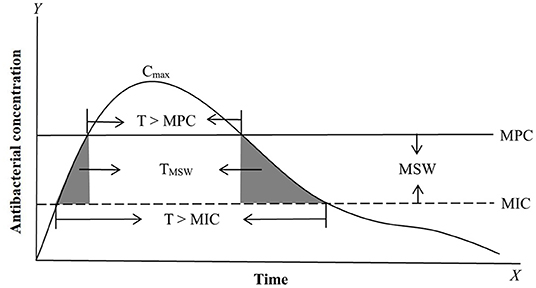
Figure 1. Antimicrobial PK, PD, and PK/PD parameters based on MIC (minimum inhibitory concentration) and MPC (mutant prevention concentration). The most commonly applied PK/PD parameters are AUC/MIC (area under the curve of antibacterial concentration divide MIC) or AUC/MPC, Cmax/MIC (maximum drug concentration divide MIC) or Cmax/MPC, and T > MIC (the time of the drug concentration above MIC during the dosage interval) or T > MPC (the time of the drug concentration above MPC during the dosage interval). MSW (mutant selection window) is the drug concentration between MIC and MPC. TMSW (dash area) is the time that the antibacterial concentration inside MSW during the dosage interval.
To confirm the most appropriate PK/PD parameters and predict the values of PK/PD parameters for designing the dosage regimen, a mathematical model is needed. A commonly applied model for this purpose is the Sigmoid Emax model (Equation 1). This sigmoid concentration-response model is a strongly empirical model. This model is a useful tool to formalize our understanding of experimental data, but it has no clear relationship to real physical characteristics of the actual system being studied.
where Emax is the maximum antibacterial effect of a drug, EC50 is the value of PK/PD parameters or drug concentrations at 50% Emax, C is the antibacterial concentration or PK/PD parameter, and N (Hill coefficient) is the slope of the fitted curves between PK/PD parameters or drug concentrations and antibacterial effect. The correlation coefficient (R2) is applied to evaluate the relationship between PK/PD parameters and antibacterial effect; the higher of the value of R2, the closer the PK/PD parameters are related to effect.
MPC-Based PK/PD Integration
To cope with the low bacterial cell density in MIC tests, some researchers have explored other PD parameters for serious infections (>1010 CFU/mL) for PK/PD integration. In serious infections, susceptible bacteria may produce a natural gene mutation (first-step mutant bacteria) that are resistant to drugs. At low drug concentrations, susceptible bacteria will gradually be killed and first step mutant bacteria may reproduce rapidly, which may result in recurrence of infection and further resistant mutations. Therefore, a new PD variable was proposed for high bacterial cell densities. MPC is the MIC of drugs for high bacterial cell densities (1010 CFU/mL) that can inhibit the growth of first step mutant bacteria (74, 75). In clinical infections, the bacterial cell density generally cannot exceed 1012 CFU/mL, hence two-step mutations rarely occur under natural conditions, but they may easily arise under low drug concentrations. Therefore, it is of great significance to prevent the emergence of drug-resistant bacteria when designing the dosage regimen based on MPC. Meanwhile, a mutant selection window (MSW) theory was proposed based on MIC and MPC (the corresponding PK/PD parameters are listed in Figure 1). This theory considers that drug-resistant bacteria are easily induced in the middle part of the MSW (the upper part cannot produce effect because the size of the bacterial population is large, and the lower part may have no effects because of the smaller bacterial population densities which have just been greatly reduced by previous concentrations; Figure 2). Therefore, a rational dosage regimen should be carefully designed that is not only an effective bacterial treatment, but that also prevents the emergence and spread of resistant bacteria.
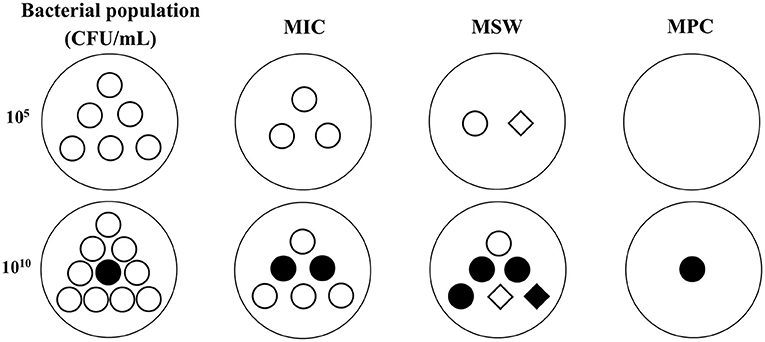
Figure 2. The possible changes of bacterial population and sensitivity under different antibacterial concentrations in low (105 CFU/mL) and high (1010 CFU/mL) inoculums based on MSW theory. ◦, susceptible bacteria. •, natural mutant bacteria. ♢, first step mutant bacteria. ♦, multiple step mutant bacteria. MIC, minimum inhibitory concentration. MPC, mutant prevention concentration. MSW, mutant selection window, is the drug concentration between MIC and MPC. In low inoculum, the bacterial population will be gradually reduced with the drug concentrations added from MIC to MPC, and the bacterial sensitivity may be decreased because of the emergence of first step resistant mutation during MSW. In high inoculum, a natural mutant bacteria may exist in the initial population. The total population will be decreased but the mutant subpopulations may be increased when the drug concentrations below MPC. The sensitivity may be obviously decreased because of the emergence of first step and multiple step mutant bacteria during MSW.
Various studies have applied MPC as a PD variable (76–81). MPC-based PK/PD integration has mainly been applied for fluoroquinolones, because the mechanism of resistant mutations in the MSW theory is consistent with the mutant resistance mechanism of fluoroquinolones that usually occurs gradually through gene point mutations. Cui et al. (79) applied a rabbit TCIM to study the antibacterial activity of levofloxacin against Staphylococcus aureus, and analyzed the relationship between AUC24h/MPC and the generation of drug-resistant bacteria. The results showed that the emergence of resistant mutants could be inhibited when AUC24h/MPC >25 h. Liang et al. (81) applied three kinds of levofloxacin-resistant S. aureus strains (with the same MIC but different MPC) to compare the difference between AUC24/MIC and AUC24/MPC as PK/PD parameters for inhibiting the generation of drug-resistant bacteria. The results showed that generation of drug-resistant mutants could be inhibited when AUC24/MPC values were between 22 and 25 (even for strains with different MPC values). When applying AUC24/MIC as the target PK/PD parameter, the values were 8-fold different despite having the same MIC. Therefore, AUC24/MPC was more suitable than AUC24/MIC as the target PK/PD parameter to inhibit the generation of drug-resistant mutations. Zhang et al. (46) carried out a mutation window study on danofloxacin against Actinobacillus pleuoniae using a porcine TCIM, and analyzed the relationship between AUC24h/MPC and the generation of drug-resistant bacteria. The results showed that the generation of drug-resistant bacteria could be significantly inhibited when AUC24h/MPC >18.58 h. These studies shown that the susceptible or resistant mutant bacteria could be inhibited when the value of AUC/MIC or AUC/ MPC were 24 h which just means that the average plasma concentration over 24 h is equal to the MIC or the MPC.
In order to expand the application of the MSW approach, various types of antibacterials have been studied. For time-dependent drugs, %T> MIC is the PK/PD parameter that best reflects antibacterial activity. For MPC-based PK/PD parameters, %T >MPC was applied to prevent mutations, which reflects the time percentage of the drug concentration within the MSW during the interval of dosage administration. Alieva et al. (82) applied an in vitro dynamic model to study the relationship between the residence time (TMSW) of linezolone concentration within the MSW and the emergence of drug-resistant bacteria. The results showed that the correlation between TMSW and T >MPC and area under the bacterial curve of mutation (AUBCM) was 0.99. Thus, TMSW was an important indicator for predicting the emergence and enrichment of drug-resistant bacteria. Xiong et al. (48) applied a rabbit TCIM to study resistance mutations for cefquinome in S. aureus, and the results showed that drug-resistant bacteria appeared and accumulated when T >MIC99 >70% or T >MPC <58%. Zhang et al. (49) applied a pig TCIM to study the MSW of cefquinome against Escherichia coli, and the results showed that the emergence and enrichment of resistant bacteria occurred when T >MIC99 >25% or T >MPC <50%. In these studies, TCIM was used for dose regimens testing because this model do not allow extrapolation to dose regimens for clinical use, and the concentration time profiles within tissue cages do not mirror those of extracellular fluid because of the perfusion barriers.
Therefore, there was an optimal value to prevent the emergence and spread of drug-resistant bacteria when applying MPC-based PK/PD integration studies (83–87). However, the mechanism of drug-resistant bacterial resistance have a variety of ways. Such as except for genetic mutations, the emergence of resistant bacteria may be due to the spread of exogenous plasmid, especially for drugs other than fluoroquinolones. Therefore, the use of MSW theory is dispute which need more exploration.
Multiple PD Parameter-Based PK/PD Integration
To investigate antibacterial activity in more detail, time-kill curves with multiple endpoints can be applied for PK/PD integration. Compared with PK/PD integration based on MIC alone, this multi-parameter-based time-kill curve model can provide detailed and accurate descriptions of dynamic changes in bacterial growth and death rates under different drug concentrations. Depending on whether drug concentrations change, this model can be divided into static and dynamic models. Static models are mainly conducted by comparing changes in the number of bacteria to obtain the bacterial growth rate constant and the death rate under different drug concentrations, and the corresponding equation is applied to analyze the relationship between drug concentration and antibacterial effect. However, in static models, the drug concentration is constant, whereas dynamic changes in drug concentration occur in the host. Dynamic models can be conducted by peristaltic pump and hollow fiber models to simulate dynamic changes in drugs and antibacterial effects in the clinic, and they may more accurately reflect clinical therapeutic effects.
Nolting et al. (88) studied the in vitro bactericidal effect of piperacillin against E. coli and applied a modified multi-parameter Emax model (Equation 2) to describe the bactericidal effect (dN/dt, change in bacteria over time). This model was used to investigate the maximum bactericidal effect (Kmax), the normal growth rate of bacteria (Kgrowth), drug concentration (Ct), the concentration that achieves a 50% maximum bactericidal effect (EC50), the delayed growth constant (Z), and the initial bacterial population (N). This model can dynamically describe changes in bacterial population over time under different drug concentrations. The results showed that the bactericidal effect of piperacillin was closely related to the time of drug administration; the more frequent the administration, the better the antibacterial effect. Compared with models base on MIC alone, this model can provide more detailed and accurate guidance for designing the dosage regimen.
Regoes et al. (89) established a multiple PD parameter mathematical model (Equation 3) to study the PK/PD integration of five antibacterials against E. coli. In this model, ψ(a) is the net bacterial growth rate under different drug concentrations (a), ψmax is the maximum bacterial growth rate in drug-free medium, ψmin is the minimum bacterial net growth rate in drug-containing medium, N is the Hill coefficient (the slope of the graph of drug concentrations against bacterial net growth rate), and zMIC represent the MIC values of different bacteria. The results showed that when MIC was the same, the larger the value of k, the better the bactericidal effect, and the smaller the value of ψmin, the better the bactericidal effect. In this model, four PD parameters were employed, which can more precisely reflect the antibacterial characteristics of drugs to help design a more accurate and rational dosage regimen. Foerster et al. (90) also applied this model to study the antibacterial activities of several types of drugs against five strains of Neisseria gonorrhoeae.
This model also have been applied to classify bacteria as susceptible or resistant. Chauzy et al. (91) studied the antibacterial activity of polymyxin B against susceptible and drug-resistant Klebsiella pneumoniae using two consecutive bactericidal kill curve experiments and multiple PD parameter-based PK/PD integration. The results showed that after two consecutive bactericidal experiments, the bacteria whether appeared induced mutations could be determined by analyzing changes in growth and death rates.
In conclusion, compared PK/PD integration based on MIC alone, multiple PD parameter-based PK/PD models can more accurately reflect the antibacterial effects of drugs against pathogens, which has important implications for designing a rational dosage regimen to prevent the emergence of resistant mutant pathogens.
PK/PD Integration Based on Kill Rate
Kill rate is a PD reference that can be obtained from time-kill curves (92–98). It is the slope of time-kill curves, which reflects the interaction between bacterial growth and death rates under different drug concentrations. Compared with multiple PD parameter-based PK/PD integration, this model can directly analyze the relationship between kill rate and drug concentrations at different time periods. This method can dynamically analyze changes in antibacterial activity over time, and it has been used to classify antibacterial characteristics (concentration-dependent or time-dependent drugs). Two classical curves are depicted in Figure 3 to describe the relationship between kill rate and drug concentration. For time-dependent drugs, the value of kill rate increases with increasing drug concentration, but it is relatively small compared with concentration-dependent drugs at low concentrations. Furthermore, a maximum value is reached and it no longer increases with increasing drug concentration after this point. For concentration-dependent antibacterials, the value of kill rate increases quickly with increasing drug concentration. This antibacterial characteristic can be directly applied for drug classification.
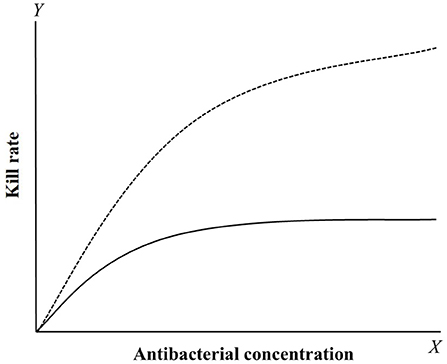
Figure 3. The relationship curves between kill rate and concentration of concentration-dependent (dotted line) and time-dependent (solid line) drugs. For concentration-dependent drugs, the kill rate will gradually increase with the concentration added. For time-dependent drugs, the kill rate was smaller compared to concentration-dependent drugs and rapidly reach a plateau that the value have little change with the concentration increased.
Ferro et al. (99) analyzed the antibacterial activities of a variety of antibacterial drugs against two types of fast-growing Mycobacterium strains. For M. abscess, the maximum kill rate occurred between 24 and 72 h, and the maximum kill rate was 0.0427 h−1, 0.0231 h−1, and 0.0142 h−1 for amikacin, clarithromycin, and cefoxitin, respectively. For M. fortuitum, the maximum kill rate occurred between 3 and 24 h, and amikacin had the strongest antibacterial activity with a maximum bactericidal rate of 0.1933 h−1. Zhang et al. (100) analyzed the relationship between kill rate and drug concentration for doxycycline against Mycoplasma gallisepticum at different time periods, and the results showed that the optimal time period was 0-48 h (R2 = 0.986) and the maximum kill rate was 0.11−1 h. Zhang et al. (101) studied the kill rate of cefquinome against A. pleuropneumoniae and analyzed the relationship between kill rate and drug concentrations at different time periods. The results showed that cefquinome exerted time-dependent antibacterial activity, the optimal time period was 0-9 h (R2 = 0.9955), and the maximum kill rate was 0.48 log10 CFU/mL/h. Maneke et al. (102) compared the difference in kill rate between cephalexin and kanamycin alone and in combination against E. coli, S. aureus, Streptococcus agalactiae, Streptococcus dysgalactiae, and Streptococcus uberis. The results showed that the drug combination could increase the kill rate more than either drug alone, which can shorten the time required to achieve a bactericidal effect, and the antibacterial activity was concentration-dependent.
Compared with MIC-based PK/PD integration, the kill rate for based PK/PD integration can reflect dynamic changes in antibacterial activity, which can be widely used in the selection of new drugs, design of the dosage regimen, and monitoring changes in bacterial sensitivity.
Conclusion
In conclusion, MIC based PK/PD is the most commonly applied method for evaluating antibacterial activities. However, with the emergence and spreading of resistant mutant bacteria, MIC-only-based PK/PD integration cannot meet the needs of clinical medicine due to the limitations of MIC. Therefore, it is necessary to optimize PD parameters for detailed analysis of antibacterial activity. Further research on MPC, multiple PD parameters, and kill rate-based PK/PD integration will gradually overcome the limitations of MIC, and these could assist optimizing the dosage regimen and prevent or slow the emergence of resistant mutations.
Author Contributions
LZ, HX, YW, and HW contributed to the methodology, software use, validation, formal analysis, and preparation of the manuscript writing—reviewing and editing. GZ and JH contributed to the manuscript supervision. All authors contributed to the article and approved the submitted version.
Funding
This work was supported by the Postdoctoral Research Foundation of Henan Province (202002067), Key Technology Research and Development Program of Henan Province (212102110373), the Scientific Research Program of Henan Institute of Science and Technology (103010620002/004), Postdoctoral Research Foundation of Henan Institute of Science and Technology, Program for Innovative Research Team (in Science and Technology) in University of Henan Province (22IRTSTHN026), and Key Scientific Research Projects of Universities in 2020 (20B230002).
Conflict of Interest
The authors declare that the research was conducted in the absence of any commercial or financial relationships that could be construed as a potential conflict of interest.
Publisher's Note
All claims expressed in this article are solely those of the authors and do not necessarily represent those of their affiliated organizations, or those of the publisher, the editors and the reviewers. Any product that may be evaluated in this article, or claim that may be made by its manufacturer, is not guaranteed or endorsed by the publisher.
References
1. Laxminarayan R, Sridhar D, Blaser M, Wang M, Woolhouse M. Achieving global targets for antimicrobial resistance. Science. (2016) 353:874–5. doi: 10.1126/science.aaf9286
2. Liu YY, Wang Y, Walsh TR, Yi LX, Zhang R, Spencer J, et al. Emergence of plasmid-mediated colistin resistance mechanism MCR-1 in animals and human beings in China: a microbiological and molecular biological study. Lancet Infect Dis. (2016) 16:161–8. doi: 10.1016/S1473-3099(15)00424-7
3. Rao GG, Landersdorfer CB. Antibiotic pharmacokinetic/pharmacodynamic modeling: MIC, Pharmacodynamic indices, and beyond. Int J Antimicrob Agents. (2021) 2021:106368. doi: 10.1016/j.ijantimicag.2021.106368
4. Rayner CR, Smith PF, Andes D, Andrews K, Derendorf H, Friberg LE, et al. Model-Informed drug development for anti-infectives: state of the art and future. Clin Pharmacol Therapeutics. (2021) 109:867–891. doi: 10.1002/cpt.2198
5. Rodríguez-Gascón A, Solinís MÁ, Isla A. The role of PK/PD analysis in the development and evaluation of antimicrobials. Pharmaceutics. (2021) 13:833. doi: 10.3390/pharmaceutics13060833
6. Luo W, Chen D, Wu M, Li Z, Tao Y, Liu Q, et al. Pharmacokinetics/Pharmacodynamics models of veterinary antimicrobial agents. J Vet Sci. (2019) 20:e40. doi: 10.4142/jvs.2019.20.e40
7. Toutain PL, Pelligand L, Lees P, Bousquet-Mélou A, Ferran AA, Turnidge JD, et al. The pharmacokinetic/pharmacodynamic paradigm for antimicrobial drugs in veterinary medicine: recent advances and critical appraisal. J Vet Pharmacol Ther. (2021) 44:172–200. doi: 10.1111/jvp.12917
8. Schmidt S, Barbour A, Sahre M, Rand KH, Derendorf H. PK/PD: new insights for antibacterial and antiviral applications. Curr Opin Pharmacol. (2008) 8:549–56. doi: 10.1016/j.coph.2008.06.010
9. Asín-Prieto E, Rodríguez-Gascón A, Isla A. Applications of the pharmacokinetic/pharmacodynamic (PK/PD) analysis of antimicrobial agents. J Infect Chemother. (2015) 21:319–29. doi: 10.1016/j.jiac.2015.02.001
10. Mouton JW, Vinks AA. Pharmacokinetic/pharmacodynamic modelling of antibacterials in vitro and in vivo using bacterial growth and kill kinetics. Clin Pharmacokinet. (2005) 44:201–10. doi: 10.2165/00003088-200544020-00005
11. Mouton JW, Vinks AA. Relationship between minimum inhibitory concentration and stationary concentration revisited. Clin Pharmacokinet. (2005) 44:767–8. doi: 10.2165/00003088-200544070-00007
12. Buyck JM, Plésiat P, Traore H, Vanderbist F, Tulkens PM, Bambeke FV. Increased susceptibility of Pseudomonas aeruginosa to macrolides and ketolides in eukaryotic cell culture media and biological fluids due to decreased expression of oprM and increased outer-membrane permeability. Clin Infect Dis. (2012) 55:534–42. doi: 10.1093/cid/cis473
13. Mouton JW, Muller AE, Canton R, Giske CG, Kahlmeter G, Turnidge J. MIC-based dose adjustment: facts and fables. J Antimicrob Chemother. (2018) 73:564–8. doi: 10.1093/jac/dkx427
14. Mouton J W, Meletiadis J, Voss A, Turnidge J. Variation of MIC measurements: the contribution of strain and laboratory variability to measurement precision. J Antimicrob Chemother. (2018) 73:2374–9. doi: 10.1093/jac/dkz142
15. Mueller M, de la Pena A, Derendorf H. Issues in pharmacokinetics and pharmacodynamics of anti-infective agents: kill curves versus MIC. Antimicrob Agents Chemother. (2004) 48:369–77. doi: 10.1128/AAC.48.2.369-377.2004
16. Budha NR, Lee RB, Hurdle JG, Lee RE, Meibohm B. A simple in vitro PK/PD model system to determine time–kill curves of drugs against Mycobacteria. Tuberculosis. (2009) 89:378–85. doi: 10.1016/j.tube.2009.08.002
17. Zinner SH, Lubenko IY, Gilbert D, Simmons K, Zhao X, Drlica K, et al. Emergence of resistant Streptococcus pneumoniae in an in vitro dynamic model that simulates moxifloxacin concentrations inside and outside the mutant selection window: related changes in susceptibility, resistance frequency and bacterial killing. J Antimicrob Chemother. (2003) 52:616–22. doi: 10.1093/jac/dkg401
18. Liu P, Rand K H, Obermann B, Derendorf H. Pharmacokinetic-pharmacodynamic modelling of antibacterial activity of cefpodoxime and cefixime in in vitro kinetic models. Int J Antimicrob Agents. (2005) 25:120–9. doi: 10.1016/j.ijantimicag.2004.09.012
19. Vaddady PK, Trivedi A, Rathi C, Madhura DB, Liu J, Lee RE, et al. Dynamic time-kill curve characterization of spectinamide antibiotics 1445 and 1599 for the treatment of tuberculosis. Eur J Pharmaceut Sci. (2019) 127:233–9. doi: 10.1016/j.ejps.2018.11.006
20. Meletiadis J, Al-Saigh R, Velegraki A, Walsh TJ, Roilides E, Zerva L. Pharmacodynamic effects of simulated standard doses of antifungal drugs against Aspergillus species in a new in vitro pharmacokinetic/pharmacodynamic model. Antimicrob Agents Chemother. (2012) 56:403–40. doi: 10.1128/AAC.00662-11
21. Blaser J. In-vitro model for simultaneous simulation of the serum kinetics of two drugs with different half-lives. J Antimicrob Chemother. (1985) 15:125–30. doi: 10.1093/jac/15.suppl_a.125
22. Marchbanks CR, McKiel JR, Gilbert DH, Robillard NJ, Painter B, Zinner SH, et al. Dose ranging and fractionation of intravenous ciprofloxacin against Pseudomonas aeruginosa and Staphylococcus aureus in an in vitro model of infection. Antimicrob Agents Chemother. (1993) 37:1756–63. doi: 10.1128/AAC.37.9.1756
23. Cadwell JJS. The hollow fiber infection model for antimicrobial pharmacodynamics and pharmacokinetics. Adv Pharmacoepidem Drug Safety S. (2012) 1:2167–1052. doi: 10.4172/2167-1052.S1-007
24. Gumbo T, Louie A, Deziel MR, Drusano GL. Pharmacodynamic evidence that ciprofloxacin failure against tuberculosis is not due to poor microbial kill but to rapid emergence of resistance. Antimicrob Agents Chemother. (2005) 49:3178–81. doi: 10.1128/AAC.49.8.3178-3181.2005
25. Louie A, Grasso C, Bahniuk N, Scoy BV, Brown DL, Kulawy R, et al. The combination of meropenem and levofloxacin is synergistic with respect to both Pseudomonas aeruginosa kill rate and resistance suppression. Antimicrob Agents Chemother. (2010) 54:2646–54. 10.1128/AAC.00065-10
26. Louie A, Heine HS, Kim K, Brown DL, Scoy BV, Liu W, et al. Use of an in vitro pharmacodynamic model to derive a linezolid regimen that optimizes bacterial kill and prevents emergence of resistance in Bacillus anthracis. Antimicrob Agents Chemother. (2008) 52:2486–96. doi: 10.1128/AAC.01439-07
27. Jacobsson S, Golparian D, Oxelbark J, Alirol E, Franceschi F, Gustafsson TN, et al. Pharmacodynamic evaluation of dosing, bacterial kill, and resistance suppression for Zoliflodacin against neisseria gonorrhoeae in a dynamic hollow fiber infection model. Front Pharmacol. (2021) 12:1225. doi: 10.3389/fphar.2021.682135
28. Bhagunde P, Zhang Z, Racine F, Carr D, Wu J, Young K, et al. A translational pharmacokinetic/pharmacodynamic model to characterize bacterial kill in the presence of imipenem-relebactam. Int J Infect Dis. (2019) 89:55–61. doi: 10.1016/j.ijid.2019.08.026
29. Sadouki Z, McHugh TD, Aarnoutse R, Canseco JO, Darlow C, Hope W, et al. Application of the hollow fibre infection model (HFIM) in antimicrobial development: a systematic review and recommendations of reporting. J Antimicrob Chemother. (2021) 76:2252–9. doi: 10.1093/jac/dkab160
30. Dorey L, Pelligand L, Cheng Z, Lees P. Pharmacokinetic/pharmacodynamic integration and modelling of oxytetracycline for the porcine pneumonia pathogens Actinobacillus pleuropneumoniae and Pasteurella multocida. J Vet Pharmacol Ther. (2017) 40:505–16. doi: 10.1111/jvp.12385
31. Dorey L, Pelligand L, Cheng Z, Lees P. Pharmacokinetic/pharmacodynamic integration and modelling of florfenicol for the pig pneumonia pathogens Actinobacillus pleuropneumoniae and Pasteurella multocida. PLoS ONE. (2017) 12:e0177568. doi: 10.1371/journal.pone.0177568
32. Dorey L, Pelligand L, Lees P. Prediction of marbofloxacin dosage for the pig pneumonia pathogens Actinobacillus pleuropneumoniae and Pasteurella multocida by pharmacokinetic/pharmacodynamic modelling. BMC Vet Res. (2017) 13:1–10. doi: 10.1186/s12917-017-1128-y
33. Aliabadi FS, Ali BH, Landoni MF, Lees P. Pharmacokinetics and PK-PD modelling of danofloxacin in camel serum and tissue cage fluids. Vet J. (2003) 165:104–18. doi: 10.1016/S1090-0233(02)00258-7
34. Aliabadi FS, Landoni MF, Lees P. Pharmacokinetics (PK), pharmacodynamics (PD), and PK-PD integration of danofloxacin in sheep biological fluids. Antimicrob Agents Chemother. (2003) 47:626–35. doi: 10.1128/AAC.47.2.626-635.2003
35. Aliabadi FS, Lees P. Pharmacokinetics and pharmacodynamics of danofloxacin in serum and tissue fluids of goats following intravenous and intramuscular administration. Am J Vet Res. (2001) 62:1979–89. doi: 10.2460/ajvr.2001.62.1979
36. Sidhu P, Rassouli A, Illambas J, Potter T, Pelligand L, Rycroft A, et al. Pharmacokinetic–pharmacodynamic integration and modelling of florfenicol in calves. J Vet Pharmacol Ther. (2014) 37:231–42. doi: 10.1111/jvp.12093
37. Li Z, Liu W, Su J, Chu X, Wang C. Pharmacokinetics and ex vivo pharmacodynamics of Minocycline against Salmonella abortus equi in donkey plasma and tissue cage fluid. Res Vet Sci. (2021) 135:293–6. doi: 10.1016/j.rvsc.2020.10.003
38. Zhang BX, Lu XX, Gu XY, Li XH, Gu MX, Zhang N, et al. Pharmacokinetics and ex vivo pharmacodynamics of cefquinome in porcine serum and tissue cage fluids. Vet J. (2014) 199:399–405. doi: 10.1016/j.tvjl.2013.12.015
39. Zhou Q, Zhang G, Wang Q, Liu W, Huang Y, Yu P, et al. Pharmacokinetic/pharmacodynamic modeling of tulathromycin against Pasteurella multocida in a porcine tissue cage model. Front Pharmacol. (2017) 8:392. doi: 10.3389/fphar.2017.00392
40. Maan MK, Sattar A, Mi K, Shabbir MAB, Xie S, Xin L, et al. Integration of PK/PD for dose optimization of aditoprim against Trueperella pyogenes causing endometritis in bovines. Microb Pathog. (2020) 142:104097. doi: 10.1016/j.micpath.2020.104097
41. Lei Z, Liu Q, Xiong J, Yang B, Yang S, Zhu Q, et al. Pharmacokinetic and pharmacodynamic evaluation of marbofloxacin and PK/PD modeling against Escherichia coli in pigs. Front Pharmacol. (2017) 8:542. doi: 10.3389/fphar.2017.00542
42. Zhang L, Wu X, Huang Z, Zhang N, Wu Y, Cai Q, et al. Pharmacokinetic/pharmacodynamic assessment of cefquinome against Actinobacillus pleuropneumoniae in a piglet tissue cage infection model. Vet Microbiol. (2018) 219:100–106. doi: 10.1016/j.vetmic.2018.02.027
43. Cao C, Qu Y, Sun M, Qiu Z, Huang X, Huai B, et al. In vivo antimicrobial activity of marbofloxacin against Pasteurella multocida in a tissue cage model in calves. Front Microbiol. (2015) 6:759. doi: 10.3389/fmicb.2015.00759
44. Zeng QL, Mei X, Su J, Li XH, Xiong WG, Lu Y, et al. Integrated pharmacokinetic–pharmacodynamic (PK/PD) model to evaluate the in vivo antimicrobial activity of Marbofloxacin against Pasteurella multocida in piglets. BMC Vet Res. (2017) 13:1–7. doi: 10.1186/s12917-017-1099-z
45. Zhang L, Wu X, Huang Z, Kang Z, Chen Y, Shen X, et al. Pharmacokinetic/pharmacodynamic integration of cefquinome against Pasteurella Multocida in a piglet tissue cage model. J Vet Pharmacol Ther. (2019) 42:60–6. doi: 10.1111/jvp.12705
46. Zhang L, Kang Z, Yao L, Gu X, Huang Z, Cai Q, et al. Pharmacokinetic/pharmacodynamic integration to evaluate the changes in susceptibility of Actinobacillus pleuropneumoniae after repeated administration of Danofloxacin. Front Microbiol. (2018) 9:2445. doi: 10.3389/fmicb.2018.02445
47. Yao Q, Gao L, Xu T, Chen Y, Yang X, Han M, et al. Amoxicillin administration regimen and resistance mechanisms of Staphylococcus aureus established in tissue cage infection model. Front Microbiol. (2019) 10:1638. doi: 10.3389/fmicb.2019.01638
48. Xiong M, Wu X, Ye X, Zhang L, Zeng S, Huang Z, et al. Relationship between cefquinome PK/PD parameters and emergence of resistance of Staphylococcus aureus in rabbit tissue-cage infection model. Front Microbiol. (2016) 7:874. doi: 10.3389/fmicb.2016.00874
49. Zhang B, Gu X, Li Y, Li X, Gu M, Zhang N, et al. In vivo evaluation of mutant selection window of cefquinome against Escherichia coli in piglet tissue-cage model. BMC Vet Res. (2014) 10:1–8. doi: 10.1186/s12917-014-0297-1
50. Greko C, Finn M, Franklin A, Bengtsson B. Pharmacokinetic/pharmacodynamic relationship of danofloxacin against Mannheimia haemolytica in a tissue-cage model in calves. J Antimicrob Chemother. (2003) 52:253–57. doi: 10.1093/jac/dkg339
51. Xiao X, Lan W, Zhao Y, Li R, Liu Y, Liu J, et al. In vivo pharmacokinetic and pharmacodynamic (PK/PD) modeling and establishment of the PK/PD Cutoff of florfenicol against pasteurella multocida in ducks. Front Microbiol. (2021) 11:3321. doi: 10.3389/fmicb.2020.616685
52. Xiao X, Jiang L, Lan W, Jiang Y, Wang Z. In vivo pharmacokinetic/Pharmacodynamic modeling of Enrofloxacin against Escherichia coli in broiler chickens. BMC Vet Res. (2018) 14:1–9. doi: 10.1186/s12917-018-1698-3
53. Xiao X, Pei L, Jiang LJ, Lan WX, Xiao JY, Jiang YJ, et al. In Vivo Pharmacokinetic/Pharmacodynamic profiles of danofloxacin in rabbits infected with Salmonella typhimurium after oral administration. Front Pharmacol. (2018) 9:391. doi: 10.3389/fphar.2018.00391
54. Zeng D, Sun M, Lin Z, Li M, Gehring R, Zeng Z. Pharmacokinetics and pharmacodynamics of tildipirosin against Pasteurella multocida in a murine lung infection model. Front Microbiol. (2018) 9:1038. doi: 10.3389/fmicb.2018.01038
55. Zhang N, Wu Y, Huang Z, Yao L, Zhang L, Cai Q, et al. The PK–PD relationship and resistance development of danofloxacin against Mycoplasma gallisepticum in an In Vivo infection model. Front Microbiol. (2017) 8:926. 10.3389/fmicb.2017.00926
56. Yang Q, Liu X, Zhang C, Yong K, Clifton AC, Ding H, et al. Pharmacokinetics and pharmacodynamics of gamithromycin treatment of Pasteurella multocida in a murine lung infection model. Front Pharmacol. (2019) 10:1090. doi: 10.3389/fphar.2019.01090
57. Nakamura R, Ito-Horiyama T, Takemura M, Toba S, Matsumoto S, Ikehara T, et al. In vivo pharmacodynamic study of cefiderocol, a novel parenteral siderophore cephalosporin, in murine thigh and lung infection models. Antimicrob Agents Chemother. (2019) 63:e02031–18. doi: 10.1128/AAC.02031-18
58. Tashiro S, Hayashi M, Takemura W, Igarashi Y, Liu X, Mizukami Y, et al. Pharmacokinetics/Pharmacodynamics evaluation of flomoxef against extended-spectrum beta-lactamase-producing Escherichia coli in vitro and in vivo in a murine thigh infection model. Pharm Res. (2021) 38:27–35. doi: 10.1007/s11095-020-02977-8
59. Li Y, Xie M, Zhou J, Lin H, Xiao T, Wu L, et al. Increased antimicrobial activity of colistin in combination with gamithromycin against pasteurella multocida in a neutropenic murine lung infection model. Front Microbiol. (2020) 11:2230. doi: 10.3389/fmicb.2020.511356
60. Li X, Chen Y, Xu X, Li Y, Fan Y, Liu X, et al. Pharmacokinetics and pharmacodynamics of nemonoxacin in a neutropenic murine lung infection model against streptococcus pneumoniae. Front Pharmacol. (2021) 12:1050. doi: 10.3389/fphar.2021.658558
61. Watanabe E, Matsumoto K, Ikawa K, Yokoyama Y, Shigemi A, Enoki Y, et al. Pharmacokinetic/pharmacodynamic evaluation of teicoplanin against Staphylococcus aureus in a murine thigh infection model. J Glob Antimicrob Resistance. (2021) 24:83–7. doi: 10.1016/j.jgar.2020.11.014
62. Drusano GL. Role of pharmacokinetics in the outcome of infections. Antimicrob Agents Chemother. (1988) 32:289–97. doi: 10.1128/aac.32.3.289
63. Craig WA. Pharmacokinetic/pharmacodynamic parameters: rationale for antibacterial dosing of mice and men. Clin Infect Dis. (1998) 26:1–10. doi: 10.1086/516284
64. Mouton JW, Dudley MN, Cars O, Derendorf H, Drusano GL. Standardization of pharmacokinetic/pharmacodynamic (PK/PD) terminology for anti-infective drugs. Int J Antimicrob Agents. (2002) 19:355–8. doi: 10.1016/S0924-8579(02)00031-6
65. Mouton JW, Dudley MN, Cars O, Derendorf H, Drusano GL. Standardization of pharmacokinetic/pharmacodynamic (PK/PD) terminology for anti-infective drugs: an update. J Antimicrob Chemother. (2005) 55:601–7. doi: 10.1093/jac/dki079
66. Lees P, Giraudel J, Landoni MF, Toutain PL. PK–PD integration and PK–PD modelling of nonsteroidal anti-inflammatory drugs: principles and applications in veterinary pharmacology. J Vet Pharmacol Ther. (2004) 27:491–502. doi: 10.1111/j.1365-2885.2004.00618.x
67. Meibohm B, Derendorf H. Basic concepts of pharmacokinetic/pharmacodynamic (PK/PD) modelling. Int J Clin Pharmacol Ther. (1997) 35:401–13. doi: 10.1097/00004850-199710006-00006
68. Sumi CD, Heffernan AJ, Lipman J, Roberts JA, Sime FB. What antibiotic exposures are required to suppress the emergence of resistance for Gram-negative bacteria? A systematic review. Clin Pharmacokinet. (2019) 58:1407–43. doi: 10.1007/s40262-019-00791-z
69. Yan L, Xie S, Chen D, Pan Y, Tao Y, Qu W, et al. Pharmacokinetic and pharmacodynamic modeling of cyadox against Clostridium perfringens in swine. Sci Rep. (2017) 7:1–11. doi: 10.1038/s41598-017-03970-9
70. Onufrak NJ, Forrest A, Gonzalez D. Pharmacokinetic and pharmacodynamic principles of anti-infective dosing. Clin Ther. (2016) 38:1930–47. doi: 10.1016/j.clinthera.2016.06.015
71. Girard D, Finegan SM, Dunne MW, Lame ME. Enhanced efficacy of single-dose versus multi-dose azithromycin regimens in preclinical infection models. J Antimicrob Chemother. (2005) 56:365–71. doi: 10.1093/jac/dki241
72. Mouton JW, Brown DFJ, Apfalter P, Cantón R, Giske CG, Ivanova M, et al. The role of pharmacokinetics/pharmacodynamics in setting clinical MIC breakpoints: the EUCAST approach. Clin Microbiol Infect. (2012) 18:E37–E45. doi: 10.1111/j.1469-0691.2011.03752.x
73. Kitamura Y, Yoshida K, Kusama M, Sugiyama Y. A proposal of a pharmacokinetic/pharmacodynamic (PK/PD) index map for selecting an optimal PK/PD index from conventional indices (AUC/MIC, Cmax/MIC, and TAM) for antibiotics. Drug Metab Pharmacokinet. (2014) 29:455–62. doi: 10.2133/dmpk.DMPK-14-RG-013
74. Blondeau JM. New concepts in antimicrobial susceptibility testing: the mutant prevention concentration and mutant selection window approach. Vet Dermatol. (2009) 20:383–96. doi: 10.1111/j.1365-3164.2009.00856.x
75. Blondeau JM, Hansen G, Metzler K, Hedlin P. The role of PK/PD parameters to avoid selection and increase of resistance: mutant prevention concentration. Journal of Chemotherapy. (2004) 16:1–19. doi: 10.1080/1120009X.2004.11782371
76. Drlica K. The mutant selection window and antimicrobial resistance. J Antimicrob Chemother. (2003) 52:11–17. doi: 10.1093/jac/dkg269
77. Drlica K, Zhao X. Mutant selection window hypothesis updated. Clin Infect Dis. (2007) 44:681–8. doi: 10.1086/511642
78. Xilin Z, Drlica K. Restricting the selection of antibiotic-resistant mutant bacteria: measurement and potential use of the mutant selection window. J Infect Dis. (2002) 185:561–5. doi: 10.1086/338571
79. Cui J, Liu Y, Wang R, Tong W, Drlica K, Zhao X. The mutant selection window in rabbits infected with Staphylococcus aureus. J Infect Dis. (2006) 194:1601–8. doi: 10.1086/508752
80. Lozano-Huntelman NA, Singh N, Valencia A, Valencia A, Mira P, Sakayan M, et al. Evolution of antibiotic cross-resistance and collateral sensitivity in Staphylococcus epidermidis using the mutant prevention concentration and the mutant selection window. Evol Appl. (2020) 13:808–23. doi: 10.1111/eva.12903
81. Liang B, Bai N, Cai Y, Wang R, Drlica K, Zhao X. Mutant prevention concentration-based pharmacokinetic/pharmacodynamic indices as dosing targets for suppressing the enrichment of levofloxacin-resistant subpopulations of Staphylococcus aureus. Antimicrob Agents Chemother. (2011) 55:2409–12. doi: 10.1128/AAC.00975-10
82. Alieva KN, Strukova EN, Golikova MV, Portnoy YA, Zinner SH, Firsov AA. Time inside the mutant selection window as a predictor of staphylococcal resistance to linezolid. J Antibiot. (2018) 71:514–21. doi: 10.1038/s41429-017-0016-9
83. Firsov AA, Portnoy YA, Zinner SH. PK/PD-based prediction of “anti-mutant” antibiotic exposures using in vitro dynamic models. In: Antimicrobial Resistance in the 21st Century. Cham: Springer (2018). pp. 643–66.
84. Tängdén T, Martín VR, Felton TW, Nielsen EI, Marchand S, Brüggemann RJ, et al. The role of infection models and PK/PD modelling for optimising care of critically ill patients with severe infections. Intensive Care Med. (2017) 43:1021–32. doi: 10.1007/s00134-017-4780-6
85. Li Y, Feng B, Gu X, Yang D, Zeng Z, et al. Correlation of PK/PD indices with resistance selection for cefquinome against Staphylococcus aureus in an in vitro model. Front Microbiol. (2016) 7:466. doi: 10.3389/fmicb.2016.00466
86. Yang F, Chen P, Wang H, Xing X, Wang S, et al. Comparative minimal inhibitory and mutant prevention concentration of eight antimicrobial agents against Klebsiella pneumoniae. Microbial Drug Resistance. (2021) 28:229–35. doi: 10.1089/mdr.2021.0228
87. Blondeau JM, Fitch SD. Mutant prevention and minimum inhibitory concentration drug values for enrofloxacin, ceftiofur, florfenicol, tilmicosin and tulathromycin tested against swine pathogens Actinobacillus pleuropneumoniae, Pasteurella multocida and Streptococcus suis. PLoS ONE. (2019) 14:e0210154. doi: 10.1371/journal.pone.0210154
88. Nolting A, Costa TD, Rand KH, Derendorf H. Pharmacokinetic-pharmacodynamic modeling of the antibiotic effect of piperacillin in vitro. Pharm Res. (1996) 13:91–96. doi: 10.1023/A:1016085402278
89. Regoes RR, Wiuff C, Zappala RM, Garner KN, Baquero F, Levin BR. Pharmacodynamic functions: a multiparameter approach to the design of antibiotic treatment regimens. Antimicrob Agents Chemother. (2004) 48:3670–76. doi: 10.1128/AAC.48.10.3670-3676.2004
90. Foerster S, Unemo M, Hathaway LJ, Low N, Althaus CL. Time-kill curve analysis and pharmacodynamic modelling for in vitro evaluation of antimicrobials against Neisseria gonorrhoeae. BMC Microbiol. (2016) 16:1–11. doi: 10.1186/s12866-016-0838-9
91. Chauzy A, Ih H, Jacobs M, Marchand S, Grégoire N, Couet W, et al. Sequential time-kill: a simple experimental trick to discriminate between PK/PD models with distinct heterogeneous sub-populations versus homogenous population with adaptive resistance. Antimicrob Agents Chemother. (2020) 64:e00788–20. doi: 10.1128/AAC.00788-20
92. Nielsen EI, Friberg LE. Pharmacokinetic-pharmacodynamic modeling of antibacterial drugs. Pharmacol Rev. (2013) 65:1053–90. doi: 10.1124/pr.111.005769
93. Mi K, Zhou K, Sun L, Hou Y, Ma W, Xu X, et al. Application of semi-mechanistic pharmacokinetic and pharmacodynamic model in antimicrobial resistance. Pharmaceutics. (2022) 14:246. doi: 10.3390/pharmaceutics14020246
94. Grégoire N, Raherison S, Grignon C, Comets E, Marliat M, Ploy M, et al. Semimechanistic pharmacokinetic-pharmacodynamic model with adaptation development for time-kill experiments of ciprofloxacin against Pseudomonas aeruginosa. Antimicrob Agents Chemother. (2010) 54:2379–84. doi: 10.1128/AAC.01478-08
95. Sy SK, Zhuang L, Xia H, Beaudoin ME, Schuck VJ, Nichols WW, et al. A mathematical model-based analysis of the time-kill kinetics of ceftazidime/avibactam against Pseudomonas aeruginosa. J Antimicrob Chemother. (2018) 73:1295–304. doi: 10.1093/jac/dkx537
96. van Os W, Zeitlinger M. Predicting antimicrobial activity at the target site: pharmacokinetic/pharmacodynamic indices versus time–kill approaches. Antibiotics. (2021) 10:1485. doi: 10.3390/antibiotics10121485
97. Kristoffersson AN, Bissantz C, Okujava R, Haldimann A, Walter I, Shi T, et al. A novel mechanism-based pharmacokinetic–pharmacodynamic (PKPD) model describing ceftazidime/avibactam efficacy against β-lactamase-producing Gram-negative bacteria. J Antimicrob Chemother. (2020) 75:400–8. doi: 10.1093/jac/dkz440
98. Thorsted A, Tano E, Kaivonen K, Sjölin J, Friberg LE, Nielsen EI. Extension of pharmacokinetic/pharmacodynamic (PK/PD) time-kill studies to include LPS/endotoxin release from E. coli exposed to cefuroxime. Antimicrob Agents Chemother. (2020) 64:e02070–19. doi: 10.1128/AAC.02070-19
99. Ferro B E, van Ingen J, Wattenberg M, van Soolingen D, Mouton JW. Time–kill kinetics of antibiotics active against rapidly growing mycobacteria. J Antimicrob Chemother. (2015) 70:811–7. doi: 10.1093/jac/dku431
100. Zhang N, Gu X, Ye X, Wu X, Zhang B, Zhang L, et al. The PK/PD interactions of doxycycline against Mycoplasma gallisepticum. Front Microbiol. (2016) 7:653. doi: 10.3389/fmicb.2016.00653
101. Zhang L, Xie H, Wang H, Ding H, Zhang G, Hu J. Kill rate and evaluation of ex vivo PK/PD integration of cefquinome against Actinobacillus pleuropneumoniae. Front Vet Sci. (2021) 8:751957. doi: 10.3389/fvets.2021.751957
Keywords: kill rate, mutant prevention concentration, PK/PD integration model, PD parameter, time-kill curve, MIC, multi-drug resistance, dosage regimen
Citation: Zhang L, Xie H, Wang Y, Wang H, Hu J and Zhang G (2022) Pharmacodynamic Parameters of Pharmacokinetic/Pharmacodynamic (PK/PD) Integration Models. Front. Vet. Sci. 9:860472. doi: 10.3389/fvets.2022.860472
Received: 23 January 2022; Accepted: 24 February 2022;
Published: 24 March 2022.
Edited by:
Valentina Meucci, University of Pisa, ItalyReviewed by:
Pierre-Louis Toutain, Ecole Nationale Vétérinaire de Toulouse, FranceTed Whittem, James Cook University, Australia
Copyright © 2022 Zhang, Xie, Wang, Wang, Hu and Zhang. This is an open-access article distributed under the terms of the Creative Commons Attribution License (CC BY). The use, distribution or reproduction in other forums is permitted, provided the original author(s) and the copyright owner(s) are credited and that the original publication in this journal is cited, in accordance with accepted academic practice. No use, distribution or reproduction is permitted which does not comply with these terms.
*Correspondence: Jianhe Hu, amlhbmhlaHVAeWVhaC5uZXQ=; amlhbmhlaHVAMTI2LmNvbQ==; Gaiping Zhang, emhhbmdnYWlwaW5nMjAwM0AxNjMuY29t