 Yue Liu
 Hao Wu
 Wanbao Chen
 Chang Liu
 Zhenming Zhou
94% of researchers rate our articles as excellent or good
Learn more about the work of our research integrity team to safeguard the quality of each article we publish.
Find out more
ORIGINAL RESEARCH article
Front. Vet. Sci. , 25 March 2022
Sec. Animal Nutrition and Metabolism
Volume 9 - 2022 | https://doi.org/10.3389/fvets.2022.812861
This article is part of the Research Topic Microbial Metabolomics View all 7 articles
Feed cost is the greatest expense during cattle production; therefore, reducing it is critical to increasing producer profits. In ruminants, the microbial population is important to nutrient digestion and absorption in the rumen. The objective of this study was to investigate the relationships among rumen bacteria, rumen metabolites, and the residual feed intake (RFI) phenotype of beef cattle. Twelve Angus heifers were selected to be sampled and divided into high RFI (HRFI; n = 6) group and low RFI (LRFI; n = 6) group according to their RFI classification determined during the feedlot-finishing period. After the ruminal liquid samples were collected at slaughter, Illumina MiSeq sequencing of the 16S rRNA V3-V4 region and liquid chromatography-mass spectrometry (LC-MS) were performed to determine their bacterial composition and metabolites, respectively. At the phylum level, the relative abundance of Proteobacteria was higher in the LRFI group than in the HRFI group (P < 0.01). At the family level, the relative abundances of Rikenellaceae (P < 0.01), Ruminococcaceae, Bacteroidales_S24-7_group, and Lachnospiraceae (P < 0.05) were significantly higher in the LRFI group. At the genus level, the relative abundances of Rikenellaceae_RC9_gut_group and Ruminiclostridium_1 were higher in the LRFI group (P < 0.01), as were the relative abundances of norank_f__Bacteroidales_S24-7_group, Lachnospiraceae_ND3007_group, and Lachnospiraceae_NK3A20_group (P < 0.05). Moreover, the genera Rikenellaceae_RC9_gut_group, Ruminococcaceae_NK4A214_group, Christensenellaceae_R-7_group, Ruminococcaceae_UCG-010, Lachnospiraceae_ND3007_group, Ruminiclostridium_1, and Lachnospiraceae_NK3A20_group were negatively associated with the RFI; both foundational and key species are associated with feed efficiency phenotype. In addition, rumen metabolomics analysis revealed that the RFI was associated with significantly altered concentrations of rumen metabolites involved in protein digestion and absorption, Linoleic acid metabolism, Lysine degradation, and Fatty acid degradation. Correlation analysis revealed the potential relationships between the significantly differential ruminal metabolites and the genera ruminal bacteria. The present study provides a better understanding of rumen bacteria and metabolites of beef cattle with different RFI phenotypes and the relationships among them, which are potentially important for the improvement of beef cattle feed efficiency.
In beef cattle production systems, feed costs represent about 60–75% of the total cost (1), requiring beef cattle producers to pay attention to the feed efficiency trait (2). The traditional expression method is the relationship between beef cattle weight gain and feed intake, such as the Gain-to-Feed Ratio (G/F) and the Feed-to-Gain Ratio (F/G). These are the ratio of two traits; therefore, there are some problems in their practical application. For example, the G/F will have the same genetic background but with low consumption and low output, and high consumption and high output, and these two types of individuals will have huge differences. While the F/G, individuals with lower feed conversion rate (FCR) grow faster because they maintain their basal metabolism and energy needs by increasing their food intake (3). In view of this, the concept of residual feed intake (RFI) was proposed by Koch et al. (4). RFI is defined as the difference between the actual dry matter intake (DMI) and the predicted DMI based on body size and growth (1, 5). RFI correlates significantly with the FCR and DMI, but not with the average daily gain (ADG) (6), indicating that the RFI is independent of animal body weight gain and growth rate. Moreover, RFI is a negative selection trait (7), the lower RFI, the higher the feed efficiency. Animals with a low RFI (LRFI) typically consume less feed than animals with a high RFI (HRFI) (6), resulting in maximized profitability of the beef industry (1). Some studies have demonstrated that LRFI animals not only have greater diet digestibility, but also lower methane emissions (8), thus selection for LRFI might also be a great strategy for greenhouse gas mitigation. Additionally, the RFI has moderate heritability: 0.18–0.43 (7), suggesting that it is also influenced by non-genetic factors (9).
Rumen microbial fermentation produces volatile fatty acids (VFAs) and microbial proteins (10), among which VFAs provide ~70% of the energy required by the host (11). Nkrumah et al. (5) observed that the energy metabolism of beef cattle with different RFIs was significantly different. Herd and Arthur (8) reported that ruminant digestion and rumen fermentation can explain 19% of RFI changes. These results indicated that the rumen microbial population composition might be related to the RFI phenotypes. Later, studies showed that there is indeed a correlation between the rumen microbiome and the RFI phenotype in dairy cows (12–14) and beef cattle (15). However, the correlation between bacteria and RFI phenotype is controversial. Furthermore, Paz et al. (16) reported that the rumen microbiome could explain about 20% of the changes in feed efficiency traits of beef steers. Although links between the rumen microbiome and host feed efficiency have been identified, the mechanisms driving these changes are unclear, and it is unknown whether foundational or keystone species are responsible for the phenotypic differences in feed efficiency. Additionally, rumen microbes produce metabolites, which are released into the rumen lumen and are absorbed through the rumen epithelium or the epithelium in the small intestinal tract (17). For these metabolites, differences in their production, as well as variation in their absorption, might result in variation in nutrient utilization and efficiency of ruminants, ultimately leading to physiological or phenotypic changes (18, 19). To date, for RFI phenotypes in beef cattle, experiments aiming to determine the relationships among the RFI phenotype, rumen microbiota, and metabolites are yet to be undertaken.
The aim of this study was to identify the relationships among the RFI phenotype of Angus heifers, rumen microbiota, and rumen metabolites. We hypothesized that beef cattle with different RFI values would have distinct rumen bacteria and metabolites, and potential relationships might be between rumen bacteria and metabolites.
The Angus heifers used in this study were maintained according to the guidelines of the Laboratory Animal Welfare and Animal Experiment Ethical Committee of China Agricultural University (Protocol No. AW08059102-2). Forty-two Angus heifers (410 ± 25 kg body weight, aged 15 months) were fed with a diet containing 50% concentrate and 50% forage (Supplementary Table 1) for 144 days (21 days of adaptation to feedlot diet and the environment, followed by 123 days of data collection) according to NRC (20). During the experiment, all conditions were consistent. Feeding tank automatic identification of each animal's electronic ear tag, which records feed intake per time (Zhenghong Agriculture and Animal Husbandry Machinery and Equipment Co, Shanghai, China) was used to obtain the daily feed intake of each animal. All heifers had ad libitum access to water and feed during the experimental period. Weight measurements of all heifers were performed at the beginning and the end of the experiment as well as at 14-d intervals for 123 d. Each heifer's average daily gain (ADG) during the experiment was computed as the coefficient of the linear regression of body weight (BW; kg) on time (d) using the PROC REG component of the SAS package (SAS Inst., Inc., Cary, NC, USA). The metabolic body weight (MBW) of each heifer over the experimental period was computed as the midtest BW0.75 of the 123-d test (21). The total actual DMI of each heifer was divided by the test period of 123 d to give an average actual DMI. The expected DMI of each heifer over the test period was modeled and predicted by using the MBW, ADG and actual DMI with PROC REG (21). The residual feed intake (RFI) was defined as the difference between the actual and expected DMI using the following model (22):
in which β0 is the y-intercept, β1 is the regression coefficient of MBW, β2 is the regression coefficient of ADG, and ε is the RFI. RFI Standard deviations above and below the mean were used to group animals into high (> 0.5 SD) and low RFI (<0.5 SD) groups (21).
Heifers were ordered based on their RFI values, and the six least efficient (HRFI) and the six most efficient (LRFI) heifers were selected. Specifically, the RFI values and animal performance can be found in Table 1, Supplementary Table 2, and Supplementary Table 3. Heifers had ad libitum access to water but were fasted prior to slaughter the following morning. After slaughter, the ruminal liquid samples were collected from the ruminal ventral sac. The pH was measured using a portable pH meter (PHS-3C, Shanghai Leici Instrument Factory, Shanghai, China) immediately. One hundred milliliters of the samples were centrifuged at 10,000 × g for 10 min at 4°C to obtain the supernatant, which was used to determine the concentration of NH3-N and VFAs using a spectrophotometer (UV-VIS 8500, Tianmei Scientific Instrument Co., Shanghai China) and gas chromatography (SP-3420, Beijing Analytical Instrument Factory, Beijing, China), respectively. The other parts of samples were frozen immediately in liquid nitrogen, and stored at −80°C until subsequent microbial DNA extraction and metabolomic analysis.
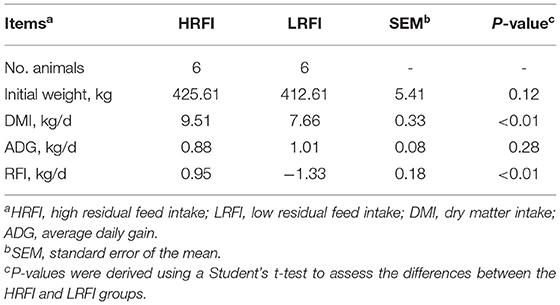
Table 1. Performance of Angus heifers according to RFI groups.
Microbial DNA of 12 ruminal liquid samples was extracted from the rumen samples using an E.Z.N.A.® soil DNA Kit (Omega Bio-tek, Norcross, GA, USA) following the manufacturer's protocols. The V3–V4 hypervariable regions of the bacterial 16S rRNA gene were amplified using the primer pairs 338F (5′- ACTCCTACGGGAGGCAGCAG-3′) and 806R (5′-GGACTACHVGGGTWTCTAAT-3′) in a thermocycler PCR system (GeneAmp 9700, ABI, Foster City, CA, USA). All PCR reactions were performed in triplicate in a total reaction volume of 20 μl, containing 4 μl of 5 × FastPfu Buffer, 10 ng of DNA, 2 μl of 2.5 mM dNTPs, 0.8 μl of each Forward Primer (5 μM) and Reverse Primer (5 μM), 0.4 μl of FastPfu Polymerase, and 0.2 μl of bovine serum albumin (BSA). After electrophoresis, the amplified products were extracted from 2% agarose gels, purified using an AxyPrep DNA Gel Extraction Kit (Axygen Biosciences, Union City, CA, USA), and quantified using QuantiFluor™-ST (Promega, Madison, WI, USA) following the manufacturer's protocols. Paired-end sequencing libraries (2 ×300 bp) were constructed by Majorbio Bio-Pharm Technology Co. Ltd. (Shanghai, China). Purified amplicons were pooled in equimolar amounts and all libraries were sequenced on an Illumina MiSeq platform (Illumina, San Diego, CA, USA) at Majorbio Bio-Pharm Technology Co. Ltd. according to standard protocols (23).
The raw sequences obtained from the MiSeq platform were quality-filtered using fastp version 0.20.0 (24) and merged using FLASH version 1. 2. 7 (25) with the following criteria: (1) The reads were truncated at any site receiving an average quality score of <20 over a 50-bp sliding window; (2) sequences were merged with overlaps longer than 10 bp (maximum error ratio = 0.2); (3) sequences of each sample were separated according to barcodes (exactly matching) and primers (allowing two nucleotide mismatches), and reads containing ambiguous characters were discarded. Sequences were binned into operational taxonomic units (OTUs) at 97% similarity using UPARSE version 7.1 with a confidence threshold of 0.70, and the taxonomy of each OTU representative sequence was analyzed using the RDP Classifier version 2.2 against the Silva 128/16S_bacteria database (26, 27). Chimera-filtering and OTU-clustering were performed simultaneously using a novel “greedy” algorithm (28, 29). Analyses was performed using the Majorbio I-Sanger Cloud Platform (www.i-sanger.com). Alpha diversity indexes were assessed using MOTHUR version v.1.30.1 (30). The bar graphs were analyzed using the “vegan” package in the R software (31). Beta-diversity was estimated by computing the Bray_Curtis distance, calculated as similarities (ANOSIM) (999 permutations), and visualized using principal coordinate analysis (PCoA) by the “vegan” package in R (31). Significant differences in the abundance of the microbiota at the phylum, family, and genera levels between the high residual feed intake (HRFI) and low residual feed intake (LRFI) groups were identified using Student's t-test and by false discovery rate (FDR) multiple check calibration by the stats package in R, together with the scipy package in python (32–34).
All rumen samples were analyzed using the LC-MS platform (Thermo Ultimate 3000LC, Q Exactive; ThermoFisher Scientific, Waltham, MA, USA). Briefly, 100 μl of each sample was weighed accurately, then 400 μl of methanol/water (4:1 v/v) was used to extract the metabolites. The mixture was allowed to settle at −20°C, treated using a high throughput tissue grinder (Wonbio-96, Shanghai Wanbo biotechnology Co., Ltd., Shanghai, China) at 50 Hz for 6 min, vortexed for 30 s, and then with ultrasound at 40 kHz for 30 min at 5°C. The samples were incubated at −20°C for 30 min. After centrifugation at 13,000 × g for 15 min at 4°C, the supernatant was used for LC-MS/MS analysis. Chromatographic separation of the metabolites was performed on the ExionLCTMAD system (AB Sciex, Framingham, MA, USA) equipped with an ACQUITY UPLC HSS T3 column (100 ×2.1 mm i.d., 1.8 μm particle size; Waters, Milford, MA, USA). The mobile phases consisted of solvent A: 0.1% formic acid in water with formic acid (0.1%) and solvent B: acetonitrile 50% and isopropyl alcohol 50% with 0.1% formic acid. The solvent gradient of the mobile phase (A:B) consisted of the following: from 0 to 3 min, 95%:5% to 80%:20%; from 3 to 9 min, 80%:20% to 5%:95%; from 9 to 13 min, 5%:95% to 5%:95%; from 13.0 to 13.1 min, 5%:95% to 95%:5%; and from 13.1 to 16.0 min, 95%:5% to 95%:5% to equilibrate the system. The UPLC system was coupled to a quadrupole-time-of-flight mass spectrometer (Triple TOFTM5600+, AB Sciex) equipped with an electrospray ionization (ESI) source. The source temperature was 500°C, the curtain gas (CUR) was 30 psi, on-spray voltage floating (ISVF) was carried out in negative mode (−4000 V) and positive mode (5000 V), the declustering potential was 80 V, and the MS/MS rolling was 20–60 V. To test the repeatability of the system, quality control (QC) samples prepared by mixing equal volumes of all ruminal liquid were injected at regular intervals.
Raw data from the UPLC/MS analysis were first imported into the Progenesis QI 2.3 format (Nonlinear Dynamics, Waters) for baseline filtering, peak recognition, integration, retention time correction, and peak alignment. Finally, a data matrix of retention time, mass charge ratio, and peak intensity was obtained. For the missing values, at least 50% of the metabolic features of samples were retained, the vacancy values were filled (the minimum value in the original matrix), and the metabolic features were normalized by the summation normalization method. After discarding the relative standard deviation (RSD) of QC >30%, the final matrix was obtained. Then, statistical analysis was performed on log10 transformed data to identify significant differences in metabolite levels between groups. All data were visualized between the HRFI and LRFI groups using principle component analysis (PCA), followed by orthogonal partial least squares discriminant analysis (O)PLS-DA with Student's t-test and the following screening criteria: Variable importance in the projection (VIP) values > 1.0, difference multiple [fold change (FC)] > 1.0 or FC <1.0 and P <0.05 to obtain significantly differentially abundant metabolites between the LRFI and HRFI groups. Additionally, significantly differentially abundant metabolites were analyzed for abundance pattern clustering using the gplots package in R (35). The impact of the RFI on metabolic pathways and metabolite set enrichment were analyzed using the Stats package in R and the scipy package in python (32, 33). Correlations among the rumen genera bacteria, significantly differentially abundant rumen metabolites, and the RFI phenotype were assessed using Spearman's correlation analysis in the pheatmap package in R (36).
Table 1 shows the growth performance of HRFI and LRFI heifers during the experimental period. At the beginning of the experiment, the HRFI and LRFI heifers were not different in initial weight (P = 0.12). However, the LRFI heifers had a lower DMI and lower RFI value compared with the HRFI heifers (P <0.01).
The ruminal liquid pH; the concentrations of NH3-N and the total VFAs (TVFAs); the proportion of acetate, propionate, butyrate, valerate, isobutyrate, and isovalerate; and the ratio of acetate:propionate (AP) of the Angus heifers did not vary between the HRFI and LRFI groups (P > 0.05; Table 2).
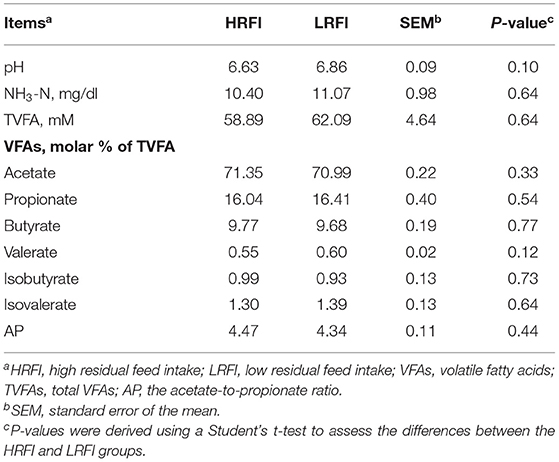
Table 2. Rumen fermentative parameters of Angus heifers according to RFI groups.
In total, 657,130 raw bacterial sequences were obtained from 12 samples. After quality control to an equal sequencing depth (24,226 reads per sample) and clustering, we obtained 1,908 OTUs at the 97% similarity level, which were assigned to 19 phyla, 37 classes, 62 orders, 94 families, and 214 genera. Good's coverage after normalization for the samples was > 98.8% for the bacterial community, indicating sufficient sequence coverage for the samples. Chao1's richness, Shannon's diversity, and Simpson's diversity of Alpha diversity demonstrated that the bacterial community of Angus heifers did not vary between the RFI groups (P > 0.05; Supplementary Table 4). The PCoA plot showed bacterial communities clustered by RFI phenotype, which clearly demonstrated the distinct bacterial community structure in the HRFI and LRFI groups (Figure 1), indicating that the RFI phenotype influences the bacterial community composition.
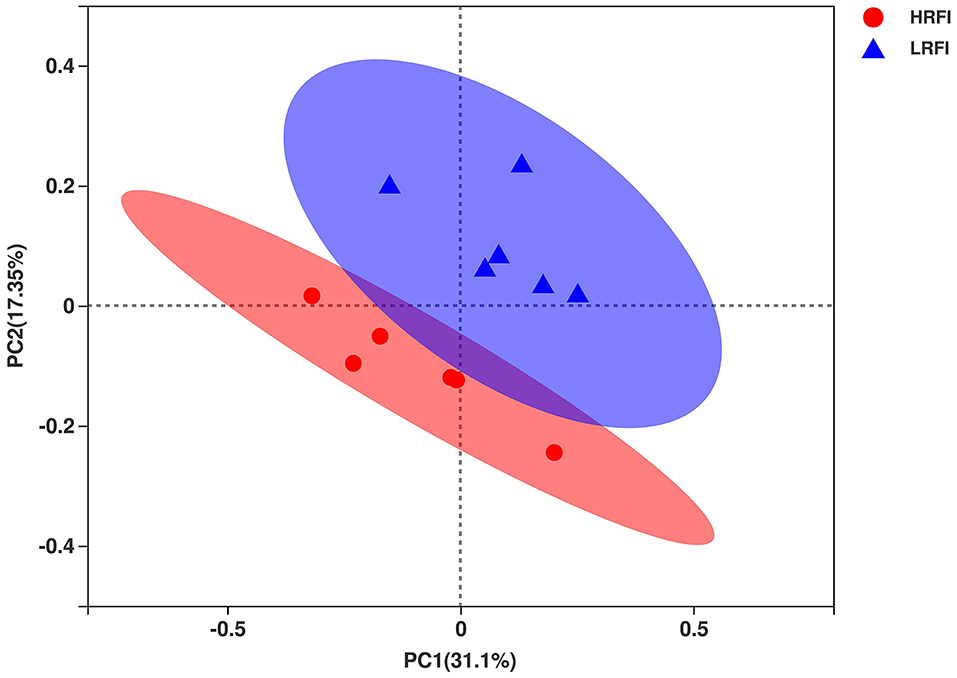
Figure 1. The principal coordinate analysis (PCoA) of the ruminal bacterial communities. Individual points represent a ruminal sample and colors represent RFI groups.
The bacterial community was dominated by the phyla Bacteroidetes (66.71%, 61.65%) and Firmicutes (28.27%, 33.89%) in the HRFI group and LRFI group, respectively (Supplementary Figure 1A). The most abundant families in the HRFI group included the Prevotellaceae (36.52%), Rikenellaceae (11.55%), and Ruminococcaceae (10.67%). By contrast, the Prevotellaceae (20.10%), Rikenellaceae (18.57%), Ruminococcaceae (14.50%) and Bacteroidales_BS11_gut_group (12.18%) were present in the greatest abundance in the LRFI group (Supplementary Figure 1B). At the genus level, the predominant genera in the HRFI group were Prevotella_1 (29.18%) and Rikenellaceae_RC9_gut_group (11.00%), while in the LRFI group, the predominant genera were Rikenellaceae_RC9_gut_group (17.62%), Prevotella_1 (14.48%), and norank_f_Bacteroidales_BS11_gut_group (12.18%) (Supplementary Figure 1C).
At the phylum level (Figure 2A), the relative abundance of Proteobacteria (0.48%, 0.94%) was higher in the LRFI group (P <0.01). At the family level (Figure 2B), the relative abundance of Rikenellaceae (11.55%, 18.57%; P <0.01), Ruminococcaceae (10.67%, 14.50%; P <0.05), Bacteroidales_S24-7_group (4.49%, 7.64%; P <0.05), Lachnospiraceae (4.22%, 7.34%; P <0.05) were higher in the LRFI group, while the relative abundances of Prevotellaceae (36.52%, 20.10%) and Bacteroidales_UCG-001 (1.12%, 0.61%) tended to be higher in the HRFI group (P <0.10). At the genus level (Figure 2C), the relative abundances of Rikenellaceae_RC9_gut_group (11.01%, 17.62%; P <0.01), Ruminiclostridium_1 (0.15%, 0.36%; P <0.01), norank_f__Bacteroidales_S24-7_group (4.49%, 7.64%; P <0.05), Lachnospiraceae_ND3007_group (0.39%, 0.97%; P <0.05), and Lachnospiraceae_NK3A20_group (0.15%, 0.29%; P <0.05) were higher in the LRFI group. Moreover, the relative abundances of Ruminococcaceae_NK4A214_group (2.24%, 3.19%), and Ruminococcaceae_UCG-010 (1.47%, 2.09%) tended to be higher in the LRFI group (P <0.10), while the relative abundances of Prevotella_1 (29.18%, 14.48%), and Prevotellaceae_UCG-003 (3.47%, 2.53%) tended to be higher in the HRFI group (P <0.10).
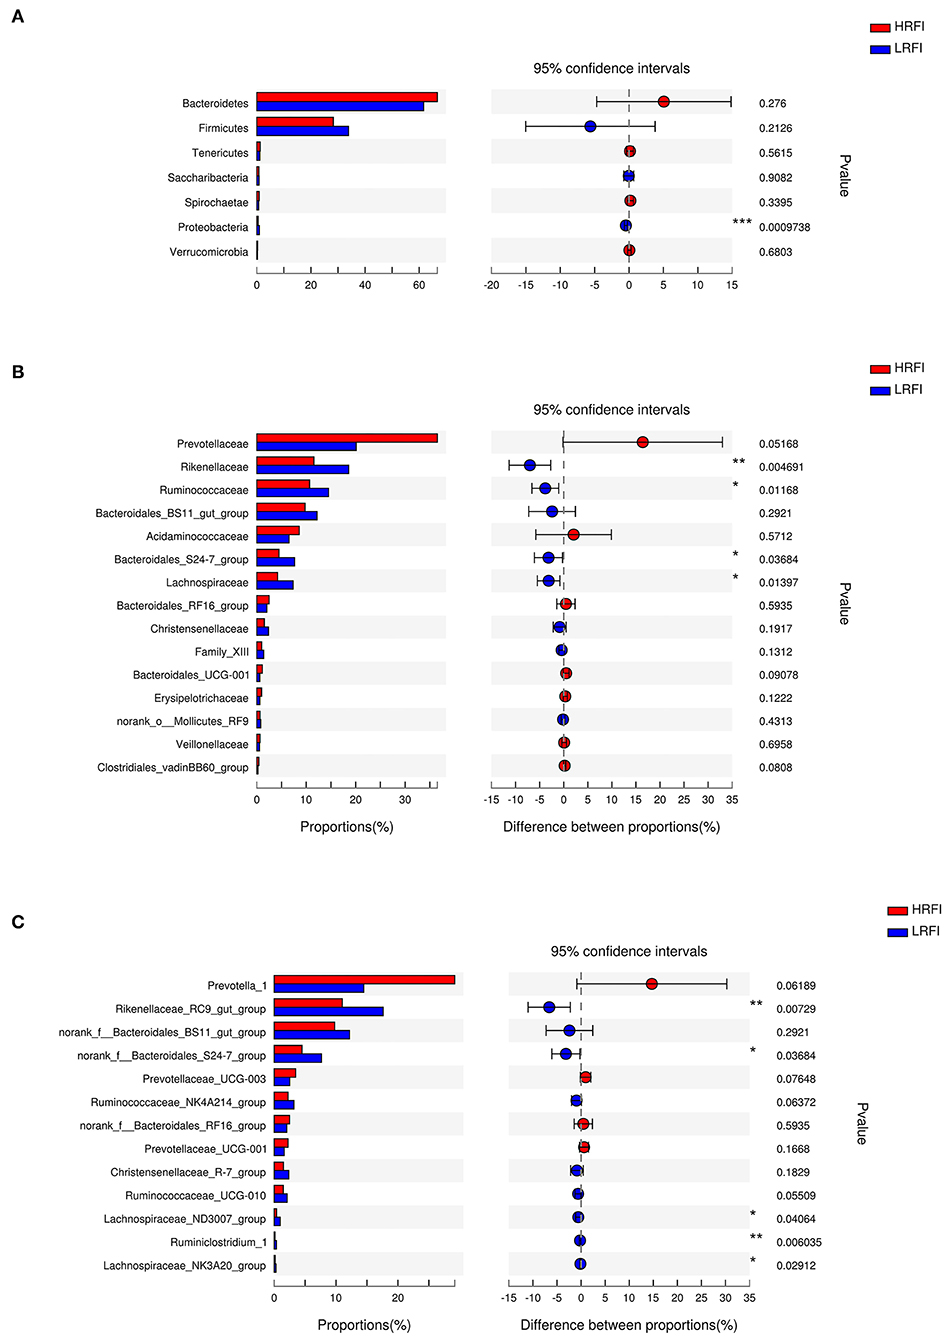
Figure 2. Classification of the ruminal bacterial community composition across the HRFI and LRFI groups. Extended error bar plot showing the significantly different phyla (A), families (B), and genera (C) (relative abundance > 0.1% for all samples). Positive and negative differences indicate a greater abundance in the HRFI group and LRFI group, respectively. Asterisks indicate significant difference between the HRFI and LRFI groups (***P ≤ 0.001, **0.001 < P ≤ 0.01; *0.01 < P ≤ 0.05).
The overlap of the total ion chromatogram of the QC sample in the positive (A) and negative (B) ion modes are shown in Supplementary Figure 2. The results confirmed the stability and reproducibility of the data obtained in this study. PCA provided a satisfactory separation of the data between the two groups (Supplementary Figures 3A,B, respectively). Validation plots in Figure 3 show the parameters for the assessment of the OPLS-DA model quality in discriminating the HRFI and LRFI groups. All the samples in the plots were within the 95% Hotelling T2 ellipse, while only one sample in the HRFI group was outside the ellipse. The permutation test of the group was in a better range, with the R2-value of 0.864 indicating moderate effectiveness of the model.
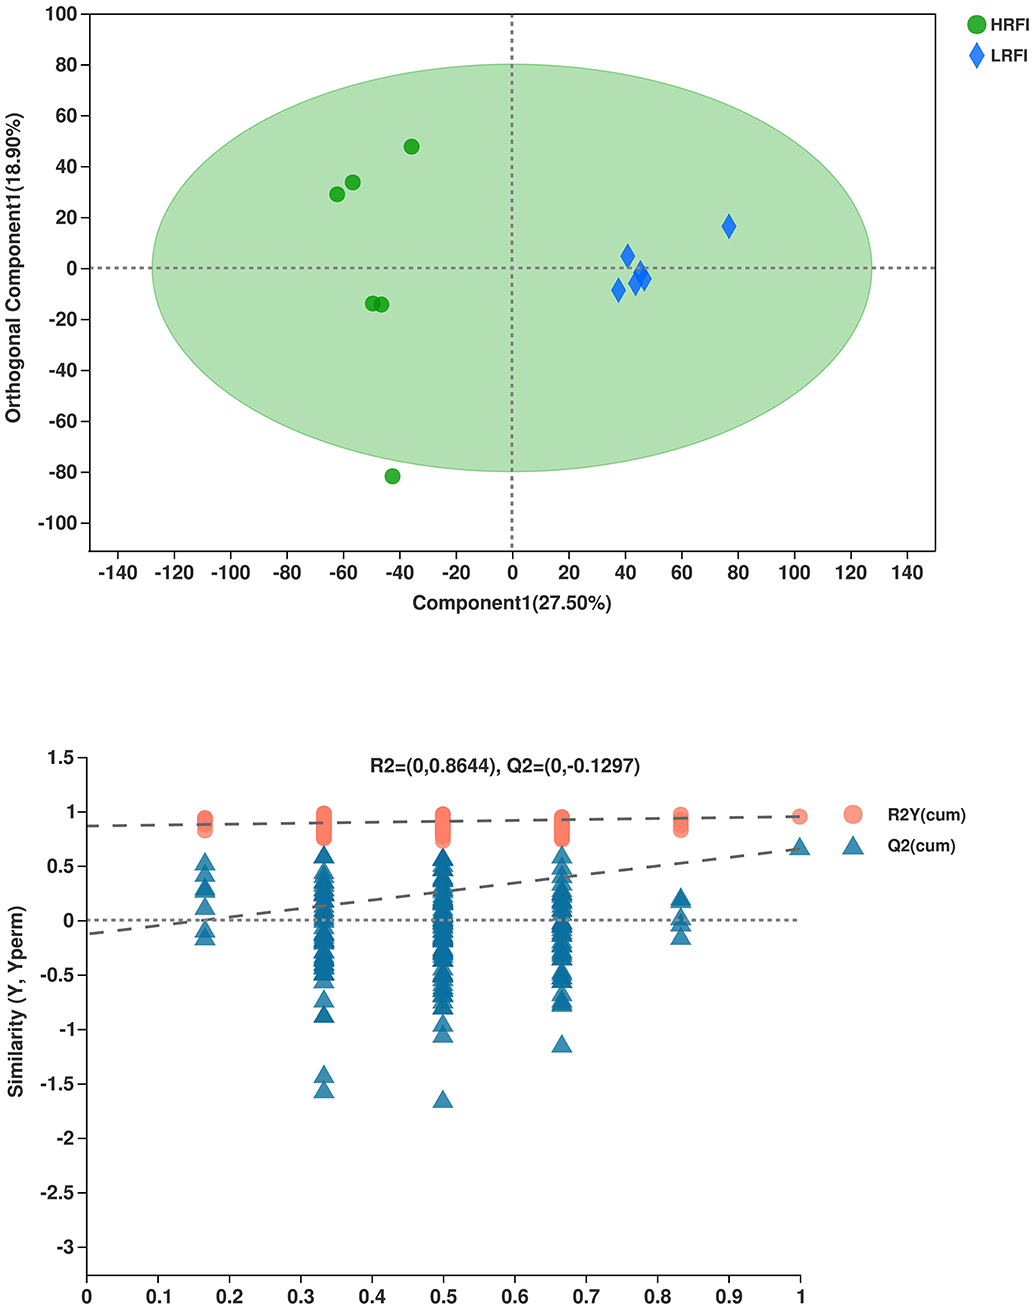
Figure 3. The orthogonal partial least squares discriminant analysis (OPLS-DA) plot of rumen metabolites in comparisons of the HRFI and LRFI groups.
As shown in Table 3, there were 11 common differential metabolites between the LRFI and HRFI groups, which were identified using a VIP threshold of one (P <0.05). Among the 11 metabolites, four were classified as associated with protein digestion and absorption, three with linoleic acid metabolism, three with Lysine degradation, and one with fatty acid degradation.
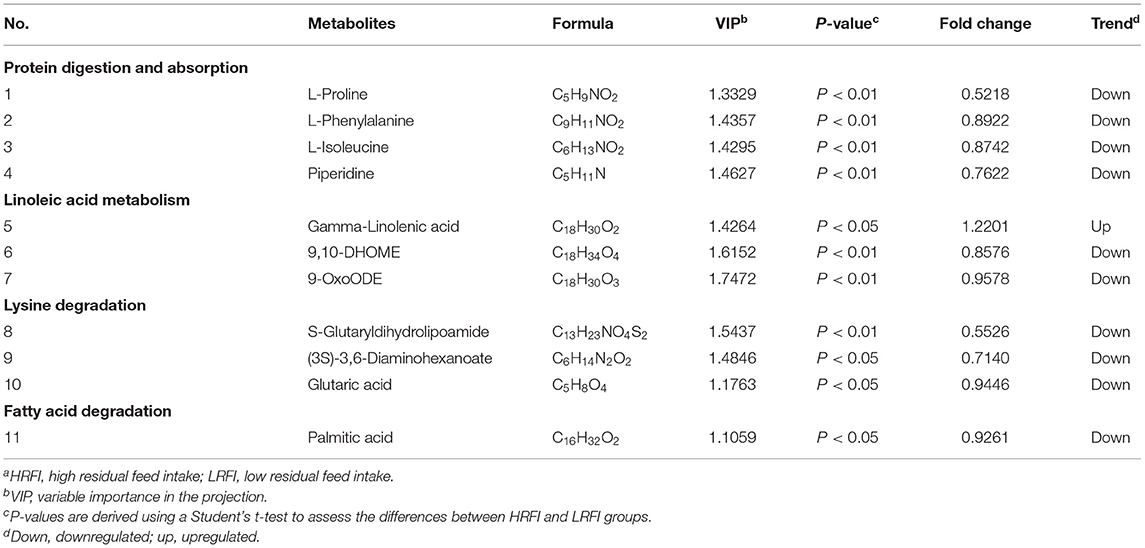
Table 3. Significantly differentially ruminal metabolites of Angus heifers in the comparison between the LRFI and HRFI groupsa.
As shown in Figure 4, among the bacterial communities with a relatively high abundance and significantly differential bacteria at the genus level in the LRFI group, the genera Rikenellaceae_RC9_gut_group, Ruminococcaceae_NK4A214_group, Christensenellaceae_R-7_group, Ruminococcaceae_UCG-010, Lachnospiraceae_ND3007_group, Ruminiclostridium_1, and Lachnospiraceae_NK3A20_group were negatively associated with the RFI. Piperidine, 9,10-DHOME, S-Glutaryldihydrolipoamide, and Glutaric acid were positively associated with the genera Prevotella_1. The genus Rikenellaceae_RC9_gut_group was negatively associated with L-Proline, L-Isoleucine, L-Phenylalanine, Piperidine, Palmitic Acid, 9,10-DHOME, S-Glutaryldihydrolipoamide, and Glutaric acid. The genus Ruminococcaceae_NK4A214_group was negatively associated with L-Proline, Piperidine, Palmitic Acid, 9,10-DHOME, and S-Glutaryldihydrolipoamide. S-Glutaryldihydrolipoamide and Glutaric acid was negatively associated with the genera Christensenellaceae_R-7_group. The genus Prevotellaceae_UCG-001 was positively associated with L-Isoleucine, L-Phenylalanine, Piperidine, Palmitic Acid, 9,10-DHOME, and S-Glutaryldihydrolipoamide. (3S)-3,6-Diaminohexanoate, 9-OxoODE, L-Proline, L-Isoleucine, L-Phenylalanine, Piperidine, 9,10-DHOME, S-Glutaryldihydrolipoamide, and Glutaric acid was negatively associated with the genus Ruminococcaceae_UCG-010. The genus norank_f__Bacteroidales_UCG-001 was positively associated with 9-OxoODE and Palmitic Acid, but negatively associated with Gamma-Linolenic acid. Gamma-Linolenic acid was negatively associated with the genera norank_f__Bacteroidales_UCG-001 and Prevotellaceae_UCG-001, while positively associated with the genera Rikenellaceae_RC9_gut_group, Ruminococcaceae_NK4A214_group, Lachnospiraceae_ND3007_group, Ruminiclostridium_1, and Lachnospiraceae_NK3A20_group. The genera Lachnospiraceae_ND3007_group, Ruminiclostridium_1, and Lachnospiraceae_NK3A20_group were all negatively associated with 9,10-DHOME, and S-Glutaryldihydrolipoamide. The genera Lachnospiraceae_ND3007_group and Lachnospiraceae_NK3A20_group were both negatively associated with 9-OxoODE, moreover, the genus Lachnospiraceae_NK3A20_group was negatively associated with Palmitic Acid.
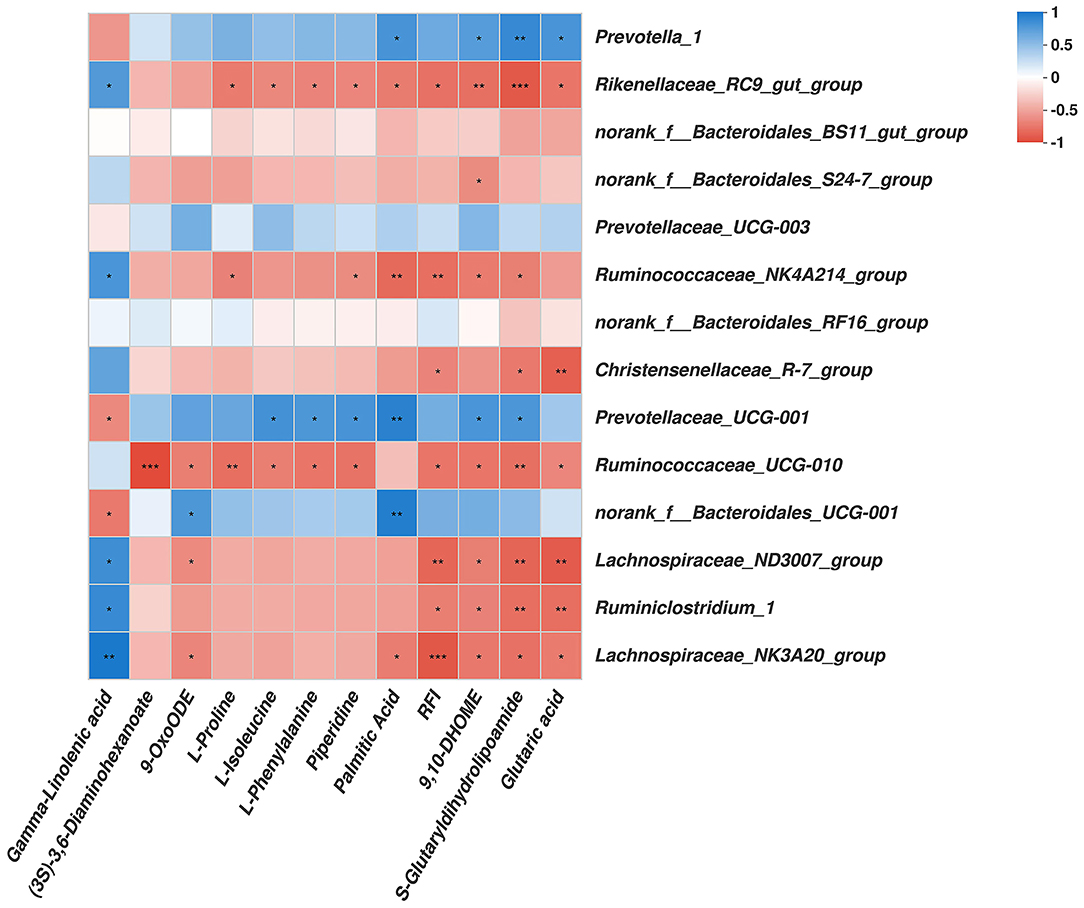
Figure 4. Correlation analysis among rumen genera bacteria, rumen metabolites affected by RFI, and the RFI. Cells are colored based on Spearman's correlation coefficient: Blue represents a positive correlation; red represents a negative correlation. Significant correlation: ***P ≤ 0.001, **0.001 < P ≤ 0.01; * 0.01 < P ≤ 0.05.
As expected, the LRFI animals consumed less feed during the feedlot period, consistent with reports on steer performance (15). Improving feed efficiency is critical, because feed costs are the greatest driver of the profitability of beef production (37). Therefore, it is imperative that we select LRFI cattle that consume less feed without affecting their ADG, resulting in maximized profitability of the beef industry (1).
The rumen microbiota mediates the energy available to the host ruminant through its fermentative activity, which suggests that it plays a role in feed efficiency (38). Shabat et al. (14) reported that efficient dairy cows had higher total VFAs than inefficient animals. Despite this, the present study did not detect a difference in rumen fermentative parameters between the HRFI heifers and the LRFI heifers, which agrees with the results of Welch et al. (15) in steers. Also, previous studies observed no relationship between rumen fermentation traits and the RFI phenotype of steers with different breeds. Interestingly, these results indicated that the dietary phase has a more pronounced influence on bacterial fermentation traits than the RFI phenotype (38, 39). Therefore, we speculated that the role of microorganisms would be more significant in the absorption of VFAs of the rumen epithelium in this study. Moreover, as described in the previous studies by Stewart et al. (40) and Bryant (41), ruminal VFA concentrations continued to decrease after fasting, especially a rapid decrease after feeding for 4 to 6 h, which explains our result that the rumen VFA concentration was lower than anticipated, because rumen liquid samples collected before morning feeding (15).
Unlike other studies that found lower diversity and richness in the rumen bacteria of animals with high feed efficiency (14, 42), the present study did not observe differences in the ruminal microbial diversity of animals with high and low feed efficiency. The result of the present study corroborated the findings of earlier studies (16, 43, 44). These results indicated that a lower diversity microbiome may not necessarily equate to a more feed efficient ruminant and that microbial diversity is influenced by the chemical composition of the diet and breed, as previously reported (45).
The observation of bacteria members related to fiber degradation in this study was not surprising given that the experimental diet had a concentrate:forage ratio of 5:5. In the present study, Ruminococcaceae was found in greater abundance in the rumen liquid of the most efficient heifers. Furthermore, the negative association of higher abundance of Ruminococcaceae with feed efficiency supports this result (12, 14). Members of the Ruminococcaceae members are well known to possess cellulolytic and hemicellulolytic activity, which produces acetate, butyrate, formate, and hydrogen (46). Therefore, the higher proportion of Ruminococcaceae likely resulted in increased energy utilization efficiency of animals with high feed efficiency. Additionally, a previous study reported that the population of Rikenellaceae in feces correlated negatively with feed efficiency (15), which partly supports our result of a higher population of Rikenellaceae members in the rumen liquid of the LRFI group. Lu et al. (47) reported that Rikenellaceae reduced fat by the synthesis of acetate and propionate. However, no differences were observed in butyrate and propionate concentrations in the rumen liquid between efficient and inefficient heifers in the present study. Therefore, whether Rikenellaceae improves feed efficiency by reducing fat needs to be verified by future studies. In addition, in the present study, the Lachnospiraceae population was also higher in the LRFI group, in agreement with previous observations (13, 14). Some members of Lachnospiraceae are major butyrate producers (48), and are thought to contribute to a healthy intestinal environment (49). Furthermore, the Lachnospiraceae_ND3007 and Lachnospiraceae_NK3A20 groups in this study were strongly associated with Linoleic acid metabolism and Lysine degradation, which prompted us to speculate that Lachnospiraceae improves the metabolic capability of Angus heifers in the LRFI group. In the present study, correlation analysis revealed that norank_f__Bacteroidales_S24_7_group was negatively associated with oxidative pro-inflammatory lipid metabolites of 9,10-DHOME (50). Similarly, Chen et al. (51) and Qi et al. (52) reported norank_f__Bacteroidales_S24_7_group as intestinal probiotics that had a negative correlation with intestinal inflammation. Our results further verified the anti-inflammatory function of the Bacteroidales_S24-7_group. Thus, a higher proportion of norank_f__Bacteroidales_S24_7_group might increase immunological function to promote feed efficiency in the LRFI group.
The metabolome data revealed that the RFI alters the metabolite concentration of microorganisms in the rumen liquid, indicating that ruminal metabolism might be related to the ruminal microbiota. Our results showed that the RFI significantly altered the concentration of some important metabolites associated with protein digestion and absorption. In the rumen, amino acids are the degradation products of dietary or microbial proteins, and are the precursors of peptide and protein synthesis, which regulate certain metabolic pathways (53). Notably, L-proline, a functional amino acid, plays important roles in protein synthesis, structure, metabolism, and nutrition, as well as anti-oxidative reactions and immune responses (54). Downregulation of L-Proline might suggest more L-proline being used for microbial protein synthesis, which would be beneficial to animals in the LRFI group, as would the downregulation of L-Phenylalanine, L-Isoleucine, and Piperidine. Gamma-Linolenic acid, a kind of w-6 fatty acid, has anti-inflammatory effects (55). The upregulation of Gamma-Linolenic acid suggested that the LRFI group might have improved feed efficiency by improving their immune function. Furthermore, the LRFI group had lower levels of oxidative pro-inflammatory lipid metabolites, such as 9,10-DHOME and 9-OxoODE (50), providing further evidence of enhanced immune function. Lysine is the first or second limiting amino acid in beef cattle (56). The downregulation of Lysine degradation metabolites suggested that Lysine metabolism pathways were upregulated. We hypothesized that Lysine might be used to synthesize more microbial proteins, which would improve the feed efficiency of the LRFI group. Palmitic acid, a typical long-chain saturated fatty acid, has strong lipid toxicity and can cause excessive intracellular inflammatory reactions (57) and oxidative stress (58). Knight et al. (59) reported that microorganisms can synthesize palmitic acid using acetate. Thus, the downregulation of palmitic acid would not only reduce excess energy consumption, but also protect the health of cells, which in turn would improve the feed efficiency of the LRFI group.
Saleem et al. (60) reported that about 55–60% of the rumen fluid metabolites correlated with the rumen microbiota. We studied the correlation between the significantly differentially abundant ruminal metabolites and the genus level of the predominant rumen microbiota. Within the rumen microbiome, Prevotella has been recognized as the dominant bacterial genus (61), and has a documented role in the digestion of polysaccharides (62) and proteins (63). In agreement with our results, members of the family Prevotellaceae have been associated with inefficient dairy cows (13, 14). In the rumen, the Prevotellaceae family has the ability to degrade lignocellulose (64), and is involved in pectin and protein metabolism (65). In addition, Prevotellaceae plays an important role in degrading oligopeptides in ruminants (66). Xue et al. (67) reported that Prevotella_1 affects the metabolism of amino acids in the rumen, because protein is a nitrogen source, which is essential for the growth of Prevotella_1. In our study, the proportion of the genus Prevotella_1 was found to correlate strongly with Lysine degradation, and a higher proportion of Prevotella_1 decreased the concentration of Lysine, which might have decreased the feed efficiency in the HRFI group. Liu et al. (68) found that Prevotellaceae_UCG-001 produces anti-inflammatory metabolites, such as short-chain fatty acids (SCFAs). Knight et al. (59) reported that microorganisms can synthesize palmitic acid using acetate. However, our results showed that Prevotellaceae_UCG-001 correlated positively with Palmitic acid, which can cause excessive intracellular inflammatory reactions (57). Therefore, the function of Prevotellaceae_UCG-001 needs to be validated in future studies.
Tao et al. (69) reported that Rikenellaceae_RC9_group plays an important role in the degradation of structural carbohydrates. However, our results showed that Rikenellaceae_RC9_group correlated strongly with oxidative pro-inflammatory lipid metabolites of 9,10-DHOME (50) and the metabolism of Lysine, thus a higher proportion of Rikenellaceae_RC9_group might increase immunological function to promote the feed efficiency of the LRFI group. Ruminiclostridium spp. are best known for their cellulolytic activities. Loman et al. (70) reported that they might have a role in the gut-brain axis. Meanwhile, Zhao et al. (71) observed that Ruminiclostridium is important in controlling obesity development. Although their effects on host physiology have not been studied widely, our results suggest that they might have a role in Lysine metabolism in the rumen (70). Dai et al. (72) reported that Christensenellaceae_R7_group might be important in the degradation of hemicellulose and cellulose; however, in the present study, Christensenellaceae_R7_group was negatively associated with RFI, and might have a role in the metabolism of Lysine, which provides evidence supporting the higher feed efficiency in the LRFI group. Notably, Zhang et al. (73) reported that the proportion of Ruminococcaceae_NK4A214_group was related to the absorption of fat-soluble vitamins; however, our results suggested that it plays a role in the degradation of fatty acid, which might increase immunological function to promote the feed efficiency in the LRFI group. However, the mechanisms of Lachnospiraceae_ND3007_group, Ruminiclostridium_1, and Lachnospiraceae_NK3A20_group metabolism are not yet clear. In the present study, we found that these bacteria correlated negatively with the RFI phenotype, Linoleic acid metabolism, and Lysine degradation, but correlated positively with fatty acid degradation. It would be worth exploring the possibility that the proportion of these bacteria could affect the RFI phenotype.
This study combined microbiome and metabolomic analyses to study the effects of high and low RFI Angus heifers on ruminal microbial communities and metabolites under the same feeding conditions. The genera Rikenellaceae_RC9_gut_group, Ruminococcaceae_NK4A214_group, Christensenellaceae_R7_group, Ruminococcaceae_UCG-010, Lachnospiraceae_ND3007_group, Ruminiclostridium_1, and Lachnospiraceae_NK3A20_group were negatively associated with RFI; both foundational and key species are associated with feed efficiency phenotype. Moreover, the RFI significantly altered the concentrations of ruminal metabolites involved in protein digestion and absorption, Linoleic acid metabolism, Lysine degradation, and Fatty acid degradation. In addition, our results also identified the relationship between rumen bacteria and metabolites. Integrative information about the interactions between the rumen microbial composition and metabolites in beef cattle with different RFI phenotypes could provide a better understanding of the ruminal microbial and metabolite functions, allowing the development of improved strategies to increase feed efficiency. Because of the individual variation of animals, in the future, samples from more cattle should be analyzed to confirm these findings. In addition, the mechanisms of the interactions among ruminal bacteria and rumen metabolism deserve further investigation.
The datasets presented in this study can be found in online repositories. The names of the repository/repositories and accession number(s) can be found at: https://www.ncbi.nlm.nih.gov/, PRJNA779020.
The animal study was reviewed and approved by the Laboratory Animal Welfare and Animal Experiment Ethical Committee of China Agricultural University (Protocol No. AW08059102-2).
QM, ZZ, and HW designed the research. YL, WC, and CL conducted the research. YL analyzed the data and wrote the manuscript. ZZ had responsibility for the final content. All authors read and approved the final manuscript.
This work was supported by grants from the National Natural Science Foundation of China (Grant Number: 31972593), the Government Purchase Service (Grant Number: 16200158), and the China Agricultural Research System (Grant Number: CARS-37).
The authors declare that the research was conducted in the absence of any commercial or financial relationships that could be construed as a potential conflict of interest.
All claims expressed in this article are solely those of the authors and do not necessarily represent those of their affiliated organizations, or those of the publisher, the editors and the reviewers. Any product that may be evaluated in this article, or claim that may be made by its manufacturer, is not guaranteed or endorsed by the publisher.
We are grateful to the staff of Beef Cattle Research Center for their help with sampling and laboratory analyses.
The Supplementary Material for this article can be found online at: https://www.frontiersin.org/articles/10.3389/fvets.2022.812861/full#supplementary-material
RFI, residual feed intake; HRFI, high RFI; LRFI, low RFI; G/F, Gain-to-Feed Ratio; F/G, Feed-to-Gain Ratio; FCR, feed conversion rate; DMI, dry matter intake; ADG, average daily gain; VFAs, volatile fatty acids; SD, standard deviation; TVFAs, total VFAs; AP, ratio of acetate:propionate.
1. Herd R, Archer J, Arthur P. Reducing the cost of beef production through genetic improvement in residual feed intake: opportunity and challenges to application. J Anim Sci. (2003) 13:E9–E17. doi: 10.2527/2003.8113_suppl_1E9x
2. Schnepf R. US Farm Income. Washington (DC): Congressional Research Service (2020). Available online at: http://digitalcommonsilrcornelledu/key_workplace/1167 (accessed January 24, 2012).
3. Crews D. Genetics of efficient feed utilization and national cattle evaluation: A review. Genet Mol Res. (2005) 4:152-165. doi: 10.1186/1297-9686-12-1-123b
4. Koch RM, Swiger LA, Chambers D, Gregory KE. Efficiency of feed use in beef cattle. J Anim Sci. (1963) 22:486–94. doi: 10.2527/jas1963.222486x
5. Nkrumah JD, Okine EK, Mathison GW, Schmid K, Li C, Basarab JA, et al. Relationships of feedlot feed efficiency, performance, and feeding behavior with metabolic rate, methane production, and energy partitioning in beef cattle. J Anim Sci. (2006) 84:145–53. doi: 10.2527/2006.841145x
6. Kelly AK, Mcgee M, Crews DH, Fahey AG, Kenny DA. Effect of divergence in residual feed intake on feeding behavior, blood metabolic variables, and body composition traits in growing beef heifers. J Anim Sci. (2010) 88:109–23. doi: 10.2527/jas.2009-2196
7. Crowley JJ, Mcgee M, Kenny DA, Crews DH, Evans RD, Berry DP. Phenotypic and genetic parameters for different measures of feed efficiency in different breeds of Irish performance-tested beef bulls. J Anim Sci. (2010) 88:885–94. doi: 10.2527/jas.2009-1852
8. Herd RM, Arthur PF. Physiological basis for residual feed intake. J Anim Sci. (2009) 87:E64–71. doi: 10.2527/jas.2008-1345
9. Arthur P, Renand G, Krauss D. Genetic and phenotypic relationships among different measures of growth and feed efficiency in young Charolais bulls. Livest Sci. (2001) 68:131–9. doi: 10.1016/S0301-6226(00)00243-8
10. Janssen PH. Infuence of hydrogen on rumen methane formation and fermentation balances through microbial growth kinetics and fermentation thermodynamics. Anim Feed Sci Technol. (2010) 160:1–22. doi: 10.1016/j.anifeedsci.2010.07.002
11. Bannink A, France J, Lopez S, Gerrits W, Kebreab E, Tamminga S, et al. Modelling the implications of feeding strategy on rumen fermentation and functioning of the rumen wall. Anim Feed Sci Technol. (2008) 143:3–26. doi: 10.1016/j.anifeedsci.2007.05.002
12. Jami E, White BA, Mizrahi I. Potential role of the bovine rumen microbiome in modulating milk composition and feed efficiency. PLoS ONE. (2014) 9:e85423. doi: 10.1371/journal.pone.0085423
13. Jewell KA, McCormick CA, Odt CL, Weimer PJ, Suen G. Ruminal bacterial community composition in dairy cows is dynamic over the course of two lactations and correlates with feed efficiency. Appl Environ Microbiol. (2015) 81:4697–710. doi: 10.1128/AEM.00720-15
14. Shabat SK, Sasson G, Doron-Faigenboim A, Durman T, Yaacoby S, Berg-Miller ME, et al. Specific microbiome-dependent mechanisms underlie the energy harvest efficiency of ruminants. ISME J. (2016) 10:2958–72. doi: 10.1038/ismej.2016.62
15. Welch CB, Lourenco JM, Davis DB, Krause TR, Carmichael MN, Rothrock MJ, et al. The impact of feed efficiency selection on the ruminal, cecal, and fecal microbiomes of Angus steers from a commercial feedlot. J Anim Sci. (2020) 98:skaa230. doi: 10.1093/jas/skaa230
16. Paz HA, Hales KE, Wells JE, Kuehn LA, Freetly HC, Berry ED, et al. Rumen bacterial community structure impacts feed efficiency in beef cattle. J Anim Sci. (2018) 96:1045–58. doi: 10.1093/jas/skx081
17. Yeoman CJ, White BA. Gastrointestinal tract microbiota and probiotics in production animals. Annu Rev Anim Biosci. (2014) 2:469–86. doi: 10.1146/annurev-animal-022513-114149
18. Okine EK, Mathison GW. Effects of feed intake on particle distribution, passage of digesta, and extent of digestion in the gastrointestinal tract of cattle. J Anim Sci. (1991) 8:3435–45. doi: 10.2527/1991.6983435x
19. Huntington GB. Energy metabolism in the digestive tract and liver of cattle: influence of physiological state and nutrition. Reprod Nutr Dev. (1990) 30:35–47. doi: 10.1051/rnd:19900103
20. National Academies of Sciences Engineering and Medicine. Nutrient Requirements of Beef Cattle: Eighth Revised Edition. Washington, DC: The National Academies Press (2016).
21. Nkrumah JD, Basarab JA, Price MA, Okine EK, Ammoura A, et al. Different measures of energetic efficiency and their phenotypic relationships with growth, feed intake, and ultrasound and carcass merit in hybrid cattle. J Anim Sci. (2004) 82:2451–9. doi: 10.2527/2004.8282451x
22. Lancaster PA, Carstens GE, Michal JJ, Brennan KM, Johnson KA, Davis ME. Relationships between residual feed intake and hepatic mitochondrial function in growing beef cattle. J Anim Sci. (2014) 92:3134–41. doi: 10.2527/jas.2013-7409
23. Liu C, Wu H, Liu S, Chai S, Qing X, Zhou Z. Dynamic alterations in yak rumen bacteria community and metabolome characteristics in response to feed type. Front Microbiol. (2019) 10:1116. doi: 10.3389/fmicb.2019.01116
24. Chen S, Zhou Y, Chen Y, Gu J. fastp: an ultra-fast all-in-one FASTQ preprocessor. Bioinformatics. (2018) 34:i884–90. doi: 10.1093/bioinformatics/bty560
25. Magoč T, Salzberg SL. FLASH: fast length adjustment of short reads to improve genome assemblies. Bioinformatics. (2011) 27:2957–63. doi: 10.1093/bioinformatics/btr507
26. Wang Q, Garrity GM, Tiedje JM, Cole JR. Naive bayesian classifier for rapid assignment of rRNA sequences into the new bacterial taxonomy. Appl Environ Microbiol. (2007) 73:5261–7. doi: 10.1128/AEM.00062-07
27. Quast C, Pruesse E, Yilmaz P, Gerken J, Glckner FO. The silva ribosomal rna gene database project: improved data processing and web-based tools. Nucleic Acids Res. (2013) 41:D590–596. doi: 10.1093/nar/gks1219
28. Edgar RC. UPARSE: highly accurate OTU sequences from microbial amplicon reads. Nat Methods. (2013) 10:996–8. doi: 10.1038/nmeth.2604
29. Stackebrandt E, Goebel BM. Taxonomic note: a place for DNA-DNA reassociation and 16S rRNA sequence analysis in the present species definition in bacteriology. Int J Syst Bacteriol. (1994) 44:846–9. doi: 10.1099/00207713-44-4-846
30. Schloss PD, Westcott SL, Ryabin T, Hall JR, Hartmann M, Hollister EB, et al. Introducing mothur: open-source, platform-independent, community-supported software for describing and comparing microbial communities. Appl Environ Microbiol. (2009) 75:7537–41. doi: 10.1128/AEM.01541-09
31. Oksanen J, Blanchet FG, Kindt R, Legendre P, Minchin PR, O'Hara RB, et al. Vegan: Community Ecology Package. R Package Vegan Version 2.2-1 (2015).
32. Jones E, Oliphant E, Peterson P. SciPy: Open Source Scientific Tools for Python. (2001). Available online at: http://www.scipy.org (accessed March 31, 2019).
33. R Core Team. (2013). R: A Language and Environment for Statistical Computing. Vienna: R Foundation for Statistical Computing. Available online at: http://www.R-project.org/
34. Parks DH, Tyson GW, Hugenholtz P, Beiko RG. STAMP: statistical analysis of taxonomic and functional profiles. Bioinformatics. (2014) 30:3123–4. doi: 10.1093/bioinformatics/btu494
35. Warnes GR, Bolker B, Bonebakker L, Gentleman R, Liaw WHA, Lumley T, et al. gplots: Various R Programming Tools for Plotting Data. R Package Version 3.0. 1. The Comprehensive R Archive Network (2016). Available online at: https://cran.rproject.org/web/packages/gplots/gplots.pdf (accessed November 28, 2019)
36. Kolde R. Pretty Heatmaps. R Package Version (2012). p. 61. Available online at: http://CRAN.R-project.org/package=pheatmap (accessed January 4, 2019).
37. Lancaster PA, Carstens GE, Crews DH Jr, Welsh TH Jr, Forbes TD, Forrest DW, et al. Phenotypic and genetic relationships of residual feed intake with performance and ultrasound carcass traits in Brangus heifers. J Anim Sci. (2009) 87:3887–96. doi: 10.2527/jas.2009-2041
38. Kenny D, Fitzsimons C, Waters S, McGee M. Invited review: improving feed efciency of beef cattle—the current state of the art and future challenges. Animal. (2018) 12:1815–26. doi: 10.1017/S1751731118000976
39. Mcgovern E, Mcgee M, Byrne CJ, Kenny DA, Kelly AK, Waters SM. Investigation into the effect of divergent feed efficiency phenotype on the bovine rumen microbiota across diet and breed. Sci Rep. (2020) 10:15317. doi: 10.1038/s41598-020-71458-0
40. Stewart W, Stewart DG, Schultz L. Rates of volatile fatty acid production in the bovine rumen. J Anim Sci. (1958) 3:723–36. doi: 10.2527/jas1958.173723x
41. Bryant A. Variations in the pH and volatile fatty acid concentration within the bovine reticulo-rumen. New Zeal J Agr Res. (1964) 4:694–706. doi: 10.1080/00288233.1964.10416398
42. Guan LL, Nkrumah JD, Basarab JA, Moore SS. Linkage of microbial ecology to phenotype: correlation of rumen microbial ecology to cattle's feed efficiency. FEMS Microbiol Lett. (2008) 288:85–91. doi: 10.1111/j.1574-6968.2008.01343.x
43. Li FY, Guan LL. Metatranscriptomic profling reveals linkages between the active rumen microbiome and feed efciency in beef cattle. Appl Environ Microbiol. (2017) 83:e00061–e117. doi: 10.1128/AEM.00061-17
44. Déborah RGL, Márcio de SD, Alex JLR, Ibrahim ZC, Tiago A de OM, Edenio D, et al. Assessing the relationship between the rumen microbiota and feed efficiency in Nellore steers. J Anim Sci Biotechnol. (2021) 2:79. doi: 10.1186/s40104-021-00599-7
45. Henderson G, Collaborators GRC, Cox F, Ganesh S, Jonker A, Young W, et al. Rumen microbial community composition varies with diet and host, but a core microbiome is found across a wide geographical range. Sci Rep. (2015) 5:14567. doi: 10.1038/srep19175.
46. Biddle A, Stewart L, Blanchard J, Leschine S. Untangling the genetic basis of fibrolytic specialization by lachnospiraceae and ruminococcaceae in diverse gut communities. Diversity. (2013) 5:627–40. doi: 10.3390/d5030627
47. Lu Y, Fan C, Li P, Lu Y, Chang X, Qi K. Short chain fatty acids prevent high-fat-diet-induced obesity in mice by regulating g protein- coupled receptors and gut microbiota. Sci Rep. (2016) 6:37589. doi: 10.1038/srep37589
48. Meehan CJ, Beiko RG. A phylogenomic view of ecological specialization in the lachnospiraceae, a family of digestive tract-associated bacteria. Genome Biol Evol. (2014) 6:703–13. doi: 10.1093/gbe/evu050
49. Louis P, Flint HJ. Diversity, metabolism and microbial ecology of butyrate-producing bacteria from the human large intestine. FEMS MicrobiolLett. (2009) 294:1–8. doi: 10.1111/j.1574-6968.2009.01514.x
50. Shi Z, Zhu JX, Guo YM, Niu M, Wang JB. Epigallocatechin gallate during dietary restriction — potential mechanisms of enhanced liver injury. Front Pharmacol. (2021) 11:609378. doi: 10.3389/fphar.2020.609378
51. Chen J, Kang B, Qian J, Han M, Kang Y. Alpha-ketoglutarate in low-protein diets for growing pigs: effects on cecal microbial communities and parameters of microbial metabolism. Front Microbiol. (2018) 9:1–14. doi: 10.3389/fmicb.2018.01057
52. Qi C, Li Y, Yu RQ, Zhou SL, Wang XG, Le GW, et al. Composition and immuno-stimulatory properties of extracellular DNA from mouse gut flora. World J Gastroenterol. (2017) 23:7830–9. doi: 10.3748/wjg.v23.i44.7830
53. Mariz L, Amaral PM, Valadares F, Santos SA, Detmann E, Marcondes MI, et al. Dietary protein reduction on microbial protein, amino acids digestibility and body retention in beef cattle: 2. amino acid intestinal absorption and their efficiency for whole-body deposition. J Anim Sci. (2018) 96:670–83. doi: 10.1093/jas/sky018
54. Wu G, Bazer FW, Burghardt RC, Johnson GA, Kim SW, Knabe DA, et al. Proline and hydroxyproline metabolism: implications for animal and human nutrition. Amino Acids. (2011) 40:1053–63. doi: 10.1007/s00726-010-0715-z
55. Baker E, Miles E, Calder P. Gamma-Linolenic and Pinolenic Acids Exert anti-inflammatory effects in cultured human endothelial cells through their elongation products. Proc Nutr Soc. (2020) 79:OCE2. doi: 10.1017/S0029665120003146
56. Neves PV, Pitarelo AP, Ramos LP. Production of cellulosic ethanol from sugarcane bagasse by steam explosion: effect of extractives content, acid catalysis and different fermentation technologies. Bioresour Technol. (2016) 208:184–94. doi: 10.1016/j.biortech.2016.02.085
57. Schilling JD, Machkovech HM, He L, Sidhu R, Fujiwara H, Weber K, et al. Palmitate and lipopolysaccharide trigger synergistic ceramide production in primary macrophages. J Biol Chem. (2013) 288:2923–32. doi: 10.1074/jbc.M112.419978
58. Egnatchik RA, Leamy AK, Noguchi Y, Shiota M, Young JD. Palmitate-induced activation of mitochondrial metabolism promotes oxidative stress and apoptosis in H4IIEC3 rat hepatocytes. Metab Clin Exp. (2014) 63:283–95. doi: 10.1016/j.metabol.2013.10.009
59. Knight R, Sutton JD, Storry JE, Brumby PE. Rumen microbial synthesis of long-chain fatty acids. Proc Nutr Soc. (1979) 38:4A.
60. Saleem F, Bouatra S, Guo AC, Psychogios N, Mandal R, Dunn SM, et al. The bovine ruminal fluid metabolome. Metabolomics. (2013) 9:360-78. doi: 10.1007/s11306-012-0458-9
61. Stevenson DM, Weimer PJ. Dominance of Prevotella and low abundance of classical ruminal bacterial species in the bovine rumen revealed by relative quantification real-time PCR. Appl Microbiol. (2007) 75:165–74. doi: 10.1007/s00253-006-0802-y
62. Matsui H, Ogata K, Tajima K, Nakamura M, Nagamine T, Aminov RI, et al. Phenotypic characterization of polysaccharidases produced by four prevotella type strains. Curr Microbiol. (2000) 41:45–9. doi: 10.1007/s002840010089
63. Wallace R. The proteolytic systems of ruminal microorganisms. Ann Zootech. (1996) 45:301–8. doi: 10.1051/animres:19960653
64. Bi YL, Zeng SQ, Zhang R, Diao QY, Tu Y. Effects of dietary energy levels on rumen bacterial community composition in Holstein heifers under the same forage to concentrate ratio condition. BMC Microbiol. (2018) 18:69. doi: 10.1186/s12866-018-1213-9
65. Schnorr SL, Candela M, Rampelli S, Centanni M, Consolandi C, Basaglia G, et al. Gut microbiome of the Hadza hunter-gatherers. Nat Commun. (2014) 5:3654. doi: 10.1038/ncomms4654
66. Walker ND, McEwan NR, Wallace RJ. Cloning and functional expression of dipeptidyl peptidase IV from the ruminal bacterium prevotella albensis m384t. Microbiology. (2003) 149:2227–34. doi: 10.1099/mic.0.26119-0
67. Xue MY, Sun HZ, Wu XH, Liu JX, Guan LL. Multi-omics reveals that the rumen microbiome and its metabolome together with the host metabolome contribute to individualized dairy cow performance. Microbiome. (2020) 8:64. doi: 10.1186/s40168-020-00819-8
68. Liu Q, Cai BY, Zhu LX, Xin X, Wang X, An Z-M, et al. Liraglutide modulates gut microbiome and attenuates nonalcoholic fatty liver in db/db mice. Life Sci. (2020) 261:118457. doi: 10.1016/j.lfs.2020.118457
69. Tao S, Bai Y, Zhou X, Zhao J, Yang H, Zhang S, et al. In vitro fermentation characteristics for different ratios of soluble to insoluble dietary fiber by fresh fecal microbiota from growing pigs. ACS Omega. (2019) 4:15158–67. doi: 10.1021/acsomega.9b01849
70. Loman BR, Jordan KR, Haynes B, Bailey MT, Pyter LM. Chemotherapy-induced neuroinflammation is associated with disrupted colonic and bacterial homeostasis in female mice. Sci Rep. (2019) 9:16490. doi: 10.1038/s41598-019-52893-0
71. Zhao L, Zhang Q, Ma W, Tian F, Shen H, Zhou M. A combination of quercetin and resveratrol reduces obesity in high-fat diet-fed rats by modulation of gut microbiota. Food Funct. (2017) 8:4644–56. doi: 10.1039/C7FO01383C
72. Dai X, Tian Y, Li J, Luo Y, Liu D, Zheng H, et al. Metatranscriptomic analyses of plant cell wall polysaccharide degradation by microorganisms in the cow rumen. Appl Environ Microbiol. (2015) 81:1375–86. doi: 10.1128/AEM.03682-14
Keywords: rumen, microbiota, metabolomics, residual feed intake, beef cattle
Citation: Liu Y, Wu H, Chen W, Liu C, Meng Q and Zhou Z (2022) Rumen Microbiome and Metabolome of High and Low Residual Feed Intake Angus Heifers. Front. Vet. Sci. 9:812861. doi: 10.3389/fvets.2022.812861
Received: 10 November 2021; Accepted: 02 March 2022;
Published: 25 March 2022.
Edited by:
Eriko Takano, The University of Manchester, United KingdomReviewed by:
Stafford Vigors, University College Dublin, IrelandCopyright © 2022 Liu, Wu, Chen, Liu, Meng and Zhou. This is an open-access article distributed under the terms of the Creative Commons Attribution License (CC BY). The use, distribution or reproduction in other forums is permitted, provided the original author(s) and the copyright owner(s) are credited and that the original publication in this journal is cited, in accordance with accepted academic practice. No use, distribution or reproduction is permitted which does not comply with these terms.
*Correspondence: Zhenming Zhou, emhvdXptQGNhdS5lZHUuY24=
Disclaimer: All claims expressed in this article are solely those of the authors and do not necessarily represent those of their affiliated organizations, or those of the publisher, the editors and the reviewers. Any product that may be evaluated in this article or claim that may be made by its manufacturer is not guaranteed or endorsed by the publisher.
Research integrity at Frontiers
Learn more about the work of our research integrity team to safeguard the quality of each article we publish.