
95% of researchers rate our articles as excellent or good
Learn more about the work of our research integrity team to safeguard the quality of each article we publish.
Find out more
ORIGINAL RESEARCH article
Front. Vet. Sci. , 20 October 2022
Sec. Veterinary Epidemiology and Economics
Volume 9 - 2022 | https://doi.org/10.3389/fvets.2022.1026592
This article is part of the Research Topic Foot-And-Mouth Disease Epidemiology, Vaccines and Vaccination: Moving Forward View all 15 articles
 Shankar Yadav1,2,3
 Amy H. Delgado2*
 Amy D. Hagerman4Miranda R. Bertram1,3
 Karla I. Moreno-Torres1,2,3
 Carolina Stenfeldt1,5Lindsey Holmstrom2Jonathan Arzt1
Development of a foot-and-mouth disease (FMD) carrier state following FMD virus (FMDV) infection is a well-established phenomenon in cattle. However, the proportion of cattle likely to become carriers and the duration of the carrier state at a herd or population-level are incompletely understood. The objective of this study was to examine the epidemiologic and economic impacts of vaccination-to-live strategy in a disease-free region or country. We developed and simulated scenarios of FMD spread and control in the US livestock population, which included depopulation for a limited period, followed by a vaccinate-to-live strategy with strong biosecurity and movement restrictions. Six scenarios of FMD spread and control were simulated in the InterSpread Plus (ISP) modeling tool. Data on the number of infected and depopulated cattle (by operation types) from ISP model runs were used to estimate the monthly number of infected but not depopulated (potential carrier) cattle after the infection. Using available literature data on the FMD carrier state, we estimated the monthly proportion of carrier cattle (from infected but not depopulated cattle) over time following infection. Among the simulated scenarios, the median (25th, 75th percentile) number of infected cattle ranged from 43,217 (42,819, 55,274) head to 148,907 (75,819, 205,350) head, and the epidemic duration ranged from 20 (11, 30) to 76 (38, 136) days. In general, larger outbreaks occurred when depopulation was carried out through longer periods, and the onset of the vaccination was late (p > 0.05). The estimated proportion of surviving cattle, which were infected and not depopulated and had the potential to become persistently infected ranged from 14 to 35% of total infected cattle. Production losses in beef and dairy sectors were higher when outbreaks started in multiple states simultaneously, but production losses were small compared to trade losses and consumer avoidance losses. These results can be used to inform the consideration of a vaccinate-to-live strategy for FMD outbreaks and the development of appropriate post-outbreak management strategies. Furthermore, this output will enable a more detailed examination of the epidemiologic and economic implications of allowing convalescent cattle to survive and remain in production chains after FMD outbreaks in FMD-free regions.
Challenges in foot-and-mouth disease (FMD) control are numerous and complex. While some of these are social and/or political, many are directly linked to the inherent characteristics of the virus—extreme contagiousness, a wide range of affected hosts, and multiple viral serotypes that do not confer cross-protection (1–4). As a result, the introduction of FMD into a previously free region requires a rapid response, which synergistically addresses all of these factors while considering the practical and logistical aspects of emergency response and the concurrent economic impacts. Given the intricacies of FMD outbreak responses in the United States, both consumers and livestock producers are increasingly expecting that every tool, including vaccination, will be considered in the event of an outbreak.
Vaccination has been an important tool in controlling and eradicating FMD, particularly in endemic settings, but also during outbreaks in previously free countries (1, 5, 6). Vaccination offers several benefits to an emergency response, including reducing the need for large-scale depopulation of animals and the environmental impact associated with the disposal of depopulated animals. However, vaccination as a response tool in a previously FMD-free country also brings challenges, particularly related to decisions on how to manage vaccinated animals. Under the US Department of Agriculture's (USDA) FMD response plan, the management of vaccinated animals varies across four different response strategies —emergency vaccination to kill, emergency vaccination to slaughter, emergency vaccination to live, and emergency vaccination to live without stamping out of infected animals or vaccinates (7). In geographically constrained outbreaks where the disease can be controlled and eradicated in a short amount of time, there are few economic incentives for a vaccinate-to-live strategy. Guidelines suggest trade embargos for six months when the vaccinated animals are allowed to live versus three months when the vaccinated animals are culled. In addition, there are additional resources required to manage vaccinates in a vaccinate-to-live strategy including costs and effort required for testing and tracking vaccinated animals through their productive life spans (8–10).
However, there are benefits to vaccinate-to-live approaches. These alternative approaches to vaccinate-to-kill and stamping-out can reduce the costs of on-farm responses, such as depopulation, carcass disposal, and indemnity paid to producers for animals taken during the response. In addition, genetically valuable animals may be preserved, and disruptions in production chains could be reduced. Lastly, there are scenarios in which vaccinate-to-live is unavoidable, most notably when the number of vaccinated animals exceeds the practical capacity for depopulation. In addition, for countries that are not highly dependent on livestock and meat export markets, the economic advantage associated with reduced trade embargoes of vaccinate-to-kill, may be overcome by the value of protein saved due to reduced depopulation. However, the potential use of vaccinate-to-live is confounded by some of the biological properties of the virus, particularly the carrier state (11).
Foot-and-mouth disease virus (FMDV) is highly transmissible, and while vaccination can substantially reduce transmission and the development of clinical signs, vaccinated animals exposed to the virus may still become infected and develop antibodies (12). In addition, regardless of vaccination status or virus strain, a substantial proportion (≥50% of infected cattle) of infected ruminants will develop a subclinical persistent phase of infection (1, 11). This carrier state is identified by detection of infectious virus (FMDV) in oropharyngeal fluid (OPF) more than 28 days post-infection (dpi) (12, 13). Most genetic diversity of FMDV (14) develops during the carrier state (15); however, the epidemiologic significance of carriers in relation to disease transmission remains unclear (11).
Concerns about the risks posed by FMDV carriers remain due to historical accounts of FMD outbreaks believed to have resulted from transmission between persistently infected carriers and susceptible animals. Although published experimental studies have almost uniformly reported a lack of transmission from carriers to contact exposed animals (16, 17), some studies have demonstrated that OPF from carriers is capable of infecting naïve cattle (18). The duration of the carrier state is likely influenced by numerous factors, as evidenced by the diversity of reported lengths in the literature (19–22). For example, the carrier state has been shown to last for up to 4–5 years in African buffalo (Syncerus caffer), 4 months to 3.5 years in cattle (19, 20), and up to 9 months in sheep (21–24). The discrepancies in the duration of the carrier state may be due to differences in virus (serotype, strain or virulence), host (genetic differences, nutritional or immunological status), environment (climate, mineral intake), and methods of virus detection across studies (14).
Despite the limited epidemiologic evidence, carriers have been recognized as a barrier to re-establishing disease freedom following an outbreak (8, 25). Proving disease freedom is a critical step to the gradual or immediate resumption of international trade. As a result, when vaccination is used as part of the outbreak response strategy, vaccinated herds must be monitored and managed to reduce the risk associated with the presence of infectious virus. With increasing expectations from livestock producers and the general public regarding the use of vaccination, additional information on the duration and relevance of the carrier state is needed in order to design monitoring plans for vaccinated herds, particularly for large or complex livestock operations. While some work has been done to model the prevalence of carriers after reactive vaccination, recent studies offer new insights into the prevalence and duration of the carrier state (19, 26).
The objective of this study was to examine the epidemiologic and economic impacts of alternative approaches for FMD control that limit the use of depopulation, while taking into account the presence of carrier cattle over time in the affected population. To achieve this, we developed and simulated scenarios of FMD spread and control in the US livestock population, which included depopulation for a limited period, followed by a vaccinate-to-live strategy with strong biosecurity and movement restrictions. Based on currently available data from the literature, we estimated the prevalence and duration of the carrier state over time for varied cattle production systems. The resulting scenarios were also used to estimate the economic consequences of deviating from a stamping-out strategy, including production losses in infected herds, market impacts, and response costs. Many questions remain about the social and trade ramifications of managing carrier and vaccinated animals.
The FMD model scenarios developed in this study were based on the national livestock population of the United States. The farm data was obtained using a micro-simulation model called the Farm Location and Animal Population Simulator (FLAPS), which generates synthetic farm populations with production types, herd sizes, and geographical coordinates, while taking into account livestock census data (27). To account for the geographical diversity in demographics of livestock operations, animals, and their movement, the mainland of the United States was divided into five discrete regions: Pacific (PC), Midwest (MW), Great lakes (GL), North East (NE) and South East (SE). Altogether 1.82 million livestock operations, which included bison (0.14%), cattle (84%), goats (7%), sheep (3%), and pigs (0.2%) were included in the model. Operation characteristics, including movement destinations and frequencies, varied based on the herd size (Table 1 and Supplementary Table S1). Cattle farms were categorized into four different production types based on the age and management practices of animals—cow calf, stocker, dairy, and feedlot (Supplementary Table S1). Among cattle farms in the population dataset, 2% were classified as large farms (≥200 head for cow calf, ≥500 head for dairy, and ≥1,000 head for feedlot). The stocker farms were identified as small operations. The cow calf (small: 96%, large 4%), dairy (small: 95%, large: 5%), feedlot (small: 93%, large: 7%), and stockers (all small) constituted 47, 4, 2, and 47% of the total cattle farms in the population file.
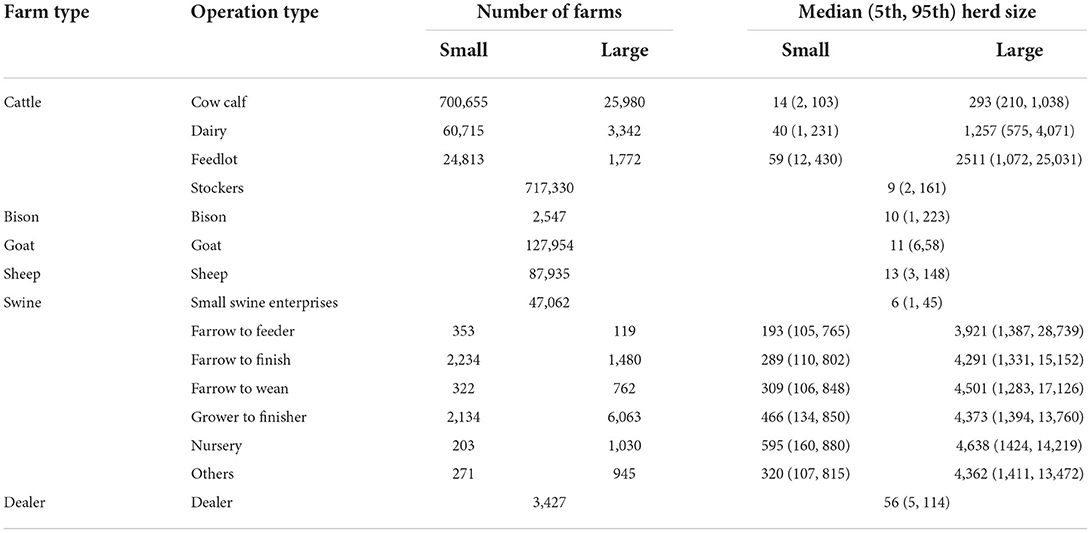
Table 1. Descriptive statistics of foot-and-mouth disease susceptible livestock population incorporated in the InterSpread Plus (ISP) model for the simulation of model scenarios.
Among the pig farms, 83% were small and 17% were large farms. There were seven different operation types included in the population file: small swine enterprises (75%), farrow to feeder (1%), farrow to finish (6%), farrow to wean (2%), grow to finisher (13%), nursery (2%), and others (2%) (Table 1). Large operations were considered to be those with ≥1,000 head for all production types (Supplementary Table S1). The small swine enterprises operations were backyard and hobby swine farms, with < 100 heads. Bison, goat, and sheep operations were recognized as small farms (Table 1 and Supplementary Table S1). Dealers were also included in the model. Dealers were considered to be small operations which could have different species present that represented frequent aggregation and dispersion points outside of normal livestock markets.
InterSpread Plus (ISP) version 6.0 model software was used to simulate the between-herd spread of FMD in the US livestock population (28). ISP is a state-transition, stochastic and spatial modeling tool for the simulation of FMD and other similar diseases (29). The unit of interest in the model was individual livestock operations. FMD epidemics were either simulated from a single farm or two farms depending on the model scenarios. The simulation proceeded by the time-step of 1 day. The herd-level disease parameters (such as incubation phase duration and maximum infectiousness) were assigned stochastically in the models specific to animal species. The herd-level incubation phase durations (in days) assigned were Poisson (3.8) for bison (30), Poisson (5.9) for cattle (31), Poisson (6.59) for goat and sheep (30), and Poisson (5.58) for pigs (32). The infectious phase duration was assigned to be [Triangular (30, 34, 42)] days. Model parameters were based on transmission characteristics of FMDV serotype O, and all outbreaks were assumed to start in January, for the purposes of livestock placement. Depending on the model scenarios, disease spread initiated within a single state (California or Texas) from a single farm, or within two states simultaneously (California and Texas) from two farms (Table 2).
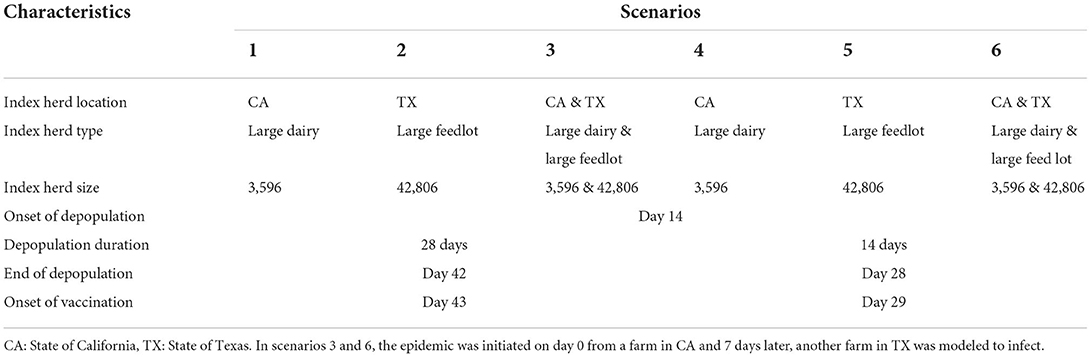
Table 2. Descriptions of the foot-and-mouth disease model scenarios.
Transmission of FMDV between farms could occur through multiple routes, including direct contacts such as animal movements, indirect contacts, such as shared vehicles or personnel, airborne transmission, and local area spread at short distances. Movement frequencies, distances, and destination types were unique to each production type, and these varied for movements to markets (Supplementary Table S2), and by the region of farm location and size (small vs. large) (Table 3, Supplementary Tables S3–S6). The daily probability of transmission of FMDV after contact between an infected and susceptible farm was estimated based on the hypergeometric probability of shipping at least one infected animal off of an infected farm given the average herd size, shipment size, and the number of infected animals in a herd on a given day. This parameter was estimated and assigned for each of the animal species (bison, cattle, goat, sheep, pig), dealers, and markets (Supplementary Figure S1).
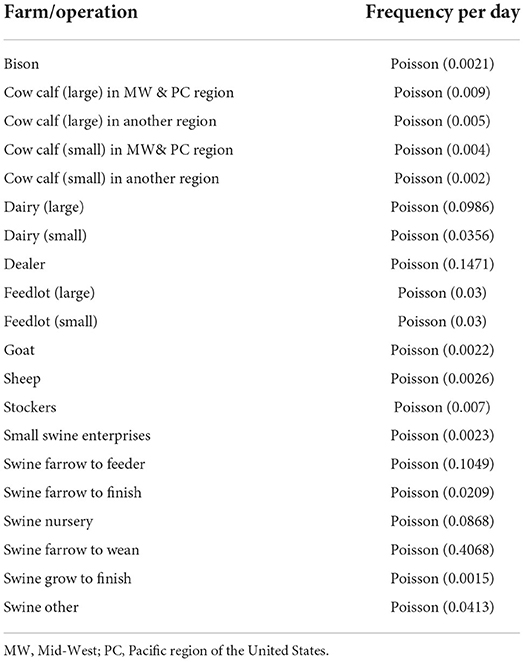
Table 3. The distributions of the average frequency of direct contact movements originated from respective farm types and operations in the various regions of the United States.
Indirect contacts between infected and susceptible farms included connections such as shared farm workers, veterinarians, vehicles, equipment. Indirect contacts were modeled as high or low risk based on the potential for viral contamination and contact with animals. High-risk indirect contacts included veterinarians, customers, dealers, employees with livestock at residence, extension agents, livestock haulers including those used for dead box pick-ups, and manure haulers. Low risk indirect contacts included commodity/feed trucks, shared equipment, drivers of livestock haulers, nutritionist, feed company consultants, other vehicles such as postal deliveries, and visitors. The indirect contact rates assigned in the ISP model scenarios are summarized in Table 4. The probability that an indirect movement occurs within a certain distance varied by production type, with most movements occurring within 20 km of the original farm (Supplementary Table S7). The probability that infection occurs was estimated for high risk and low risk indirect contact movements separately, and we assumed that low risk indirect contacts followed basic biosecurity protocols, leading to a reduced risk of disease transmission (Supplementary Figure S2).
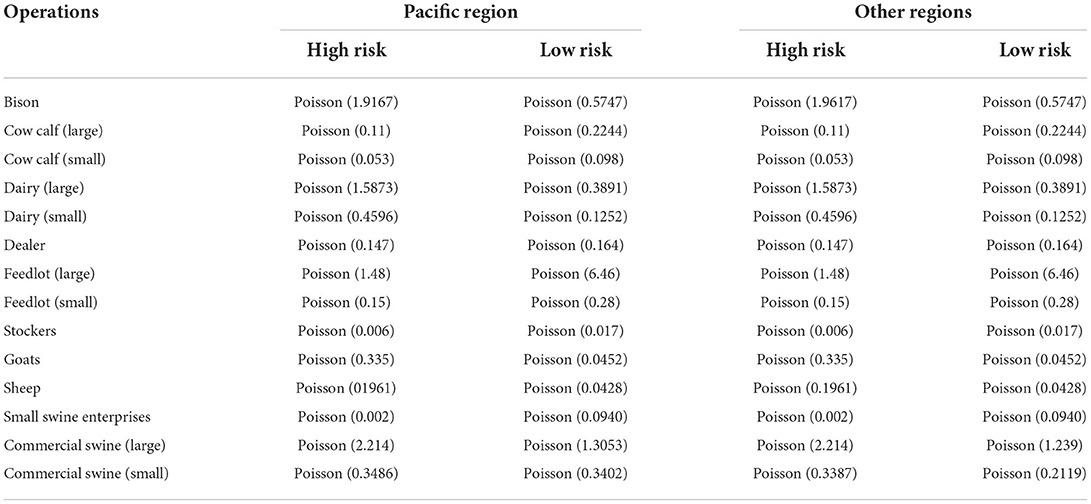
Table 4. Distributions of indirect contact rates among the livestock farms in the United States used to incorporate in the InterSpread Plus model.
Local area spread was assumed to occur at short distances (within 4 km of an infected farm) through insects, rodents, or other unknown factors. The probability of disease transmission due to local spread was modeled separately based on the status of the infected farms. Undetected, infected farms were given highest risk for disease transmission in compared to detected but not depopulated farms, or depopulated farms which still needed to complete carcass disposal (Supplementary Figures S3A–C). The airborne spread of FMDV was assumed to occur within 10 km of infected swine farms after the onset of clinical signs, with the probability of transmission declining over distance (Supplementary Figure S3D).
Initial detection was fixed on day 11 for all scenarios and after that it was based on background passive surveillance. The probability of detection during passive surveillance varied by days post-onset of clinical signs and species affected, with swine having the highest probability of detection and dealers having the lowest (Supplementary Figure S4). Following detection of an infected farm, control measures were initiated on day 1 after the detection, including the establishment of control zones. Two types of radial control zones (inner and outer) were included in the model. The inner control zone was from 0 to 10 km of the infected farms, and the outer control zone was from 10 to 20 km away from the infected farms. After the first detection, direct contact tracing, indirect contact tracing, and surveillance of all farms within the 10 km zone of the detected farms were initiated. Movement restrictions were imposed on all farms within inner control zones immediately after detection. The percentage of animal movements restricted ranged from 60% for swine up to 85% for cattle, while only 25% of indirect contact movements were restricted.
In all scenarios, depopulation of infected animals was initiated following detection on day 14; however, the duration of depopulation efforts varied between 14 and 28 days (Table 2). While initial depopulation capacity was assumed to be small (4 farms/day for the first 2 days of control activities), depopulation capacity ramped up quickly and varied by operation type. From day 3 to the end of the depopulation effort, the assigned depopulation capacity distributions were Betapert I4, 6, 10) for large cattle farms, Betapert (2, 4, 6) for small cattle, goat and sheep farms, Betapert (4, 8, 28) for large feedlots, Betapert (1, 2, 4) for large swine farms, and Betapert (2, 2, 6) for small swine farms. After 14 or 28 days of depopulation efforts, all depopulation was ceased and vaccination was initiated at day 29 or 43 post-introduction, respectively (Table 2). All cattle, bison, and swine in the 10 km zone of the detected farms were vaccinated at the rate of 85,000 cattle, 1,000 bison, and 14,000 pigs per day. Sheep and goats were not vaccinated in these scenarios. All vaccinated cattle, bison, and pigs were assumed to live out their normal production periods.
Based on the previously described model structure, six different model scenarios were simulated (Table 2). Briefly, the model scenarios were run from either one-farm (scenarios 1, 2, 4, and 5) or two-farms (scenarios 3 and 6). The characteristics of index farms differed in herd size, location, and operation types. The detected farms in a scenario were depopulated for either for 28 days (scenario 1, 2, 3) or 14 days (scenario 4, 5, 6). Vaccination was initiated after the cessation of depopulation activities, i.e., at 43rd day in scenario 1, 2, and 3 and 29th day in scenario 4, 5, and 6. A shorter duration of depopulation in the model scenarios was designed intentionally to allow vaccination-to-live strategy and thereby to estimate the risks and challenges due to emergence of persistence infection in cattle of the US livestock population. The models were simulated for 200 iterations; each iteration was simulated for 730 days (maximum). The major outcomes of the ISP model were to estimate the epidemic duration, epidemic size, number of infected and depopulated farms and animals, and the number of infected cattle potentials for the emergence of the persistent infection. To test for significance among model scenarios we used the Kruskal-Wallis test with Bonferroni correction for multiple comparison.
In this study, we quantified the number of persistently infected cattle and extinction of persistent infection over time after infection. First, the numbers of infected but not depopulated cattle (all cattle, cow calf, dairy, and feedlot and stockers combined) were estimated for each month after onset of infection using the infection data and depopulation data from ISP model outcomes for each of the scenarios. These were the monthly numbers of cattle with potential for persistent infection. Second, using literature data (Table 5), an equation (y = 0.59–0.021x) was derived to estimate prevalence of persistently infected cattle over the succeeding month after the infection. In the equation, y is the prevalence of the persistent infection and x is the month after infection. The equation demonstrated that the prevalence of persistently infected cattle was 57% after the first month of infection (28 days post infection), 55% in the second month (56 days post infection), and consequently the persistent infections were cleared by 29 months post-infection. This equation was used to estimate the numbers of persistently infected cattle at a month after FMD infection. For example, in scenario 1, altogether 28,505 cattle remained that had been infected and not depopulated; these are the cattle with potential of establishing persistent infection after 28 days of infection. Using the equation, it was estimated that after the first month of infection, 57% of these cattle (16,248) were persistently infected. When these cattle reached the third month post infection, 55% (15,678) remained persistently infected indicating that 570 cattle (2%) had cleared the persistent infection within this period. Consequently, all of the persistently infected cattle in this scenario had cleared infection by 29 months post onset of infection.
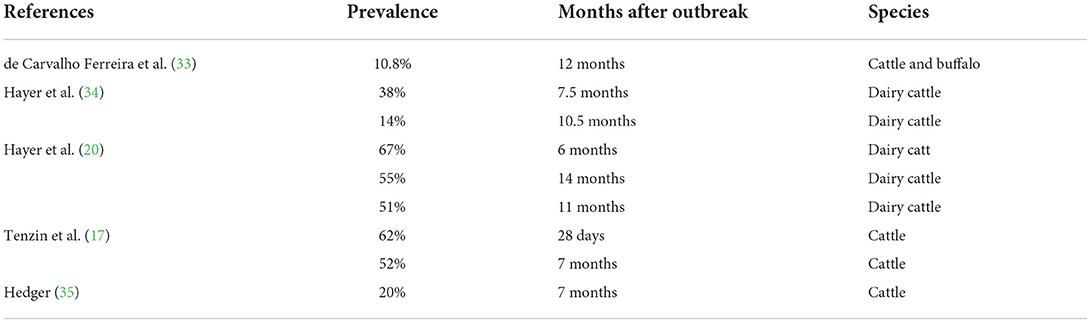
Table 5. Published studies from which data on the prevalence of persistently infected cattle were extracted to derive an equation.
In order to facilitate comparison of economic impact results to epidemiologic outcomes, an index was created based on ranking iterations by key outcomes from the ISP model within each scenario. The index was comprised of an ordinal ranking herds infected, head infected, duration, and states affected, and creating an index for each iteration based on equal weighting of each epidemiological outcome. The median, 25th percentile, and 75th percentile based on this index was analyzed in the United States Partial Equilibrium Model (36). Although the economic model has many outcomes, the ones reported for this study are the change in returns to capital and management from livestock and agricultural product sales, the change in returns to dairy cattle and milk, and the change in returns to beef cattle and beef. In each case, the scenario specific values for each quarter are subtracted from the quarterly no-disease base from 2019 to 2021.
Economic impacts for animal health outbreaks were categorized as production losses, costs of disease response on farms, and market impacts. Production losses included the loss of animals available to the market due to mortality and depopulation, as well as reduced weight gain, milk production and fecundity that resulted from clinical infection. Observations of production losses in the published literature were used in the absence of observations from FMD outbreaks in the US (Table 6). Details on the production loss parameters can be found in Supplementary material.
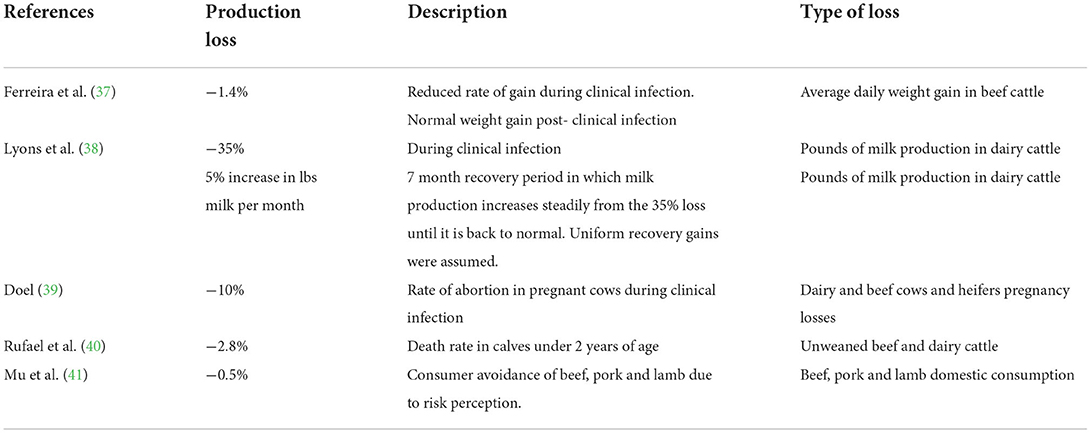
Table 6. Published studies from which data on production and demand impacts in cattle were extrapolated to estimate economic impacts of an FMD vaccinate-to-live without stamping out response.
The ISP disease spread results in infection by herd type, depopulation by herd type, duration of outbreak, and states with infected livestock, which were used as inputs in the economic modeling. Losses were tracked across time based on the quarter in which infection occurred for each herd in ISP results. The reduced beef supply available from fed cattle, the increased beef supply from culled dairy cows that aborted, and the reduced fluid milk supply for processing were incorporated as production shocks, along with the meat and milk removed from supply due to depopulation and calf deaths, in the US Partial Equilibrium Model by quarter (36).
Total on-farm costs of disease response included surveillance, depopulation and indemnification of depopulated animals, disposal of carcasses and potentially contaminated materials, cleaning and disinfection of facilities, and vaccination. Response costs were estimated in US dollars per head by production type. The response cost burden to producers for farm labor and equipment used to manage disease was not included, recognizing that some costs are part of normal herd management and that not all of the costs to producers can be foreseen. In addition, we recognize the existence of additional costs in an outbreak, but this study will focus solely on those costs associated with disease response activities on farms that are designated as infected, vaccinated and/or under surveillance at some point in the outbreak and recovery period. Total on-farm costs of disease response was carefully differentiated from the “total cost of the outbreak” which would include a variety of other costs to producers, agribusinesses, and the government. For example, the cost to a feed company of cleaning and disinfecting trucks making feed deliveries in surveillance zones, or the cost of state and federal animal health laboratory personnel. Thus, this estimate is limited to a taxpayer cost for on-farm response activities. Additional details on costs of on-farm response can be found in Supplementary materials document.
In addition to production losses and costs of response on farms that were directly impacted, losses may also accrue due to market responses. It is unknown how US trade partners or domestic consumers would respond to a vaccinate to live strategy, but literature and historical experiences for other diseases offer a place to begin developing market shocks for both trade embargoes and domestic consumer avoidance of animal products from susceptible species. Trade embargoes for beef, pork and limited dairy products were derived from the literature and World Animal Health Organization (OIE) trade guidelines (8). This is consistent with Schroeder et al. (42), the only other published study to compare vaccinate to live and vaccinate to kill. Domestic demand can also be affected by consumer avoidance, although these effects have been found to be relatively small in percentage terms and of short duration as in Mu et al. (41) examination of highly pathogenic avian influenza and bovine spongiform encephalopathy Based Mu et al.'s findings, a shallow, negative shock (−0.5%) was imposed to US beef and pork demand that was sustained through the outbreak. Recovery was allowed to occur quickly afterward. Although not modeled directly, there may actually be a positive perception by consumers of a vaccinate to live strategy since images of mass depopulation was associated with a negative public response in the UK in 2001 as found in Thompson 2002 (43). The impact of production losses, depopulation and death losses, trade embargoes and domestic consumption losses on markets were estimated using the United States Partial Equilibrium Model (USPEM) (36). This model is a national price-endogenous economic model that endogenously estimates changes in market prices and economic welfare in calendar quarter time steps. Production losses and demand shocks, as described above, were imposed on the model as exogenous shocks. Output includes market prices and producer welfare, which is defined as the difference between the schedule of prices at which producers are willing and able to supply a good in varying quantities supplied, and the price they actually realize in the market for those quantities supplied. It is different from profit in that producer welfare accounts for fixed, or sunk, costs of production.
The simulation model consisted of 1.82 million livestock farms distributed across animal production types as follows: 0.14% (bison), 84% (cattle), 7% (goat), 5% (pig), and 3% (sheep). Of the 84% designated as cattle farms, cow-calf and stockers made up 47% each, while dairy and feedlot farms made up 4 and 2%, respectively. Of the 5% designated as pig farms, 75% were small swine enterprises and 13% were grower to finisher farms. The majority of cattle and pig farms (98% each) were small holdings (Table 1), and the herd size across farm types ranged from: 1 to 50,528 head (bison), 1 to 100,734 head (cattle), 1 to 4,837 head (goat), 1 to 422,475 head (pig), and 1 to 48,160 head (sheep).
Among the simulated scenarios (Table 2), the median number of infected farms ranged from 5 to 38 farms, whereas the median number of infected animals ranged from 43,256 to 150,572 animals (Figure 1). Across the six scenarios, we found that the number of infected farms estimated from scenarios 2 and 5 were significantly smaller than the other scenarios (p < 0.0001), while the comparison among the remaining scenarios showed no significant difference in outbreak size (p > 0.05). Additionally, the number of infected farms was not significantly different between the 28- and 14-day depopulation strategies (p = 0.705). However, a slightly higher number of animals were infected in the 28-day depopulation scenarios when compared to the 14-day depopulation scenarios (p =0 .54).
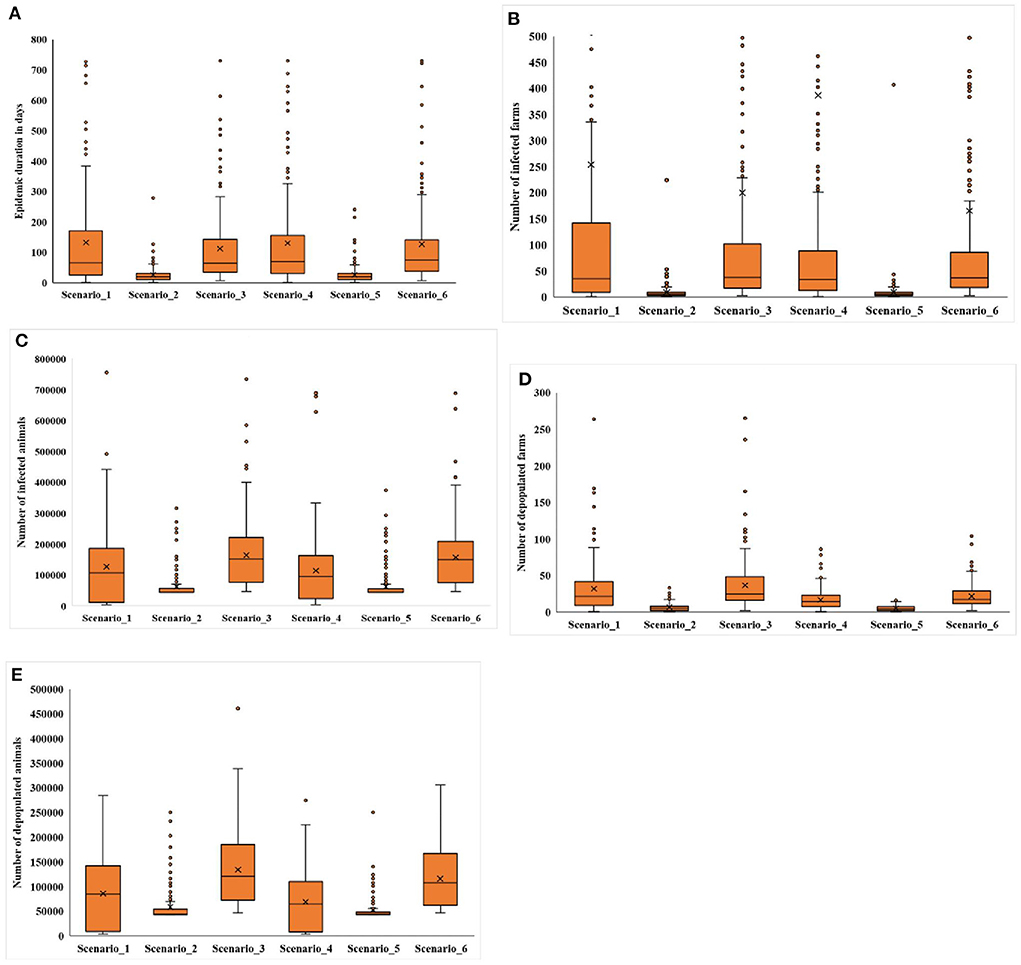
Figure 1. Box plots for (A) epidemic duration, (B) number of infected farms, (C) number of infected animals, (D) number of depopulated farms, and (E) number of depopulated animals obtained from InterSpread Plus model scenarios. The middle, lower, and the upper line of the box represents the median, 25th, and 75th percentile. The whiskers represent 1.5 times of the interquartile range. The sign × represents the mean, and the dots are the outliers detected by the analytic tool.
The median number of depopulated farms among the simulated scenarios ranged from 4 to 25 farms (Figure 1), and the number of depopulated farms was significantly higher in the scenarios using the 28-day depopulation strategy (p < 0.05) except in scenarios 2 and 5 (p = 0.4538). The median number of depopulated animals among the simulated scenarios ranged from 43,162 to 120,282 animals, while the number of depopulated cattle ranged from 43,134 to 106,625 head. Like depopulated farms, a significantly higher number of animals (p = 0.0058) and cattle (p = 0.0073) were depopulated under the 28-day depopulation strategy compared to the 14-day strategy.
The median epidemic duration ranged from 20 to 76 days among the simulated scenarios (Figure 1). The shortest epidemic duration was observed when the outbreak was initiated in a feedlot herd (scenario 2 or 5), while the longest epidemic duration occurred when infection was initiated in two herds simultaneously (scenario 6) (p < 0.0001). The epidemic duration was not significantly affected by the duration of depopulation (p = 0.4966).
In this study, we simulated a shorter duration depopulation strategy to examine scenarios in which exposed cattle could remain in the population for the full duration of their production life. It was found that 20–38% of infected cattle were not depopulated and had the potential to progress to the FMD carrier state, which is defined as maintaining detectable virus after 28 days of infection. Amongst non-depopulated and infected cattle, 57% transitioned into the carrier state after the first month of infection with the potential to remain in the population from 30 to 52 months post infection. The monthly cumulative number of persistently infected cattle, across farm types, is a function of the total number of infected animals, and correspondingly, these values were highest in scenarios where the outbreak size was large (Scenarios 1, 3, and 6) (Figure 2). Over the epidemic period, the cumulative number of infected cow-calf, dairy, and feedlot/stockers cattle ranged from 98 to 2,266 head for cow calf; 332–5,333 head for dairies; and 8,637–32,953 head for feedlot/stocker operations. The estimated number of potentially persistently infected cattle varied across scenarios, consistent with differences in outbreak size and depopulation capacity within a farm type. For example, in scenarios 2 and 5, around 5,004 cattle were estimated to be persistently infected, compared to an estimate of 18,655 in scenarios 3 and 6, after the first month of the outbreak [Figure 3 (all cattle)]. Among the different types of cattle farms, we found that feedlots and stocker farms accounted for the highest proportion of cattle with the potential to become persistently infected, followed by dairies and cow calf operations (Figure 3). These findings are consistent with the breakdown of the overall simulated cattle population by production setting, while also reflecting the difficulties of depopulating large herd sizes seen in US feedlots.
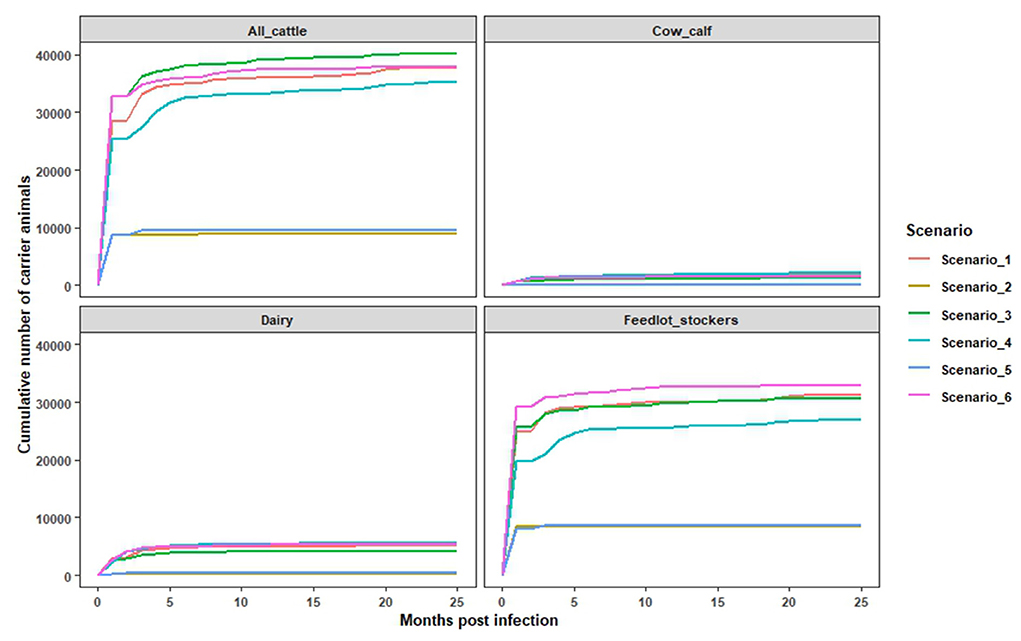
Figure 2. The estimated monthly cumulative numbers of infected but not depopulated cattle, corresponding to potential FMDV carriers. The estimates were obtained using the infection file and depopulation file data from InterSpread Model specific to all cattle, cow calf, dairy, and feedlot and stocker combined.
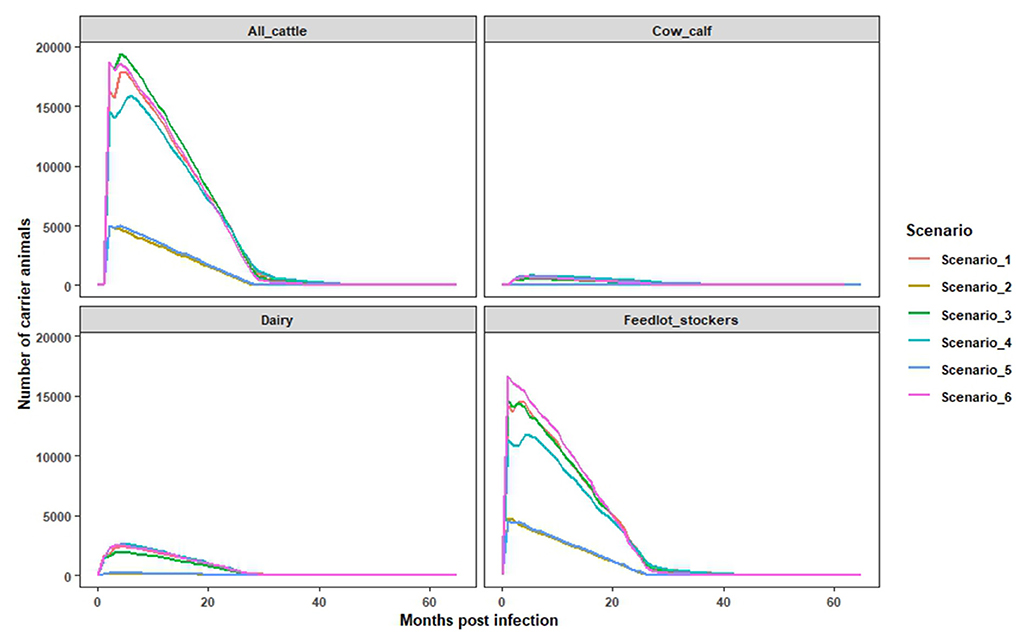
Figure 3. The estimated numbers of monthly persistently infected cattle and their extinction over the time. The estimates were obtained using the Microsoft Excel based model for all cattle, cow calf, dairy, feedlots and stockers (combined).
Lost beef production due to clinical disease was small for any given quarter (< 1% per quarter), but losses aggregated over time as outbreak duration increased. The aggregate milk losses were larger than beef losses due to the assumed time to milk production recovery, however, the milk production losses represented a small proportion of the total milk produced in the United States (< 1%) (Table 7). Scenarios that incorporated the Texas panhandle resulted in minimal milk loss, with ~22% of iterations, originating in the Texas panhandle, resulting in disease spread to dairy production sites. The median (25th, 75th percentile) pounds of reduced milk production, due to disease, ranged from 3.33 million lbs. (41,206 lbs., 6.74 million lbs.) to 8.15 million lbs. (3.10 million lbs., 16.63 million lbs.) among scenarios. For context, annual US production of fluid milk was 217.6 billion lbs. in 2018 (44). Scenarios originating in California (scenarios, 1 vs. 4 and 3 vs. 6) resulted in statistically significant milk losses (p = 0.044) at the 5% level between scenarios 1 and 4 (depopulation at 28 vs. 14 days).
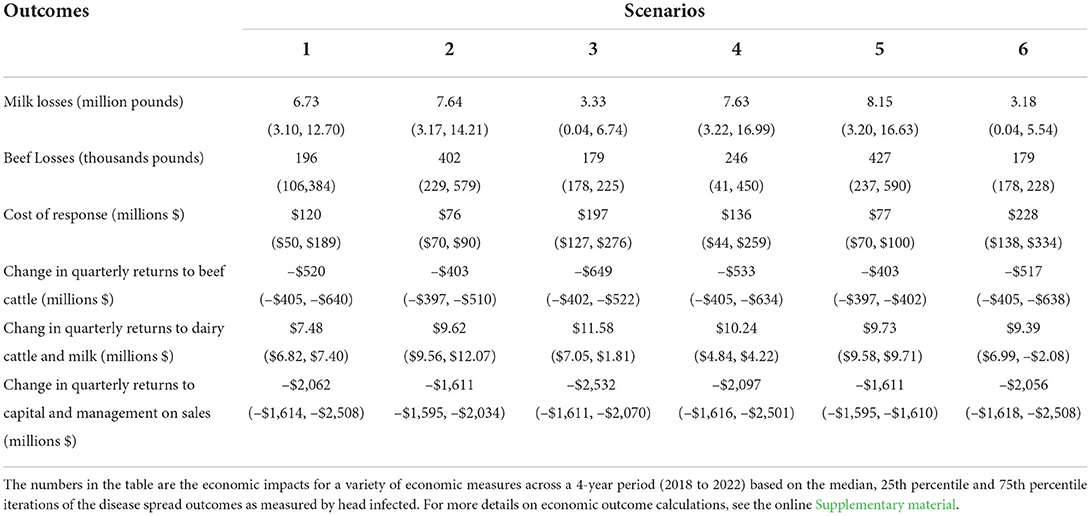
Table 7. Total economic outcomes from 2018 to 2022 associated with median (25th percentile, 75th percentile) disease outbreaks for: production losses of beef (thousands of pounds) and milk (millions of pounds) due to disease; on-farm government response cost (millions of dollars); and economic impact as measured by producer welfare (millions of dollars).
Once culling was accounted for, longer-term impacts on beef production are more ambiguous with no clear-cut outcome across all scenarios. When evaluating the near term, cattle being fed for slaughter that were assumed to have experienced reduced ADG resulted in aggregate beef reductions ranging from 179,413 lbs. (177,841 lbs., 225,340 lbs.) to 426,915 lbs. (237,195 lbs., 589,874 lbs.) of beef never realized. Further complicating beef production impacts is the fact that many dairy bred steer calves and cull dairy cows are fed out for the beef market, meaning that both CA and TX have robust beef production. The estimated beef losses from scenarios involving both the Panhandle of Texas and California dairy production (3 and 6) were significantly larger when compared to the losses in the Panhandle scenarios alone (2 and 5) (p < 0.0001). However, when comparing the two depopulation strategies of 28- or 14- days, we did not find a significant difference in beef losses (p = 0.381).
The median cost of disease response in US dollars ranged from $76 million ($70 million, $93 million) to $230 million ($139 million, $339 million) (Table 7). For all scenarios except scenario 4 (CA, 14-day depopulation), indemnities paid on depopulated livestock represented the largest portion of outbreak response cost. When outbreaks originated in the Texas Panhandle indemnities accounted for up to 64% of the response cost. The median indemnity per outbreak ranged from $47 million ($12 million, $82 million) to $119 million ($71 million, $163 million). This was not an unexpected outcome considering that the region of interest was in a cattle dense area and fed beef cattle and lactating dairy cows are highly valued on a per head basis compared to other livestock types.
During the outbreak the second highest total on-farm response cost category was surveillance for all scenarios except scenario 4 (CA, 14-day depopulation), where it was the highest response cost category. Surveillance cost ranged from $8 million ($4 million, $13 million) to $62 million ($29 million, $106 million). With the reduced duration of depopulation to either 14 or 28 days, the cost of depopulation, disposal, and cleaning and disinfection did not represent a large portion of the total on-farm response cost. To illustrate this point, depopulation, disposal and cleaning and disinfection represented 16% of the estimated total on-farm response cost per head for each animal infected in this study; however, in these scenarios they represent only 12% and 10% of overall total on-farm response cost on average for 14 day scenarios and 28 day scenarios respectively. Spending shifts toward surveillance instead. As would be expected, the outbreaks with the lowest on-farm response cost resulted from the shortest and smallest outbreaks, which occurred in the Texas panhandle scenarios. Whereas, the highest on-farm response cost resulted from the longest and largest simulated outbreaks, which occurred in scenarios started in both CA and TX. Comparisons of total on-farm response cost between scenarios produced significantly different results (p < 0.05) for all scenarios based on start location and depopulation strategy except those originating in the Texas Panhandle.
Quarterly economic impacts were estimated over a 4-year period (2018 to 2021) and aggregated (Table 7). When comparing the median (25th, 75th) lost returns to capital and management (producer welfare), every scenario resulted in a statistically significant change from the pre-disease economic baseline (p < 0.05). Over the course of the 4-year period the markets did not recover to the pre-disease forecast of production returns for any of the 6 simulated scenarios. It has not been uncommon to see multi-year recovery periods in other countries after FMD outbreaks (45).
The pre-disease baseline quarterly returns to capital and management from sales of agricultural products averaged $23 billion. The median (25th, 75th percentile) outbreaks' average quarterly economic impacts for the lost returns to capital and management from sales ranged from $1,611 million ($1,595 million, $1,610 million) to $2,097 million ($1,618 million, $2,508 million), representing an average quarterly reduction of 7% to 11% in returns to producers and agribusinesses, across the agricultural sector. However, there was not a significant difference in the economic impacts, when evaluated at the median, 25th, or 75th percentile outbreaks. This could result from the influence of the export and consumer demand shocks on the economic impacts, which were similar across scenarios because of insignificant differences in epidemic duration.
In comparison, when the individual livestock industries were examined, the beef cattle sector's quarterly returns to beef cattle production were reduced in all 6 scenarios. Those reductions in returns ranged from $403 million ($397 million, $510 million) to $649 million ($402 million, $522 million). The swine and pork sector had the greatest loss to capital and management on sales of agricultural products at 61–64% while, the beef sector return reductions ranged from a 15–23%, when compared to the pre-disease baseline. The beef sector losses were the second highest industry specific component to the total (25–26%) followed by the red meat processing sector (14–17%). In contrast, the median (25th, 75th percentile) outbreaks for the dairy cattle and milk sector resulted in insignificant differences in producer returns compared to the pre-disease baseline; dairy sector economic impacts were moderated by the ability to export pasteurized and processed dairy products.
The potential use of vaccinate-to-live approaches for FMDV eradication is closely related to understanding the epidemiology and economic impacts of the carrier state; these considerations are highly specific to variations of specific outbreak contexts. In order to explore this question in a US production setting, we developed scenarios utilizing a vaccination-to-live strategy subsequent to depopulation of infected animals for a limited period (14 or 28 days). Overall, we found that economic production impacts varied across sectors, but were overshadowed by trade impacts associated with the estimated duration that carriers would be present in the population. Vaccinate-to-live may be attractive in terms of animal welfare, conservation of limited resources during response or for preserving valuable animal genetics. The long-term consequences on industry viability and farm and ranch longevity should be the subject of further research.
The model outcomes demonstrated that the epidemic size and durations estimated from a single index (dairy cattle) herd located in California (Figure 1) resulted in similar findings to that of a previous FMD modeling study conducted in the same state, as well as simulated outbreaks in European countries (46–49). Specifically, a review of FMD outbreaks conducted using real outbreak data in non-endemic countries reported that ~46% of epidemics had < 5 infected farms, 16% of epidemics had more than 150 infected farms, and another 16% of epidemics were extensive (>2,000 infected farms) (48). In the current study, outbreaks initiating from a feedlot in the Panhandle Region of Texas resulted in a smaller number of infected farms (median = 5), which is similar to the findings of the previously review (48). Another modeling study predicted smaller outbreaks when the index herd was beef cattle as was found in scenarios 2 and 5 of this study (46). Differences in movements associated with both direct and indirect contacts on dairy vs. feedlot operations likely drove this difference in outbreak size.
We found that, in most scenarios (iterations), early onset of vaccination reduced the epidemic size and depopulation burdens. For example, outbreaks with >100 infected farms were found in 31% of iterations in scenario 1 (vaccination onset on day 43), whereas only 23% of iterations reached this level when the vaccination was initiated on day 29 of simulation (Scenario 4). This is consistent with previous studies looking at FMD control in California and in Denmark (6, 49), which also found a similar epidemic duration and outbreak size. Though the epidemic size and length was reduced by early vaccination, the overall impact of vaccination on controlling an outbreak is influenced by several factors, such as available resources for vaccination and other control programs, compliance with movement restrictions and on farm biosecurity standards, and efficacy of the vaccines. As such, the use of vaccination must be considered in the context of the specific outbreak. In some settings, a particular vaccination strategy could result in overwhelming resource demands (humans, financial, and logistics) or result in extensive economic impacts (46). For example, the culling of vaccinated animals could increase the number of animals depopulated and be counterproductive considering the environmental impacts and resource allocations for carcass disposal and post-disposal activities. Additionally, there could be a shift in resource allocation and on-farm response costs as suggested in the economic model output, with indemnities paid out absorbing the largest portion of cost for all scenarios except scenario 4 where the outbreak was initiated on a dairy site in CA and depopulation was started at 14 days. In this scenario, surveillance absorbed the largest portion of cost. A vaccinate-to-live strategy could extend the trade ban period and result in the establishment of FMDV carrier animals (cattle, sheep and goats) in the population, which necessitates additional consideration for resource allocations for their management. As a result, the efficacy of vaccination in reducing outbreak size and duration should be balanced with an understanding of the additional resources and long-term implications of managing or disposing of vaccinated animals.
In this study, implementation of vaccinate-to-live strategy allowed up to 35% of infected cattle to remain in the population, and these cattle had the potential to become asymptomatic carriers of FMDV. Based on our modeling approach, the majority (57%) of non-depopulated, infected cattle transitioned into the carrier state after the first month of infection with the potential to remain in the population from 30 to 52 months post infection. Under such circumstances, the management of carrier animals would surely place an additional resource demand on response personnel. However, it is possible that this additional demand could be offset by reducing the resources required for depopulation and carcass disposal under a stamping-out or vaccinate-to-die strategy.
The results from the economic analysis suggested a reduction in overall on-farm response cost of 12% and 10% with the implementation of 14- or 28-day depopulation, respectively, from an estimated 16% under stamping-out. During a shorter and smaller epidemic (scenario 2 and 4), vaccination may not be beneficial as compared to stamping-out. Market impact analysis including the international and domestic trade consequences further affects the decisions regarding vaccination, depopulation and management of potential carrier animals (47). FMD is a disease that has the potential to cause considerable and lasting damage in export markets. In the case of outbreaks that are shorter and smaller, the economic damages from consumer avoidance and trade more than offset savings from reduced response costs. However, with the development of vaccines that can differentiate infected from vaccinated animals (DIVA), improved testing for carrier animals, and an improved understanding of the risks associated with carrier animals, an opportunity exists to refine trade embargo guidelines and regionalization agreements to account for alternative response strategies that may be needed in the event of resource constraints.
There was no conclusive impact on economic losses from the early onset of vaccination for on-farm response costs or economic returns as compared to later onset of vaccination. Government response costs were primarily associated with the indemnification of high value beef and dairy cattle and surveillance costs, including the costs of testing in vaccinated herds. Surveillance would be critically important to establish regionalization with key trade partners, and consequently limit trade impacts where possible. In this study, only Canada and Mexico were assumed to regionalize trade bans. Trade ban duration was linked to epidemic duration, based on the OIE standards, and epidemic duration was also used as the period of consumer avoidance. ISP results indicated that the only scenarios with significantly different simulated durations were scenarios 2 and 5, which had shorter durations than other outbreaks. Consequently, the trade embargo and consumer demand results were not greatly different except for scenarios 2 and 5. The economic losses in the Panhandle outbreaks were only 1% lower than other start locations in the 25th percentile but could range much higher (22%-36%) in larger simulated outbreaks. The greatest contributor to national economic loss was not the cost of managing carrier animals, but rather trade losses and consumer reaction; this coincides with studies of FMD vaccination in the US (50) and also with evidence from FMD outbreaks in other countries where vaccinate-to-live was practiced (51). As more scientific gaps are filled regarding FMDV persistence and transmission, there will be revision in FMD economic impact based upon how managers and consumers will respond to alternatives to stamping-out approaches. Further research is needed to address these gaps and refine analyses of vaccinate-to-live strategies given the potential of improved tracking and management carrier animals.
In executing this study, limited information was available on which to base assumptions of production losses in FMD recovered cattle, and these estimates could be improved by additional research on production losses in FMD-recovered herds. Although not explicitly examined in this study, it is possible that carrier animals would be removed from the herd more rapidly due to emergence of hoof deformity issues or other sequelae (14). A producer weighing the cost of monitoring and managing herd health in herds with carriers may not reap enough profit from recovered cows to keep those animals in production. Instead, those cows might be culled and replaced with new stock. Further, breeding stock producers with the highest potential gains associated with protecting genetic advances may also have the highest value associated with their brand and reputation. It may be more difficult to sell replacement animals out of vaccinated herds; however, there is no information on which to develop additional analyses regarding early culling due to reputation concerns at this time. Thus, the potential for livestock operations to accelerate removal of recovered livestock, or even go out of business, should be investigated more explicitly to fully understand the potential economic consequences of maintenance of carrier animals.
It is unknown at this time how US consumers would react to a vaccinate-to-live strategy without stamping out. Communication of scientific information on the safety of FMD-recovered animals living out their productive life and entering the US food chain would be crucial. It is also unknown how trade partners would react to FMD-recovered animals being allowed to continue production, given surveillance and tracing of recovered and vaccinated herds. However, even with relatively conservative trade embargo and consumer avoidance assumptions as compared to other studies (42, 50), beef markets did not recover to the pre-disease returns in the 4-year period examined. The uncertainty surrounding market recovery in the United States livestock industry, from a vaccinate-to-live without stamping-out strategy, could mean that there would be additional losses beyond the time period analyzed in this study. Improved understanding of the risks of carrier animals, along with higher potency vaccines and companion diagnostic tools, may contribute to shorter durations of risk-based trade embargoes in future outbreaks (8, 11). Further research that contributes to the understanding of FMD carrier risk may help align trade recovery guidelines, and perhaps reduce the economic burden associated with allowing recovered and vaccinated animals to live out a productive life.
The major caveat of this study is that the estimated outcomes are largely dependent on the input parameters and livestock demographics of the United States; therefore, extrapolation of these findings should be conservative. Further, it was necessary to assume that once animals entered the carrier phase, there was no transmission of FMDV; although this reflects the consensus of the published literature, it is also possible that low-level transmission does occur (11), which could have various downstream impacts on the findings herein. Similarly, simulations were conducted using serotype O-based transmission parameters, which may not reflect the full diversity of FMD viruses and transmission dynamics. Additionally, economic impacts were largely dependent on the parameters and baseline economic returns of the economic model, and the assumptions on trade and consumer avoidance. Both of these reactions may be influenced by risk perceptions associated with an individual outbreak (41, 52), and are very difficult to predict. Thus, these economic results should also be extrapolated cautiously.
These results can be used to inform the consideration of vaccinate-to-live and controlled slaughter strategies for FMD outbreaks and the development of appropriate post-outbreak surveillance. Furthermore, this output will enable more detailed examination of the epidemiologic and economic implications of allowing convalescent cattle to survive and remain in production chains after FMD outbreaks in FMD-free regions. With the development of next generation DIVA vaccines, improved diagnostic tests to identify carriers, and an improved understanding of the risks associated with carrier animals, an opportunity exists to refine trade embargo guidelines and regionalization agreements to account for alternative response strategies to FMD outbreaks. It is envisioned that further improvement of vaccine and diagnostic technologies will contribute toward greater confidence in vaccinate-to-live strategies for FMD control.
The original contributions presented in the study are included in the article/Supplementary material, further inquiries can be directed to the corresponding author/s.
SY and AD: conceptualization of research and study design. SY: model scenarios development, data analysis and visualization, and drafting of the manuscript. AH: economic assessment design and analysis. CS, AD, MB, KM-T, LH, and JA: contributions to writing, reviewing, and editing the manuscript. All authors contributed to the article and approved the submitted version.
This project was funded through an interagency agreement between the USDA-Agricultural Research Service (ARS/USDA) and the Center for Epidemiology and Animal Health of the US Department of Agriculture (USDA), Animal and Plant Health Inspection Service. Additional funds came from ARS/USDA CRIS Project 1940-32000-061-00D. SY and KM-T were recipients of a Plum Island Animal Disease Center Research Participation program fellowship, administered by Oak Ridge institute for Science and Education (ORISE) through an interagency agreement with the US Department of Energy.
The authors declare that the research was conducted in the absence of any commercial or financial relationships that could be construed as a potential conflict of interest.
All claims expressed in this article are solely those of the authors and do not necessarily represent those of their affiliated organizations, or those of the publisher, the editors and the reviewers. Any product that may be evaluated in this article, or claim that may be made by its manufacturer, is not guaranteed or endorsed by the publisher.
The Supplementary Material for this article can be found online at: https://www.frontiersin.org/articles/10.3389/fvets.2022.1026592/full#supplementary-material
1. Arzt J, Juleff N, Zhang Z, Rodriguez L. The pathogenesis of foot-and-mouth disease I: viral pathways in cattle. Transbound Emerg Dis. (2011) 58:291–304. doi: 10.1111/j.1865-1682.2011.01204.x
2. Grubman MJ, Baxt B. Foot-and-mouth disease. Clin Microbiol Rev. (2004) 17:465–93. doi: 10.1128/CMR.17.2.465-493.2004
3. Alexandersen S, Zhang Z, Donaldson AI, Garland A. The pathogenesis and diagnosis of foot-and-mouth disease. J Comp Pathol. (2003) 129:1–36. doi: 10.1016/S0021-9975(03)00041-0
4. Brito B, Rodriguez L, Hammond J, Pinto J, Perez A. Review of the global distribution of foot-and-mouth disease virus from 2007 to 2014. Transbound Emerg Dis. (2017) 64:316–32. doi: 10.1111/tbed.12373
5. Bouma A, Elbers A, Dekker A, De Koeijer A, Bartels C, Vellema P, et al. The foot-and-mouth disease epidemic in The Netherlands in 2001. Prev Vet Med. (2003) 57:155–66. doi: 10.1016/S0167-5877(02)00217-9
6. Boklund A, Halasa T, Christiansen LE, Enøe C. Comparing control strategies against foot-and-mouth disease: will vaccination be cost-effective in Denmark? Prev Vet Med. (2013) 111:206–19. doi: 10.1016/j.prevetmed.2013.05.008
7. USDA APHIS FMD Response Plan: The Red Book. Washington, DC: United States Department of Agriculture (2012).
8. Geale D, Barnett P, Clarke G, Davis J, Kasari T. A review of OIE country status recovery using vaccinate-to-live versus vaccinate-to-die foot-and-mouth disease response policies II: waiting periods after emergency vaccination in FMD free countries. Transbound Emerg Dis. (2015) 62:388–406. doi: 10.1111/tbed.12165
9. OIE. Terrestrial Animal Health Code, Edition 22. Paris: World Organisation for Animal Health (2020). Available online at: https://www.woah.org/en/what-we-do/standards/codes-and-manuals/terrestrial-code-online-access/ (accessed April 05, 2020).
10. Hagerman AD, McCarl BA, Carpenter TE, Ward MP, O'Brien J. Emergency vaccination to control foot-and-mouth disease: implications of its inclusion as a US policy option. Appl Econ Perspect Policy. (2012) 34:119–46. doi: 10.1093/aepp/ppr039
11. Stenfeldt C, Arzt J. The carrier conundrum; a review of recent advances and persistent gaps regarding the carrier state of foot-and-mouth disease virus. Pathogens. (2020) 9:167. doi: 10.3390/pathogens9030167
12. Stenfeldt C, Eschbaumer M, Rekant SI, Pacheco JM, Smoliga GR, Hartwig EJ, et al. The foot-and-mouth disease carrier state divergence in cattle. J Virol. (2016) 90:6344–64. doi: 10.1128/JVI.00388-16
13. Sutmoller P, Gaggero A. Foot-and mouth diseases carriers. Vet Rec. (1965) 77:968–9. doi: 10.1136/vr.77.33.968
14. Arzt J, Baxt B, Grubman M, Jackson T, Juleff N, Rhyan J, et al. The pathogenesis of foot-and-mouth disease II: viral pathways in swine, small ruminants, and wildlife; myotropism, chronic syndromes, and molecular virus–host interactions. Transbound Emerg Dis. (2011) 58:305–26. doi: 10.1111/j.1865-1682.2011.01236.x
15. Fish I, Stenfeldt C, Spinard E, Medina GN, Azzinaro PA, Bertram MR, et al. Foot-and-mouth disease virus interserotypic recombination in superinfected carrier cattle. Pathogens. (2022) 11:644. doi: 10.3390/pathogens11060644
16. Bertram MR, Vu LT, Pauszek SJ, Brito BP, Hartwig EJ, Smoliga GR, et al. Lack of transmission of foot-and-mouth disease virus from persistently infected cattle to naïve cattle under field conditions in Vietnam. Front Vet Sci. (2018) 5:174. doi: 10.3389/fvets.2018.00174
17. Tenzin, Dekker A, Vernooij H, Bouma A, Stegeman A. Rate of foot-and-mouth disease virus transmission by carriers quantified from experimental data. Risk Anal Int J. (2008) 28:303–9. doi: 10.1111/j.1539-6924.2008.01020.x
18. Arzt J, Belsham GJ, Lohse L, Bøtner A, Stenfeldt C. Transmission of foot-and-mouth disease from persistently infected carrier cattle to naive cattle via transfer of oropharyngeal fluid. Msphere. (2018) 3:e00365-18. doi: 10.1128/mSphere.00365-18
19. Bertram MR, Yadav S, Stenfeldt C, Delgado A, Arzt J. Extinction dynamics of the foot-and-mouth disease virus carrier state under natural conditions. Front Vet Sci. (2020) 7:276. doi: 10.3389/fvets.2020.00276
20. Hayer S, Ranjan R, Biswal J, Subramaniam S, Mohapatra J, Sharma G, et al. Quantitative characteristics of the foot-and-mouth disease carrier state under natural conditions in India. Transbound Emerg Dis. (2018) 65:253–60. doi: 10.1111/tbed.12627
21. Condy J, Hedger R, Hamblin C, Barnett I. The duration of the foot-and-mouth disease virus carrier state in African buffalo (i) in the individual animal and (ii) in a free-living herd. Comp Immunol Microbiol Infect Dis. (1985) 8:259–65. doi: 10.1016/0147-9571(85)90004-9
22. Alexandersen S, Zhang Z, Donaldson AI. Aspects of the persistence of foot-and-mouth disease virus in animals—the carrier problem. Microbes Infect. (2002) 4:1099–110. doi: 10.1016/S1286-4579(02)01634-9
23. Alexandersen S, Mowat N. Foot-and-mouth disease: host range and pathogenesis. In: Foot-and-Mouth Disease Virus. Surrey: Springer (2005). p. 9–42. doi: 10.1007/3-540-27109-0_2
24. Burrows R. Studies on the carrier state of cattle exposed to foot-and-mouth disease virus. Epidemiol Infect. (1966) 64:81–90. doi: 10.1017/S0022172400040365
25. Barnett P, Geale D, Clarke G, Davis J, Kasari T. A review of OIE country status recovery using vaccinate-to-live versus vaccinate-to-die foot-and-mouth disease response policies I: benefits of higher potency vaccines and associated NSP DIVA test systems in post-outbreak surveillance. Transbound Emerg Dis. (2015) 62:367–87. doi: 10.1111/tbed.12166
26. Arnold M, Paton D, Ryan E, Cox S, Wilesmith J. Modelling studies to estimate the prevalence of foot-and-mouth disease carriers after reactive vaccination. Proc R Soc B Biol Sci. (2008) 275:107–15. doi: 10.1098/rspb.2007.1154
27. Burdett CL, Kraus BR, Garza SJ, Miller RS, Bjork KE. Simulating the distribution of individual livestock farms and their populations in the United States: an example using domestic swine (Sus scrofa domesticus) farms. PLoS ONE. (2015) 10:e0140338. doi: 10.1371/journal.pone.0140338
28. ISP. InterSpread Plus version 6. (2016). Available online at: http://www.interspreadplus.com/ (accessed January 15, 2019).
29. Stevenson M, Sanson R, Stern M, O'Leary B, Sujau M, Moles-Benfell N, et al. InterSpread Plus: a spatial and stochastic simulation model of disease in animal populations. Prev Vet Med. (2013) 109:10–24. doi: 10.1016/j.prevetmed.2012.08.015
30. Mardones F, Perez A, Sanchez J, Alkhamis M, Carpenter T. Parameterization of the duration of infection stages of serotype O foot-and-mouth disease virus: an analytical review and meta-analysis with application to simulation models. Vet Res. (2010) 41:45. doi: 10.1051/vetres/2010017
31. Yadav S, Stenfeldt C, Branan MA, Moreno-Torres KI, Holmstrom L, Delgado A, et al. Parameterization of the durations of phases of foot-and-mouth disease in cattle. Front Vet Sci. (2019) 6:263. doi: 10.3389/fvets.2019.00263
32. Moreno-Torres KI, Delgado AH, Branan MA, Yadav S, Stenfeldt C, Arzt J. Parameterization of the durations of phases of foot-and-mouth disease in pigs. Prev Vet Med. (2022) 202:105615. doi: 10.1016/j.prevetmed.2022.105615
33. de Carvalho Ferreira H, Pauszek S, Ludi A, Huston C, Pacheco J, Le V, et al. An integrative analysis of foot-and-mouth disease virus carriers in Vietnam achieved through targeted surveillance and molecular epidemiology. Transbound Emerg Dis. (2017) 64:547–63. doi: 10.1111/tbed.12403
34. Hayer S, VanderWaal K, Ranjan R, Biswal J, Subramaniam S, Mohapatra J, et al. Foot-and-mouth disease virus transmission dynamics and persistence in a herd of vaccinated dairy cattle in India. Transbound Emerg Dis. (2018) 65:e404–15. doi: 10.1111/tbed.12774
35. Hedger R. The isolation and characterization of foot-and-mouth disease virus from clinically normal herds of cattle in Botswana. Epidemiol Infect. (1968) 66:27–36. doi: 10.1017/S0022172400040912
36. Paarlberg PL, Lee JG, Seitzinger AH. Potential revenue impact of an outbreak of foot-and-mouth disease in the United States. J Am Vet Med Assoc. (2002) 220:988–92. doi: 10.2460/javma.2002.220.988
37. Ferrari G, Tasciotti L, Khan E, Kiani A. Foot-and-mouth disease and its effect on milk yield: an economic analysis on livestock holders in Pakistan. Transbound Emerg Dis. (2014) 61:e52–9. doi: 10.1111/tbed.12072
38. Lyons NA, Alexander N, Stärk KD, Dulu TD, Sumption KJ, James AD, et al. Impact of foot-and-mouth disease on milk production on a large-scale dairy farm in Kenya. Prev Vet Med. (2015) 120:177–86. doi: 10.1016/j.prevetmed.2015.04.004
40. Rufael T, Catley A, Bogale A, Sahle M, Shiferaw Y. Foot and mouth disease in the Borana pastoral system, southern Ethiopia and implications for livelihoods and international trade. Trop Anim Health Prod. (2008) 40:29–38. doi: 10.1007/s11250-007-9049-6
41. Mu JE, McCarl BA, Hagerman A, Bessler D. Impacts of bovine spongiform encephalopathy and avian influenza on US meat demand. J Integr Agric. (2015) 14:1130–41. doi: 10.1016/S2095-3119(14)60996-5
42. Hayes D, Fabiosa J, Elobeid A, Carriquiry M. Economy wide impacts of a foreign animal disease in the United States. Center for Agricultural and Rural Development (CARD) at Iowa State University (2011).
43. Thompson D, Muriel P, Russell D, Osborne P, Bromley A, Rowland M, et al. Economic costs of the foot and mouth disease outbreak in the United Kingdom in 2001. Rev Sci Tech Off Int Epizoot. (2002) 21:675–85. doi: 10.20506/rst.21.3.1353
44. USDA. National Milk Production Measured in Pounds. USDA- NAAS.https://www.nass.usda.gov/Publications/Todays_Reports/reports/mkpr1118.pdf (accessed November 30, 2019).
45. Johnson KK, Hagerman AD, Thompson JM, Kopral CA. Factors influencing export value recovery after highly pathogenic poultry disease outbreaks. Int Food Agribus Manag Rev. (2015) 18:27–42. doi: 10.22004/ag.econ.207000
46. Bates TW, Thurmond MC, Carpenter TE. Results of epidemic simulation modeling to evaluate strategies to control an outbreak of foot-and-mouth disease. Am J Vet Res. (2003) 64:205–10. doi: 10.2460/ajvr.2003.64.205
47. Carpenter TE, O'Brien JM, Hagerman AD, McCarl BA. Epidemic and economic impacts of delayed detection of foot-and-mouth disease: a case study of a simulated outbreak in California. J Vet Diagn Invest. (2011) 23:26–33. doi: 10.1177/104063871102300104
48. McLaws M, Ribble C. Description of recent foot and mouth disease outbreaks in nonendemic areas: exploring the relationship between early detection and epidemic size. Can Vet J. (2007) 48:1051.
49. Martínez-López B, Perez A, Sánchez-Vizcaíno J. A simulation model for the potential spread of foot-and-mouth disease in the Castile and Leon region of Spain. Prev Vet Med. (2010) 96:19–29. doi: 10.1016/j.prevetmed.2010.05.015
50. Schroeder TC, Pendell DL, Sanderson MW, Mcreynolds S. Economic impact of alternative FMD emergency vaccination strategies in the midwestern United States. J Agric Appl Econ. (2015) 47:47–76. doi: 10.1017/aae.2014.5
51. Countryman AM, Hagerman AD. Retrospective economic analysis of foot and mouth disease eradication in the latin american beef sector. Agribusiness. (2017) 33:257–73. doi: 10.1002/agr.21472
Keywords: foot-and-mouth disease, FMD, vaccination, carrier, virus, economic model, simulation model, persistent
Citation: Yadav S, Delgado AH, Hagerman AD, Bertram MR, Moreno-Torres KI, Stenfeldt C, Holmstrom L and Arzt J (2022) Epidemiologic and economic considerations regarding persistently infected cattle during vaccinate-to-live strategies for control of foot-and-mouth disease in FMD-free regions. Front. Vet. Sci. 9:1026592. doi: 10.3389/fvets.2022.1026592
Received: 24 August 2022; Accepted: 30 September 2022;
Published: 20 October 2022.
Edited by:
Alejandra Victoria Capozzo, Consejo Nacional de Investigaciones Científicas y Técnicas (CONICET), ArgentinaReviewed by:
Manuel Jose Sanchez Vazquez, Pan American Health Organization, United StatesCopyright © 2022 Yadav, Delgado, Hagerman, Bertram, Moreno-Torres, Stenfeldt, Holmstrom and Arzt. This is an open-access article distributed under the terms of the Creative Commons Attribution License (CC BY). The use, distribution or reproduction in other forums is permitted, provided the original author(s) and the copyright owner(s) are credited and that the original publication in this journal is cited, in accordance with accepted academic practice. No use, distribution or reproduction is permitted which does not comply with these terms.
*Correspondence: Amy H. Delgado, YW15LmguZGVsZ2Fkb0B1c2RhLmdvdg==
Disclaimer: All claims expressed in this article are solely those of the authors and do not necessarily represent those of their affiliated organizations, or those of the publisher, the editors and the reviewers. Any product that may be evaluated in this article or claim that may be made by its manufacturer is not guaranteed or endorsed by the publisher.
Research integrity at Frontiers
Learn more about the work of our research integrity team to safeguard the quality of each article we publish.