
94% of researchers rate our articles as excellent or good
Learn more about the work of our research integrity team to safeguard the quality of each article we publish.
Find out more
ORIGINAL RESEARCH article
Front. Vet. Sci., 11 January 2023
Sec. Veterinary Pharmacology and Toxicology
Volume 9 - 2022 | https://doi.org/10.3389/fvets.2022.1021440
This article is part of the Research TopicEthnoveterinary Practices in Livestock: Animal Production, Healthcare, and Livelihood DevelopmentView all 9 articles
 Siddiq Ur Rahman1
 Hassan Ur Rehman1Inayat Ur Rahman2Muazzam Ali Khan3Fazli Rahim3Hamid Ali4Dekun Chen5Wentao Ma6*
The beef tapeworm, also known as Taenia saginata, is a zoonotic tapeworm from the genus Taenia in the order Cyclophyllidea. Taenia saginata is a food-borne zoonotic parasite with a worldwide distribution. It poses serious health risks to the host and has a considerable negative socioeconomic impact. Previous studies have explained the population structure of T. saginata within the evolutionary time scale and adaptive evolution. However, it is still unknown how synonymous codons are used by T. saginata. In this study, we used 90 T. saginata strains, applying the codon usage bias (CUB). Both base content and relative synonymous codon usage (RSCU) analysis revealed that AT-ended codons were more frequently used in the genome of T. saginata. Further low CUB was observed from the effective number of codons (ENC) value. The neutrality plot analysis suggested that the dominant factor of natural selection was involved in the structuring of CUB in T. saginata. Further analysis showed that T. saginata has adapted host-specific codon usage patterns to sustain successful replication and transmission chains within hosts (Bos taurus and Homo sapiens). Generally, both natural selection and mutational pressure have an impact on the codon usage patterns of the protein-coding genes in T. saginata. This study is important because it characterized the codon usage pattern in the T. saginata genomes and provided the necessary data for a basic evolutionary study on them.
Codon usage bias (CUB) refers to the phenomenon in which synonymous codons are not used with equal frequency during gene translation. CUB is a common phenomenon in numerous species, including prokaryotes and eukaryotes (1, 2). It has been noted that a variety of factors affect how codons are used by different organisms. The primary explanations for the variance in codon usage among the genes in these species are assumed to be weak natural selection and mutational pressure (3). Understanding the fundamental characteristics of a genome's molecular organization requires extensive research into codon usage patterns across the entire genome. Furthermore, analysis of CUB has numerous other crucial applied aspects, including heterologous gene expression (4), identifying species origins (5), designing degenerate primers (6), predicting gene expression levels (7, 8), and predicting gene functions (9). However, the majority of the numerous reports on CUB have concentrated on model organisms and numerous microorganisms, including yeast (10), Giardia lamblia (11), and Entamoeba histolytica (12). For instance, it has been noted that most preferred codons in Caenorhabditis elegans end in G or C (the majority being C endings) (13). In contrast, studies on tapeworms are limited. Taenia saginata is a significant parasitic tapeworm with a large geographical distribution (14, 15).
The beef tapeworm, also known as T. saginata, is a zoonotic tapeworm from the genus Taenia in the order Cyclophyllidea (16). It is the most frequent tapeworm that causes taeniasis in humans and cysticercosis in cattle (17). Additionally, in Europe, the infection has been found in both cattle and humans, indicating that the parasite is continuously spreading (18, 19). Taenia saginata is found in all continents and is endemic to eastern Europe, Southeast Asia, Africa, and Latin America (20–22). However, in addition to the classic strain of this parasite found in southern regions, which is associated with cattle raising, there is a lesser known form of T. saginata in northern regions (20). Taenia saginata produces long-term infections, being able to survive within its host for several years, maintaining a dynamic and complex host-parasite relationship (23, 24). Taenia saginata lives in cattle as an intermediate host while in humans as a definitive host (15). Their eggs passed in the feces of an infected person are only infectious to cattle. Taeniasis, or human tapeworm infection, is induced by eating undercooked contaminated meat and usually results in very mild clinical symptoms (14, 17), with few complications, such as an intestinal blockage. Most patients infected with T. saginata have epigastric pain, nausea, weight loss, and poor appetite (25). Cattle infected with T. saginata have a significant negative impact on the economy in terms of food production and trade restrictions (26). Uncertainty exists about the pattern of synonymous codon usage by T. saginata. In this study, we used a multivariate statistical analysis to examine the codon usage patterns of T. saginata using complete coding data. Understanding the underlying mechanism for biased usage of synonymous codons and selecting suitable host expression systems for optimal expression of target genes would be made possible by analysis of the codon usage pattern in T. saginata.
A total of 90 complete coding sequences (CDSs) of the T. saginata were retrieved from the National Center for Biotechnology Information (NCBI) GenBank database (https://ncbi.nlm.nih.gov/nuccore/?term=Taenia+saginata). The number of nucleotides in the coding sequence was an exact multiple of three (27). Complete information about the overall 90 T. saginata strains associated with Asian, African, and European countries is listed in Supplementary Table S1.
In this study, we employed CodonW software to determine the total base composition (G, C, A, and T%) and the contents of the nucleotide at the 3rd codon location (C3, T3, G3, and A3%) for all synonymous codons in T. saginata. The GC% contents of all three codon locations (GC1, GC2, and GC3%) were measured. Additionally, the average frequency of G/C at GC12 locations and the overall GC/AT compositions were also determined. Furthermore, only 59 synonymous codons encoding 18 amino acids were considered for the present study, not including the first ATG codon, the codon (TGG) encoding tryptophan, and the three termination codons (TAG, TAA, and TGA), respectively (5).
Relative synonymous codon usage (RSCU) values indicate the observed codon occurrence to its random occurrence, suggesting that all the identical codons of the T. saginata are equal in usage. There are frequently occurring codons that have an RSCU value greater than one, and less frequently occurring codons that have an RSCU value less than one in the CDS (28). Higher CUB or more frequently used codons were determined through high RSCU. In the coding sequence, the overrepresented codon represents the codon RSCU value >1.6, and the underrepresented codon represents the codon RSCU value <0.6 (29). The RSCU value was determined for each codon using the following formula (30):
In this study, ni is the number of codons for the ith amino acid, and Xij denotes the frequency of the jth codon for the ith amino acid.
The codon adaptation index (CAI) is applied to calculate the gene expression level depending on its codon-based sequence. The value of CAI value varies from zero to one; a value near one indicates higher levels of CUB (31). The CAI was determined through an online tool used for CAI calculation, “CAIcal” (32) where the Bos taurus and Homo sapiens genomes were used as a reference source. Furthermore, the e-CAI (expected CAI) was analyzed using the online tool “CAIcal.” The values of RSCU for the B. taurus and H. sapiens genomes were retrieved from the database of codon usage.
The similarity index (SiD) measuring how the overall codon usage pattern of the host affects the overall codon usage of the parasite was determined as follows:
where R(A, B) denotes the degree of similarity between the host and the T. saginata overall codon usage patterns, which is defined as the cosine value of the included angle between A and B. Among the 59 synonymous codons in T. saginata, ai is defined as the RSCU value for a particular codon. The RSCU value for the host's identical codon is known as bi. The value of D(A, B) ranges from 0 to 1.0 and shows the potential impact of the host's total codon usage on that of T. saginata (33).
To determine the proper measurement of codon bias, ENC (effective number of codons) was performed, which measures the total usage of the codon in a certain gene (34, 35). It clarifies the ratio of codon variation in a gene from the total even usage of codons, which are synonymous. The ENC value varies from 20 (where one amino acid encodes one codon only) to 61 (where each amino acid is used randomly for all codons). ENC value <35 implies significant CUB (34, 36). A plot between ENC-GC3s is drawn out to determine the impact of GC3s composition on codon usage (34). For each GC3, the expected ENC values were considered using the following formula:
where “s” is the GC3s content of each codon.
Correspondence analysis (COA) is a multidimensional critical method to resolve the important developments in the codon usage patterns of CDS through codon RSCU values (5, 37, 38). To create the COA plot, RSCU values of 59 codons were considered. To study the tendencies in the deviation of the use of codon, relative inertia was used to hold a specific position in the graph.
The phylogenetic tree was constructed using the maximum likelihood method in Clustal ×2 (http://www.clustal.org/clustal2/). The tree was designed using the online tool the Interactive Tree of Life version 3 (http://itol.embl.de/) (39, 40). A total of 90 strains were used in this study.
GC12 and GC3 were studied for attaining a neutrality plot to identify the role of selection-mutation symmetry in the usage of codon discrepancy. In the graph, each point signifies a discrete gene. The line of regression slop between GC3 and GC12 indicates that mutation pressure is the major factor in affecting CUB, i.e., for values coming close to 1, although if the value comes close to 0, it indicates that selection pressure has been the main factor in defining CUB (41, 42).
To illustrate the relationship between nucleotide content and codon usage patterns, T. saginata correlation analysis was performed. These analyses were conducted using Spearman's rank correlation method (43). All processes were executed using the R corrplot package. For codon usage index analysis, CodonW (1.4.4) software was applied (44, 45).
Codon usage bias can be considerably predisposed by the general base composition of genomes. The nucleotide contents of 90 T. saginata strains were studied, which are presented in Table 1. In this study, our outcomes disclosed that the mean A (21.9%) and T (46.6%) were maximum, tailed by G (21.3%) and C (10.1%) across all genomes. The mean A3 (21.15%) and T3 (56.96%) occurred at a maximum level higher than the G3 (18.96%) and C3 (2.93%) (Figure 1, Table 1). The total AT and GC compositions were found to be 68.54% and 31.46%, respectively, suggesting that T. saginata strains have strong AT. This finding is similar to previous research on Plasmodium falciparum, Mycoplasma capricolum, and Onchocerca volvulus being enriched with A and T (46). However, the biological significance of this condition is still unclear, and therefore, it is essential to explore the causes for increased AT contents and decreased GC contents in the parasite genomes (47).
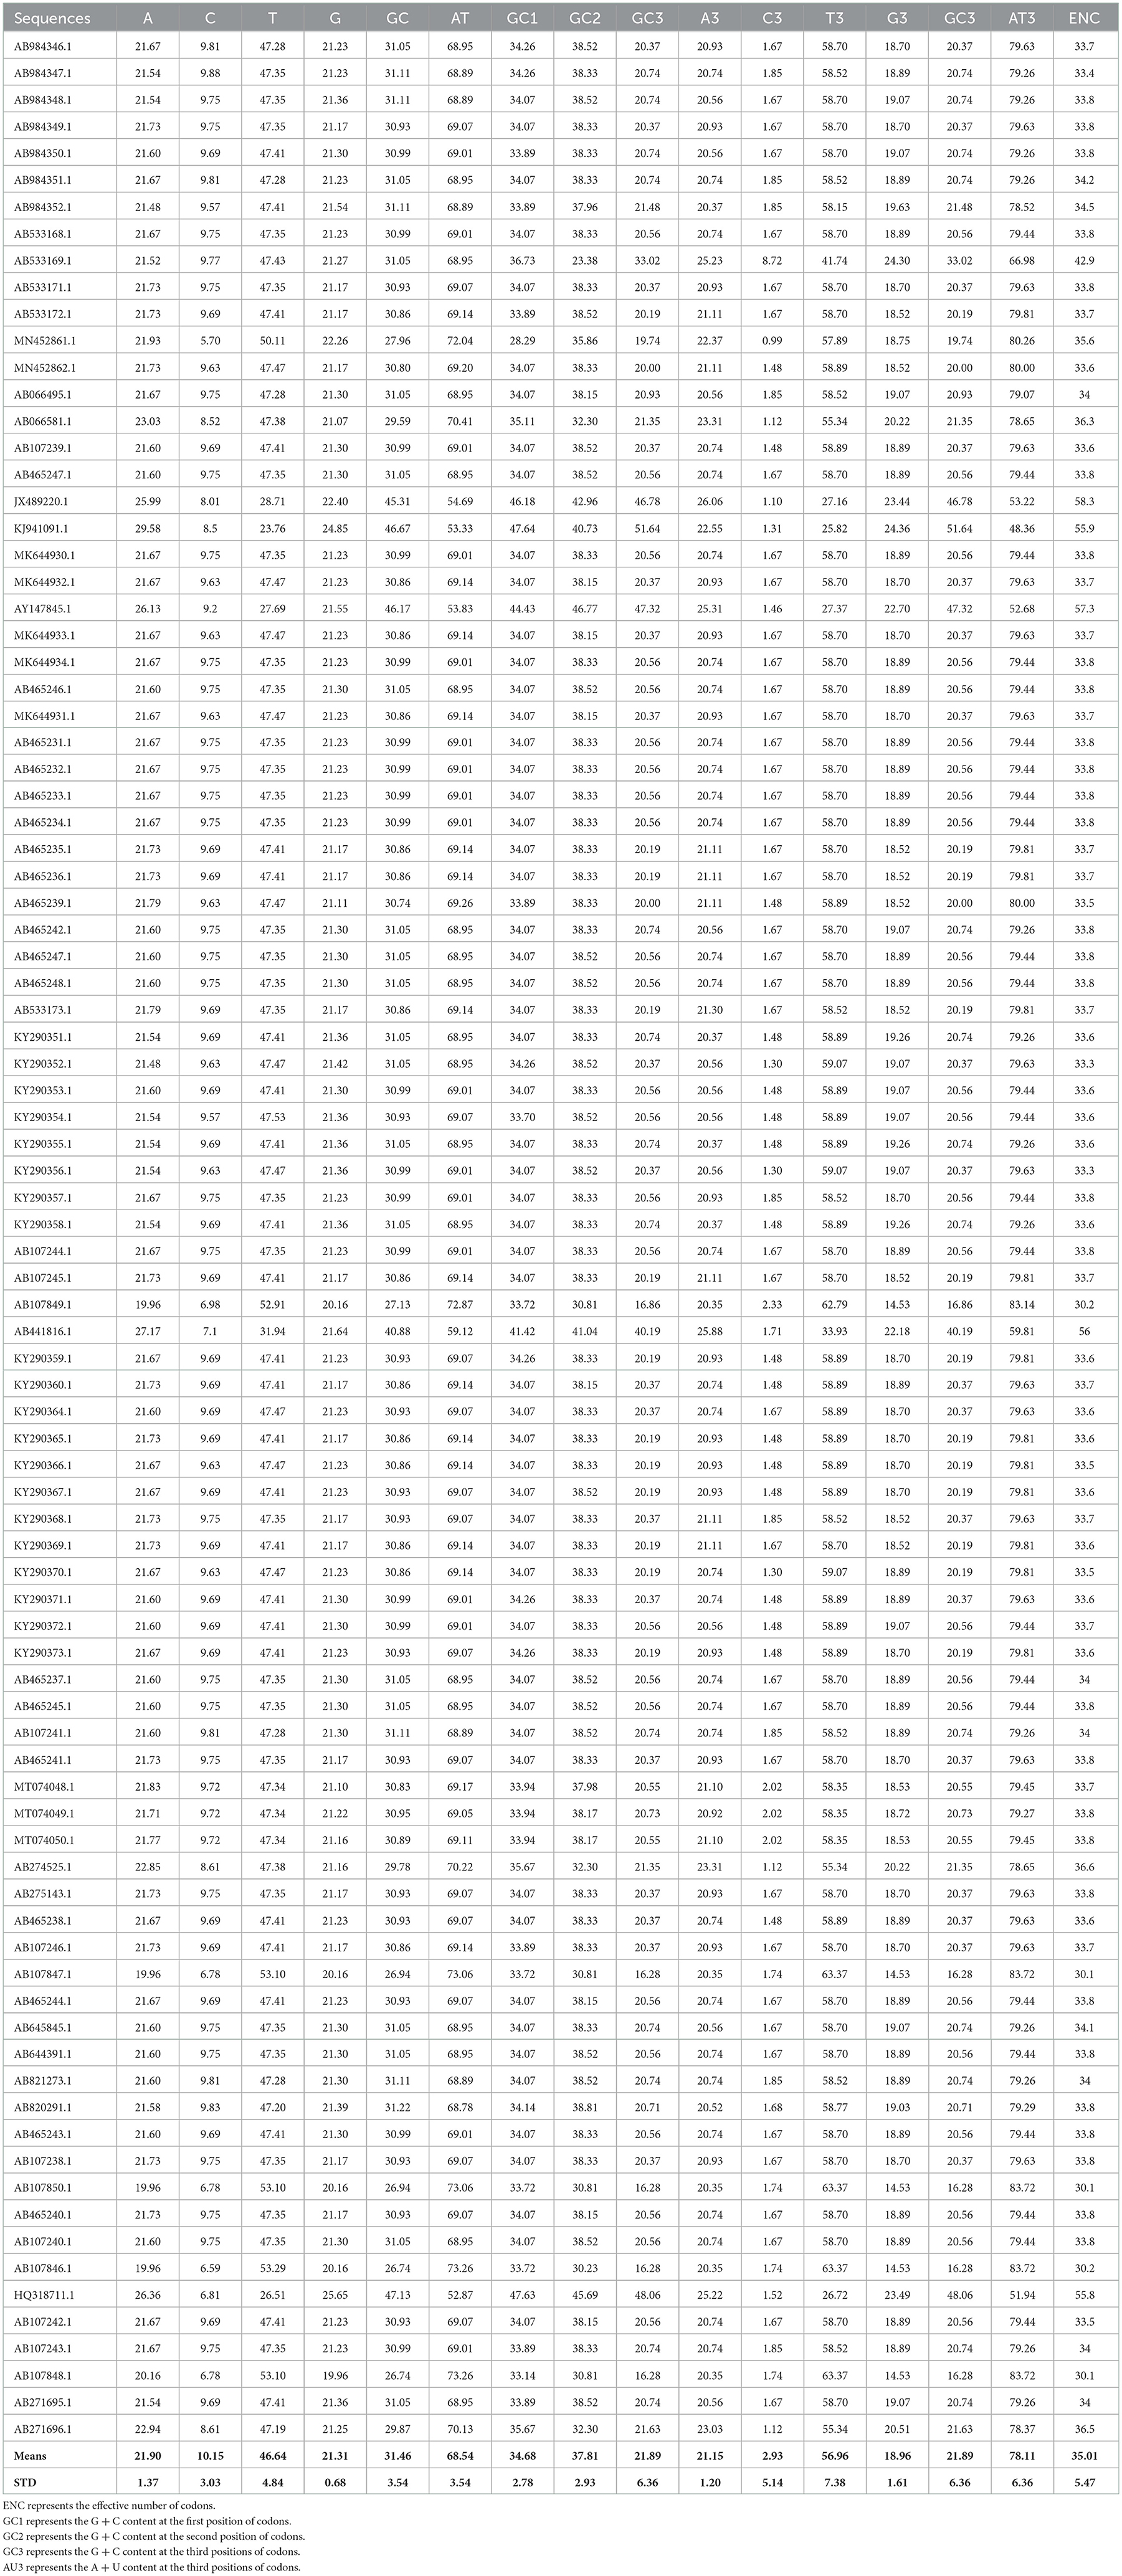
Table 1. Nucleotide compositional analysis of Taenia saginata coding sequences (%).
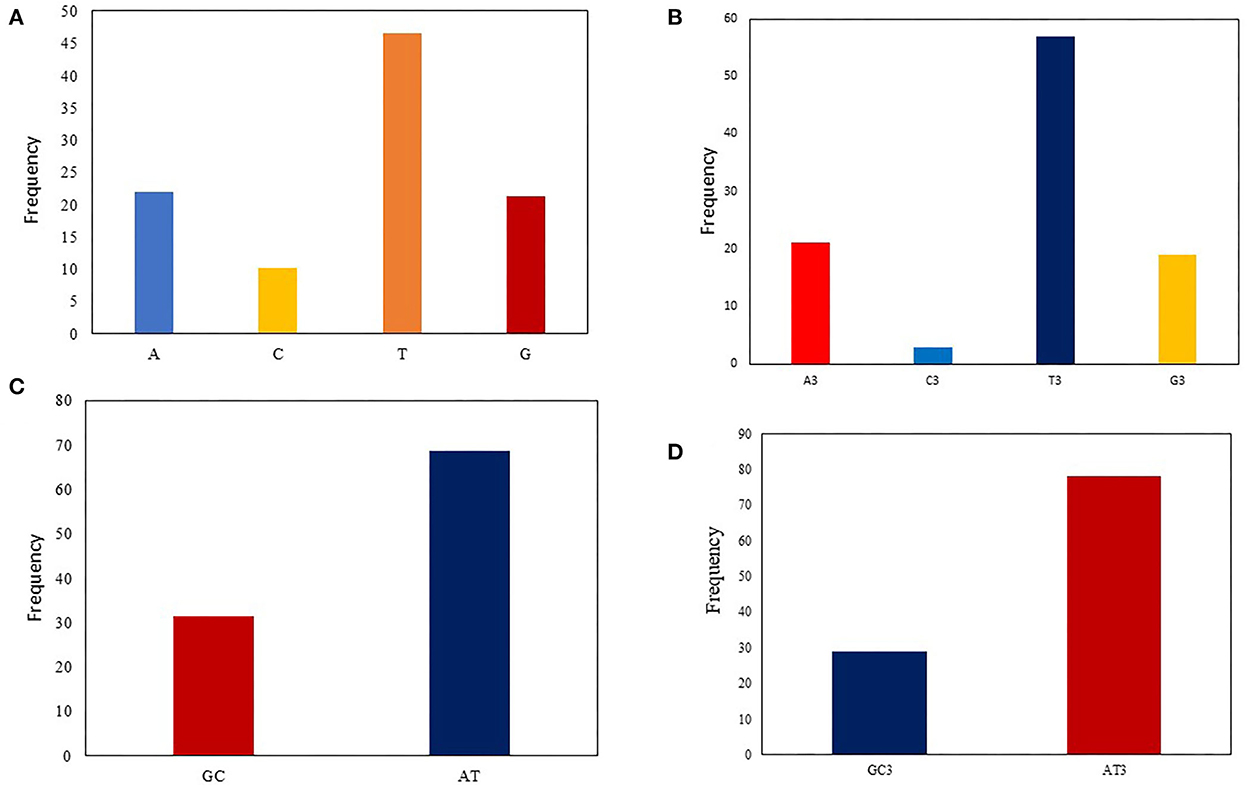
Figure 1. Nucleotide composition analysis: (A) The average A, T, G, and C nucleotide composition of the entire viral genome. (B) The average values of the nucleotide composition at the third codon position, indicating A/T richness followed by G/C richness. (C) The mean frequency for GC and AT composition (D) The mean frequency of GC and AT at the codon's third position, indicating that AT3 is more common than GC3.
Nucleotide content analysis at the first, second, and third synonymous codon positions disclosed that the values of GC1 ranged from 28.29 to 41.64% (mean: 34.68%; SD: 2.78), while GC2 ranged from 23.38 to 46.77% (mean: 37.81%; SD: 2.93). However, the GC3 values ranged from 16.28 to 51.64% (mean: 21.89%; SD: 6.36), which is similar to the previous studies on Taenia pisiformis (48). In contrast, the values of AU3 ranged from 48.36 to 83.72% (mean: 78.11%; SD: 6.36). These data further supported the notion that an extensive area of T. saginata is self-possessed of A/T content (Table 1). This study supports the previous studies on Taenia solium and G. lamblia (11, 49).
An RSCU analysis was used to regulate the identical pattern of codon usage in the T. saginata CDS. Notably, 17 of the 18 most abundantly used codons in T. saginata [TTT (Phe), TTA (Leu), ATT (Ile), GTT (Val), AGT (Ser), CCT (Pro), ACT (Thr), GCT (Ala), CAT (His), TAT (Tyr), CAA (Gln), AAT (Asn), AAA (Lys), GAT (Asp), TGT (Cys), CGT (Arg), and GGT (Gly)] ended with T or A (T: 14; A: 3), and the remaining one GAG (Glu) was G ended codons. None of the preferred codons were C-ended. Thus, the A or T-end codon bases are more shared in the genome of T. saginata, which is similar to earlier research (45). Furthermore, from the RSCU analysis, we found that the overrepresented (>1.6) codons are rarely seen in the genome of T. saginata. Nearly all the ideal and nonideal codons are in the range of 0.6–1.6. We observed that most codons ending in T were overrepresented (>0.6), while codons ending in C were underrepresented (<1.6) (Figure 2, Table 2), revealing that mutational pressure was the primary factor influencing codon usage patterns in T. saginata, which was consistent with previous studies (49, 50). From both the nucleotide content and RSCU analysis, we assumed that the selection of the preferred codons has been generally inclined by compositional restraints, which determine the existence of mutational pressure. We are unsure that the compositional pressure could not be the single aspect related to T. saginata patterns of codon usage, as although the total values of RSCU could disclose the pattern of codon usage for the genomes, it may conceal the codon usage variation amongst distinct genes in a genome (51).
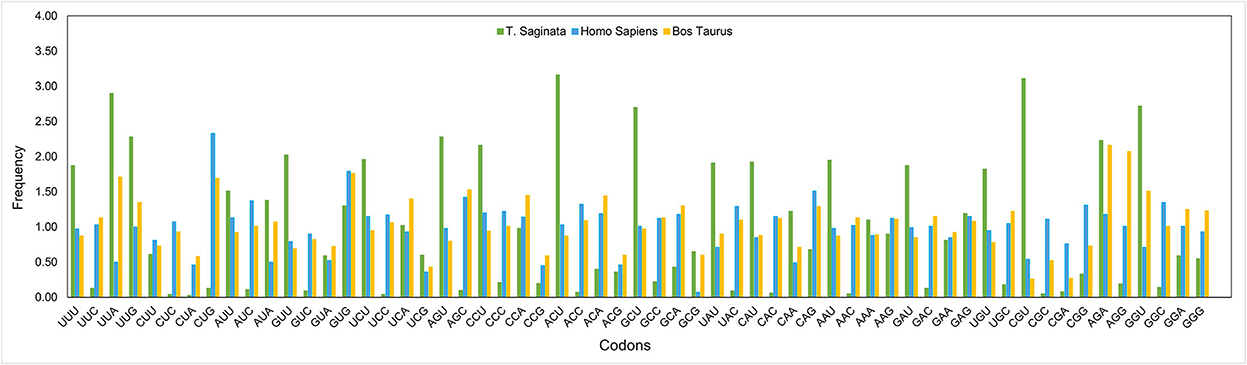
Figure 2. Comparative analysis of RSCU patterns between Taenia saginata and its hosts Bos taurus and Homo sapiens. The X-axis represents codons, while the Y-axis represents the frequency.
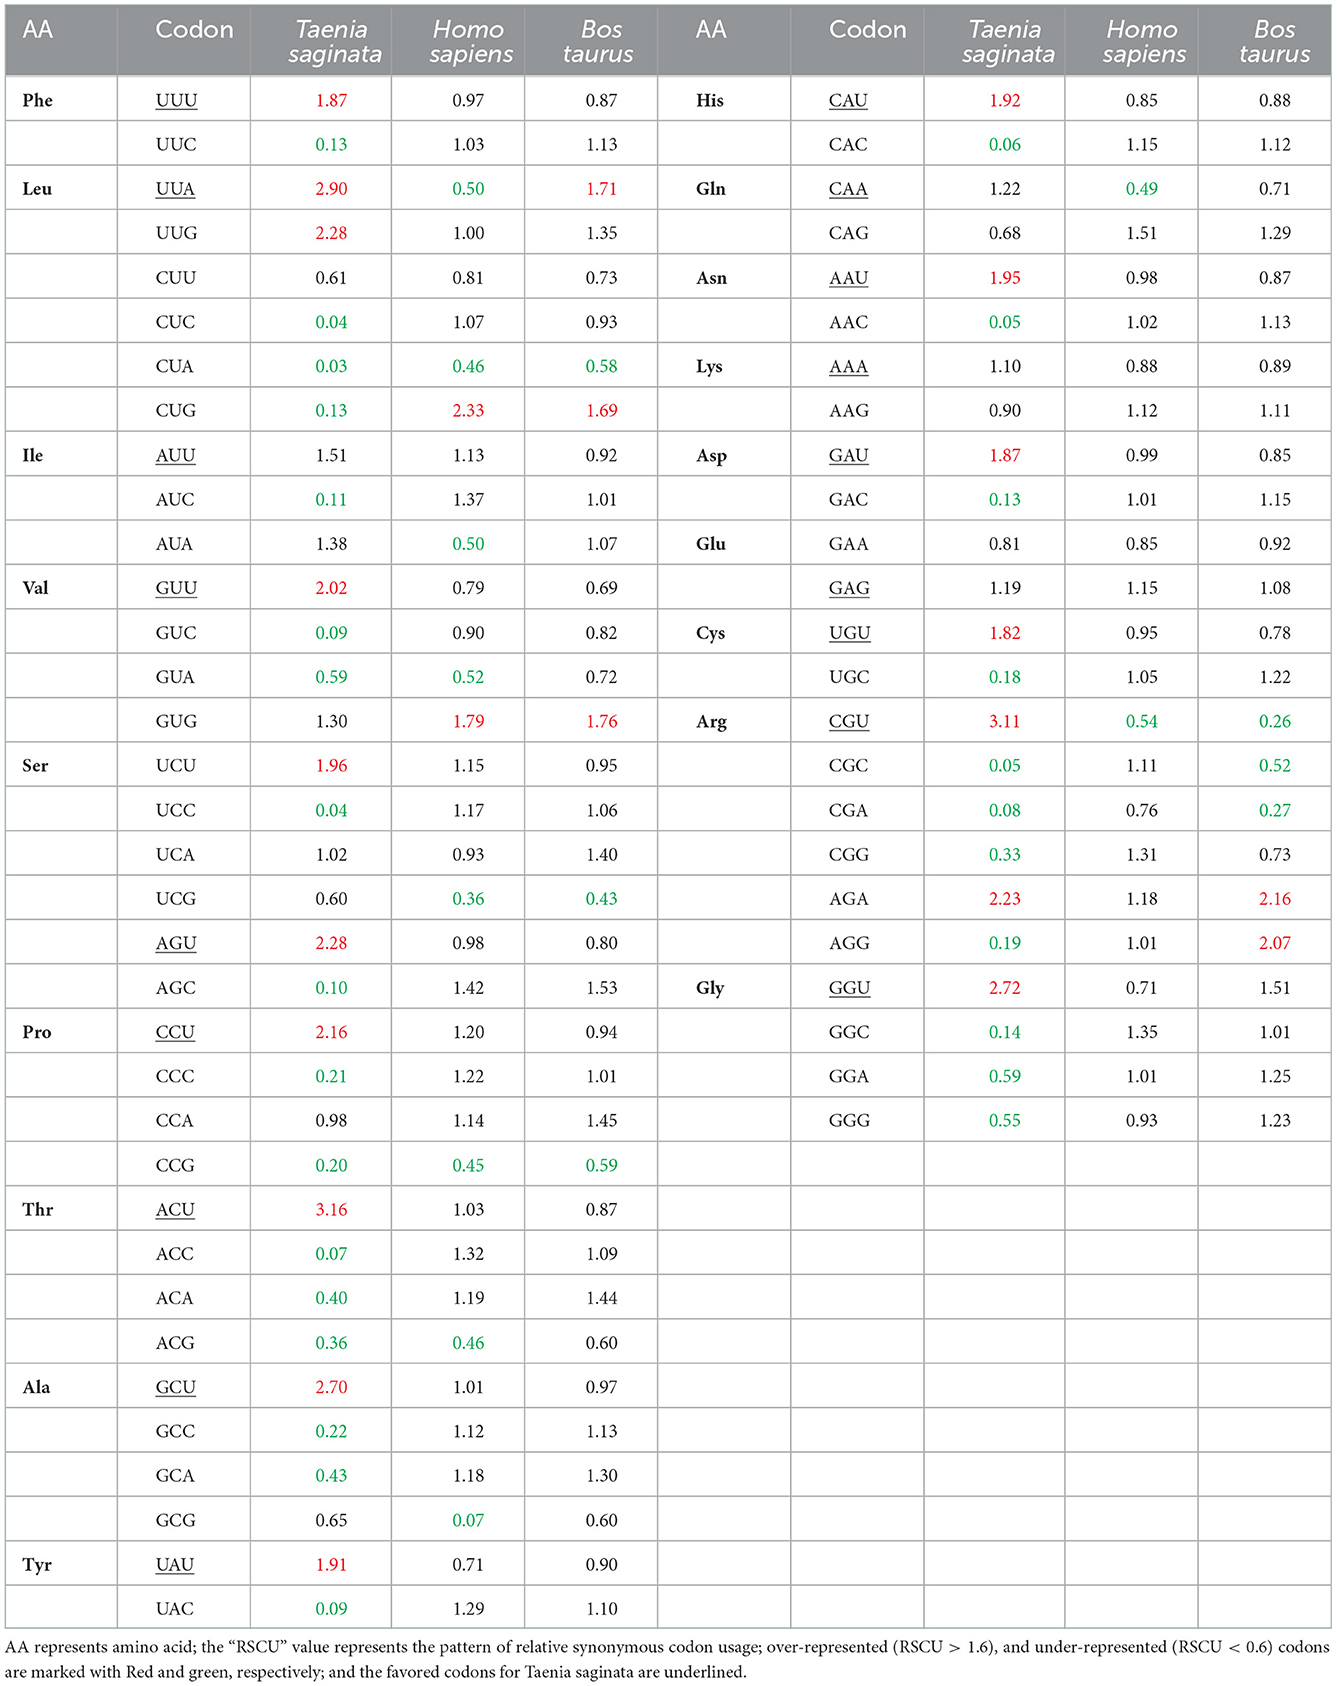
Table 2. The relative synonymous codon usage frequency of Taenia saginata, and its natural hosts (Homo sapiens and Bos taurus).
Additionally, to determine whether the CUB of T. saginata can be constrained by its hosts (B. taurus and H. sapiens), all codon RSCU values were also calculated (Table 2). This study indicated that 12 of 59 synonymous codons of T. saginata are equivalent to those of H. sapiens, individually, and that 16 of 59 synonymous codons are equivalent to those of B. taurus (Table 2). In this study, the role of selection from the B. Taurus in shaping codon usage patterns of T. saginata is different from that of the host H. sapiens. It was suggested that the codon usage patterns similarity between T. saginata and B. taurus/H. sapiens can enhance the efficiency of translation in the parasite's genomes (52).
The CAI analysis was executed to regulate the optimization of codon usage and T. saginata adaptation to its hosts (53). The values of CAI range from zero to one; a value near one indicates higher levels of CUB (7). For all codons, the CAI values were measured through the reference of B. taurus and H. sapiens codon usage. We determined that, concerning B. taurus and H. sapiens, the mean CAI value of T. saginata coding regions was 0.59 and 0.68 (>0.5), which revealed that T. saginata has a good adaptation to its hosts and a minimal translation pressure (Supplementary Figure S1) (35, 54). The high CAI value tendency of H. sapiens recommends that selection pressure from H. sapiens should impact the T. saginata codon usage and that the codon usage evolution in T. saginata should permit it to use the translation machinery of H. sapiens more capably. Our result was consistent with published work (55).
To check if the observed significant statistical differences arise in the values of CAI (2, 32), the values of expected CAI (e-CAI) were considered for T. saginata CDS with B. taurus and H. sapiens codon usage sets. The result of the e-CAI value was 0.70 and 0.79 (P < 0.05) in relation to B. taurus and H. sapiens, revealing that the generated sequences keep to a normal distribution. The outcomes of this study about the preferences of codon usage are comparable with previous research (5, 56).
The SiD analysis was carried out to assess the potential impact of B. taurus and H. sapiens codon usage patterns on the evolution of the codon usage patterns of the T. saginata. The SiD was found to be higher in B. taurus, indicating that it had a more dominant influence on the formation of T. saginata codon usage than in H. sapiens (Figure 3). Given that B. taurus is thought to be the principal reservoir and host of T. saginata's, it is likely that the parasite has stabilized its genetic traits in order to better adapt to the environment of its primary host (33, 57).
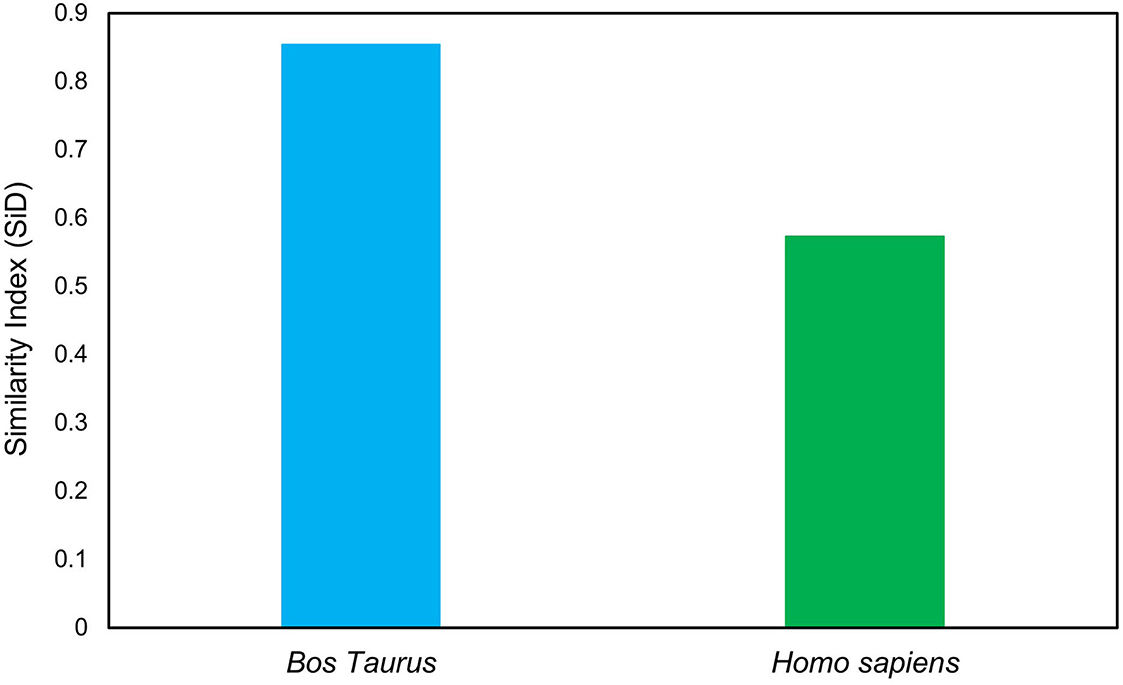
Figure 3. Similarity index analysis of codon usage between T. saginata's and its hosts.
To know the strength of CUB within T. saginata coding sequences, the gene ENC value was assessed and mapped next to the GC content at the 3rd codon position (GC3; Table 1). In this study, the values of ENC were observed to vary from 33.37 to 58.31, indicating a high level of genetic differences in the codon's usage. Nevertheless, the average value of ENC was 35.02 > 20, implying that the whole CUB was low (Table 2), which was also observed in T. pisiformis and Platyhelminthes (48, 50). The analysis disclosed that low codon bias was seen along with the position of natural selection on the genes (43, 58). Therefore, within T. saginata coding sequences, low codon bias has permitted T. saginata presence in the host, despite the fact that the host maintains codon usage preferences that vary from those of T. saginata.
Then, to determine the codon usage of the genes, a plot of distribution was employed that deviated from the same usage of indistinguishable codons. In this study, ENC values were used against the GC3s. If the GC subject of the gene exhibits mutational pressure, all the points in this plot will be below or close to the expected curve, indicating random codon usage. However, if there is selection pressure on the gene, all the points will lie on or below the expected curve. In this study, we plotted the ENC values of each gene against the GC3 content (Figure 4). The results reveal that mutational pressure and natural selection both influence the codon usage pattern of T. saginata genome, as the majority of the points fall below the expected curve and just a few points beyond it (59, 60).
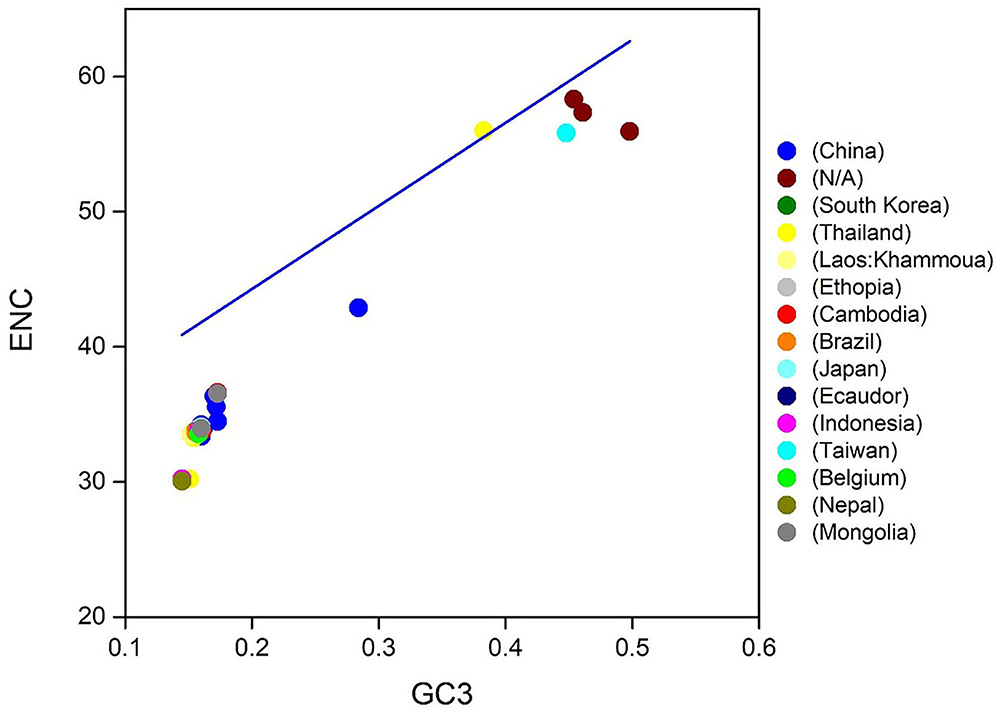
Figure 4. ENC-GC3 plots of 90 T. saginata strains: the effective number of codons (ENC-values, Y-axis) was plotted against the GC-content at the third synonymous codon positions (GC3-values, X-axis).
A plot of neutrality was performed, which implied the bond between GC1/2 and GC3 composition to determine the position of mutation and selection pressure that has an impact on the CUB form. To observe the association, we programmed a paradigm on the plot of neutrality between GC3 and GC1/2 for the T. saginata genome. In this study, the plot shows that no significant association was found between GC3 and GC1/2 contents because the regression value and link are P > 0.05 and r = −0.77 (Figure 5). Finally, we suggested that both natural selection and mutational pressure have an impact on the codon usage shaping of T. saginata. This phenomenon is similar to the previous studies (17, 48, 49).
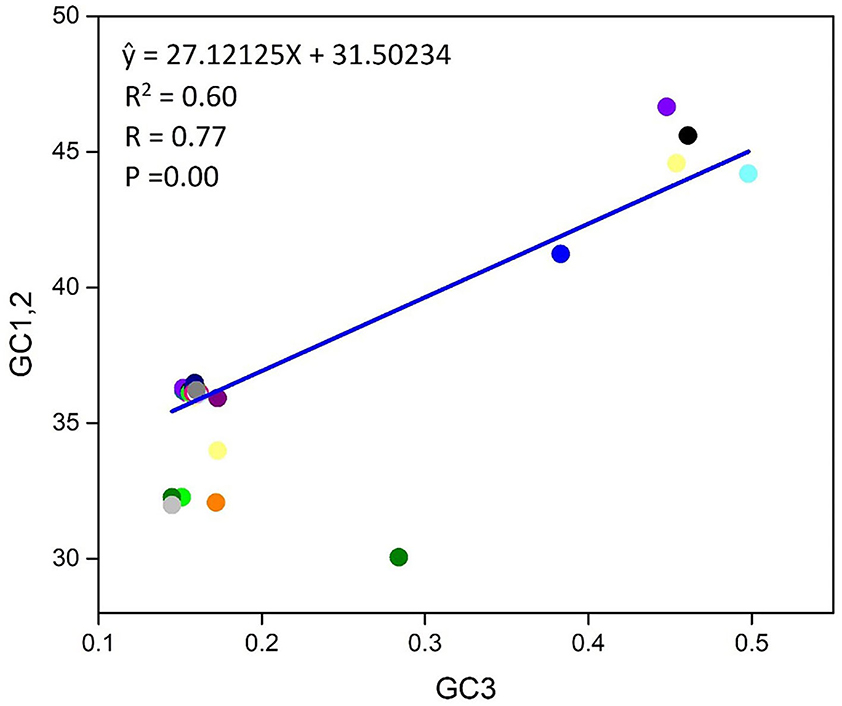
Figure 5. Neutrality plot between (GC3 vs. GC1, 2) for the entire coding sequence of T. saginata. GC1, 2 represent GC at the first and second of the codon, while GC3 represents GC at the third codon position. Additionally, the blue solid represents the regression analysis of GC1, 2 against GC3.
The COA describes the discrepancy in the usage of codons. The changes occur in the patterns of codon usage revealed through RSCU values. In the plot of COA, axis 1 and 2 are the two main factors of general discrepancy (37, 45, 61). We used the values of these two axes to draw COA plots, where each strain is represented by a point, and the distance between strains gives a degree of similarity or dissimilarity in the codon usage patterns. The first and second principal axes accounted for the total variation: 88.32 and 11.68% (Figure 6). These results propose that the first axis signifies the T. saginata strains, and the second axis signifies the countries where the T. saginata arises. Scattered data on the main axis represents various geographical ancestries and their relationships. All the T. saginata strains were found to be in groups using COA. Entire China and all the unknown T. saginata strains were assembled into one clade, while T. saginata separates from Ethiopia, South Korea, Thailand, Cambodia, Brazil, Ecuador, Taiwan, Belgium, and Nepal were present in the alternative clade. Furthermore, Laos, Indonesia, and Mongolia were divided into separate groups (Figure 6). These studies reveal that the topographical sites play a major part in the evolution of T. saginata and in a synonymous codon usage pattern, where in the future, such investigations may assist in discovering the essence of rising T. saginata strains. Furthermore, present outcomes also show that more than one widespread genetic lineage was found in every infected country.
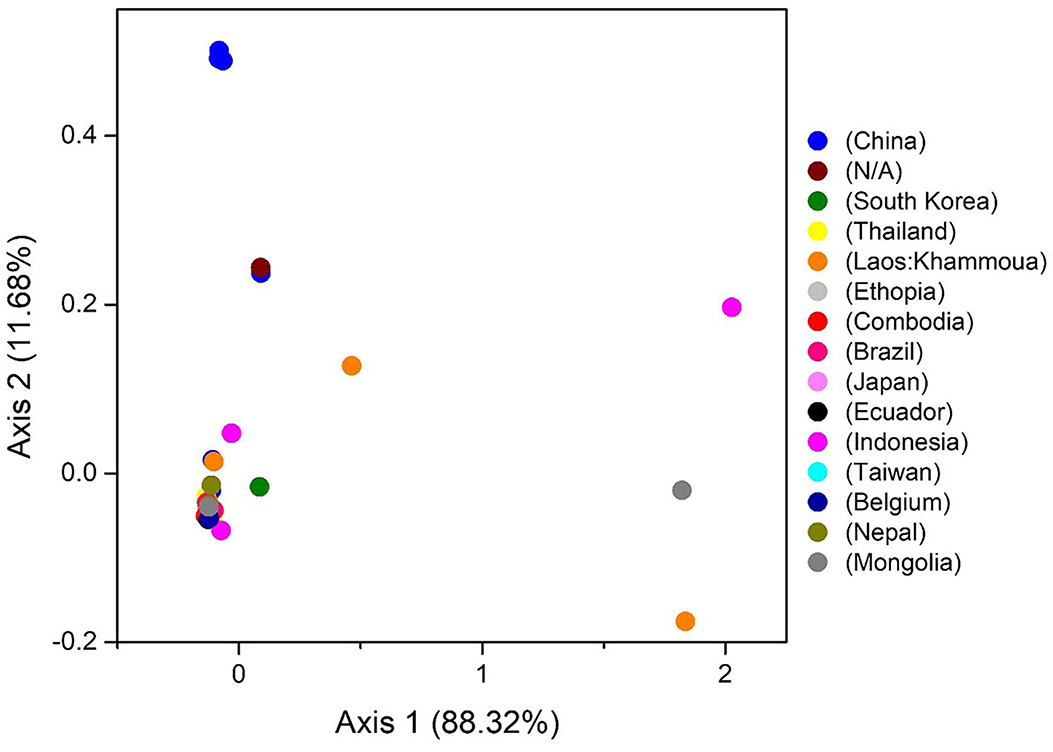
Figure 6. The correspondence analysis (COA) of the genes in T. saginata genomes. Each point represents a gene corresponding to the coordinates of the first and second axes of variation generated from the correspondence analysis.
To assess the consequence of evolutionary procedures on the T. saginata codon usage pattern, a phylogenetic analysis was used through the maximum likelihood method. The entire T. saginata separates are dispersed throughout the world, as evidenced by the tree, which shows that no strains form a cluster among different individual countries (Figure 7). The study suggested that this parasite might be altered due to some specific geographical effects such as climatic changes and environmental changes, which support the main outcome of evolutionary processes and topographical dispersal on codon usage patterns. The current study further exposed the signs of recombination and genome reassortment during single-host coinfection, signifying the potential for the upcoming arrival of novel alternates (62, 63).
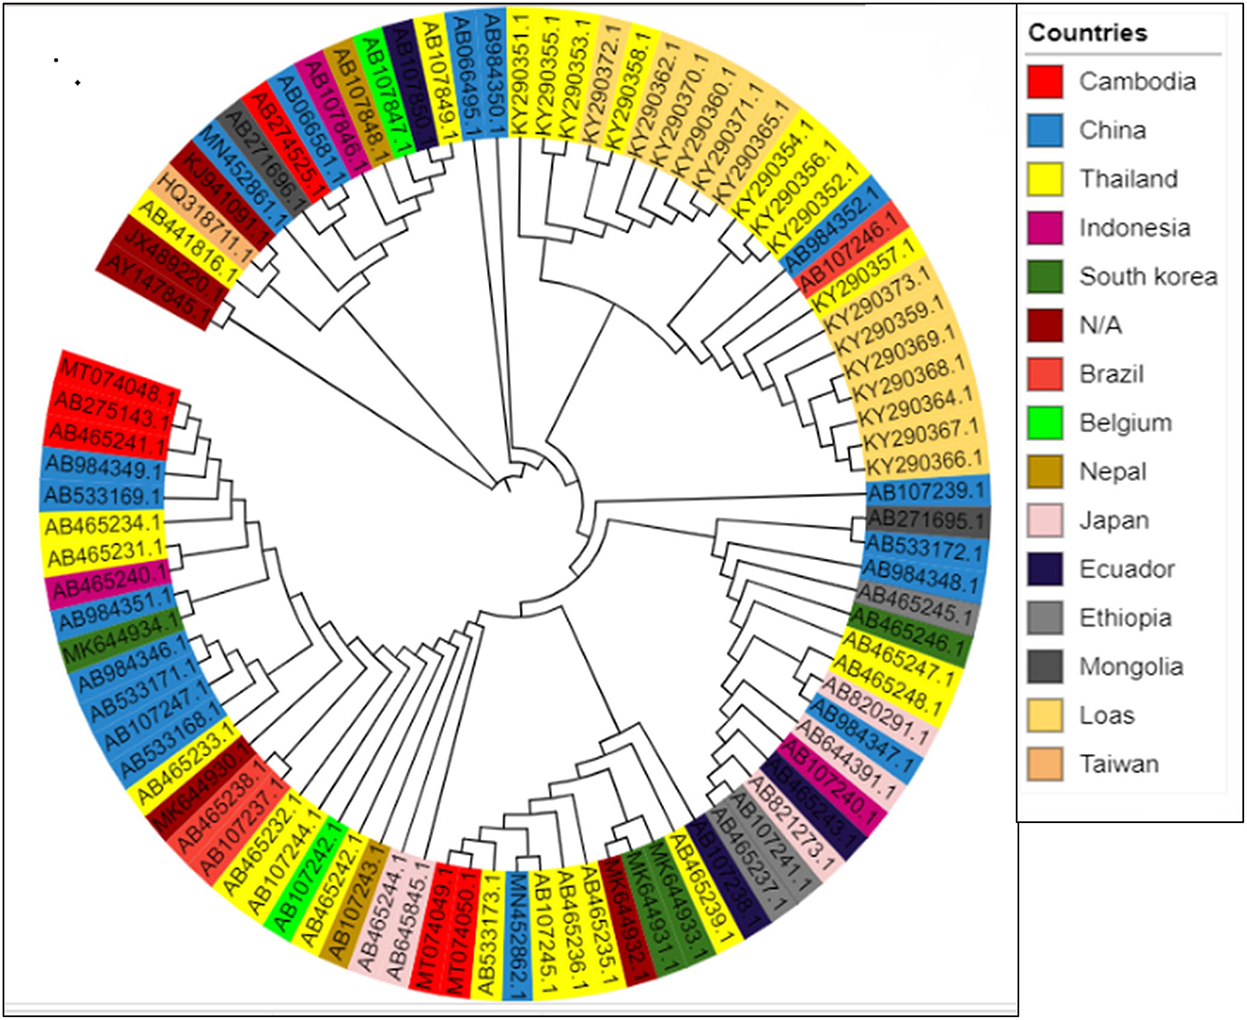
Figure 7. Phylogenetic tree based on the polyprotein-coding regions of 90 T. saginata strains. The tree was generated using the maximum likelihood (ML) method using Clustal X2. The tree was designed using the online tool “iTOL.”
In this study, we took two factors into consideration: natural selection and mutational pressure, in order to determine CUB in T. saginata. Accordingly, we performed a correlation analysis between total nucleotide contents (A, G, C, and T), GC contents (first, second, and third), and ENC. The ENC values of the T. saginata sequences seemed to be a positive relationship with GC1, GC2, GC3, A, G, and C except for T, which has a negative relationship that probably affects the T. saginata codon usage pattern (Figure 8). Previously, studies suggested that the base compositions at the third position of the codon, mutational bias, are mostly explained, while base compositions at the first and second positions, selective pressure, are mostly validated (64, 65).
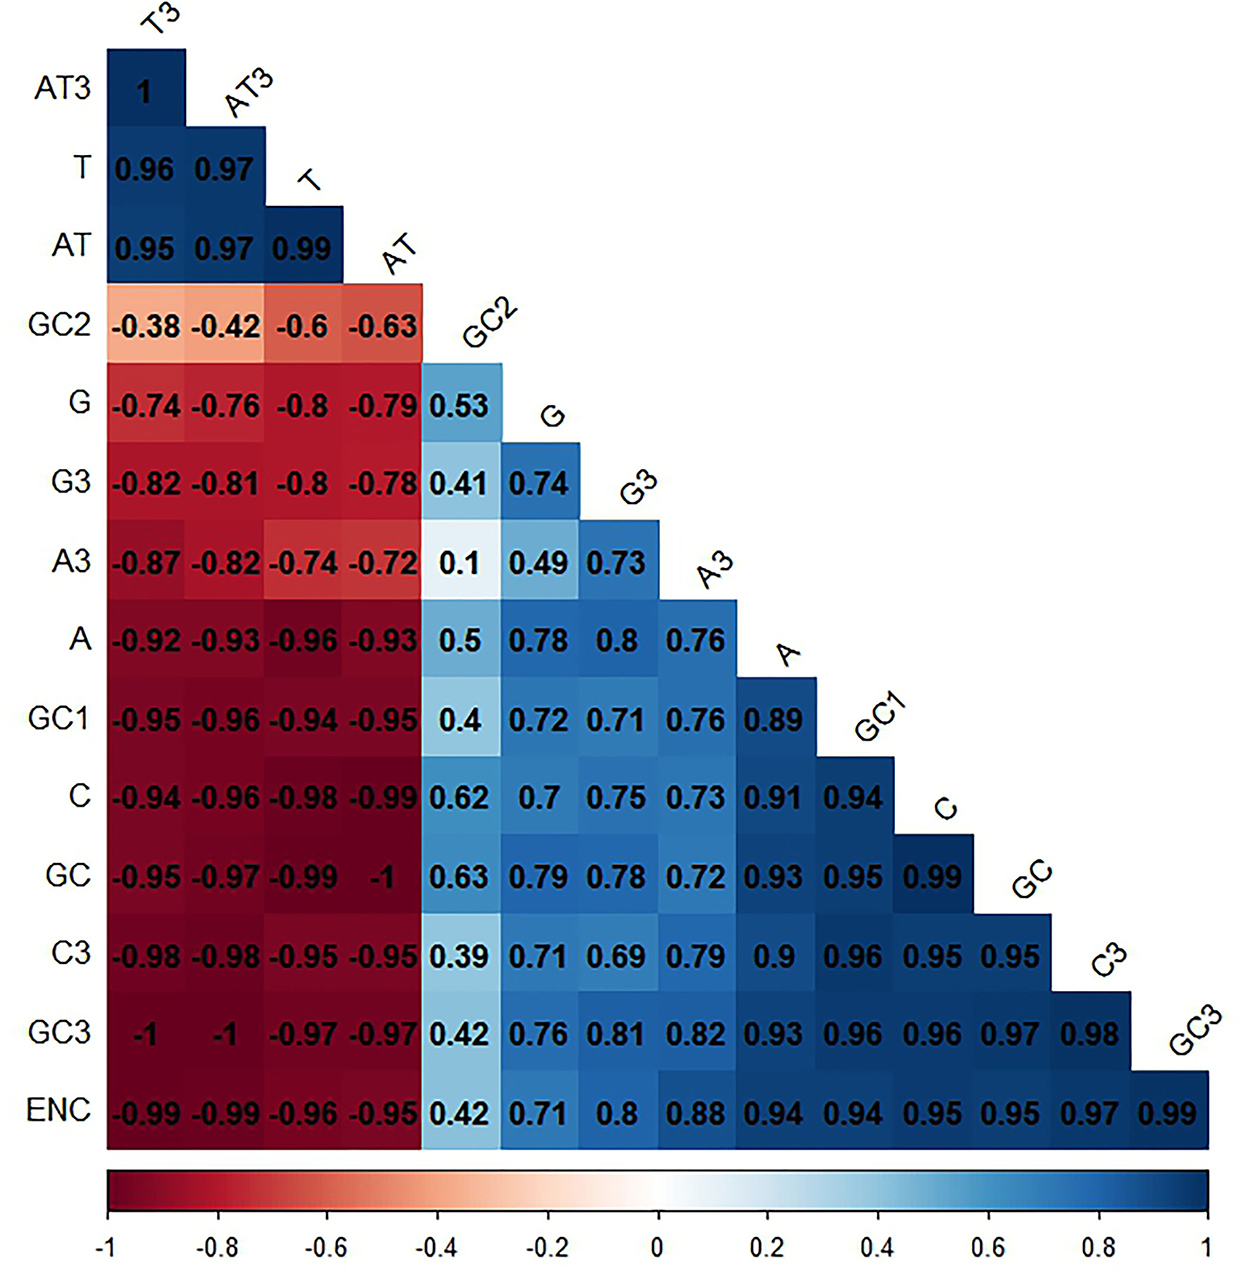
Figure 8. Correlation analysis among different nucleotide contents of T. saginata. Dark blue means the positive correlation, and dark red means the negative correlation; the value larger means a more significant correlation.
Such an impact was also observed among GC, AT, GC3, AT3, A3, C3, G3, and T3 with ENC. The GC, GC3, A3, and C3 have a positive correlation with ENC, whereas the AT, AT3, and T3 have a negative correlation. This result implies the significance of mutational and selection pressure on getting the T. saginata codon usage pattern (Figure 8). Additionally, it also suggests that the contents of a nucleotide have an impact on the codon usage pattern of T. saginata (66).
The original contributions presented in the study are included in the article/Supplementary material, further inquiries can be directed to the corresponding author.
SR, WM, and DC: conceptualization, methodology, software, data curation, and writing the original draft preparation. IR and HA helped in write-up and editing and validation. HR: methodology, visualization, and validation. MK and FR: reviewing and editing and validation. All authors contributed to the article and approved the submitted version.
This research was funded by the Qinghai Province Major R&D and Transformation Project (2021-QY-211), China.
The authors are thankful to those who directly or indirectly helped us during the study. The authors would like to extend their sincere appreciation to the Qinghai Province Major R&D and Transformation Project (2021-QY-211), China.
The authors declare that the research was conducted in the absence of any commercial or financial relationships that could be construed as a potential conflict of interest.
All claims expressed in this article are solely those of the authors and do not necessarily represent those of their affiliated organizations, or those of the publisher, the editors and the reviewers. Any product that may be evaluated in this article, or claim that may be made by its manufacturer, is not guaranteed or endorsed by the publisher.
The Supplementary Material for this article can be found online at: https://www.frontiersin.org/articles/10.3389/fvets.2022.1021440/full#supplementary-material
Supplementary Figure 1. Codon usage adaptation index of Taenia saginata's to its hosts (Bos taurus and Homo sapiens).
Supplementary Table 1. Detailed information of Taenia saginata isolates studied in this study.
1. Rahman SU, Mao Y, Tao S. Codon usage bias and evolutionary analyses of Zika virus genomes. Genes and Genomics. (2017) 39:855–66. doi: 10.1007/s13258-017-0549-0
2. Rahman SU, Yao X, Li X, Chen D, Tao S. Analysis of codon usage bias of Crimean-Congo hemorrhagic fever virus and its adaptation to hosts. Infect Genet Evol. (2018) 58:1–16. doi: 10.1016/j.meegid.2017.11.027
3. Hershberg R, Petrov DA. Selection on codon bias. Annu Rev Genet. (2008) 42:287–99. doi: 10.1146/annurev.genet.42.110807.091442
4. Kane JF. Effects of rare codon clusters on high-level expression of heterologous proteins in Escherichia coli. Curr Opin Biotechnol. (1995) 6:494–500. doi: 10.1016/0958-1669(95)80082-4
5. Yao X, Fan Q, Yao B, Lu P, Rahman SU, Chen D, et al. Codon usage bias analysis of bluetongue virus causing livestock infection. Front Microbiol. (2020) 11:1–12. doi: 10.3389/fmicb.2020.00655
6. Zheng Y, Zhao W-M, Wang H, Zhou Y-B, Luan Y, Qi M, et al. Codon usage bias in Chlamydia trachomatis and the effect of codon modification in the MOMP gene on immune responses to vaccination. Biochem Cell Biol. (2007) 85:218–26. doi: 10.1139/o06-211
7. Gupta SK, Bhattacharyya TK, Ghosh TC. Synonymous codon usage in Lactococcus lactis: mutational bias versus translational selection. J Biomol Struct Dyn. (2004) 21:527–36. doi: 10.1080/07391102.2004.10506946
8. Naya H, Romero H, Carels N, Zavala A, Musto H. Translational selection shapes codon usage in the GC-rich genome of Chlamydomonas reinhardtii. FEBS Lett. (2001) 501:127–30. doi: 10.1016/S0014-5793(01)02644-8
9. Lin K, Kuang Y, Joseph JS, Kolatkar PR. Conserved codon composition of ribosomal protein coding genes in Escherichia coli, Mycobacterium tuberculosis and Saccharomyces cerevisiae: lessons from supervised machine learning in functional genomics. Nucleic Acids Res. (2002) 30:2599–607. doi: 10.1093/nar/30.11.2599
10. Kliman RM, Irving N, Santiago M. Selection conflicts, gene expression, and codon usage trends in yeast. J Mol Evol. (2003) 57:98–109. doi: 10.1007/s00239-003-2459-9
11. Lafay B, Sharp PM. Synonymous codon usage variation among Giardia lamblia genes and isolates. Mol Biol Evol. (1999) 16:1484–95. doi: 10.1093/oxfordjournals.molbev.a026060
12. Ghosh TC, Gupta SK, Majumdar S. Studies on codon usage in Entamoeba histolytica. Int J Parasitol. (2000) 30:715–22. doi: 10.1016/S0020-7519(00)00042-4
13. Stenico M, Lloyd AT, Sharp PM. Codon usage in Caenorhabditis elegans: delineation of translational selection and mutational biases. Nucleic Acids Res. (1994) 22:2437–46. doi: 10.1093/nar/22.13.2437
14. Dermauw V, Dorny P, Braae UC, Devleesschauwer B, Robertson LJ, Saratsis A, et al. Epidemiology of Taenia saginata taeniosis/cysticercosis: a systematic review of the distribution in southern and eastern Africa. Parasit Vectors. (2018) 11:578. doi: 10.1186/s13071-018-3163-3
15. Torgerson PR, Abdybekova AM, Minbaeva G, Shapiyeva Z, Thomas LF, Dermauw V, et al. Epidemiology of Taenia saginata taeniosis/cysticercosis: a systematic review of the distribution in central and western Asia and the Caucasus. Parasit Vectors. (2019) 12:175. doi: 10.1186/s13071-019-3438-3
16. Sapp SGH, Bradbury RS. The forgotten exotic tapeworms: a review of uncommon zoonotic Cyclophyllidea. Parasitology. (2020) 147:533–58. doi: 10.1017/S003118202000013X
17. Yang X, Luo X, Cai X. Analysis of codon usage pattern in Taenia saginata based on a transcriptome dataset. Parasites Vectors. (2014) 7:1–11. doi: 10.1186/s13071-014-0527-1
18. Laranjo-González M, Devleesschauwer B, Gabriël S, Dorny P, Allepuz A. Epidemiology, impact and control of bovine cysticercosis in Europe: a systematic review. Parasit Vectors. (2016) 9:81. doi: 10.1186/s13071-016-1362-3
19. Trevisan C, Sotiraki S, Laranjo-González M, Dermauw V, Wang Z, Kärssin A, et al. Epidemiology of taeniosis/cysticercosis in Europe, a systematic review: eastern Europe. Parasit Vectors. (2018) 11:569. doi: 10.1186/s13071-018-3153-5
20. Konyaev S V, Nakao M, Ito A, Lavikainen A. History of Taenia saginata tapeworms in Northern Russia. Emerg Infect Dis. (2017) 23:2030–7. doi: 10.3201/eid2312.162101
21. World Health Organization. WHO/FAO/OIE guidelines for the surveillance, prevention and control of taeniosis/cysticercosis/ editor: Murrell KD; associate editors: Dorny P... [et al.]. (2005). Available online at: https://apps.who.int/iris/handle/10665/43291 (accessed August 01, 2022).
22. Craig P, Ito A. Intestinal cestodes. Curr Opin Infect Dis. (2007) 20:524–32. doi: 10.1097/QCO.0b013e3282ef579e
23. Egger B. Making heads or tails of tapeworms. Trends Parasitol. (2016) 32:511–2. doi: 10.1016/j.pt.2016.04.003
24. Ríos-Valencia DG. To be or not to be a tapeworm parasite: that is the post-genomic question in Taenia solium cysticercosis. In:Navarrete-Perea J, editor. Current State of the Art in Cysticercosis and Neurocysticercosis. Rijeka: IntechOpen. (2021), p. 107. doi: 10.5772/intechopen.97306
25. Bordon LM. Intestinal obstruction due to Taenia saginata infection: a case report. J Trop Med Hyg. (1992) 95:352–3.
26. Silva C V, Costa-Cruz JM. A glance at Taenia saginata infection, diagnosis, vaccine, biological control and treatment. Infect Disord Drug Targets. (2010) 10:313–21. doi: 10.2174/187152610793180894
27. Karumathil S, Raveendran NT, Ganesh D, Kumar Ns S, Nair RR, Dirisala VR. Evolution of synonymous codon usage bias in West African and Central African strains of Monkeypox virus. Evol Bioinform Online. (2018) 14:1176934318761368. doi: 10.1177/1176934318761368
28. Sharp PM, Li WH. Codon usage in regulatory genes in Escherichia coli does not reflect selection for “rare” codons. Nucleic Acids Res. (1986) 14:7737–49. doi: 10.1093/nar/14.19.7737
29. Wong EHM, Smith DK, Rabadan R, Peiris M, Poon LLM. Codon usage bias and the evolution of influenza A viruses. Codon usage biases of influenza virus. BMC Evol Biol. (2010) 10:253. doi: 10.1186/1471-2148-10-253
30. Liu J, Zhu D, Ma G, Liu M, Wang M, Jia R, et al. Genome-wide analysis of the synonymous codon usage patterns in Riemerella anatipestifer. Int J Mol Sci. (2016) 17:1304. doi: 10.3390/ijms17081304
31. Chakraborty A, Uechi T, Higa S, Torihara H, Kenmochi N. Loss of ribosomal protein L11 affects zebrafish embryonic development through a p53-dependent apoptotic response. PLoS ONE. (2009) 4:e4152. doi: 10.1371/journal.pone.0004152
32. Puigbò P, Bravo IG, Garcia-Vallve S. CAIcal: a combined set of tools to assess codon usage adaptation. Biol Direct. (2008) 3:38. doi: 10.1186/1745-6150-3-38
33. Butt AM, Nasrullah I, Qamar R, Tong Y. Evolution of codon usage in Zika virus genomes is host and vector specific. Nat Publ Gr. (2016) 5:e107. doi: 10.1038/emi.2016.106
34. Wright F. The “effective number of codons” used in a gene. Gene. (1990) 87:23–9. doi: 10.1016/0378-1119(90)90491-9
35. Rahman SU, Abdullah M, Khan AW, Haq MIU, Haq NU, Aziz A, Tao S. A detailed comparative analysis of codon usage bias in Alongshan virus. Virus Res. (2022) 308:198646. doi: 10.1016/j.virusres.2021.198646
36. Comeron JM, Aguade M. An evaluation of measures of synonymous codon usage bias. J Mol Evol. (1998) 47:268–74. doi: 10.1007/PL00006384
37. Greenacre M. Theory and Applications of Correspondence Analysis. Cambridge, MA: Academic Press (1984).
38. Cristina J, Fajardo A, Sonora M, Moratorio G, Musto H. A detailed comparative analysis of codon usage bias in Zika virus. Virus Res. (2016) 223:147–52. doi: 10.1016/j.virusres.2016.06.022
39. Letunic I, Bork P. Interactive tree of life v2: online annotation and display of phylogenetic trees made easy. Nucleic Acids Res. (2011) 39:475–8. doi: 10.1093/nar/gkr201
40. Serres-Giardi L, Belkhir K, David J, Glemin S. Patterns and evolution of nucleotide landscapes in seed plants. Plant Cell. (2012) 24:1379–97. doi: 10.1105/tpc.111.093674
41. Guan DL, Ma L, Khan MS, Zhang XX, Xu SQ, Xie JY. Analysis of codon usage patterns in Hirudinaria manillensis reveals a preference for GC-ending codons caused by dominant selection constraints. BMC Genomics. (2018) 19:1–14. doi: 10.1186/s12864-018-4937-x
42. Sueoka N. Directional mutation pressure and neutral molecular evolution. Proc Natl Acad Sci U S A. (1988) 85:2653–7. doi: 10.1073/pnas.85.8.2653
43. Wu Y, Zhao D, Tao J. Analysis of codon usage patterns in herbaceous peony (Paeonia lactiflora Pall) based on transcriptome data. Genes. (2015) 6:1125–39. doi: 10.3390/genes6041125
44. Singh NK, Tyagi A. A detailed analysis of codon usage patterns and influencing factors in Zika virus. Arch Virol. (2017) 162:1963–73. doi: 10.1007/s00705-017-3324-2
45. Butt AM, Nasrullah I, Tong Y. Genome-wide analysis of codon usage and influencing factors in chikungunya viruses. PLoS ONE. (2014) 9:e0090905. doi: 10.1371/journal.pone.0090905
46. Waterkeyn JG, Gauci C, Cowman AF, Lightowlers MW. Codon usage in Taenia species. Exp Parasitol. (1998) 88:76–8. doi: 10.1006/expr.1998.4215
47. van Hemert F, Berkhout B. Nucleotide composition of the Zika virus RNA genome and its codon usage. Virol J. (2016) 13:95. doi: 10.1186/s12985-016-0551-1
48. Chen L, Liu T, Yang D, Nong X, Xie Y, Fu Y, et al. Analysis of codon usage patterns in Taenia pisiformis through annotated transcriptome data. Biochem Biophys Res Commun. (2013) 430:1344–8. doi: 10.1016/j.bbrc.2012.12.078
49. Yang X, Ma X, Luo X, Ling H, Zhang X, Cai X. Codon usage bias and determining forces in Taenia solium genome. Korean J Parasitol. (2015) 53:689–97. doi: 10.3347/kjp.2015.53.6.689
50. Le TH, McManus DP, Blair D. Codon usage and bias in mitochondrial genomes of parasitic platyhelminthes. Korean J Parasitol. (2004) 42:159–67. doi: 10.3347/kjp.2004.42.4.159
51. Hassan S, Mahalingam V, Kumar V. Synonymous codon usage analysis of thirty two mycobacteriophage genomes. Adv Bioinformatics. (2009) 2009:316936. doi: 10.1155/2009/316936
52. Ma X-X, Feng Y-P, Bai J-L, Zhang D-R, Lin X-S, Ma Z-R. Nucleotide composition bias and codon usage trends of gene populations in Mycoplasma capricolum subsp. capricolum and M agalactiae. J Genet. (2015) 94:251–60. doi: 10.1007/s12041-015-0512-2
53. Sharp PM, Li WH. An evolutionary perspective on synonymous codon usage in unicellular organisms. J Mol Evol. (1986) 24:28–38. doi: 10.1007/BF02099948
54. Subramanian A, Rup Sarkar R. Data in support of large scale comparative codon usage analysis in Leishmania and Trypanosomatids. Data Br. (2015) 4:269–72. doi: 10.1016/j.dib.2015.06.003
55. Pan X, Welti R, Wang X. Quantitative analysis of major plant hormones in crude plant extracts by high-performance liquid chromatography–mass spectrometry. Nat Protoc. (2010) 5:986–92. doi: 10.1038/nprot.2010.37
56. Maldonado LL, Stegmayer G, Milone DH, Oliveira G, Rosenzvit M, Kamenetzky L. Whole genome analysis of codon usage in Echinococcus. Mol Biochem Parasitol. (2018) 225:54–66. doi: 10.1016/j.molbiopara.2018.08.001
57. Chantawannakul P, Cutler RW. Convergent host–parasite codon usage between honeybee and bee associated viral genomes. J Invertebr Pathol. (2008) 98:206–10. doi: 10.1016/j.jip.2008.02.016
58. Ma YP, Liu ZX, Hao L, Ma JY, Liang ZL Li YG, Ke H. Analysing codon usage bias of cyprinid herpesvirus 3 and adaptation of this virus to the hosts. J Fish Dis. (2015) 38:665–73. doi: 10.1111/jfd.12316
59. Li X, Wang X, Gong P, Zhang N, Zhang X, Li J. Analysis of codon usage patterns in giardia duodenalis based on transcriptome data from GiardiaDB. Genes. (2021) 12:1169. doi: 10.3390/genes12081169
60. Zhou J-H, Gao Z-L, Zhang J, Ding Y-Z, Stipkovits L, Szathmary S, et al. The analysis of codon bias of foot-and-mouth disease virus and the adaptation of this virus to the hosts. Infect Genet Evol J Mol Epidemiol Evol Genet Infect Dis. (2013) 14:105–10. doi: 10.1016/j.meegid.2012.09.020
61. Kumar N, Bera BC, Greenbaum BD, Bhatia S, Sood R, Selvaraj P, et al. Revelation of influencing factors in overall codon usage bias of equine influenza viruses. PLoS ONE. (2016) 11:e0154376. doi: 10.1371/journal.pone.0154376
62. Chamberlain J, Cook N, Lloyd G, Mioulet V, Tolley H, Hewson R. Co-evolutionary patterns of variation in small and large RNA segments of Crimean-Congo hemorrhagic fever virus. J Gen Virol. (2005) 86:3337–41. doi: 10.1099/vir.0.81213-0
63. Hewson R, Gmyl A, Gmyl L, Smirnova SE, Karganova G, Jamil B, et al. Evidence of segment reassortment in Crimean-Congo haemorrhagic fever virus. J Gen Virol. (2004) 85:3059–70. doi: 10.1099/vir.0.80121-0
64. RoyChoudhury S, Mukherjee D. A detailed comparative analysis on the overall codon usage pattern in herpesviruses. Virus Res. (2010) 148:31–43. doi: 10.1016/j.virusres.2009.11.018
65. Hu C, Chen J, Ye L, Chen R, Zhang L, Xue X. Codon usage bias in human cytomegalovirus and its biological implication. Gene. (2014) 545:5–14. doi: 10.1016/j.gene.2014.05.018
Keywords: Taenia saginata, codon usage bias (CUB), effective number of codons (ENC), mutation pressure, natural selection
Citation: Rahman SU, Rehman HU, Rahman IU, Khan MA, Rahim F, Ali H, Chen D and Ma W (2023) Evolution of codon usage in Taenia saginata genomes and its impact on the host. Front. Vet. Sci. 9:1021440. doi: 10.3389/fvets.2022.1021440
Received: 17 August 2022; Accepted: 03 October 2022;
Published: 11 January 2023.
Edited by:
Rainer Willi Bussmann, Ilia State University, GeorgiaReviewed by:
Siju Susan Jacob, Indian Council of Agricultural Research (ICAR), IndiaCopyright © 2023 Rahman, Rehman, Rahman, Khan, Rahim, Ali, Chen and Ma. This is an open-access article distributed under the terms of the Creative Commons Attribution License (CC BY). The use, distribution or reproduction in other forums is permitted, provided the original author(s) and the copyright owner(s) are credited and that the original publication in this journal is cited, in accordance with accepted academic practice. No use, distribution or reproduction is permitted which does not comply with these terms.
*Correspondence: Wentao Ma,  bWF3ZW50YW9AbndhZnUuZWR1LmNu
Disclaimer: All claims expressed in this article are solely those of the authors and do not necessarily represent those of their affiliated organizations, or those of the publisher, the editors and the reviewers. Any product that may be evaluated in this article or claim that may be made by its manufacturer is not guaranteed or endorsed by the publisher.
Research integrity at Frontiers
Learn more about the work of our research integrity team to safeguard the quality of each article we publish.