 Longfei Zhang
 Hongbing Xie2
- 1Postdoctoral Research Base, Henan Institute of Science and Technology, Xinxiang, China
- 2College of Animal Science and Veterinary Medicine, Henan Institute of Science and Technology, Xinxiang, China
- 3Postdoctoral Research Station, Henan Agriculture University, Zhengzhou, China
- 4Guangdong Key Laboratory for Veterinary Drug Development and Safety Evaluation, South China Agricultural University, Guangzhou, China
We wished to study the detailed and precise antibacterial activity of cefquinome against Actinobacillus pleuropneumoniae (APP) in vitro and ex vivo. We analyzed the relationships between kill rate and cefquinome concentration in broth and between pharmacokinetic/pharmacodynamic (PK/PD) parameters and antibacterial effect in serum and tissue cage fluid (TCF) of piglets. Cefquinome exhibited time-dependent antibacterial activity against APP according to the kill rate. The maximum kill rate was 0.48 log10 CFU/mL/h at the 0-9-h period in broth. In the ex vivo PK/PD study, the maximum concentration (Cmax), time to reach the maximum concentration (Tmax), terminal half-life (T1/2β), and area under the concentration time curve (AUCinfinity) were 5.65 μg/ml, 0.58 h, 2.24 h, and 18.48 μg·h/ml in serum and 1.13 μg/ml, 2.60 h, 12.22 h, and 20.83 μg·h/ml in TCF, respectively. The values of area under the curve during 24 h/minimum inhibitory concentration (AUC24h/MIC) for bacteriostatic, bactericidal, and bacterial eradication effects were 18.94, 246.8, and 1013.23 h in serum and 4.20, 65.81, and 391.35 h in TCF, respectively. Our findings will provide a valuable basis for optimization of dosage regimens when applying cefquinome to treat APP infection.
Introduction
Porcine contagious pleuropneumonia (PCP), caused by Actinobacillus pleuropneumoniae (APP), is a serious respiratory system diseases in pigs (1, 2). The classical symptoms of acute PCP are hemorrhagic necrotizing pneumonia and fibrinous pneumonia with high morbidity and mortality (3, 4). Long-term infected pigs would show weight decline, low feed conversion rate, and delayed sale time. Therefore, PCP has caused considerable economic losses to farmers and severely restricted the development of the pig industry. However, because the serotype of A. pleuropneumoniae was more than those of 19 species and there was no effectively and commonly used vaccine to protect pigs at present (5–7). Hence, antimicrobial therapy is still a rapid and efficacious method for PCP treatment, such as cephalosporins, fluoroquinolones, and macrolides (8–14). However, with the abundant unreasonable application of drugs, multidrug-resistant pathogens were gradually selected and spread all over the world. Cephalosporins had been broadly applied in veterinary and human clinical therapy, and the resistant gene can spread from animal bacteria to human bacteria. Therefore, the resistance of veterinary bacteria to cephalosporins may not only reduce the antibacterial effect but also seriously threaten the health and life of humans (15, 16). One of the major resistant mechanisms is the production of β-lactamase under selective pressure of antibiotics applied in irrational application. Therefore, a rational dosage regimen is an important method to prevent the emergence and spread of resistant bacteria. In view of these points, dosage regimens should be optimized not only to reach a clinical efficacy but also to prevent the emergence and spread of resistant bacteria.
The pharmacokinetic/pharmacodynamic (PK/PD) integration model can comprehensively study the relationship between PK/PD parameters and antibacterial effect and has been widely applied to design rational dosage regimens in clinical trials. At present, the common PK/PD model can classify to in vitro, in vivo, and ex vivo models. Each model has its own advantage. Compared to in vitro and in vivo models, the ex vivo model needs few animals, low cost, and less harm, and the results can partially reflect the influence of the host. The tissue cage (TC) model was an ideal method for ex vivo PK/PD integration and has been applied in several animals to study the ex vivo PK/PD for respiratory pathogens, such as Pasteurella multocida, Mannheimia haemolytica, and A. pleuropneumoniae (17–19).
Cefquinome is a broad-spectrum fourth-generation cephalosporin used only in animals. It has been approved for the treatment of several diseases caused by A. pleuropneumoniae, Klebsiella pneumoniae, and Streptococcus suis (8, 20, 21). One report (22) has applied the TC model to study the ex vivo PK/PD integration of cefquinome against Escherichia coli. As far as we know, the ex vivo PK/PD integration of cefquinome against APP has not been reported. Therefore, in this study, we will apply a piglet TC model to study the ex vivo PK/PD integration of cefquinome against APP. Meanwhile, a kill rate-based time-kill curve will be conducted to study the relationships between cefquinome concentrations and kill rates in vitro. We wished that these findings could precisely clarify the antibacterial activities of cefquinome against APP to design a rational dosage regimen.
Materials and Methods
Bacterial Strain, Drugs, and Chemicals
APP (CVCC259) was provided by the Chinese Veterinary Culture Collection Center (Qingdao, China). Standard solutions of cefquinome were purchased from the China Institute of Veterinary Drugs Control (Beijing, China). Cefquinome sulfate injection (Cobactan® batch number: A673A01) was bought from Intervet International (Boxmeer, the Netherlands). Mueller–Hinton agar (MHA) and tryptic soy broth (TSB) were purchased from Guangdong Huankai Microbial Technology (Guangzhou, China). Nicotinamide adenine dinucleotide (NAD; lot: 20160810) was obtained from MYM Biological Technology (Beijing, China). Newborn bovine serum was supplied by Guangzhou Ruite Biotechnology (Guangzhou, China).
Determination of MIC and Time-Kill Curves of Cefquinome Against APP in TSB
APP was incubated in TSB and MHA with 4% newborn bovine serum and 1% NAD (1 mg/ml). The MIC of cefquinome against APP was tested by microdilution according to the reference methods of the Clinical and Laboratory Standards Institute (23). Briefly, after the APP was incubated for 8 h in a constant temperature shaker (200 rpm, 37°C), and the exponential phase bacterium suspension was diluted to a final concentration of 5 × 10⁵ colony-forming units (CFU)/mL by 10-fold dilution. The cefquinome suspension ranging from 0.0078 to 4 mg/l was prepared after serial twofold dilutions with TSB, and 100 μl was added to a 96-well plate. After 100 μl bacterial sample was added to each well, the plate was cultured for 18–20 h in a humidified incubator (37°C, 5% CO2). The MIC was determined as the minimal concentration of cefquinome without visible turbidity. All experiments were repeated thrice.
For time-kill curves, eight twofold increased drug concentrations based on MIC (0.5, 1, 2, 4, 8, 16, 32, and 64 × MIC) and control group (0 × MIC) were applied in the following studies. Briefly, a series of cefquinome solutions (0, 0.39, 0.78, 1.56, 3.12, 6.25, 12.5, 25, 50 μg/ml) were diluted by sterile physiologic saline. Then, 100 μl cefquinome solution, 1 ml logarithmic phase APP (~107 CFU/ml), and 8.9 ml preheated TSB were added into a 15-ml sterile tube. After mixing, the tubes were placed in an incubator (37°C, 5% CO2) for 24 h. During the incubation period, 100 μl of the suspension was removed from the tube at 0, 1, 3, 6, 9, 12, and 24 h, respectively. After a series of 10-fold dilution (10−1-10−6) by 0.9% NaCl, the dilutions were dropped on MHA and incubated for 18–20 h for bacterial counting. The detected limitation of the bacterial population was 50 CFU/ml. When the number of APP < 50 CFU/ml, 50 CFU/ml was used to draw kill curves. All experiments were repeated thrice. For depicting kill curves, the logarithmic mean value (Log10 CFU/mL) was taken as the vertical axis and the culture time was taken as the horizontal axis.
Calculation and Integration of Kill Rate and Concentration
The antibacterial effect was described as the maximum change of APP number (Log10 CFU/mL) over each time period. The kill rate was the antibacterial effect divided by the corresponding time period. For kill curves, the kill rate was represented by the slope of the curve at a given time period (0–1, 1–3, 3–6, 6–9, 0–3, 0–6, and 0–9 h). Seven kill rates were obtained from different cefquinome concentrations. Finally, the kill rate (in the same period) and cefquinome concentration relationship were analyzed by using the sigmoid Emax model (WinNonlin 5.2.1, Pharsight, MO, USA). The equation was described as follows:
where E is the kill rate; Emax is the maximum kill rate in TSB with cefquinome during each period; E0 is the kill rate in control TSB; Ce is the cefquinome concentration; N is the Hill coefficient that describes the steepness of the curve for the kill rate and cefquinome concentration; and EC50 is the cefquinome concentration producing 50% of the maximum kill rate. The coefficient of determination (R2) represented the relationship between kill rate and cefquinome concentration and can be acquired after sigmoid Emax simulation. The higher the value of R2, the higher the level of correlation between kill rate and concentration.
Animals and TC Implantation
Six healthy piglets (Duroc × Landrace × Yorkshire, three females and three males, ~25 kg) were purchased from the Guangzhou Fine Breed Swine Farm (Guangzhou, China). They were housed in separate cages and fed antibiotic-free fodder twice daily, while water was provided ad libitum.
TCs were the same as those employed in previous study (22). The brief operation to implant TC was as follows. Firstly, a deep general anesthesia was induced by application of pentobarbital sodium into the neck by intramuscular injection. Then, the local infiltration anesthesia was induced by subcutaneous injection of procainamide hydrochloride. Thirdly, two TCs (sterilized by 75% ethyl alcohol and ultraviolet light) were implanted subcutaneously to each side of the neck equidistant from the jugular vein and spinal cord in each piglet. At last, penicillin (1000,000 IU/kg) and tetracycline ointment were used twice daily for 3 days to prevent infections. After 4–5 weeks, the TC was filled with TCF. After bacteriological examination, the TC without bacteria was used for the following experiment. The experimental protocol was approved (2016016) by the Committee on the Ethical Use of Animals of South China Agricultural University (Guangzhou, China).
PK of Cefquinome and Ex vivo Antimicrobial Activity
Each piglet received cefquinome (2 mg/kg body weight) by intragluteal injection. Then, 1 ml TCF samples was collected at 0, 0.25, 0.5, 1, 3, 6, 9, 12, 24, 48, 72, and 96 h, and 5 ml blood samples was collected at 0, 0.083, 0.25, 0.5, 1, 2, 4, 6, 8, 12, 24, 36, and 48 h into sterilized centrifuge tubes, respectively. After being centrifuged (3,000 × g, 10 min, 4°C), the supernatant of TCF and serum samples were divided into two sterilized tubes and stored at −20°C within 2 weeks for measurement of the cefquinome concentration and ex vivo antimicrobial activity.
Determination of the cefquinome concentration was undertaken by high-performance liquid chromatography tandem mass spectrometry, as described in our previous study (8). PK data were analyzed based on the non-compartment model by WinNonlin 5.2.1.
The MIC test methods for serum and TCF samples were the same as in the TSB sample. For ex vivo kill curves, 5 μl exponential phase bacterial suspension (~109 CFU/ml) was added to sterilized tubes containing 0.5 ml TCF samples (for serum, 10 μl suspension was added to 1 ml serum sample) to ensure that the final bacterial concentration was about 5 × 10⁷ CFU/ml and cultured in a humidified incubator (37°C, 5% CO2). Then, 50 μl suspension sample was removed at 0, 1, 3, 6, 9, 12, and 24 h for APP counting. The ex vivo antibacterial time-kill curves were depicted the same as described in TSB. The antibacterial effect was described as the maximum change of APP number (Log10 CFU/mL) over 24 h.
Ex vivo PK/PD Integration
For PK/PD integration, the AUC24h/MIC (AUC24h was the cefquinome concentration of each sample multiplied by 24 h) was applied to evaluate the ex vivo antibacterial effect by the sigmoid Emax model. The model equation was described as follows:
where I is the antibacterial effect; I0 is the maximum change in Log10 CFU/mL of the control sample (drug free) after incubation for 24 h; Imax is the maximum reduction of bacterial count (Log10 CFU/mL) in TCF or serum samples (contain cefquinome) after incubation for 24 h; Ce is the value of AUC24h/MIC; IC50 is the value of AUC24h/MIC needed to reach 50% Imax; and N is the Hill coefficient that describes the steepness of the curve for AUC24h/MIC and antibacterial effect.
The antibacterial effect of cefquinome was quantified for three levels according to the value of I. I = 0 was defined as a “bacteriostatic” effect. I = −3 was considered a “bactericidal” effect. I = −4 was defined as a “bacterial-eradication” effect.
Statistical Analysis
The one-way ANOVA test (SPSS, version 22, IBM) was applied to analyze the difference of cefquinome PK indices among sera and TCF of each piglet. p < 0.05 indicated significant difference.
Results
MIC and Kill Curves of Cefquinome Against APP in TSB
The MIC of cefquinome against APP was 0.008 μg/ml in TSB. The time-kill curves are depicted in Figure 1. The reduction of the APP population ranged from 1.02 to 6.32 Log10 CFU/mL at different cefquinome concentrations (1 to 64 × MIC) during 0 to 24 h. At 0.5 × MIC, a slight increase (1.91 Log10 CFU/mL) in APP number was observed. At 1 × MIC and 2 × MIC, the total reduction of APP was 1.02 Log10 CFU/mL and 1.08 Log10 CFU/mL, respectively, and a regrowth of APP was observed after 9 h. At 4 × MIC, a bactericidal effect (−3.16 Log10 CFU/mL) was achieved without regrowth. At 8 × MIC, a bacterial-eradication effect (−4.43 Log10 CFU/mL) was reached. At 16 × MIC, the antibacterial effect reached a maximum value (−6.29 Log10 CFU/mL) and no longer increased with drug concentration added.
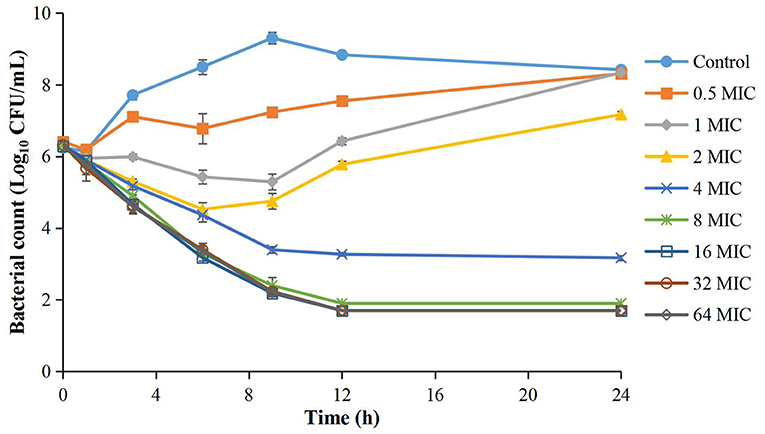
Figure 1. Time-kill curves of different concentrations of cefquinome against A. pleuropneumoniae in TSB. Each symbol represents the mean ± SD after the experiment had been repeated thrice.
Integration of the Kill Rate and Cefquinome Concentration
Because the APP population was lower than the limitation of detection after 9 h during 16 to 64 × MIC, we only calculated and analyzed the kill rate during 0 to 9 h for precise PK/PD integration (Table 1). At each time period, the kill rate increased upon addition of cefquinome during low drug concentrations (0–8 × MIC) and did not obviously increase and showed no significant difference during high drug concentrations (8–64 × MIC). At each drug concentration, the kill rate decreased gradually along with the prolongation of the incubation time. Therefore, a long interaction time was needed to produce bactericidal effect (6 h for 8 × MIC, 12 h for 4 × MIC).
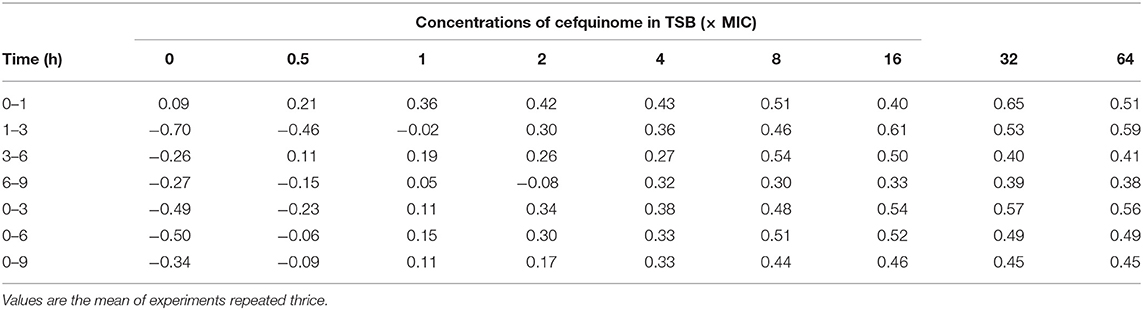
Table 1. Kill rate (Log10 CFU/mL/h) at different time intervals at different concentrations of cefquinome against A. pleuropneumoniae in TSB.
After analyzing the relationship between cefquinome concentration and kill rate during 0 to 9 h by the sigmoid Emax model, the main parameters and correlations (R2) are as listed in Table 2. R2 ranged from 0.9183 to 0.9955. The fittest relationship was at the 0-9-h time period (R2 = 0.9955) (Figure 2). The maximum kill rate was 0.48 Log10 CFU/mL/h. The kill rate increased rapidly with increasing drug concentration from 0.5 × MIC to 8 × MIC and then increased slowly from 8 × MIC to 16 × MIC (Figure 2). The kill rate was stable and virtually unchanged when the cefquinome concentration >16 × MIC.
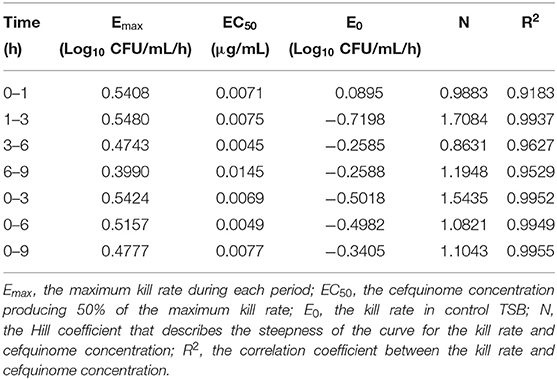
Table 2. Main parameters between the cefquinome concentration and kill rate after sigmoid Emax simulation.
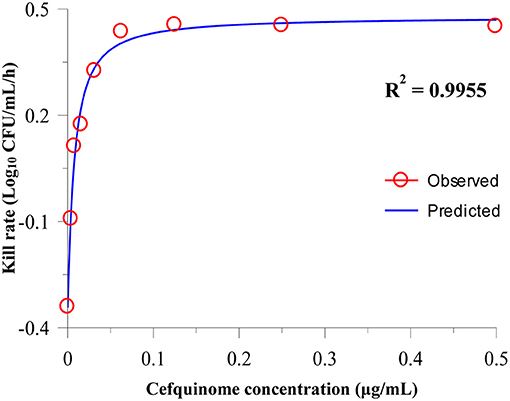
Figure 2. Relationship between the cefquinome concentration and kill rate during 0 h to 9 by Sigmoid Emax simulation. The R2 value is the coefficient of determination.
PK of Cefquinome and Ex vivo Antibacterial Activity in Serum and TCF
The concentration–time curves of cefquinome are depicted in Figure 3A (serum) and Figure 3B (TCF). The main PK parameters are listed in Table 3. The mean values of the maximum concentration (Cmax) were 5.65 ± 1.10 μg/ml and 1.13 ± 0.06 μg/ml, the time needed to reach the maximum concentration (Tmax) were 0.58 ± 0.20 h and 2.6 ± 0.8 h, the area under the concentration–time curves (AUCinfinity) were 18.48 ± 3.28 μg h/ml and 20.83 ± 0.57 μg h/ml, and the terminal half-lives (T1/2β) were 2.24 ± 0.13 h and 12.22 ± 0.85 h in serum and TCF, respectively.
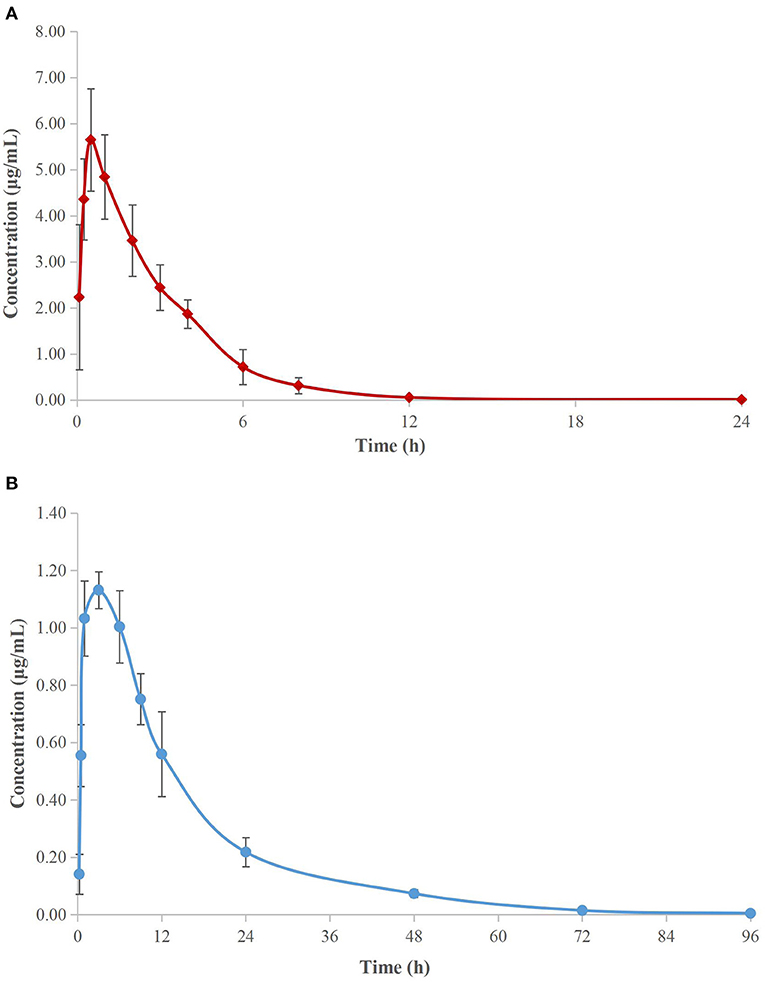
Figure 3. Semi-logarithmic concentration-time curves of cefquinome in porcine serum (A) and TCF (B). Values are the mean ± standard deviation (n = 6).
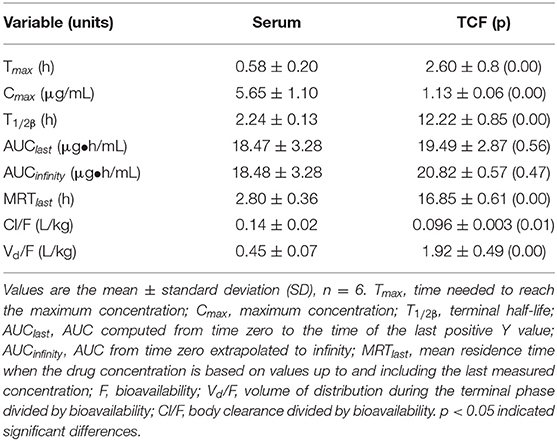
Table 3. Pharmacokinetics of cefquinome in serum and TCF after intramuscular administration at 2 mg/kg body weight.
The MICs of cefquinome against APP were both 0.016 μg/ml in serum and TCF. The ex vivo time-kill curves of cefquinome against APP in serum and TCF are depicted in Figures 4, 5 respectively. For serum samples, a bacteriostatic effect (1.30 Log10 CFU/ml reduction) could be achieved for samples collected at 12 h and APP was regrown after 3 h. The bactericidal effect (3.89 and 3.90 Log10 CFU/ml reduction) was observed for samples collected at 6 and 8 h. The bacterial-eradication effect (4.02 to 4.60 Log10 CFU/ml reduction) was produced for samples collected at 0.083 to 4 h. For TCF, samples collected at 0.5 to 24 h exerted a bacterial-eradication effect (4.06 to 4.30 Log10 CFU/ml reduction) without regrowth after 24 h of incubation. Bactericidal activity (3.58 Log10 CFU/ml reduction) was observed for the sample collected at 0.25 h. The bacteriostatic effect (0.15 to 2.54 Log10 CFU/ml reduction) was observed for samples collected at 48 to 96 h.
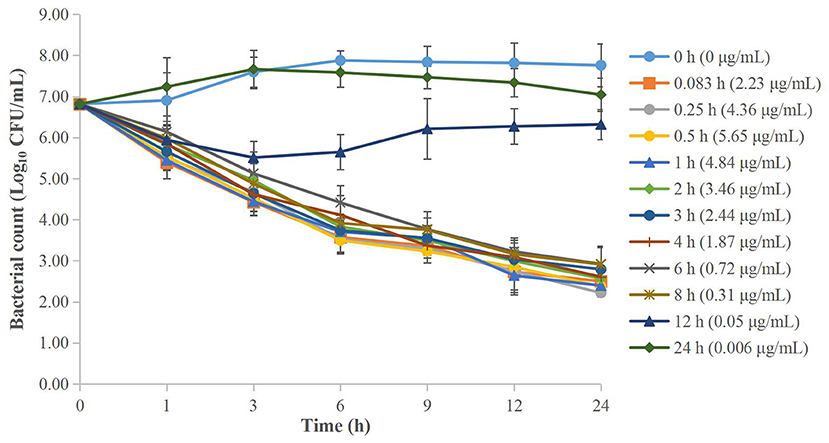
Figure 4. Ex vivo time-kill curves of cefquinome against A. pleuropneumoniae in serum before and after intramuscular administration. Values are the mean ± standard deviation (n = 6).
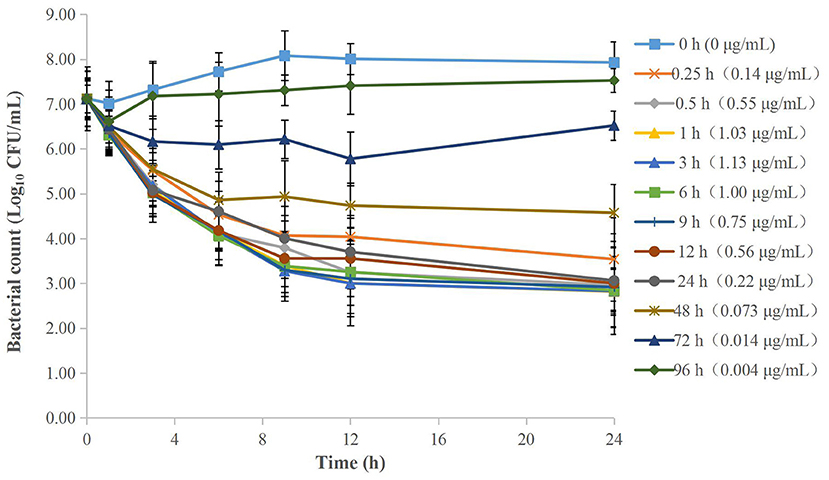
Figure 5. Ex vivo time-kill curves of cefquinome against A. pleuropneumoniae in TCF before and after intramuscular administration. Values are the mean ± standard deviation (n = 6).
Ex vivo PK/PD Integration and Analyses
The parameters integrated by the PK/PD model are presented in Table 4. A specimen plot of AUC24h/MIC-effect (Log10 CFU/mL) is depicted in Figure 6A (serum) and Figure 6B (TCF). The values of AUC24h/MIC to produce a bacteriostatic effect, bactericidal effect, and bacterial-eradication effect were 18.94, 246.8, and 1013.23 h in serum, and 4.20, 65.81, and 391.35 h in TCF, respectively.
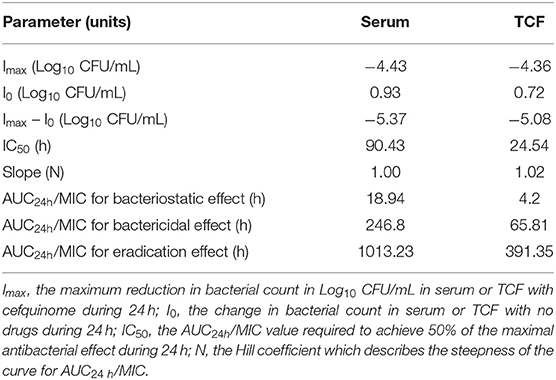
Table 4. Values of ex vivo PK/PD parameters and AUC24h/MIC required to achieve various degrees of antibacterial efficacy in serum and TCF.
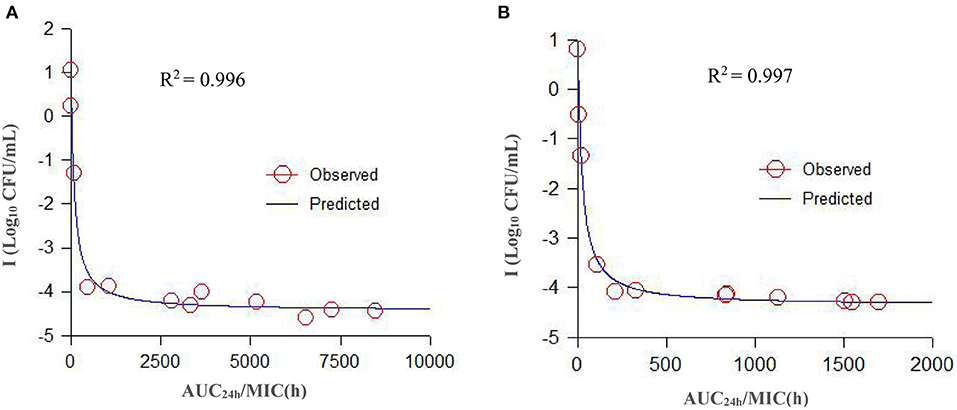
Figure 6. A specimen plot of ex vivo AUC24h/MIC-antibacterial effect (Log CFU/mL) for A. pleuropneumoniae in serum (A) and TCF (B). The R2 value is the coefficient of determination. Values are the mean ± standard deviation (n = 6). SD bars have been omitted for clarity.
Discussion
Actinobacillus pleuropneumoniae is a serious pathogenic bacterium which can cause respiratory diseases of pigs (24, 25). Antibacterials were an important therapeutic method. However, with unreasonable application of a large number of drugs, multidrug-resistant pathogens gradually appeared which may reduce the antibacterial effect and threaten human health. To solve drug resistance, development of new drugs and optimization of drug dosage regimens were two effective methods. However, the development rate of new drugs cannot keep up with the emergence of drug resistance. Therefore, it is a practical method to optimize the drug schemes.
For dosage regimen design, the commonly applied PD parameter was MIC. However, because of the limitation of the test method, there are some deficiencies. One deficiency is that the MIC was tested in static drug concentrations during a period which is known to have an “all or nothing” value. Hence, the MIC reflects only the final antibacterial effect, which does not clarify the dynamic process of antibacterial activity at different periods. The other deficiency is that the MIC is commonly examined in an artificial medium, which does not consider the interaction of body substances (e.g., neutrophils, cytokines, immune factors) (26, 27). Therefore, for a detailed understanding of antibacterial activity, a kill rate-based time-kill curve has been applied for in vitro PK/PD integration. This method can provide more valuable data by reflecting the dynamic interaction from multidimensional aspects of drugs against pathogens. The kill rate also has been applied to classify drugs as time-dependent or concentration-dependent (28). Therefore, in the present study, we applied this model to study the relationship between concentrations and kill rate of cefquinome against APP during different time periods.
Our in vitro PK/PD results show that the kill rates of cefquinome against APP were relatively low. Even when the drug concentration reached 64 × MIC, the maximum kill rate was 0.59 Log10 CFU/mL/h. The kill rate reached a maximum value when the drug concentration reached 8 × MIC and did not increase with the drug concentration added. We also found that the antibacterial activity of cefquinome against APP was according to time-dependent drug characteristics. That is to say, a more potent antibacterial effect required the cefquinome concentration to be higher than the MIC for a longer time. These findings were similar to other cephalosporin studies. Ahmad et al. (29) applied a pharmacodynamic model to analyze the relationship between the kill rate and concentration of cefquinome against Staphylococcus aureus, and the maximum kill rate was 1.67 h−1. Thomas et al. (30) studied the antibacterial activity of cefquinome against equine bacteria. They showed that the effect of cefquinome was time-dependent, but that the kill rate and drug concentration had no obvious correlation. Maneke et al. (31) compared the kill rate of cefalexin and kanamycin alone or combination against five mastitis pathogens. The results show that the higher concentrations can produce faster kill for most strains. At lower antibiotic concentrations, a faster and greater kill was observed for the combination of cefalexin and kanamycin than alone. In our study, a sigmoid Emax model was applied to analyze the relationship between cefquinome concentrations and kill rate. As far as we know, one report (32) also applied this method to study the antibacterial activity of doxycycline against Mycoplasma gallisepticum. Their results showed that doxycycline exhibited time-dependent antibacterial activity and the maximum kill rate was 0.11 h−1.
The PK properties of cefquinome in piglet serum and TCF were reported (22) after intramuscular administration at 2 mg/kg. The reported Cmax, Tmax, AUC, and T1/2β were 6.15 and 1.15 μg/ml, 0.34 and 3.00 h, 21.40 and 17.79 μg h/ml, and 2.30 and 11.81 h, in serum and TCF, respectively, and were similar to our values.
For PK/PD integration, the commonly applied PK/PD indices included Cmax/MIC, AUC24h/MIC, and %T > MIC (the percentage of time of drug concentration above MIC after each dosing interval). Generally, the fittest PK/PD parameter for time-dependent drugs was %T > MIC after different dosage treatments in dynamic models. Several reports had studied the PK/PD integration of cefquinome against other pathogens, such as Streptococcus suis, Haemophilus parasuis, Escherichia coli, and Staphylococcus aureus (21, 33–35), and they had calculated the different values of %T > MIC for achieving different antibacterial effect to guide the designation of dose regimens. However, in our present study, we applied AUC24h/MIC for the ex vivo PK/PD integration of cefquinome against APP. Because the different values of %T > MIC cannot be acquired in static drug concentrations, AUC24h/MIC had been widely applied for ex vivo PK/PD analysis in several kinds of drugs and bacteria. Aliabadi and Lees (17) used a TC model in goats to study the ex vivo PK/PD integration of danofloxacin against Mannheimia haemolytica, and the values of AUC24h/MIC in serum for bacteriostatic, bactericidal, and bacterial-eradication effects were 22.6, 29.6, and 52.2 h, respectively. Dorey et al. (18) applied a TC model in pigs to study the ex vivo PK/PD integration of oxytetracycline against APP, and the values of AUC24h/MIC to reach bacteriostatic, bactericidal, and bacterial-elimination effects were 33.1, 55.4, and 79.7 h, respectively. Zhou et al. (19) applied a TC model in pigs to study the relationships between ex vivo PK/PD parameters and the antibacterial effect of tulathromycin against Pasteurella multocida in serum and TCF, and the values of AUC24h/MIC for bacteriostatic, bactericidal, and bacterial-eradication effects were 44.55, 73.19, and 92.44 h in serum, respectively (the values of AUC24h/MIC were 32.42 and 41.85 for bacteriostatic and bactericidal effects in TC exudates, respectively). Zhang et al. (22) used a piglet TC model to study the ex vivo PK/PD integration of cefquinome against Escherichia coli ATCC 25922, and the values of AUC24h/MIC for bactericidal and bacterial-eradication effects were 35.01 and 44.28 h in TCF, respectively. Sun et al. (9) studied the ex vivo PK/PD integration of ceftiofur against APP in swine serum. Their results showed that ceftiofur conducted a time-dependent antibacterial activity with a partly concentration-dependent pattern against APP-BW39, and the values of AUC24h/MIC for bacteriostatic, bactericidal, and eradication effects were 45.73, 63.83, and 69.04 h, respectively. Luo et al. (36) studied the ex vivo PK/PD integration of ceftiofur against Streptococcus suis in pig pulmonary epithelial lining fluid, and the values of AUC24h/MIC for achieving bacteriostatic, bactericidal, and eradication effects were 6.54, 9.69, and 11.49 h, respectively. In our present study, the ex vivo time-kill curves of cefquinome against APP showed no obvious differences between serum and TCF. The values for the time above the MIC after a single administration (T > MIC) were >12 h in serum and >48 h in TCF after administration at 2 mg/kg. The values of AUC24h/MIC for bacteriostatic, bactericidal, and bacterial-eradication effects were 18.94, 246.8, and 1013.23 h in serum, and 4.20, 65.81, and 391.35 h in TCF, respectively.
At present, the PK/PD model can generally be classified to in vitro, ex vivo, and in vivo models. Each of these models has its own advantages and disadvantages. In the present study, we conducted in vitro and ex vivo PK/PD research. Compared to the in vivo study, these two studies can exhibit three different antibacterial characteristics. First, the in vitro study can precisely and directly reflect the antibacterial activity of drug–pathogen interactions. In addition, the in vitro study was more fit to identify the characteristics of drugs to time or concentration-dependent antibacterial activity than the in vivo model. Further, the ex vivo study could in detail reflect the difference of protein binding, nutrient substance, immune factors, and cytokines in body fluid (such as serum, plasma, TCF, and inflammatory exudate). For the in vivo study, the antibacterial effect is the final result of drug, pathogen, and host interactions which cannot describe the separately interactive process of drugs and host. Therefore, it is maybe more rational and effective to comprehensively consider the data from in vitro, ex vivo, and in vivo studies during design dosage regimens.
Although we had successfully studied the in vitro and ex vivo PK/PD integration of cefquinome against APP, there were still some limitations. One is that the TCF was collected between skin and muscle. Therefore, the substance and cefquinome PKs were different from the target organs (lung) of respiratory pathogens. The other limitation is the difference between health and infected body conditions. Actually, the immune system will be activated and produce a lot of immune factors by pathogen infection. In addition, to calculate the recommended dosage regimens, an MIC90 was needed. Because the number of APP was not enough, we did not calculate the recommended dosages in this study. Therefore, in our further studies, we will optimize the ex vivo PK/PD model from these aspects, such as a microdialysis to collect lung fluids.
Conclusions
Cefquinome exhibited time-dependent antibacterial activity against APP based on the analyses of kill rate. The maximum kill rate was 0.48 Log10 CFU/ml/h at 0-9 h in TSB. The time of cefquinome concentrations exceeded MIC for up to 12 h in serum and 48 h in TCF after 2 mg/kg IM administration. The values of AUC24h/MIC for a bactericidal effect should reach 65.81 h in TCF and 246.8 h in serum.
Data Availability Statement
The raw data supporting the conclusions of this article will be made available by the authors, without undue reservation.
Ethics Statement
The animal study was reviewed and approved by Committee on the Ethics of Animals of South China Agricultural University.
Author Contributions
LZ and HW contributed to the methodology, software use, validation, data analysis, writing, and project administration. HX, HD, GZ, and JH contributed to study supervision. LZ and HX contributed to funding acquisition. All authors contributed to the article and approved the submitted version.
Funding
This work was supported by the Postdoctoral Research Foundation of Henan Institute of Science and Technology, Key Technology Research and Development Program of Henan Province (212102110373 and 202102110241), the Scientific Research Program of Henan Institute of Science and Technology (103010620002/004), Postdoctoral Research Foundation of Henan Province (10303015/005), and Program for Innovative Research Team (in Science and Technology) in University of Henan Province (22IRTSTHN026).
Conflict of Interest
The authors declare that the research was conducted in the absence of any commercial or financial relationships that could be construed as a potential conflict of interest.
Publisher's Note
All claims expressed in this article are solely those of the authors and do not necessarily represent those of their affiliated organizations, or those of the publisher, the editors and the reviewers. Any product that may be evaluated in this article, or claim that may be made by its manufacturer, is not guaranteed or endorsed by the publisher.
References
1. Aper D, Frömbling J, Bagcioglu M, Ehling-Schulz M, Hennig-Pauka I. Comparison of metabolic adaptation and biofilm formation of Actinobacillus pleuropneumoniae field isolates from the upper and lower respiratory tract of swine with respiratory disease. Vet Microbiol. (2020) 240:108532. doi: 10.1016/j.vetmic.2019.108532
2. Bossé JT, Janson H, Sheehan BJ, Beddek AJ, Rycroft AN, Kroll JS, et al. Actinobacillus pleuropneumoniae: pathobiology and pathogenesis of infection. Microbes Infection. (2002) 4:225–235. doi: 10.1016/S1286-4579(01)01534-9
3. Gottschalk M, Taylor DJ. Actinobacillus pleuropneumoniae. Dis Swine. (2006) 9:563–76. doi: 10.1002/9781119350927
4. Sassu EL, Bossé JT, Tobias TJ, Gottschalk M, Langford PR, Hennig-Pauka I. Update on Actinobacillus pleuropneumoniae-knowledge, gaps and challenges. Transbound Emerg Dis. (2018) 65:72–90. doi: 10.1111/tbed.12739
5. Stringer OW, Bossé JT, Lacouture S, Gottschalk M, Fodor L, Angen Ø, et al. Proposal of Actinobacillus pleuropneumoniae serovar 19, and reformulation of previous multiplex PCRs for capsule-specific typing of all known serovars. Vet Microbiol. (2021) 255:109021. doi: 10.1016/j.vetmic.2021.109021
6. Loera-Muro A, Angulo C. New trends in innovative vaccine development against Actinobacillus pleuropneumoniae. Vet Microbiol. (2018) 217:66–75. doi: 10.1016/j.vetmic.2018.02.028
7. Ramjeet M, Deslandes V, Gouré J, Jacques M. Actinobacillus pleuropneumoniae vaccines: from bacterins to new insights into vaccination strategies. Anim Health Res Rev. (2008) 9:25–45. doi: 10.1017/S1466252307001338
8. Zhang L, Wu X, Huang Z, Zhang N, Wu Y, Cai Q, et al. Pharmacokinetic/pharmacodynamic assessment of cefquinome against Actinobacillus Pleuropneumoniae in a piglet tissue cage infection model. Vet Microbiol. (2018) 219:100–6. doi: 10.1016/j.vetmic.2018.02.027
9. Sun D, Mi K, Hao H, Xie S, Chen D, Huang L, et al. Optimal regimens based on PK/PD cutoff evaluation of ceftiofur against Actinobacillus pleuropneumoniae in swine. BMC Vet Res. (2020) 16:1–11. doi: 10.1186/s12917-020-02589-9
10. Blondeau JM, Fitch SD. Mutant prevention and minimum inhibitory concentration drug values for enrofloxacin, ceftiofur, florfenicol, tilmicosin and tulathromycin tested against swine pathogens Actinobacillus pleuropneumoniae, Pasteurella multocida and Streptococcus suis. PLoS ONE. (2019) 14:e0210154. doi: 10.1371/journal.pone.0210154
11. Zhang L, Kang Z, Yao L, Gu X, Huang Z, Cai Q, et al. Pharmacokinetic/pharmacodynamic integration to evaluate the changes in susceptibility of Actinobacillus pleuropneumoniae after repeated administration of Danofloxacin. Front Microbiol. (2018) 9:2445. doi: 10.3389/fmicb.2018.02445
12. Vilalta C, Giboin H, Schneider M, EI Garch F, Fraile L. Pharmacokinetic/pharmacodynamic evaluation of marbofloxacin in the treatment of Haemophilus parasuis and Actinobacillus pleuropneumoniae infections in nursery and fattener pigs using Monte Carlo simulations. J Vet Pharmacol Ther. (2014) 37:542–9. doi: 10.1111/jvp.12134
13. Hart FJ, Kilgore RW, Meinert TR, Nutsch RG, Sunderland SJ, Lechtenberg KF. Efficacy of tulathromycin in the treatment of respiratory disease in pigs caused by Actinobacillus pleuropneumoniae. Vet Rec. (2006) 158:433–6. doi: 10.1136/vr.158.13.433
14. Rattanapanadda P, Kuo HC, Vickroy TW, Sung CH, Rairat T, Lin TL, et al. In vitro and in vivo Synergistic Effects of Florfenicol and Thiamphenicol in Combination Against Swine Actinobacillus pleuropneumoniae and Pasteurella multocida. Front Microbiol. (2019) 10:2430. doi: 10.3389/fmicb.2019.02430
15. Mi K, Sun D, Li M, Hao H, Zhou K, Liu Z, et al. Evidence for Establishing the Clinical Breakpoint of Cefquinome against Haemophilus Parasuis in China. Pathogens. (2021) 10:105. doi: 10.3390/pathogens10020105
16. Liu Z, Deng D, Lu H, Sun J, Lv L, Li S, et al. Evaluation of machine learning models for predicting antimicrobial resistance of Actinobacillus pleuropneumoniae from whole genome sequences. Front Microbiol. (2020) 11:48. doi: 10.3389/fmicb.2020.00048
17. Aliabadi FS, Lees P. Pharmacokinetics and pharmacodynamics of danofloxacin in serum and tissue fluids of goats following intravenous and intramuscular administration. Am J Vet Res. (2001) 62:1979–1989. doi: 10.2460/ajvr.2001.62.1979
18. Dorey L, Pelligand L, Cheng Z, Lees P. Pharmacokinetic/pharmacodynamic integration and modelling of oxytetracycline for the porcine pneumonia pathogens Actinobacillus pleuropneumoniae and Pasteurella multocida. J Vet Pharmacol Ther. (2017) 40:505–16. doi: 10.1111/jvp.12385
19. Zhou Q, Zhang G, Wang Q, Liu W, Huang Y, Yu P, et al. Pharmacokinetic/pharmacodynamic modeling of tulathromycin against Pasteurella multocida in a porcine tissue cage model. Front Pharmacol. (2017) 8:392. doi: 10.3389/fphar.2017.00392
20. Qu S, Dai C, Yang F, Huang T, Hao Z, Tang Q, et al. Cefquinome-loaded microsphere formulations in protection against pneumonia with Klebsiella pneumonia infection and inflammatory response in rats. Pharm Res. (2019) 36:1–10. doi: 10.1007/s11095-019-2614-7
21. Guo C, Liao X, Wang M, Wang F, Yan C, Xiao X, et al. In vivo pharmacodynamics of cefquinome in a neutropenic mouse thigh model of Streptococcus suis serotype 2 at varied initial inoculum sizes. Antimicrob Agents Chemother. (2016) 60:1114–20. doi: 10.1128/AAC.02065-15
22. Zhang BX, Lu XX, Gu XY, Li XH, Gu MX, Zhang N, et al. Pharmacokinetics and ex vivo pharmacodynamics of cefquinome in porcine serum and tissue cage fluids. Vet J. (2014) 199:399–405. doi: 10.1016/j.tvjl.2013.12.015
23. Clinical and Laboratory Standards Institute. Performance Standards for Antimicrobial Susceptibility Testing; 25th Informational Supplement. Wayne, PA: CLSI Document M100-S25, Clinical and Laboratory Standards Institute (2015).
24. Chiers K, Donné E, Van Overbeke I, Ducatelle R, Haesebrouck F. Actinobacillus pleuropneumoniae infections in closed swine herds: infection patterns and seroLogical profiles. Vet Microbiol. (2002) 85:343–352. doi: 10.1016/S0378-1135(01)00518-1
25. O'Neill C, Jones SCP, Bossé JT, Watson CM, Williamson SM, Rycroft AN, et al. Prevalence of Actinobacillus pleuropneumoniae serovars in England and Wales. Vet Rec. (2010) 167:661. doi: 10.1136/vr.c5106
26. Baarsch MJ, Scamurra RW, Burger K, Foss DL, Maheswaran SK, Murtaugh MP. Inflammatory cytokine expression in swine experimentally infected with Actinobacillus pleuropneumoniae. Infect Immun. (1995) 63:3587–94. doi: 10.1128/iai.63.9.3587-3594.1995
27. Bao C, Jiang H, Zhu R, Liu B, Xiao J, Li Z, et al. Differences in pig respiratory tract and peripheral blood immune responses to Actinobacillus pleuropneumoniae. Vet Microbiol. (2020) 247:108755. doi: 10.1016/j.vetmic.2020.108755
28. Woodhead M. Community-acquired pneumonia in Europe: causative pathogens and resistance patterns. Eur Respir J. (2002) 20 (36 suppl):20s−7s. doi: 10.1183/09031936.02.00702002
29. Ahmad I, Hao H, Huang L, Sanders P, Wang X, Chen D, et al. Integration of PK/PD for dose optimization of Cefquinome against Staphylococcus aureus causing septicemia in cattle. Front Microbiol. (2015) 6:588. doi: 10.3389/fmicb.2015.00588
30. Thomas E, Thomas V, Wilhelm C. Antibacterial activity of cefquinome against equine bacterial pathogens. Vet Microbiol. (2006) 115:140–7. doi: 10.1016/j.vetmic.2005.12.019
31. Maneke E, Pridmore A, Goby L, Lang I. Kill rate of mastitis pathogens by a combination of cefalexin and kanamycin. J Appl Microbiol. (2011) 110:184–90. doi: 10.1111/j.1365-2672.2010.04876.x
32. Zhang N, Gu X, Ye X, Wu X, Zhang B, Zhang L, et al. The PK/PD interactions of doxycycline against Mycoplasma gallisepticum. Front Microbiol. (2016) 7:653. doi: 10.3389/fmicb.2016.00653
33. Xiao X, Sun J, Chen Y, Huang RJ, Huang T, Qiao GG, et al. In vitro dynamic pharmacokinetic/pharmacodynamic (PK/PD) modeling and PK/PD cutoff of cefquinome against Haemophilus parasuis. BMC Vet Res. (2015) 11:1–7. doi: 10.1186/s12917-015-0343-7
34. Gu M, Zhang N, Zhang L, Xiong M, Yang Y, Gu X, et al. Response of a clinical Escherichia coli strain to repeated cefquinome exposure in a piglet tissue-cage model. BMC Vet Res. (2015) 11:1–8. doi: 10.1186/s12917-015-0486-6
35. Yu Y, Zhou YF, Li X, Chen MR, Qiao GL, Sun J, et al. Dose assessment of cefquinome by pharmacokinetic/pharmacodynamic modeling in mouse model of Staphylococcus aureus mastitis. Front Microbiol. (2016) 7:1595. doi: 10.3389/fmicb.2016.01595
Keywords: kill rate, ex vivo PK/PD integration, cefquinome, Actinobacillus pleuropneumoniae, tissue cage model
Citation: Zhang L, Xie H, Wang H, Ding H, Zhang G and Hu J (2021) Kill Rate and Evaluation of Ex Vivo PK/PD Integration of Cefquinome Against Actinobacillus pleuropneumoniae. Front. Vet. Sci. 8:751957. doi: 10.3389/fvets.2021.751957
Received: 02 August 2021; Accepted: 12 November 2021;
Published: 13 December 2021.
Edited by:
Nora Mestorino, National University of La Plata, ArgentinaReviewed by:
Pritam Kaur Sidhu, Guru Angad Dev Veterinary and Animal Sciences University, IndiaFeray Altan, Dicle University, Turkey
Copyright © 2021 Zhang, Xie, Wang, Ding, Zhang and Hu. This is an open-access article distributed under the terms of the Creative Commons Attribution License (CC BY). The use, distribution or reproduction in other forums is permitted, provided the original author(s) and the copyright owner(s) are credited and that the original publication in this journal is cited, in accordance with accepted academic practice. No use, distribution or reproduction is permitted which does not comply with these terms.
*Correspondence: Jianhe Hu, amlhbmhlaHVAMTI2LmNvbQ==