 Gleb Yu. Kosovsky1†
 Galina V. Glazko
 Boris L. Zybaylov
- 1FSBEI HPE Russian State Agrarian University - Moscow Timiryazev Agricultural Academy, Moscow, Russia
- 2FSBSI V.A. Afanasyev RI for Fur and Rabbit Farming, Moscow, Russia
- 3Department of Biomedical Informatics, University of Arkansas for Medical Sciences, Little Rock, AR, United States
- 4Department of Biochemistry and Molecular Biology, University of Arkansas for Medical Sciences, Little Rock, AR, United States
Bovine Leukemia Virus (BLV) is an established model for studying retroviral infections, in particular the infection by the human T-cell leukemia type 1 (HTLV-1) virus. Here, we quantified gene expression of several BLV-related genes: effector protein of T and NK-killer cells NK-lysin (Nklys), reverse BLV transcriptase pol, BLV receptor (blvr), and also key enzymes of the microRNA maturation, Dicer (dc1) and Argonaut (ago2). The differences in the expression of the above genes were compared between five groups: (1) BLV infected cows with high and (2) low lymphocyte count, (3) with and (4) without BLV microRNA expressions, and (5) cows without BLV infections (control group). As compared to control, infected cows with high lymphocyte count and BLV microRNA expression had significantly decreased Nklys gene expression and increased dc1 and ago2 gene expressions. Few infected animals without pol gene expression nevertheless transcribed BLV microRNA, while others with pol gene expression didn't transcribe BLV microRNA. Notably, Pol expression significantly (P < 0.05) correlated with dc1 expression. For infected animals, there were no direct correlations between the number of leukocytes and pol, Nklys, and BLV microRNA gene expressions. Blvr gene expression is typical for juvenile lymphocytes and decreases during terminal differentiation. Our data suggest that BLV infects primarily juvenile lymphocytes, which further divide into two groups. One group expresses BLV DNA and another one expressed BLV microRNA that decreases host immune response against cells, expressing BLV proteins. It is suspected that regulatory microRNAs play a significant role in the bovine leukemia infections, yet the precise mechanisms and targets of the microRNAs remain poorly defined. Vaccines that are currently in use have a low response rate. Understanding of microRNA regulatory mechanisms and targets would allow to develop more effective vaccines for retroviral infections.
Introduction
Retroviruses are the main source of infections in humans and farm animals (1). During the course of evolution, retroviruses acquired the ability to suppress host immunity. Interestingly, the main players in the suppression process are viral microRNAs. They modify host metabolic pathways not only by affecting mRNA translation but also by interacting with host microRNA profiles (2). Viral microRNAs also interfere with regulation of host microRNAs that control the processes of cell division and innate immunity (3–5).
The ever-growing popularity of microRNA as a research target rests on its regulatory role in transcriptomic and epigenomic processes (6). The epigenome encompasses epigenetic marks such as DNA methylation, histone modifications, chromatin remodeling, and other molecules that can transmit epigenetic information such as non-coding RNAs, in particular microRNAs (7).
There are more than 1,600 structural genes, involved in a variety of metabolic pathways, including those associated with the immune system, that are regulated in a different way in present-day high-productive cattle breeds as compared to ancient ancestral forms (8). The regulatory differences are related to different targets of microRNA activity (8). Many microRNAs, participating in milk protein metabolism and quality, as well as regulating immune system at various stages of cow lactation, are now identified (9, 10).
Recently, microRNAs of Bovine Leukemia Virus (BLV), namely their organization, expression, and targets, became a focus of a large number of research projects, partially because BLV is closely related and similar to a Human T-cell leukemia virus Type I and II (HTLV-I and II) (1, 11–13). BLV-induced infection has two stages: proviral BLV DNA insertion into B-lymphocytes of host genome and proliferation of infected B-cell clones with increased leukosogenic potential (14). It was suggested that those clones do not express BLV proteins, but instead actively express microRNAs, influencing lympholeukosis. Sequencing of the small RNAs isolated from B-lymphomas of sheep, infected with BLV, revealed 10 regions 20–23 bp each of five BLV microRNAs that were transcribed from proviral DNA (from 6,398 to 6,906 bp) between the env gene and 2 R3 exon (12). It was found that in lymphoma cells, BLV microRNA transcripts represent 40% of all cellular microRNAs and their transcription involves RNA polymerase III. While 5′LTR hypermethylation is associated with BLV repression, BLV micro-RNA cluster remains active (13). The authors assume that transcriptional activation of BLV micro-RNA cluster in primary tumors and pre-leukemic clones is caused by negative selection against cell clones expressing BLV proteins provided by host immune system. Moreover, it was shown that expression of the one of BLV microRNAs, BLV-miR-B4, that has the same seed nucleotide sequence (2–7 nucleotides) as miR-29 from cattle genome, is greater than expression of miR-29 – a member of miR-17-92 family (oncomir-1) (3, 4). Overexpression of miR-29 was found in BLV-infected tumor cells, as well as in B lymphomas of human and mice (5). It is also known that BLV microRNAs play important role in BLV-induced leukoses, competing, with the help of RNA polymerase II, with antisense transcript of proviral DNA from 3′ BLV end (15). The interplay between proviral BLV DNA, BLV microRNAs, and leukoses remains unclear. There is an evidence for counteraction between proviral BLV DNA expression and microRNA expression as a result of host immune system selection pressure against cellular clones expressing BLV proteins.
In our previous studies, we demonstrated that cows, which are infected with BLV virus, have lower NK-lysin gene expression (that is the functional marker of T and NK killers) and have an increased thrombocyte count as compared to uninfected cows (16). It could indicate that the major BLV-induced infection event is the suppression of the host immune system. This would explain why BLV vaccination has such a low response rate (17). It is important to know if there is a connection between proviral BLV DNA expression, BLV microRNA expressions, leukoses, and the suppression of the host immune system, because BLV microRNA participates in pathogenesis induced by this retrovirus (14). The key proteins participating in maturation of microRNA transcript, as well as microRNA BLV transcript, are Dicer (dc1) and Argonaute (ago2). Therefore, in this work, we evaluate correlations between leukocytosis, expression of reverse transcriptase BLV pol, NK-lysin (that marks the activity of T and NK killers), BLV microRNA, genes dc1 and ago2 (their products participate in microRNA maturation), as well as the gene encoding cellular receptor for BLV (blvr).
Materials and Methods
Black-and-white Holsteinized cows, age between 2 and 5 years from ZAO Mozhayskoe farm (57 animals), were included in this study. The blood was taken from caudal veins of the animals. All animal care and experimental treatments were performed in compliance with the rules of and regulations of the Ministry of Agriculture of Russian Federation (directive#183, 04.16.2013 and directive#56, 02.16.2016).
Erythrocytic and lymphocytic profiles, as well as erythrocytes' properties, were measured using automatic hematological analyzer Abacus junior Vet5 (≪Diatron≫, Austria; the working principle is based on Coulter's method). The fresh peripherical samples of each animal's blood (4 ml), stabilized with EDTA, were used. The animals, infected with proviral DNA BLV, were found using radial immunodiffusion Mancini approach (RID) and our own PCR method (18).
DNA was isolated from 100 μl of whole blood with a reagent kit for DNA isolation from clinical samples “M-sorb” (Sintol, Russia) following the manufacturer's recommendations. The tested animals were distributed into two groups: those carrying integral BLV proviral DNA and infection-free. The total RNA was isolated from 1 ml of cow whole blood with a reagent ExtractRNA (Eurogen, Russia) following the manufacturer's recommendations. The RNA was processed with DNAse I (≪Thermo Fisher Scientific≫, USA), a first cDNA strand was synthesized with an MMLV RT kit by Eurogen (Russia) following the manufacturers' recommendations.
Comparative gene expression analysis (NK-lysin, dc and ago) was performed by quantitative techniques of real-time polymerase chain reaction with an intercalating dye SYBR Green and ready-to-use mix qPCRmix-HS SYBR (Eurogen, Russia) and a LightCycler 96 (≪Roche≫, Switzerland). The gene of a ribosomal protein RPLPO was used as a reference. Amplification was performed in 20 mcl of a reaction mix containing direct and reverse primers (0.2 mcM each) and c DNA (2 mcl). The following specific primers were used: NK-lysin - 5′-CCTCGGTGCTCCTGGTYGC−3′, 5′-GGTCACCCTGGGGATCCTC−3′; pol - 5′–GCAGGCCGATATAACCCAT−3′, 5′–TGCTGGCAAAACCTGACAAAG−3′; dicer1 – 5′-GAGTCACCGTGGAAGTGGTC-3′, 5′-CTCTCAAACCGCATCCCTCT-3′; ago2 – 5′- GGCAGGACAGAGATGCATAA-3′, 5′-GCAGCAGGATGTTGTTCACG-3′; blvr- 5′-CTATCGGACCAGTATGTGAAG−3′, 5′-CTCCTCGGTGACGATGTCC−3′  RPLPO- 5′-CAACCCTGAAGTGCTTGACAT−3′, 5′-CAGATGGATCAGCCAAGAAG−3′.
PCR was performed with LightCycler 96 (≪Roche≫, Switzerland) under the following conditions: denaturation: 95°C, 15 s, primers annealing: 60°C, 15 s, elongation: 72°C, 15 s, 40 cycles. Fluorescence signal was picked up by a SYBR channel. Specificity of the reaction was tested with the curves of temperature dissociation of the resulting amplicons.
To determine BLV microRNA, total RNA was isolated from 1 ml of whole cow blood with ExtractRNA (Eurogen, Russia), following the manufacturer's recommendations. RNA was processed with DNA-se I (≪Thermo Fisher Scientific≫, USA); a first cDNA strand was synthesized with MMLV RT kit (Eurogen, Russia), following the manufacturers' recommendations. Expression of B4 microDNA was analyzed by real-time PCR with 5X ready-to-use mixture qPCRmix-HS (Eurogen, Russia), primers B4- F1: 5′-GGAAAGAACTAACGCTGACG-3′ and B4- R1: 5′-AGGGCGTAAAAAGCGGAAGC-3′, probes TaqMan miR-B4-5p: 5′-(FAM) AAGCGAGAGGCTCTGGTGCTGG-BHQ-1 and miR-B4-3p: 5′-(HEX)TAGCACCACAGTCTCTGCGCCTTT-3′ - BHQ2. PCR was performed in LightCycler 96 (≪Roche≫, Switzerland) at the following conditions: denaturation: 95°C, 10 s, primers annealing: 58°C, 10 s, elongation: 72°C, 15 s, 40 cycles. Fluorescence signal was picked up by FAM and HEX channels. Specificity of PCR was tested by sequencing of resulting 149 b.p.-long amplicons by Sanger.
Gene expression quantification was performed using LightCycler 96 SW1.1 (≪Roche≫, Switzerland) software. Statistical data analysis was implemented with Statistica 6.0 software (≪StatSoft Inc.≫, USA). Differences for Pearson's correlation coefficients were considered being statistically significant for P < 0.05. The tables present means (X) and standard deviation (x).
Results and Discussion
Based on the results of the presence of antibodies (RID+), pro-viral DNA in a genome (BLV+), and leukocytosis, all animals were divided into three groups. The first included the animals without Infection (RID- and without pro-viral DNA BLV – BLV−) in the blood, Control in what follows). The second included infected animals (RID+ and with pro-viral DNA BLV – BLV+) with relatively Low level of Leucocytes, between 6.4 and 17.7 × 10⁹/L (RID+ BLV+_LL, in what follows). The third included infected animals (RID+ BLV+) with very High Leucocyte count, more than 18 × 109/L (RID+ BLV+_HL in what follows). Independently, we also measured BLV-miR-B4 expression in all three groups. Table 1 presents estimated abundance of different leukocyte populations for all three groups. Table 2 presents expression of the genes of pro-viral DNA BLV (gene pol), microRNA BLV (BLV-miR-B4), and genes of microRNA maturation (dc1 ago2) in four groups. For Table 2, we considered all cows with microRNA expression as a separate group, without paying attention to the number of leukocytes. All these cows (9 animals) were RID+ and with pro-viral DNA BLV (RID+ BLV+_miR-B4 column in Table 2).
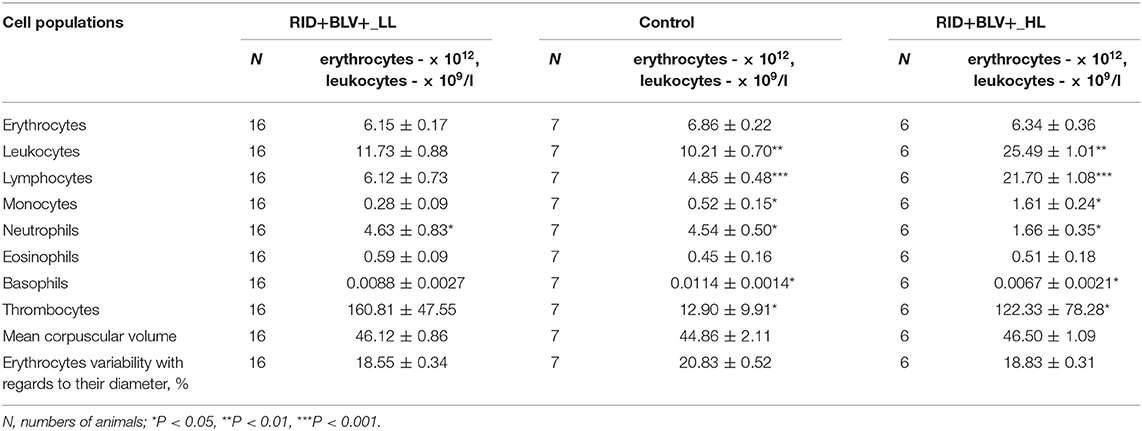
Table 1. Comparative analysis of erythrocyte and leucocyte profiles in peripheral blood of three groups of animals (Control, RID+ BLV+_LL and RID+ BLV+_HL) in the cows of ZAO Mozhayskoe farm ( 1).
1).
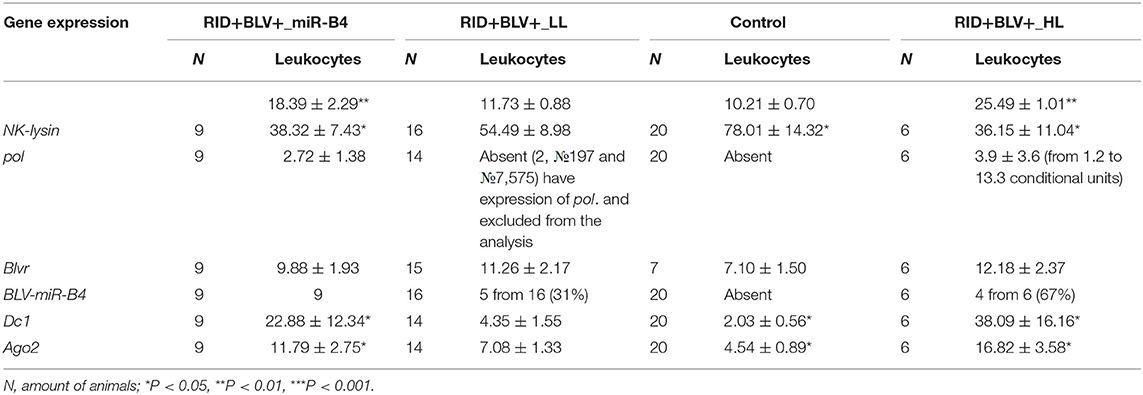
Table 2. Expression of genes NK-lysin, blvr, dc1 and ago2 in peripheral blood of four groups of animals (Control, RID+BLV+_LL, RID+BLV+_HL and animals with BLV-miR-B4 expression, RID+BLV+_miR-B4) in the cows of ZAO Mozhayskoe farm (1).
Agranulocyte and granulocyte components of the leucocyte populations (except eosinophil population) were significantly different between control and BLV-infected groups only for RID+ BLV+_HL and RID+ BLV+_miR-B4 groups (Tables 1, 2). There were no significant differences for erythrocyte component between groups (Table 1).
There were no correlation between pol expression and leukocytosis. Among the animals with relatively low leukocyte count (RID+ BLV+_LL, 16 cows), there were only two animals with detectable pol expression. One of them had relatively low number of leukocytes (7.83 × 10⁹/L) and another one relatively high (17.76 × 10⁹/L). Among the animals with high leukocytosis, the maximum expression of pol gene (13.3 relative expression units) was found for the animal with the average leukocytosis for this group (24.9 × 10⁹/L). Leukocytosis also did not correlate with microRNA expression. The expression was observed for only 9 out of 22 animals (RID+ BLV+_LL, RID+ BLV+_HL groups), with overall highly variable number of leukocytes.
Statistically significant differences in NK-lysin, dc1 and ago2 gene expressions were found only between Control group and RID+ BLV+_HL, RID+ BLV+_miR-B4 groups (Table 2).
Expression of NK-lysin, dc1 and ago2 genes in RID+ BLV+_miR-B4 and RID+ BLV+_HL groups were very similar (NK-lysin 38.32 ± 7.43; dc1 22.88 ± 12.34; ago2 11.79 ± 2.75, respectively). As compared to control, the group with microRNA expression was characterized by underexpression of NK-lysin and overexpression of enzymes, central for microRNA maturation.
In Tables 3–6, we present correlations between various leukocyte populations and gene expression. For Control group (Table 3), there were positive correlations between leukocytes and neutrophils. There were no correlations between different cell populations and dc1 ago2 expression, while gene expressions themselves were significantly correlated (P < 0.5).
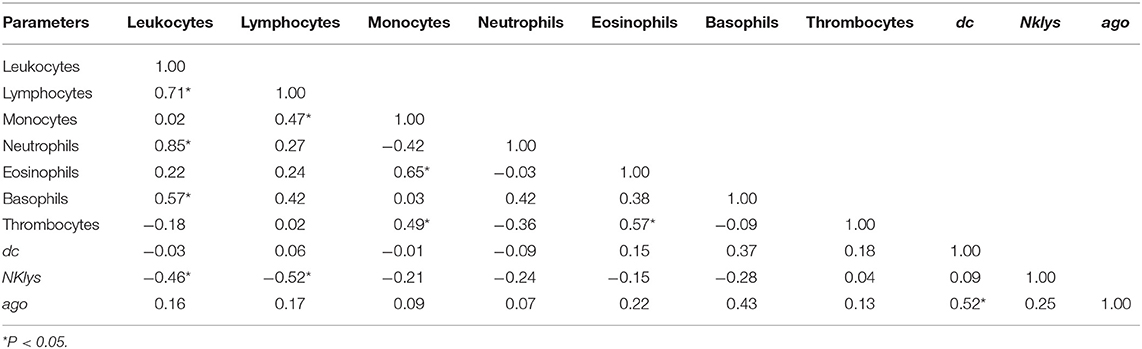
Table 3. Correlations between the number of various agranulocytes, granulocytes, and NK-lysin, dc1 and ago2 expressions in the peripheral blood of infection free cows (RID- and without inserted proviral DNA, Control group) in the cows of ZAO Mozhayskoe farm.
Interestingly, NKlys gene expression was negatively correlated with the number of lymphocytes and leukocytes. That is, the higher was the number of leukocytes and lymphocytes, the lower was NKlys expression, the marker of T and NK-killer cells. It could indicate that in this particular group of animals, immune effector cells were relatively inactive, leading to the increased number of lymphocytes and leukocytes, even without BLV infection (Table 3).
Overall, for the group of infected animals with low leukocyte count (RID+ BLV+_LL), there were not as many significant correlations as in Control group. There were no correlations between dc and ago2 gene expressions, as well as NK-lysin gene expression and the number of lymphocytes and leukocytes (Table 4). Interestingly, for the group of infected animals with high leukocyte numbers (RID+ BLV+_HL), dc1 ago2 gene expressions were also non-correlated (Table 5).
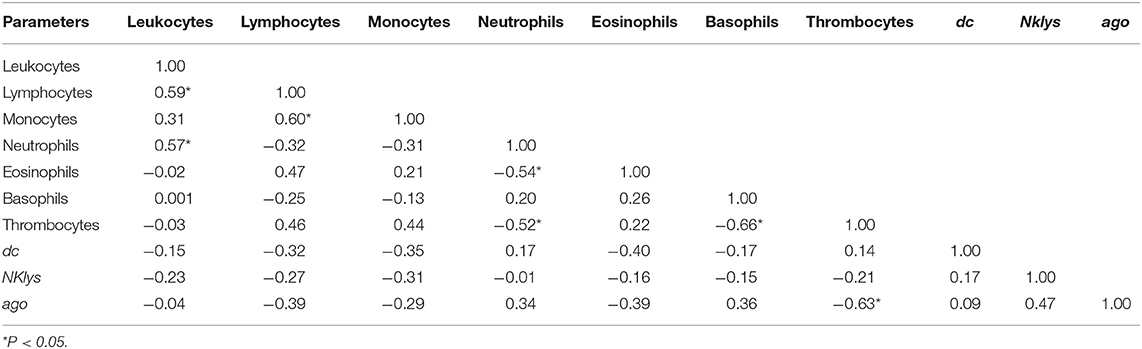
Table 4. Correlations between the number of various agranulocytes, granulocytes and NK-lysin, dc1 and ago2 expressions in the peripheral blood of infected cows with low leukocyte count (RID+BLV+_LL group).
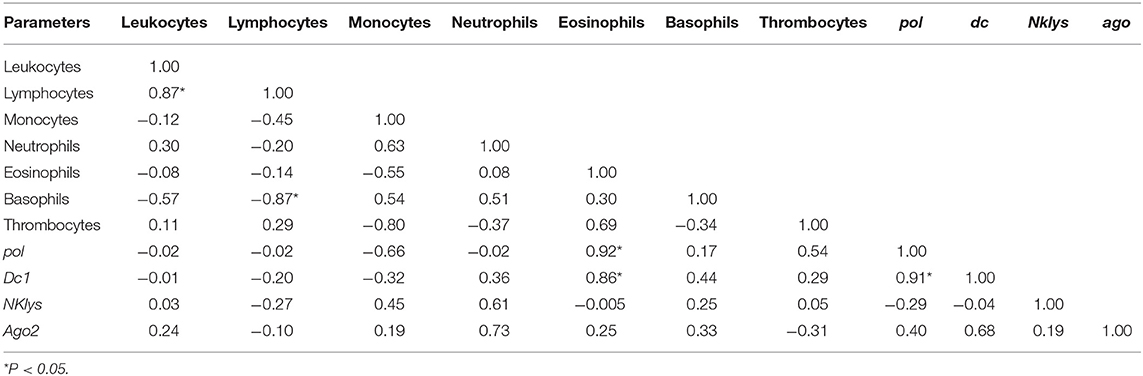
Table 5. Correlations between the number of various agranulocytes, granulocytes and NK-lysin, dc1 and ago2 expressions in the peripheral blood of infected cows with high leukocyte count (RID+BLV+_HL group).
The least amount of significant correlations was observed for the group of infected animals with high leukocyte count (RID+ BLV+_HL). Still, there was positive correlation between the number of leukocytes and lymphocytes and one new positive correlation—between pol and dc1 gene expressions (Table 5).
Interestingly, for 3 out of 9 infected animals with miRNA expression (group RID+ BLV+_miR-B4), we did not observe pol expression, despite the insertion of pro-viral DNA BLV ( 7,687, 384, 7,531).
Table 6 presents the results of correlation analysis for nine infected animals with miRNA expression (group RID+ BLV+_miR-B4).
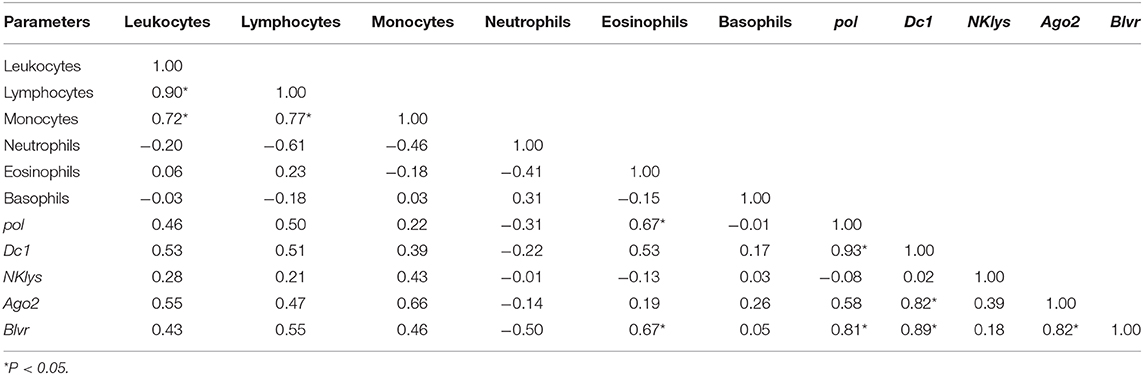
Table 6. Correlations between the number of various agranulocytes, granulocytes and NK-lysin, dc1, and ago2 expressions in the peripheral blood of infected cows with microRNA expression (RID+BLV+, with inserted BLV proviral DNA and microRNA expression, group RID+BLV+_miR-B4.
For this group, statistically significant correlations were observed mostly between pol, dc1 and blvr, between dc1, blvr and Ago2, dc1, and Ago2 gene expression, besides correlation between the number of leukocytes and lymphocytes (Table 6).
In what follows, we briefly discuss the obtained data.
Significant differences in leukocyte populations (agranulocytes, neutrophils, thrombocytes) were observed only between control and infected animals with high leukocyte count (RID+ BLV+_HL group, Table 1). The same trend was observed for basophils and eosinophils; however, their frequencies were low and they were not included in the further analysis.
For two groups of infected animals with different leukocyte counts (RID+ BLV+_HL and RID+ BLV+_LL), expression of BLV microRNA and pol gene was not always correlated. There were animals with and without synchronized expression. The postulated exclusiveness, either proviral BLV DNA transcription or BLV microRNA expression, was not observed in vivo (Table 2). However, the leukocyte counts and Nklys, dc1 and ago2 gene expressions were significantly different between control, infected animals with low leukocyte count on the one hand, and infected animals with high leukocyte count infected animals with BLV microRNA expression on the other hand (Table 2). All groups are not statistically different based on blvr gene expression.
For control group, we found significant positive correlations between the number of leukocytes, lymphocytes, and neutrophils, negative correlations between the number of leukocytes, lymphocytes, and Nklys gene expression, and positive correlations between expressions of two key enzymes for microRNA maturation - dc1 and ago2 (Table 3). That is, the number of cells for adaptive (lymphocytes, leukocytes) and innate (neutrophils) immune responses are positively correlated, the increase of adaptive immune response leads to decrease Nklys gene expression, and key enzymes for microRNA maturation are co-expressed in control group.
For infected animals with low number of leukocytes, we found significant positive correlations between the number of leukocytes, lymphocytes, monocytes, and neutrophils (Table 4). There were no correlations between expressions of two key enzymes for microRNA maturation. Pol gene was expressed in only 2 out of 16 cows in this group; therefore, correlations for this gene were not available (Table 2).
For infected animals with high number of leukocytes, we found significant positive correlations between the number of leukocytes and lymphocytes, as well as between expression of genes pol and dc1 (Table 6). Unlike in control group, in this group of infected animals, there was no significant correlation between dc1 and ago2 gene expressions (Tables 3, 6),
For infected animals with BLV microRNA expression, we found significant positive correlations between the numbers of leukocytes, lymphocytes, monocytes pol and dc1, dc1, and ago2 gene expressions (Table 6). Interestingly, there were also correlations between blvr, pol, dc1, and ago2 gene expressions (Table 6). In our previous studies, blvr gene expression was also increased in BLV infected animals; however, its expression didn't correlate with other features (16). Generally, blvr is highly expressed in juvenile lymphocytes and its expression gradually decreases during terminal differentiation (19).
Conclusion
In conclusion, the data presented here, particularly the apparent absence of BLV DNA expression in pro-leucosis and leucosis cells, where BLV microRNA is expressed, suggest that the BLV infection targets juvenile lymphocytes. In the process of maturation, those lymphocytes are further divided into two groups. One group expresses BLV DNA and another one expresses BLV microRNA that decreases host immune response against cells, expressing BLV proteins.
Data Availability Statement
The datasets generated for this study are available on request to the corresponding author.
Ethics Statement
The animal study was reviewed and approved by Ministry of Agriculture of Russian Federation (directive#183, 04.16.2013 and directive#56, 02.16.2016).
Author Contributions
VG designed the study, administered the oversight of the project, and wrote the original draft. TG and GK performed the sample collection and experiments described. GG and BZ translated the manuscript to English, performed editing, correction, and led the results interpretation and discussion.
Funding
Support was provided in part by the NIH IDeA Networks of Biomedical Research Excellence (INBRE) grant (P20 GM103429) and by Center for Translational Pediatric Research (CTPR) NIH Center of Biomedical Research Excellence award (P20 GM121293).
Conflict of Interest
The authors declare that the research was conducted in the absence of any commercial or financial relationships that could be construed as a potential conflict of interest.
References
1. Rosewick N, Momont M, Durkin K, Takeda H, Caiment F, Cleuter Y, et al. Deep sequencing reveals abundant noncanonical retroviral microRNAs in B-cell leukemia/lymphoma. Proc Natl Acad Sci USA. (2013) 110:2306–11. doi: 10.1073/pnas.1213842110
2. Herbert KM, Nag A. A tale of two RNAs during viral infection: how viruses antagonize mRNAs and small non-coding RNAs in the host cell. Viruses. (2016) 8:154. doi: 10.3390/v8060154
3. Kincaid RP, Burke JM, Sullivan CS. RNA virus microRNA that mimics a B-cell oncomiR. Proc Natl Acad Sci USA. (2012) 109:3077–82. doi: 10.1073/pnas.1116107109
4. Kincaid RP, Chen Y, Cox JE, Rethwilm A, Sullivan CS. Noncanonical microRNA (miRNA) biogenesis gives rise to retroviral mimics of lymphoproliferative and immunosuppressive host miRNAs. MBio. (2014) 5:e00074–14. doi: 10.1128/mBio.00074-14
5. Olive V, Jiang I, He L. mir-17-92, a cluster of miRNAs in the midst of the cancer network. Int J Biochem Cell Biol. (2010) 42:1348–54. doi: 10.1016/j.biocel.2010.03.004
6. Te Pas MF, Madsen O, Calus MP, Smits MA. The importance of endophenotypes to evaluate the relationship between genotype and external phenotype. Int J Mol Sci. (2017) 18:472. doi: 10.3390/ijms18020472
7. Ibeagha-Awemu EM, Zhao X. Epigenetic marks: regulators of livestock phenotypes and conceivable sources of missing variation in livestock improvement programs. Front Genet. (2015) 6:302. doi: 10.3389/fgene.2015.00302
8. Braud M, Magee DA, Park SD, Sonstegard TS, Waters SM, MacHugh DE, et al. Genome-wide microRNA binding site variation between extinct wild aurochs and modern cattle identifies candidate microRNA-regulated domestication genes. Front Genet. (2017) 8:3. doi: 10.3389/fgene.2017.00003
9. Do DN, Li R, Dudemaine PL, Ibeagha-Awemu EM. MicroRNA roles in signalling during lactation: an insight from differential expression, time course and pathway analyses of deep sequence data. Sci Rep. (2017) 7:44605. doi: 10.1038/srep44605
10. Wang D, Liang G, Wang B, Sun H, Liu J, Guan le L. Systematic microRNAome profiling reveals the roles of microRNAs in milk protein metabolism and quality: insights on low-quality forage utilization. Sci Rep. (2016) 6:21194. doi: 10.1038/srep21194
11. Derse D, Casey JW. Two elements in the bovine leukemia virus long terminal repeat that regulate gene expression. Science. (1986) 231:1437–40. doi: 10.1126/science.3006241
12. Rosewick N, Durkin K, Artesi M, Marcais A, Hahaut V, Griebel P, et al. Cis-perturbation of cancer drivers by the HTLV-1/BLV proviruses is an early determinant of leukemogenesis. Nat Commun. (2017) 8:15264. doi: 10.1038/ncomms15264
13. Van Driessche B, Rodari A, Delacourt N, Fauquenoy S, Vanhulle C, Burny A, et al. Characterization of new RNA polymerase III and RNA polymerase II transcriptional promoters in the Bovine Leukemia Virus genome. Sci Rep. (2016) 6:31125. doi: 10.1038/srep31125
14. Gillet NA, Hamaidia M, de Brogniez A, Gutierrez G, Renotte N, Reichert M, et al. Bovine Leukemia Virus small noncoding RNAs are functional elements that regulate replication and contribute to oncogenesis in vivo. PLoS Pathog. (2016) 12:e1005588. doi: 10.1371/journal.ppat.1005588
15. Durkin K, Rosewick N, Artesi M, Hahaut V, Griebel P, Arsic N, et al. Characterization of novel Bovine Leukemia Virus (BLV) antisense transcripts by deep sequencing reveals constitutive expression in tumors and transcriptional interaction with viral microRNAs. Retrovirology. (2016) 13:33. doi: 10.1186/s12977-016-0267-8
16. Kosovskii GY, Glazko VI, Koval'chuk SN, Arkhipova AL, Glazko TT. Expression of NK-lysin, blvr, ifn-a and blood cell populations in cows infected by bovine leukemia virus. Agric Biol. (2016) 52:785–94. doi: 10.15389/agrobiology.2017.4.785eng
17. Abdala A, Alvarez I, Brossel H, Calvinho L, Carignano H, Franco L, et al. BLV: lessons on vaccine development. Retrovirology. (2019) 16:26. doi: 10.1186/s12977-019-0488-8
18. Kosovsky GY, Sotnikova EA, Moudrik NN, Cuong VC, Toan TX, Hoan TX, et al. Diagnostics of leukemia in cattle with the primers to the gag and pol genes. Veterinaria. (2013) 8:58–61. Available online at: http://journalveterinariya.ru
Keywords: microRNA, Bovine Leukemia Virus (BLV), retroviruses, farm animals, leukocytosis
Citation: Kosovsky GY, Glazko VI, Glazko GV, Zybaylov BL and Glazko TT (2020) Leukocytosis and Expression of Bovine Leukemia Virus microRNAs in Cattle. Front. Vet. Sci. 7:272. doi: 10.3389/fvets.2020.00272
Received: 30 January 2020; Accepted: 23 April 2020;
Published: 09 June 2020.
Edited by:
Michael Kogut, Agricultural Research Service, United StatesReviewed by:
Jean-Pierre Frossard, Animal and Plant Health Agency, United KingdomSuresh H. Basagoudanavar, ICAR-Indian Veterinary Research Institute, Bengaluru, India
Copyright © 2020 Kosovsky, Glazko, Glazko, Zybaylov and Glazko. This is an open-access article distributed under the terms of the Creative Commons Attribution License (CC BY). The use, distribution or reproduction in other forums is permitted, provided the original author(s) and the copyright owner(s) are credited and that the original publication in this journal is cited, in accordance with accepted academic practice. No use, distribution or reproduction is permitted which does not comply with these terms.
*Correspondence: Boris L. Zybaylov, Ymx6eWJheWxvdkB1YW1zLmVkdQ==
†ORCID: Gleb Yu. Kosovsky orcid.org/0000-0003-3808-3086
Valery I. Glazko orcid.org/0000-0002-8566-8717
Tatiana T. Glazko orcid.org/0000-0002-3879-6935