 Jiahui Chen
 Jianying Wang1†
 Qin Chen
 Bing Niu
94% of researchers rate our articles as excellent or good
Learn more about the work of our research integrity team to safeguard the quality of each article we publish.
Find out more
ORIGINAL RESEARCH article
Front. Vet. Sci. , 21 January 2020
Sec. Veterinary Infectious Diseases
Volume 6 - 2019 | https://doi.org/10.3389/fvets.2019.00511
Foot-and-mouth disease (FMD) is a highly contagious disease of livestock and seriously affects the development of animal husbandry. It is necessary to defend the spread of FMD. To explore the distribution characteristics and transmission of FMD between 2010 and 2017 in China, Global Moran's I test and Getis-Ord Gi index were used to analyze the spatial cluster. A space-time permutation scan statistic was applied to analyze the spatio-temporal pattern. GIS-based method was employed to create a map representing the distribution pattern, directional trend, and hotspots for each outbreak. The number of cases was defined as the number of animals with FMD for the above analysis. We also constructed a phylogenetic tree to compare the homology and variation of FMD virus (FMDV) to provide a clue for the potential development of an effective vaccine. The results indicated that the FMD outbreaks in China had obvious time patterns and clusters in space and space-time, with the outbreaks concentrated in the first half of each year. The outbreaks of FMD decreased each year from 2010 with an obvious downward trend of hotspots. Spatial analysis revealed that the distribution of FMD outbreaks in 2010, 2015, and 2017 exhibited a clustered pattern. Space-time scanning revealed that the spatio-temporal clusters were centered in Guangdong, Tibet and the junction of Wuhan, Jiangxi, Anhui. Comparison of the spatial analysis and space-time analysis of FMD outbreaks revealed that Guangdong was the same cluster of the two in 2010. In addition, the directional trend analysis indicated that the FMD transmission was oriented northwest-southeast. The findings demonstrated that FMDV in China can be divided into three pedigrees and the homology of these strains is very high while comparing the first FMDV strain with the others. The data provide a basis for the effective monitoring and prevention of FMD, and for the development of an FMD vaccine in China.
Foot-and-mouth disease (FMD) is one of the most contagious diseases of cloven-hoofed animals (1), including cattle, swine, sheep, and goats, as well as many species of wild animals (2). FMD virus (FMDV) is a non-enveloped RNA virus belonging to the genus Aphthovirus of family Picornaviridae (3), which is divided into seven serotypes (A, O, C, Asia 1, SAT1, SAT2, and SAT3) based on their serological relationship (4). Infected animals are characterized by fever, lameness, painful sores in the mouth, and blisters on the tongue, feet, nares, muzzle, and teats. The pain and discomfort from the lesions leads to depression, anorexia, lameness, and reluctance to move, which causes severe losses in animal production (5, 6). FMD impacts on animal production include reduced milk yields, loss of weight in growing animals, and reduced ability to work in terms of cultivation and transporting goods (7). FMD has a high morbidity, which has prompted governments to impose restrictions on the trade of animals locally and internationally.
FMD has been reported in many countries. Outbreaks have been concentrated in Asia, Africa and parts of Europe adjacent to Asia (8). Prior to 1997, countries in eastern Asia, such as Taipei China, Japan, and Republic of Korea, had been free from FMD for decades (9). In China, the outbreak of FMD cases has been declining for the past 8 years. The distribution map of FMD reveals that the outbreaks of FMD were focused in northwest and southeast of China, including Taiwan (29 outbreaks with 2,064 cases), Tibet (26 outbreaks with 1,056 cases), and Xinjiang (19 outbreaks with 1,917 cases) (Figure 1). The large number of cases in these outbreaks of FMD was related to the high population density of susceptible species in these areas. For example, in 2017, the total stock of cattle, sheep, and swine in Xinjiang was 50.9 million, and the total stock of Tibetan cattle, sheep, and swine was 17.4 million.
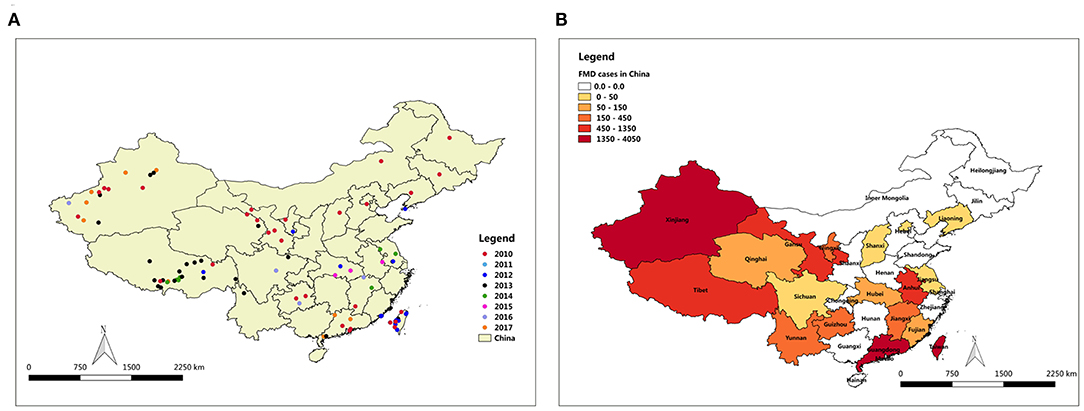
Figure 1. Map of FMD outbreaks in China from 2010 to 2017. (A) FMD affected locality in China, (B) FMD cases degree in all provinces of China.
The characteristics calculated by spatial cluster analysis provide an important basis for the prevention and control for FMD (10). According to OIE reports, geographic areas, and populations at the highest risk are very significant in the battle against infectious diseases (11). In previous studies, spatial statistics analysis as a method is more inclined to combine with other methods to improve the ability of spatial distribution analysis approach and the description of disease dynamics transmission. Getis-Ord Gi statistic and standard deviational ellipse as classical spatial analysis methods are often used for disease hotspots analysis and directional trend identification of disease outbreaks. For example, Ahmet et al. applied local Moran's I and local Getis-Ord Gi *(d) statistics to identify the localities with clusters and hot spots of Hepatitis A abundance in 2001, 2006, and 2011 (12). Ratchaphon et al. utilized standard deviational ellipse to identify the trend of the global diffusion pattern of the affected villages (13).
Space-time permutation model as another common spatial tool was also used in the description of spatial and temporal dynamics changes of FMD outbreaks (14, 15). Abdrakhmanov et al. built a spatio-temporal analysis model to describe and analyze the changes in spatial and temporal dynamics of FMD under different control strategies in the Republic of Kazakhstan from 1955 to 2013 (16). Souley et al. utilized the spatio-temporal patterns of transmission of FMD outbreaks in Niger to improve knowledge on the disease dynamics and factors related to FMD occurrence and conduct an efficient control (17). Jemberu et al. used a retrospective analysis to determine the incidence, distribution, risk factors, and causal serotypes of FMD outbreaks in Ethiopia (18).
In the current study, Global Moran's I test and heat maps were utilized to investigate the distribution characteristics based on the collection of FMD data in China from 2010 to 2017. Space-time permutation scan statistic was applied to analysis spatio-temporal pattern. Furthermore, the monthly trends of FMD outbreaks were obtained by analyzing the prevalence of FMD. A hotspot distribution map representing each outbreak was drawn based on the calculated significance of FMD hotspots. Directional distribution analysis were performed to depict the directional trend of FMD outbreaks and to find out the direction of disease transmission.
These findings provide valuable information for monitor, prevention and control, and of FMD. After analyzing the distribution characteristics and transmission routes of FMD in China, a phylogenetic tree was constructed to analyze the homology and variation of FMDV genomes. This data will help in the development of an effective FMD vaccine.
FMD data including affected animal species and the number of cases, as well as the geographical location of the epidemic regions, were collected from Global Animal Disease Information System (EMPRES) in Food and Agriculture Organization of the United Nations (FAO) (http://empres-i.fao.org/eipws3g/#h=0, 2019). A case is the number of animals suffering from FMD. The number of cases at the same geographical location is considered as an outbreak point, with the same outbreak ID in EMPRES. EMPRES-i organizes all available epidemiological data on specific animal disease events as comprehensive records and assigns individual event identifiers (id).
SDE is a spatial statistical tool that is generally used to depict the directional trend of the geographical features of the spatial distribution (19). Working operation of SDE has been described in detail in ArcGIS Help 10.1 and Wang et al. (20, 21).
Hotspots analysis is valuable for identifying spatial clusters. The analysis uses the Getis-Ord Gi statistics to detect the statistically significant high values (hot spots) and low values (cold spots). Hotspots are spatial clusters with high correlation within a specified distance of the entire research area identified by the Getis-Ord Gi statistics. Hotspot detection is sensitive when clustering local spatial events if there is no significant global spatial clustering (22). Getis-Ord Gi* statistics was calculated to test statistical significance of spatial clustering patterns like hot spots, random spots, and cold spots over the entire study area. Getis-Ord Gi* statistics formula refers to the method of Ord et al. (23). The window width was enforced to determine the boundaries of the hot and cold spots in the spatial clusters.
Global Moran's I statistic as a spatial-correlation statistic was used to assess the presence of significant spatial autocorrelation and find the characteristics of the global pattern (clustered, dispersed, random) of FMD (24, 25). Moran's I Index varies between +1 to −1, a positive value (Moran's I Index > 0) indicates the presence of positive correlation in spatial distribution, while a negative value (Moran's I Index < 0) indicates presence of negative correlation in the spatial distribution. The larger the Moran's I Index value, the more obvious of positive correlation. When Moran's I Index = 0 indicates a random spatial distribution (26). The Moran's I formula refers to Guo et al. (27).
To identify the spatio-temporal clusters of FMD outbreaks, a retrospective permutation space-time scan model was developed in the SaTScan environment. The method was applied by building a space-time cylinder to scan the study area by placing a number of circles (spatial windows). The radius at the bottom of cylinder represents geographic position and size of cluster area. The height of cylinder denotes time of outbreaks (28). As the constant changes of radius and time, spatial window is in dynamic changing, and counting the number of positive and/or negative events occurring (29).
Thirty-one registered FMDV genome sequences were obtained from GenBank. The phylogenetic tree of FMDV was constructed by the Neighbor-Joining method and the Kimura 2-parameter model of MEGA6 software. The Boot-strap validation complex is 1,000, and the branch of phylogenetic tree whose Boot-strap value is more than 70% is considered high reliability (30, 31).
The monthly reported cases and FMD outbreaks of China from 2010 to 2017 are summarized in Figure 2 and Table 1. The FMD outbreaks gradually decreased. The frequency of outbreaks and cases of FMD before 2010 to 2013 are higher than 2014 to 2017. Except for September, August, October, and November, the number of cases in other months reached more than 500. The highest peaks of infections per year occurred in different months and FMD outbreaks were concentrated in the first half of the year. February, April and December were the peak months of FMD outbreaks, in which there were 17, 16, and 6 outbreaks, respectively. The respective number of cases was 4,273 (P < 0.001), 2,355 (P < 0.001), and 1,047 (P < 0.001).
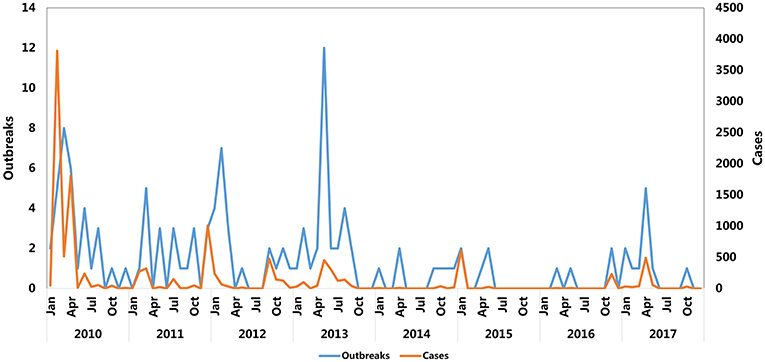
Figure 2. Trend of monthly FMD cases from 2010 to 2017.
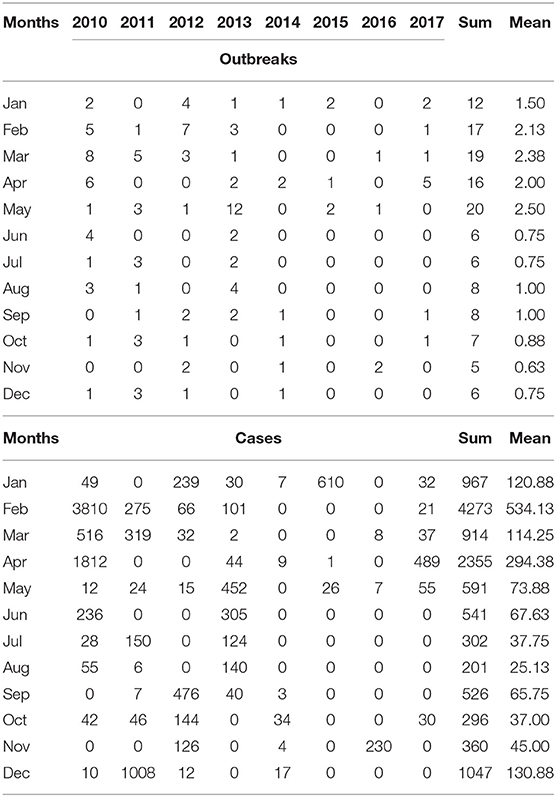
Table 1. Monthly FMD outbreaks and cases from 2010 to 2017.
FMD outbreaks occurred in several provinces of China during 2010 to 2017. To further explore the annual FMD cases density of various provinces in China, a FMD cases density map was constructed by analyzing the relationship between annual FMD cases and affected localities (Figure 3). FMD was concentrated in the northwest region and Taiwan province of China from 2010 to 2017. Surprisingly, Xinjiang experienced FMD almost every year, except 2012, 2014, and 2015. Even in 2010, there were 5 outbreaks with 912 cases of FMD in Xinjiang. In 2013, 16 outbreaks with 669 cases of FMD were reported in Tibet. In addition, FMD appeared in Taiwan for 4 years from 2010 to 2013. In 2011, there were 12 outbreaks of FMD in Taiwan with 1215 cases reported. In 2010, FMD outbreaks in Guangdong and Hong Kong were more serious, with 1,543 and 2,330 cases, respectively.
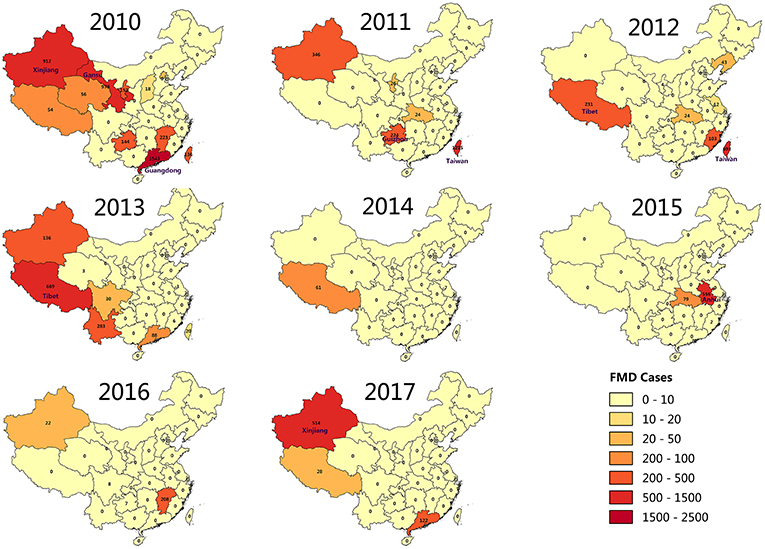
Figure 3. FMD cases in china, annually from 2010 to 2017.
After conducting FMD hotspots analysis on Getis-Ord Gi, a map representing the significance of FMD outbreaks hotspots was prepared (Figure 4). The red dot and blue dot were represented hotspot (high FMD outbreaks clustered) and coldspot (low FMD outbreaks clustered), respectively, and gray dot indicate there was no significance of this dot. It can be found that FMD hotspots were dominantly clustered in Guizhou (2010), Ningxia (2011, 2012), Liaoning (2011), and Tibet (2013). In 2010 and 2012, there were significant hotspots with 99% confidence (P = 0.01) located in Guizhou and Liaoning, respectively. In 2017, there was a cold spot with 99% confidence of an FMD outbreak in Tibet.
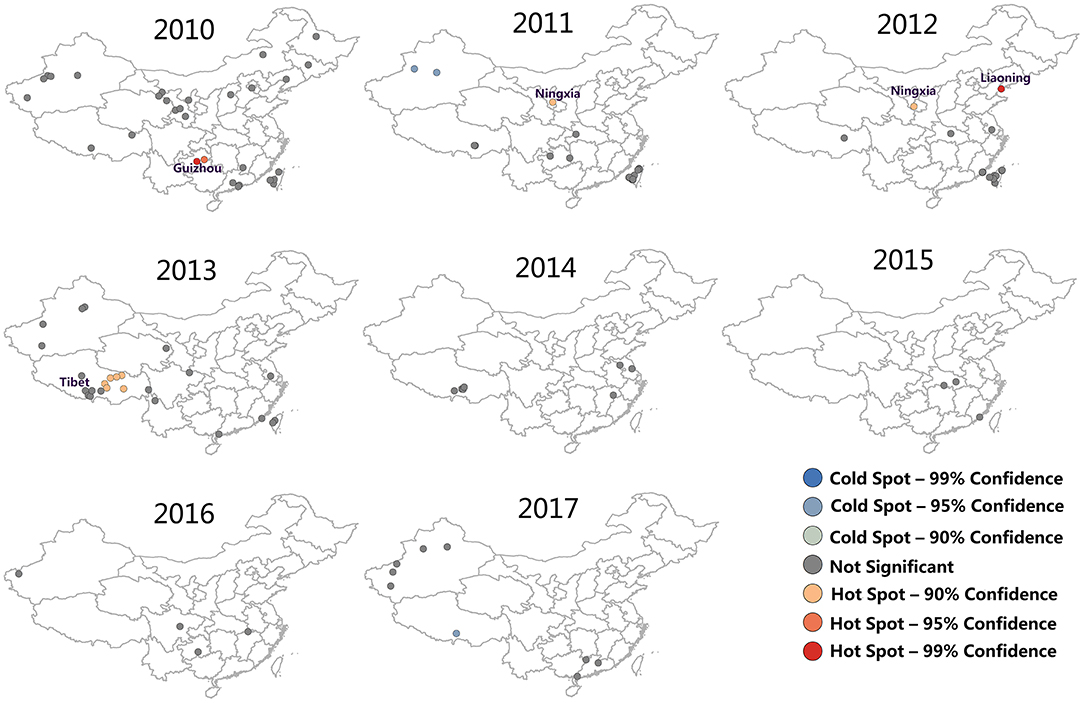
Figure 4. FMD hotspot development from 2010 to 2017. The red dot were represented hotspot (high FMD outbreaks clustered), the blue dot were represented coldspot (low FMD outbreaks clustered), and the gray dot indicate there was no significance of this dot.
In addition, the trend of affected localities, FMD cases and hotspots were shown in Figure 5. The results showed that the trends of the three types of data are very similar, which means there may be a correlation between hotspots trend of FMD and the actual outbreak situation. Hotspots increased from 2010 to 2013, and reached the peak in 2013 (6 hotspots in Tibet). There were fewer hotspots in 2013 with an ultimate decline to zero. The results indicated that the outbreaks of FMD decreased each year and that FMD hotspot analysis was instructive for the determination of the spatial distribution of FMD outbreaks.
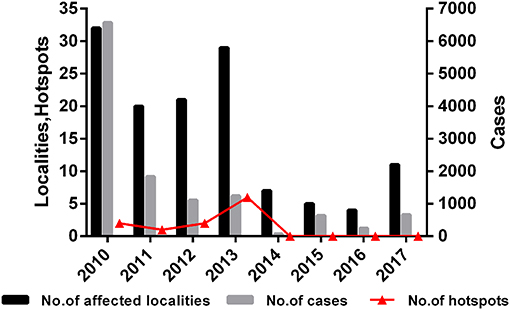
Figure 5. Number of affected localities, number of cases, and number of hotspots in China during 2010–2017.
Moran's I index is commonly used in spatial cluster analyses, which can represent a significant spatial auto-correlation of a study area. Here, Moran's I index significance test of FMD from 2010 to 2017 was calculated by the spatial autocorrelation statistical model. Moran's I index in 2010, 2015, and 2017 were positive (Moran's I index > 0) that exhibited a clustered tendency in spatial pattern (Table 2). In 2010, the Moran's I = 0.51, Z-score was 4.70 (≥1.96), which showed strong positive correlation in the spatial pattern. The probability of randomly generating a clustering pattern were less than 0.01 (P < 0.01) in 2010, probability in 2015 and 2017 were less than 0.1(P < 0.1) and 0.05 (P < 0.5) respectively. As there is no significant difference between the distribution patterns of FMD outbreaks and random patterns (in 2011–2014 and 2016), it could be regarded as a relatively unstable random distribution. Cumulative data from 2010 to 2017 showed that the spatial pattern of FMD outbreaks was significantly clustered. Hotspot analysis was used to further analyze the spatial clustering of FMD in China. A local spatial autocorrelation (LISA) cluster map showed high-high cluster points were located in Guangdong in 2010 and Xinjiang in 2017. However, there was no FMD cluster in 2015 (Figure 6). To explore whether the high-high spatial clusters were consistent with the high intensities of FMD cases in real outbreaks, FMD heat map of cluster year was created (Figure 7). The dot of heat map indicates relative intensities of FMD clusters. Outermost (yellow), middle (orange), and innermost layer (dark red) represented low, medium and high intensity FMD outbreaks, respectively. FMD outbreak clusters in the heat map and the LISA map were nearly superimposable in their positions. Especially, the high intensities of FMD cases dominantly clustered in Xinjiang, Qinghai, Tibet, Taiwan, and Guangdong.
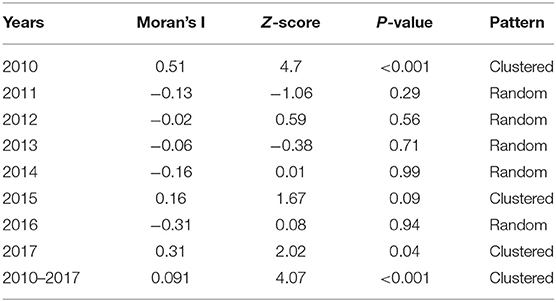
Table 2. Global spatial autocorrelation analysis of FMD cases in China from 2010 to 2017.
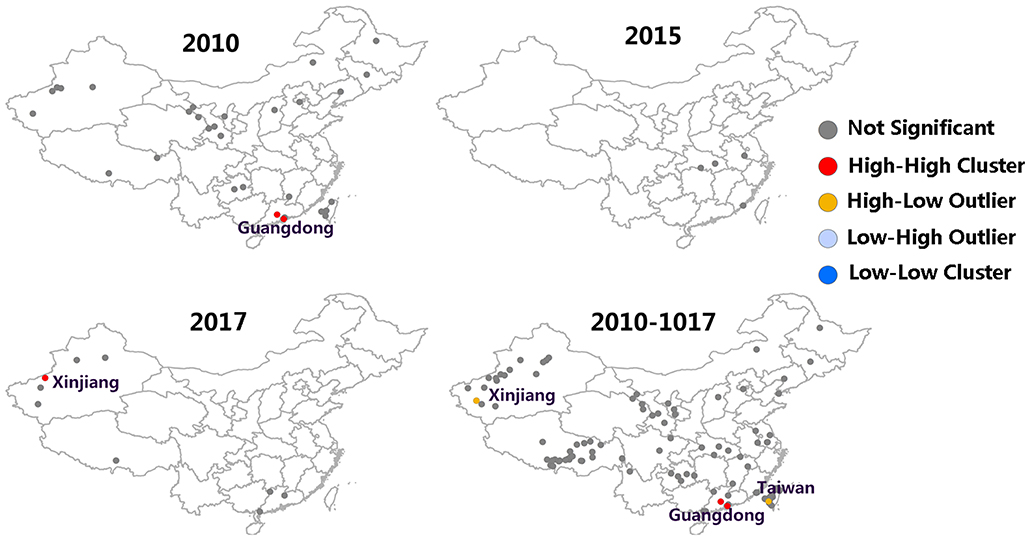
Figure 6. LISA cluster map of FMD in China.
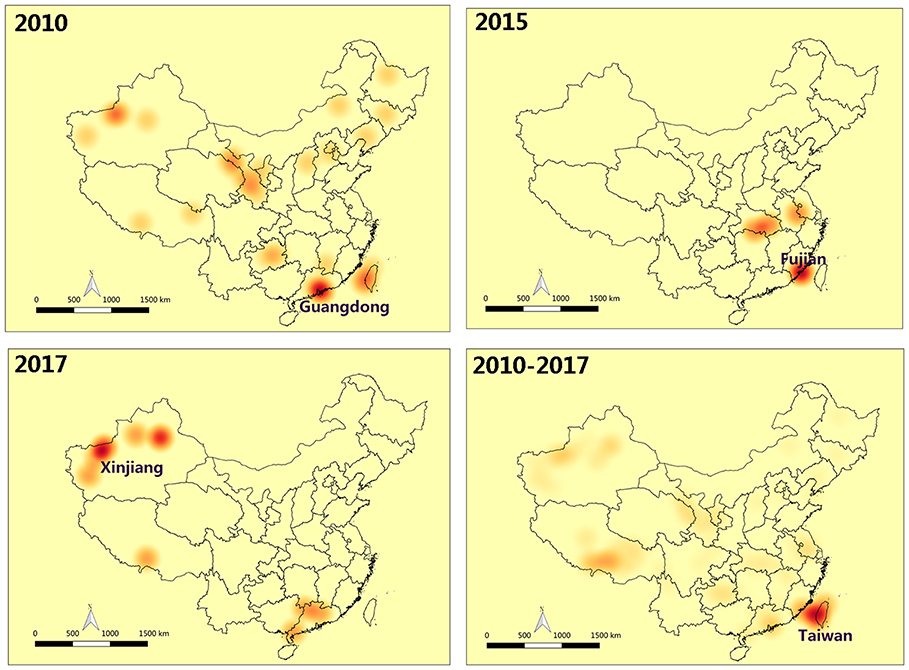
Figure 7. Heat map of FMD clusters in China. The dot of heat map indicates relative intensities of FMD clusters. Outermost (yellow): The low intensity of FMD outbreaks, middle (orange): The medium intensity of FMD outbreaks, innermost layer (dark red): The high intensity of FMD outbreaks.
At the same time, the distribution of FMD in China and its spatial and temporal effects were analyzed using the spatio-temporal scanning model. The space-time cluster data are shown in Figure 8 and Table 3. There were a total of 129 localities with 12,373 FMD cases contained in China identified as certain infection sources for the animals. The scan test identified three significant spatio-temporal clusters of FMD outbreaks (P < 0.001). The first was in Guangdong province with three localities. The center of the second cluster covered Wuhan, Jiangxi, and Anhui provinces with six FMD localities. The third and biggest cluster was located in Tibet, with 28 affected localities and a space-time cluster from 19 February 2013 to 15 December 2015, with 1,025 observed FMD cases.
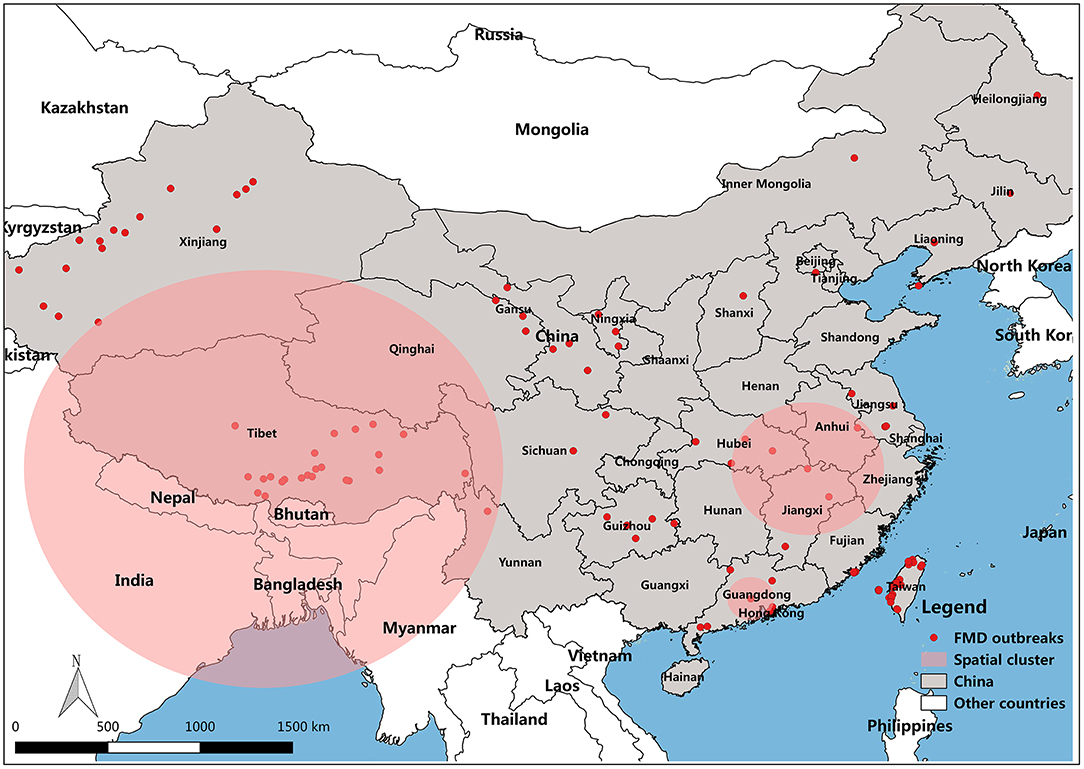
Figure 8. Geographical localization of FMD clusters in China.
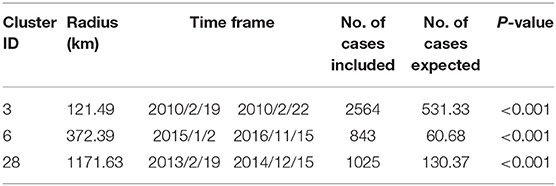
Table 3. Characteristics of FMD clusters.
To study the transmission and spread of FMD in China from 2010 to 2017, SDE was utilized to analyze the directional trend of FMD. The data for the SDE and distribution of epidemic regions caused by FMD are presented in Figure 9. The overall direction of FMD transmission was northwest. The rotation angle was maintained within range of 102.03–118.42, except for large-scale changes in 2014 and 2015, and the spatial pattern of FMD outbreaks displayed an overall northwest-southeast distribution (Table 4). The decreased rotation angle in 2012 and 2016 was manifest as a weakened northwest-southeast pattern. In 2013 and 2017, the rotation angle was increased to ~117°, which further strengthened the northwest-southeast spatial pattern. Considering 2010 as the starting point, the movement of mean center was southeast-southeast-northwest-northeast-southwest-southeast-northwest.
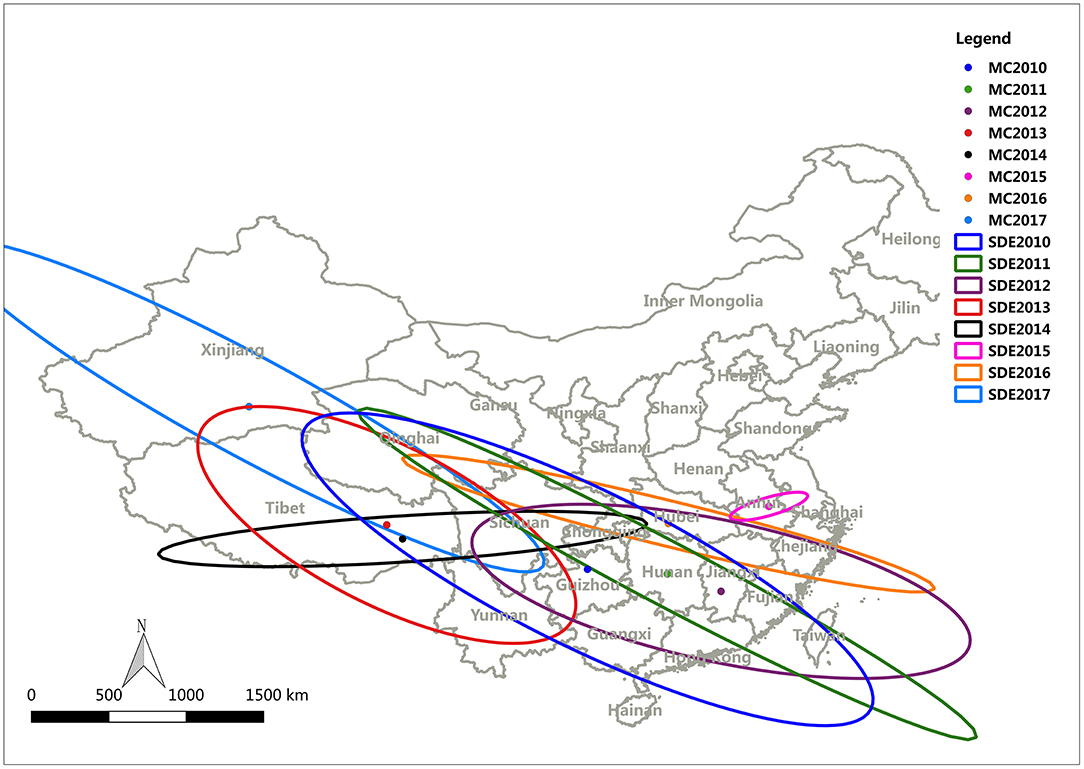
Figure 9. FMD mean center and standard deviational ellipse from 2003 to 2012.
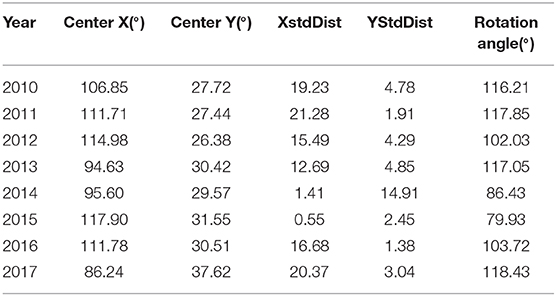
Table 4. The attributed values for the standard deviational ellipse.
The branches of a phylogenetic tree represent the genetic relationship, and the distance of the branches reveals, to a certain degree, the evolutionary relationships of the viral strains. The number between the branches of the phylogenetic tree indicates the reliability of the homology and the length of the branch indicates the degree of variation. The present phylogenetic tree divided FMDV in China into three pedigrees. The boot-strap of nearly all strain branches reached 100, indicating that the homology of these strains was very high (Figure 10). DQ533483.2 (Asia 1), AY390432.1 (Asia1), and AF511039.1 (O) were the earliest FMDV strain in China, appearing in 1958 according to NCBI data (Table S1). Homology analysis showed that the homology of these three FMDV strains with other strains ranged from 81 to 99%. There was high homology of the gene sequence between DQ533483.2 and AY390432.1, and the identity of these two strains was 98% by BLAST analysis of NCBI data. However, the identity between DQ533483.2 and AF511039.1 was 85%, which was the same as the result obtained by BLAST of AY390432.1 and AF511039.1. HQ412603.1 (2000, O) was identified as the virus variant for DQ533483.2 and AY390432.1, with 81.34 and 81.05% identity, respectively. For AF511039.1, AY686687.1 (2001, O) was the variant, and the identity between the two strains was 85.28%. The results show that 31 strains in China were in a high homology.
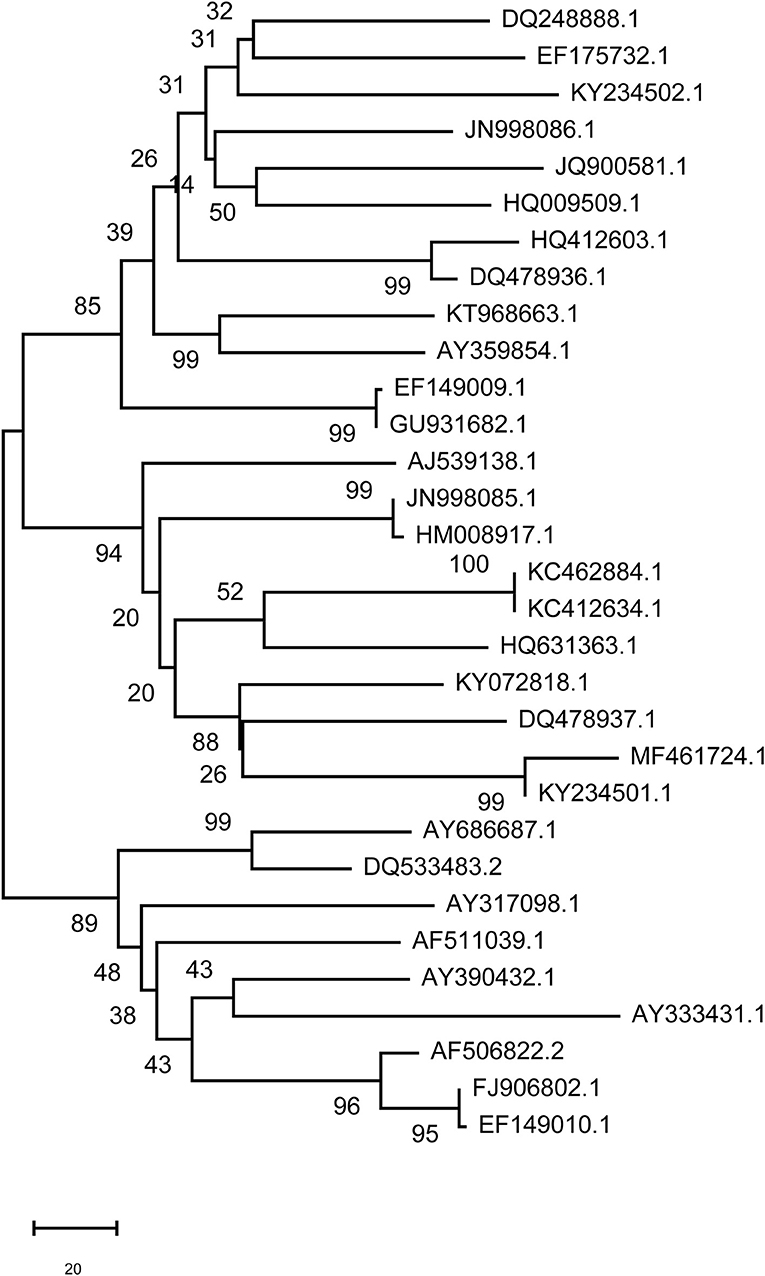
Figure 10. Phylogenetic analysis of FMDV genomes. N, not available.
FMD is an acute and highly contagious disease. Despite intensive control and prevention efforts, FMD is still endemic and occurs extensively in many regions of the world (3, 32). In China, FMD was first reported in 1958 with three types found in Xinjiang Uygur Autonomous Region (serotypes O and A) and Yunnan province (serotype Asia 1) (33–35). Despite low mortality rates, 129 outbreaks of FMD have occurred in China since 2010 (36). With a goal of preventing the spread of FMD in the next few years using effective precautionary measures (37), it is important to describe and analyze spatial and temporal dynamics changes in FMD outbreaks.
Here, we explored the time distribution pattern of FMD outbreaks in China, and found obvious time patterns. The data highlight the importance of strengthening the surveillance of FMD outbreaks in the first half of the warm and rainy season. In China, FMD outbreaks have occurred in many provinces due to the weak centralized management of farms. The characteristics of spatial cluster analysis provide an effective way to identify the regions at risk (38). The spatial analysis indicated that the focus of prevention and control of FMD in China should be on Guangdong and Xinjiang provinces. The calculations of the spatial cluster and prevalence analyses were not comprehensive (39). As the methods of risk analysis have varied over space and time, retrospective permutation space-time scan statistics to provide complementary information are important and overcome the weaknesses of using single method (40, 41). Space-time analysis based on the number of cases and the geographical location of the epidemic regions revealed that the cluster patterns in Guangdong were significant between 19th and 22nd February, 2010.
FMD prevalence analysis revealed that FMD outbreaks were concentrated in the first half of the year. It seems likely that the warm and rainy weather in the spring and summer in most provinces of China is suitable for the spread of pathogenic microorganisms, including FMDV, while cold weather would inhibit FMDV replication and thus curb the spread of FMDV (42). However, Figure 2 and Table 1 show that the number of FMD cases in February and December reached 4,273 and 1,047, respectively. The affected localities in the FMD outbreak during February and December were mainly concentrated in Taiwan, Fujian, and Guangdong. Coastal cities in these regions experience a humid subtropical monsoon climate, characterized by a warm winter and hot summer. Even in the winter, FMDV spread in these areas would occur. However, other provinces, such as Xinjiang and Jiangsu, also experienced FMD outbreaks in winter. We surmise that the winter-related food shortage and lack of sunlight could reduce animal immunity (18, 43–45), contributing to FMDV transmission and increased risk of infection. In addition, the map of FMD cases (Figure 3) in the FMD prevalence analysis showed that Xinjiang and Tibet were the two provinces in China with a high frequency of FMD outbreaks. Frequent of outbreaks is considered that infectious animals in these two provinces are free-range, the relatively immune system is weak, and the prevention and control measures are insufficient.
The hotspots map constructed identified significant risk areas in each period. Further investigations in these areas would be worthwhile (46). In the affected localities, FMD cases and hotspots were similar, which indicates that the FMD hotspots reflect actual FMD outbreaks. In addition, the results of hotspots analysis are valuable for the surveillance and prevention of FMD, especially concerning immunization coverage (47, 48). FMD outbreaks reflect inadequate vaccine quality or implementation. Since the outbreak of FMD in 2010, the Ministry of Agriculture and Rural Affairs of China has implemented a system of immunization planning to provide compulsory immunization against FMD in the country. Based on different subtypes, FMDV animals were vaccinated with different vaccines (http://www.moa.gov.cn/gk/tzgg_1/tfw/201006/t20100606_1535849.htm). In Tibet, as an example, there were six hotspots in 2013. The outbreak and spreading of FMD in 2013 spurred measures to isolate infected areas. Disinfection, culling and non-harmful disposal of animals were jointly performed by the Ministry and the Tibet Autonomous Region government. In addition, Tibet initiated full coverage of compulsory immunization against major animal epidemics in 2014. Veterinary agencies in Tibet Autonomous Region have carried out supervision and guidance on the prevention and control of major animal epidemics in counties (cities and districts), and strengthened comprehensive measures for prevention and control of major animal epidemics (http://www.tibet.cn/cn/Instant/domestic/201811/t20181127_6423052.html).
After implementing quality standard improvement of FMD vaccine by the Ministry of Agriculture and Rural Affairs of China in 2013, no FMD hotspots were subsequently observed (Figure 4). In addition, among the common FMDV vaccines, including the O/Asia1/A serotypes trivalent inactivated vaccine, the O strain was selected from the most compatible strain, 0/MYA98/BY/2010. The Asia 1 strain used the classic Jiangsu strain, Asia1/JSL/ZK/06, and the type A strain used the Re-A/WH/09 strain.
Spatio-temporal analysis is an important tool to monitor changes of FMD epidemiology, identify high-risk regions and strengthen disease surveillance (49). In this study, Global Moran's I was established to describe global spatial autocorrelations. The spatial pattern of FMD outbreaks was significantly clustered. However, this approach is useless in identifying the exact location of clustered spatial patterns (50). Fortunately, the emergence of the LISA cluster map solved this problem. The high-high aggregation points of FMD outbreak from the LISA cluster map are consistent with the heat-dense points of FMD outbreaks from the heat map, which is located in Guangdong (2010) and Xinjiang (2017). The LISA cluster map revealed the absence of FMD clusters in 2015. However, in heat map, the Guangdong area remained a hot-dense point in which strengthened FMD prevention efforts were required. In space-time scan statistics, clusters center were found in Guangdong, Tibet and the junction of Wuhan, Jiangxi and Anhui. After comparing the spatial analysis and space-time analysis of FMD outbreaks, Guangdong was revealed to have the same cluster of the two. The spatial distribution pattern could determine if FMD outbreaks in Guangdong were a cluster distribution. In the spatio-temporal cluster analysis, the cluster in Guangdong was evident from 19th to 22nd February, 2010. The result of this spatial cluster may be due to problems in prevention and control measures, a temperature that was suitable for virus transmission during that time or other factors. The space-time cluster increases the accuracy of the regional division in the FMD surveillance zone. This allows other counties to establish an early warning system for the disease and reduce the loss of livestock husbandry.
The direction of the spread of FMD is another important factor as it provides a general direction for the integrated surveillance of FMD outbreaks and emphasizes defensive measures for the specific location of these clusters in the route of FMD outbreaks. SDE is a spatial statistical tool that is often utilized to depict the directional trend of the transmission and spread of disease. In this study, the change of the SDE rotation angle indicated that the spatial pattern of FMD outbreaks had a northwest-southeast distribution. In addition, almost all mean centers were located on or below the diagonal line between Tibet and Shanghai (northwest-southeast diagonal line), indicating that the cities where the average centers were located had a very important impact on the transmission of FMDV.
After analyzing distribution characteristics and transmission of FMD in China, a phylogenetic tree was constructed to analyze the homology and variation of FMDV genomes. We tried to discover the relationship between the homology and variation of FMDV genomes and an effective vaccine to control the spread of FMDV. The movement of the mean center of FMD revealed that most of the mean centers was located in the subtropical area south of the Huaihe River, except for Tibet, Xinjiang and Qinghai. Prevalence analysis showed that FMD outbreaks was focused on the first half year and most of the time in subtropical China was in a warm climate with sufficient rainfall and suitable temperature for the reproduction of pathogens. The mean centers moved back and forth along the northwest-southeast diagonal (Figure 9). Tibet, Xinjiang and Qinghai are in plateau areas with advanced grassland animal husbandry. The temperature and humidity in these regions are not conducive to FMDV reproduction, even though they are high outbreak areas of FMD. It might be that most of local residents in these provinces are nomads, cattle and sheep are in free-grazing, the immune system is weak, and the prevention and control measures are insufficient. There is always a risk of FMD outbreaks in these provinces of China, and measures to prevent and control FMD are needed.
There are many serotypes of FMDV, and the virus constantly mutates among different strains due to the high variation of serotype. In addition, FMDV vaccines do not provide excellent all-around protection against virus, since there are multiple routes of FMDV transmission along with low immunogenicity. A phylogenetic tree was constructed to study the prevalent status and the feature of gene subtype of FMDV strain and to prevent pandemic occurrence caused by varied FMDV strain variation in China. The homology and variation of the FMDV genome deduced from the phylogenetic tree will be helpful for the development of an effective vaccine. The phylogenetic analysis of the FMDV genome revealed HQ412603.1 (2000, O) and AY686687.1 (2001, O) as two virus variants for the three earliest FMDV strains that appeared in China in 1958. The study of FMDV, however, requires a long time and huge investment.
This study analyzed FMD outbreaks and their spatio-temporal patterns in China from 2010 to 2017. As discovered by a directional trend analysis, the FMD outbreaks were oriented northwest-southeast. The trends of outbreaks and hotspots showed a decreasing trend from 2010 to 2017. To prevent the spread of FMD in this direction, more effective prevention and control measures should be taken before onset of the highly prevalent epidemic season. Analyses of spatial and space-time scan statistics revealed the 2010 FMD outbreaks from Guangdong as the most significant cluster. This type of analysis helps regulatory agencies to adopt timely defensive measures and establish a disease warning system to reduce the loss of livestock in response to specific locations of FMD outbreaks. FMDV in China can be divided into three pedigrees and the homology of these strains is very high. This provides clues for the development of FMD vaccines. In the future, a systematic post-vaccination sero-monitoring program can be developed based on FAO/EuFMD, to monitor sero-conversion and protective status.
Publicly available datasets were analyzed in this study. This data can be found here: http://empres-i.fao.org/eipws3g/#h=0.
BN and QC designed the study. YL, JW, and JC collected the data. BN, QC, MW, RL, QZ, and JC analyzed the data. All authors took part in interpreting the data and writing the manuscript.
The present study was supported by The National Key Research and Development Program of China (Grant No. 2016YFD0501101) and High Performance Computing Center Program of Shanghai University.
The authors declare that the research was conducted in the absence of any commercial or financial relationships that could be construed as a potential conflict of interest.
The authors would like to thank Dr. Dev Sooranna, Imperial College London, for editing the manuscript. The authors wish to thank the two reviewers, whose constructive comments are very helpful for strengthening the presentation of this paper.
The Supplementary Material for this article can be found online at: https://www.frontiersin.org/articles/10.3389/fvets.2019.00511/full#supplementary-material
Table S1. Foot-and-mouth disease virus strain information.
1. Grubman MJ, Baxt B. Foot-and-mouth disease. Clin Microbiol Rev. (2004) 17:465–93. doi: 10.1128/CMR.17.2.465-493.2004
2. Anderson E, Foggin C, Atkinson M, Sorensen K, Madekurozva R, Nqindi J. The role of wild animals, other than buffalo, in the current epidemiology of foot-and-mouth disease in Zimbabwe. Epidemiol Infect. (1993) 111:559–64. doi: 10.1017/S0950268800057289
3. Domingo E, Escarmis C, Baranowski E, Ruiz-Jarabo CM, Carrillo E, Núñez JI, et al. Evolution of foot-and-mouth disease virus. Virus Res. (2003) 91:47–63. doi: 10.1016/S0168-1702(02)00259-9
4. Knowles N, Samuel A. Molecular epidemiology of foot-and-mouth disease virus. Virus Res. (2003) 91:65–80. doi: 10.1016/S0168-1702(02)00260-5
5. Meyer RF, Knudsen RC. Foot-and-mouth disease: a review of the virus and the symptoms. J Environ Health. (2001) 64:21.
6. Ding Y-Z, Chen H-T, Zhang J, Zhou J-H, Ma L-N, Zhang L, et al. An overview of control strategy and diagnostic technology for foot-and-mouth disease in China. Virol J. (2013) 10:78. doi: 10.1186/1743-422X-10-78
7. James AD, Rushton J. The economics of foot and mouth disease. Rev Sci Tech. (2002) 21:637–41. doi: 10.20506/rst.21.3.1356
8. Sumption K, Rweyemamu M, Wint W. Incidence and distribution of foot-and-mouth disease in Asia, Africa and South America; combining expert opinion, official disease information and livestock populations to assist risk assessment. Transbound Emerg Dis. (2008) 55:5–13. doi: 10.1111/j.1865-1682.2007.01017.x
9. Sakamoto K, Yoshida K. Recent outbreaks of foot and mouth disease in countries of east Asia. Rev Sci Tech. (2002) 21:459–61. doi: 10.20506/rst.21.3.1347
10. Zhu B, Fu Y, Liu J, Mao Y. Spatial distribution of 12 class B notifiable infectious diseases in China: A retrospective study. PLoS ONE. (2018) 13:e0195568. doi: 10.1371/journal.pone.0195568
11. OIE. Foot and Mouth Disease (FMD). (2019). Available online at: https://www.oie.int/en/animal-health-in-the-world/official-disease-status/fmd/en-fmd-carte/
12. Dogru AO, David RM, Ulugtekin N, Goksel C, Seker DZ, Sözen S. GIS based spatial pattern analysis: children with Hepatitis A in Turkey. Environ Res. (2017) 156:349–57. doi: 10.1016/j.envres.2017.04.001
14. Samphutthanon R, Tripathi NK, Ninsawat S, Duboz R. Spatio-temporal distribution and hotspots of hand, foot and mouth disease (HFMD) in northern Thailand. Int J Environ Res Public Health. (2013) 11:312–36. doi: 10.3390/ijerph110100312
15. Kulldorff M, Heffernan R, Hartman J, Assunçao R, Mostashari F. A space–time permutation scan statistic for disease outbreak detection. PLoS Med. (2005) 2:e59. doi: 10.1371/journal.pmed.0020059
16. Liu Y, Wang X, Liu Y, Sun D, Ding S, Zhang B, et al. Detecting spatial-temporal clusters of HFMD from 2007 to 2011 in Shandong Province, China. PLoS ONE. (2013) 8:e63447. doi: 10.1371/journal.pone.0063447
17. Abdrakhmanov S, Tyulegenov S, Korennoy F, Sultanov A, Sytnik I, Beisembaev K, et al. Spatiotemporal analysis of foot-and-mouth disease outbreaks in the Republic of Kazakhstan, 1955–2013. Transbound Emerg Dis. (2018) 65:1235–45. doi: 10.1111/tbed.12864
18. Souley Kouato B, Thys E, Renault V, Abatih E, Marichatou H, Issa S, et al. Spatio-temporal patterns of foot-and-mouth disease transmission in cattle between 2007 and 2015 and quantitative assessment of the economic impact of the disease in Niger. Transbound Emerg Dis. (2018) 65:1049–66. doi: 10.1111/tbed.12845
19. Jemberu W, Mourits M, Sahle M, Siraw B, Vernooij J, Hogeveen H. Epidemiology of foot and mouth disease in ethiopia: a retrospective analysis of district level outbreaks, 2007–2012. Transbound Emerg Dis. (2016) 63:e246–59. doi: 10.1111/tbed.12338
20. Ghasemi K, Hamzenejad M, Meshkini A. The spatial analysis of the livability of 22 districts of Tehran Metropolis using multi-criteria decision making approaches. Sustain Cities Soc. (2018) 38:382–404. doi: 10.1016/j.scs.2018.01.018
21. ArcGIS. How Directional Distribution (Standard Deviational Ellipse) Works. (2015). Available online at: http://resources.arcgis.com/en/help/main/10.1/index.html#/How_Directional_Distribution_Standard_Deviational_Ellipse_works/005p0000001q000000/
22. Wang B, Shi WZ, Miao ZL. Confidence analysis of standard deviational ellipse and its extension into higher dimensional euclidean space. PLoS ONE. (2015) 10:e0118537. doi: 10.1371/journal.pone.0118537
23. Ahmad SS, Aziz N, Butt A, Shabbir R, Erum S. Spatio-temporal surveillance of water based infectious disease (malaria) in Rawalpindi, Pakistan using geostatistical modeling techniques. Environ Monit Assess. (2015) 187:555. doi: 10.1007/s10661-015-4779-9
24. Ord JK, Getis A. Local spatial autocorrelation statistics: distributional issues and an application. Geogr Anal. (1995) 27:286–306. doi: 10.1111/j.1538-4632.1995.tb00912.x
25. Ekong PS, Cardona CJ, Bryssinckx W, Ikechukwu-Eneh C, Lombin LH, Carpenter TE. Spatial clustering of pathology submissions during the initial introduction and spread of avian influenza H5N1 in poultry in Nigeria in 2006-2007. Vet Ital. (2018) 54:13–20. doi: 10.12834/VetIt.870.4301.3
26. Fang L, Yan L, Liang S, de Vlas SJ, Feng D, Han X, et al. Spatial analysis of hemorrhagic fever with renal syndrome in China. BMC Infect Dis. (2006) 6:77. doi: 10.1186/1471-2334-6-77
27. Mandal R, Kesari S, Kumar V, Das P. Trends in spatio-temporal dynamics of visceral leishmaniasis cases in a highly-endemic focus of Bihar, India: an investigation based on GIS tools. Parasites Vectors. (2018) 11:220. doi: 10.1186/s13071-018-2707-x
28. Guo C, Du Y, Shen S, Lao X, Qian J, Ou C. Spatiotemporal analysis of tuberculosis incidence and its associated factors in mainland China. Epidemiol Infect. (2017) 145:2510–9. doi: 10.1017/S0950268817001133
29. Tuia D, Ratle F, Lasaponara R, Telesca L, Kanevski M. Scan statistics analysis of forest fire clusters. Commun Nonlinear Sci Numerical Simul. (2008) 13:1689–94. doi: 10.1016/j.cnsns.2007.03.004
30. Cassini R, Mulatti P, Zanardello C, Simonato G, Signorini M, Cazzin S, et al. Retrospective and spatial analysis tools for integrated surveillance of cystic echinococcosis and bovine cysticercosis in hypo-endemic areas. Geospat Health. (2014) 8:509–15. doi: 10.4081/gh.2014.40
31. Lazić S, Lupulović D, Gaudaire D, Petrovic T, Lazić G, Hans A. Serological evidence of equine arteritis virus infection and phylogenetic analysis of viral isolates in semen of stallions from Serbia. BMC Vet Res. (2017) 13:316. doi: 10.1186/s12917-017-1226-x
32. Davis CT, Ebel GD, Lanciotti RS, Brault AC, Guzman H, Siirin M, et al. Phylogenetic analysis of North American West Nile virus isolates, 2001-2004: evidence for the emergence of a dominant genotype. Virology. (2005) 342:252–65. doi: 10.1016/j.virol.2005.07.022
33. Brown F. The history of research in foot-and-mouth disease. Virus Res. (2003) 91:3–7. doi: 10.1016/S0168-1702(02)00268-X
34. Bai X, Li P, Cao Y, Li D, Lu Z, Guo J, et al. Engineering infectious foot-and-mouth disease virus in vivo from a full-length genomic cDNA clone of the A/AKT/58 strain. Sci China Series C Life Sci. (2009) 52:155–62. doi: 10.1007/s11427-009-0007-6
35. Li D, Liu Z-X, Bao H-F, Lu Z-J, Guo J-H, Cao Y-M, et al. The complete genome sequence of foot-and-mouth disease virus O/Akesu/58 strain and its some molecular characteristics. Arch Virol. (2007) 152:2079–85. doi: 10.1007/s00705-007-1041-y
36. Du J, Chang H, Cong G, Shao J, Lin T, Shang Y, et al. Complete nucleotide sequence of a Chinese serotype Asia1 vaccine strain of foot-and-mouth disease virus. Virus Genes. (2007) 35:635–42. doi: 10.1007/s11262-007-0126-8
37. Kitching R. Global epidemiology and prospects for control of foot-and-mouth disease[J]. Curr Top Microbiol Immunol. (2005) 288:133–48. doi: 10.1007/3-540-27109-0_6
38. Hjalmars U, Kulldorff M, Gustafsson G, Nagarwalla N. Childhood leukaemia in Sweden: using GIS and a spatial scan statistic for cluster detection. Stat Med. (1996) 15:707–15. doi: 10.1002/(sici)1097-0258(19960415)15:7/9<707::aid-sim242>3.0.co;2-4
39. Wang J, Cao Z, Zeng DD, Wang Q, Wang X, Qian H. Epidemiological analysis, detection, and comparison of space-time patterns of Beijing hand-foot-mouth disease (2008–2012). PLoS ONE. (2014) 9:e92745. doi: 10.1371/journal.pone.0092745
40. Ozdenerol E, Williams BL, Kang SY, Magsumbol MS. Comparison of spatial scan statistic and spatial filtering in estimating low birth weight clusters. Int J Health Geogr. (2005) 4:19. doi: 10.1186/1476-072X-4-19
41. Kulldorff M, Nagarwalla N. Spatial disease clusters: detection and inference. Stat Med. (1995) 14:799–810. doi: 10.1002/sim.4780140809
42. Hagerman AD, South DD, Sondgerath TC, Patyk KA, Sanson RL, Schumacher RS, et al. Temporal and geographic distribution of weather conditions favorable to Check 1 airborne spread of foot-and-mouth disease in the coterminous United States. Prev Vet Med. (2018) 161:41–9. doi: 10.1016/j.prevetmed.2018.10.016
43. Cohen A, Mehta S. Pollution and tuberculosis: outdoor sources. PLoS Med. (2007) 4:e142. doi: 10.1371/journal.pmed.0040142
44. Douglas A, Strachan D, Maxwell J. Seasonality of tuberculosis: the reverse of other respiratory diseases in the UK. Thorax. (1996) 51:944–6. doi: 10.1136/thx.51.9.944
45. Klein J, Hussain M, Ahmad M, Afzal M, Alexandersen S. Epidemiology of foot-and-mouth disease in Landhi Dairy Colony, Pakistan, the world largest Buffalo colony. Virol J. (2008) 5:16. doi: 10.1186/1743-422X-5-53
46. Lee HS, Thiem VD, Anh DD, Duong TN, Lee M, Grace D, et al. Geographical and temporal patterns of rabies post exposure prophylaxis (PEP) incidence in humans in the Mekong River Delta and Southeast Central Coast regions in Vietnam from 2005 to 2015. PLoS ONE. (2018) 13:e0194943. doi: 10.1371/journal.pone.0194943
47. Smith MT, Bennett AM, Grubman MJ, Bundy BC. Foot-and-mouth disease: Technical and political challenges to eradication. Vaccine. (2014) 32:3902–8. doi: 10.1016/j.vaccine.2014.04.038
48. Ma J, Xiao JH, Gao X, Liu BY, Chen H, Wang HB. Spatial pattern of foot-and-mouth disease in animals in China, 2010-2016. PeerJ. (2017) 5:13. doi: 10.7717/peerj.4193
49. Thanh Toan DT, Hu W, Quang Thai P, Ngoc Hoat L, Wright P, Martens P. Hot spot detection and spatio-temporal dispersion of dengue fever in Hanoi, Vietnam. Glob Health Action. (2013) 6:18632. doi: 10.3402/gha.v6i0.18632
Keywords: foot-and-mouth disease (FMD), spatial statistics, standard deviational ellipse, space-time scan statistics, hotspot detection, geographic information system (GIS)
Citation: Chen J, Wang J, Wang M, Liang R, Lu Y, Zhang Q, Chen Q and Niu B (2020) Retrospect and Risk Analysis of Foot-and-Mouth Disease in China Based on Integrated Surveillance and Spatial Analysis Tools. Front. Vet. Sci. 6:511. doi: 10.3389/fvets.2019.00511
Received: 28 June 2019; Accepted: 23 December 2019;
Published: 21 January 2020.
Edited by:
Suresh Varma Kuchipudi, Pennsylvania State University (PSU), United StatesReviewed by:
Suresh H. Basagoudanavar, Indian Veterinary Research Institute, IndiaCopyright © 2020 Chen, Wang, Wang, Liang, Lu, Zhang, Chen and Niu. This is an open-access article distributed under the terms of the Creative Commons Attribution License (CC BY). The use, distribution or reproduction in other forums is permitted, provided the original author(s) and the copyright owner(s) are credited and that the original publication in this journal is cited, in accordance with accepted academic practice. No use, distribution or reproduction is permitted which does not comply with these terms.
*Correspondence: Qin Chen, Y2hlbnFpbmNjQHNodS5lZHUuY24=; Bing Niu, YmluZ25pdUBzaHUuZWR1LmNu
†These authors have contributed equally to this work
Disclaimer: All claims expressed in this article are solely those of the authors and do not necessarily represent those of their affiliated organizations, or those of the publisher, the editors and the reviewers. Any product that may be evaluated in this article or claim that may be made by its manufacturer is not guaranteed or endorsed by the publisher.
Research integrity at Frontiers
Learn more about the work of our research integrity team to safeguard the quality of each article we publish.