 Amy S. Biddle
 Jean-Francois Tomb
 Zirui Fan2
- 1Department of Animal and Food Science, University of Delaware, Newark, DE, United States
- 2Department of Computer and Information Sciences, University of Delaware, Newark, DE, United States
Due to modern management practices and the availability of energy dense feeds, obesity is a serious and increasingly common health problem for horses. Equine obesity is linked to insulin resistance and exacerbation of inflammatory issues such as osteoarthritis and laminitis. While the gut microbiome is thought to play a part in metabolic status in horses, bacterial communities associated with obesity have yet to be described. Here we report differences in metabolic factors in the blood of obese, normal and lean horses correlated with differences in gut microbiome composition. We report that obese horses had higher levels of leptin, triglycerides, glucose, and cortisol in their blood, and more diverse gut microbiome communities with higher relative abundance of Firmicutes, and lower numbers of Bacteroidetes and Actinobacteria. Network analyses of correlations between body condition, blood analytes, and microbial composition at the genus level revealed a more nuanced picture of microbe-host interactions, pointing to specific bacterial species and assemblages that may be signatures of obesity and leanness in the horse gut. In particular, bacteria groups positively associated with two blood analytes and obesity included Butyrivibrio spp., Prevotellaceae, Blautia spp., two members of Erysipelotrichaceae, and a Lachnospiraceae taxa. These results are an important first step in unraveling the metabolic differences between obese and lean horse gut communities, and designing targeted strategies for microbial intervention.
Introduction
As hindgut fermenting, obligate herbivores, horses rely on the gut microbiome to access nutrients and energy from dietary complex carbohydrates. Short chain fatty acids produced by microbial metabolism have been estimated to provide as much as 42% of equine energy needs (1, 2). Surveys of the equine gut microbiome using 16S rDNA sequencing have revealed communities dominated by Firmicutes, and Bacteroidetes (comprising 75% or greater relative abundance), with less abundant Proteobacteria, Verrucomicrobia, Spirochaetes, Actinobacteria, and Fibrobacteres (3–7). As with other animal and human studies, the horse gut microbiome is sensitive to diet, specifically consumption of starch (8–11), fiber (9, 12–14), and high fat (9, 15), or following a rapid change in diet (14, 16). Both age (17) and exercise (18, 19) have also been shown to impact the composition of the equine gut microbiome.
Paralleling human health trends, equine obesity is a growing problem for horse owners, managers, and veterinarians despite greater awareness of body condition assessment, and the availability of specialized feeds for weight management (20–23). A recent study of 300 horses in Virginia using a standardized 1–9 scale to estimate body condition score (BCS) (24), found as many as 51% to be over-conditioned or obese (22). Indications suggest that this estimate of obesity is not an isolated trend (20, 23, 25).
A primary component of Equine Metabolic Syndrome (EMS), obesity contributes to insulin resistance (26–30), predisposes horses to laminitis (30–32), exacerbates heat intolerance(33), reduces performance (34, 35), and increases joint stress (36, 37). A breed effect in the incidence of EMS indicators has been demonstrated, with higher prevalence in ponies, Standardbreds, Andalusians (38), and Rocky Mountain Horses (39), and lower rates in Thoroughbreds, Quarter Horses, and mixed breeds (39).
While human and mouse studies comparing the gut microbiomes of lean and obese individuals have shown a higher Firmicutes: Bacteroidetes ratio correlated with obesity (40–42), comparisons of fewer than 10 obese and lean horses have observed no difference in the ratio of these groups (12, 43). One comparative EMS study of 20 horses found specific genera associated with obesity, including: Clostridium cluster XI, Lactobacillus, Cellulosilyticum, Elusimicrobium, and members of the phyla Verrucomicrobia, while Fibrobacter, Ruminococcus, Saccharofermentans, Anarovorax, and members of Lachnospiraceae and Rhodospirillaceae families were correlated with normal controls (12).
Several metabolic markers in blood have been shown to be correlated with high BCS in horses, namely higher levels of resting insulin, glucose, leptin, adiponectins, and triglycerides (39, 44–46). Higher leptin levels have been shown to be especially pronounced in horses fed diets rich in cereals or fat (38), but no response was seen in obese horses fed varying levels of non-structural carbohydrates in hay (47). Additionally, horses with higher levels of leptin showed elevated insulin (44, 46) and cortisol (especially mares) (44).
While levels of obesity associated blood analytes have been described in horses, studies to identify differences in the gut microbiomes of obese and lean horses have been few and limited to a small number of horses. The purpose of the present study is to correlate blood metabolites related to EMS (insulin, glucose, triglycerides, leptin, ACTH, and cortisol) with gut microbiome differences in a set of 78 horses: lean (n = 24), normal (n = 17), and obese (n = 37).
Materials and Methods
Fecal Sample Collection
Fecal samples were collected manually midrectum from horses before breakfast, and stored in ice for no more than 2 h prior to storage at −80°C. Sampling was done in the January–April of 2015 or 2016, before horses had access to fresh, spring grass. Pasture-fed horses were of various breeds, aged 2–20 years, from three university herds: (University of Massachusetts, Amherst, MA, University of Illinois, Champaign-Urbana, IL, or Virginia-Maryland Regional College of Veterinary Medicine, Blacksburg, VA) or private horse owners from five different farms. To minimize variation due to location or owner, no facility contained fewer than three horses. Horses that had received antibiotic or anthelmintic medication within 60 days of collection were removed from the study. Metadata collected for each horse included: breed, gender, diet, housing type, and age. Diet was divided into three categories depending on primary feed with no distinction made for quantity or quality. Diet categories included: Pasture (P), Hay (H), Hay, and concentrate (HC). Age was divided into two categories: 10 years or less (Age_Y, n = 29), and over 10 years (Age_M, n = 49). BCS (1-9) was determined by the average of at least three observers using the Hennecke scale (24). Horses with divergent BCS across body regions were not sampled due to the possibility of metabolic issues. Classifications of obese, normal, or lean were assigned to each horse based on score: 7 or higher, between 6 and 7, and 5.5 and less, respectively. The demographics of horses participating in this study are summarized in Table 1.
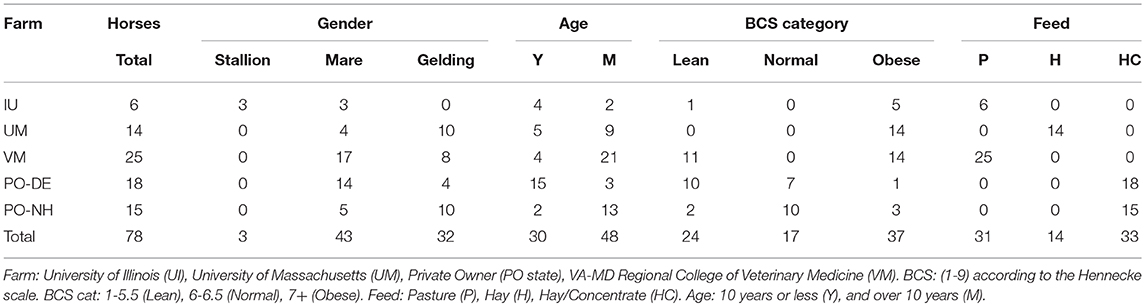
Table 1. Demographics of horses included in this study (for complete horse list, see Table S1).
Blood Sample Collection
Whole blood was collected via venipuncture into untreated Vacutainer tubes (serum) and EDTA tubes (plasma) (BD, Franklin Lakes, NJ). Tubes were chilled for no more than 2 h before processing. Serum tubes were allowed to return to room temperature and clot before spinning. Plasma tubes were spun for 20 min at 850 g at 4°C. Serum tubes were spun for 20 min at 850 g at room temp. Plasma or serum layers were removed and stored at −80°C prior to analysis. All analysis was done at the Cornell Animal Health Diagnostic Center, Ithaca, NY. ACTH, cortisol, insulin, and leptin were measured from plasma samples, and glucose and triglycerides were measured from serum samples.
DNA Extraction and Sequencing
Fresh fecal samples were collected midrectum from each horse, kept on ice for no more than 2 h prior to storage at −80°C. DNA was extracted utilizing either a modified CTAB-bead beating method (48–50), or Mobio Power Fecal DAN extraction kit (MoBio Laboratories, Carlsbad, CA), and stored at −80°C prior to sequencing.
Amplification of the V4-V5 region of the 16S rRNA gene and attachment of indexes for multiplexing samples were done using region specific primers (515F/926R) as described elsewhere (51). PCR products were pooled and sequenced using the MiSeq platform at either the University of Illinois Biotechnology Center, Urbana, IL, or RTL Genomics, Lubbock, TX. Paired ends were joined using FLASh (v. 1.2.11) (52). Quality and chimera filtering, taxonomic assignment, diversity analysis, and identification of shared and unique taxa were done using the QIIME (53) pipeline as applied previously (54).
Statistical Analysis
Relative abundance of bacterial groups and alpha diversity measures by body condition group were compared using pair-wise, two-tailed t-tests (assuming unequal variances), and Kruskal-Wallis rank sum test in R (55). Differential abundance between lean, normal, and obese horses at the taxa level was modeled using a negative binomial distribution in the DESeq package (56) in R (55). Spearman correlations of all pairs of taxa, blood analytes, metadata, and relative abundance of bacterial taxa were calculated in JMP (Pro 13.0.0).
Network Construction
Networks of significant Spearman correlations were visualized in Cytoscape (version 3.6.0). Taxa nodes were mapped to their phylogeny, colored by phyla, and assigned a two-letter code (Table 3). Border thickness of taxa nodes was proportional to Relative Abundance (RA). Significant positive and negative Spearman correlations were represented by red and blue edges, respectively. Edge thickness was proportional to correlation coefficient values ranging from +1 to +0.3 and from −1 to −0.3. Networks of nodes of differentially abundant taxa, were constructed by selecting first neighbors for all the specified nodes. In complex networks, edges representing pairwise correlations with values <0.5 were de-emphasized (faded).
Results
16S rRNA Sequencing
Summary statistics for 16S rRNA sequencing following filtering for low quality and length can be found in Table 2. The average read length was 412 bp, and the total number of reads was 3,148,220. Sequence data has been deposited in Genbank BioSample SAMN09917936.
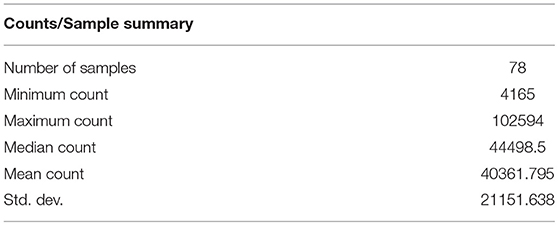
Table 2. 16S rRNA sequence counts after removal of low quality and short reads.
Bacterial Abundance Profiles
16S rRNA sequences were clustered at 97% similarity against the latest Greengenes database (13_5). The resulting operational taxonomic units (OTUs) were filtered for singletons and doubletons. Table 3 lists the 51 bacterial OTUs with abundance >0.10% with their corresponding 2 letter codes. All taxa included in the subsequent analysis are found in Table S2.
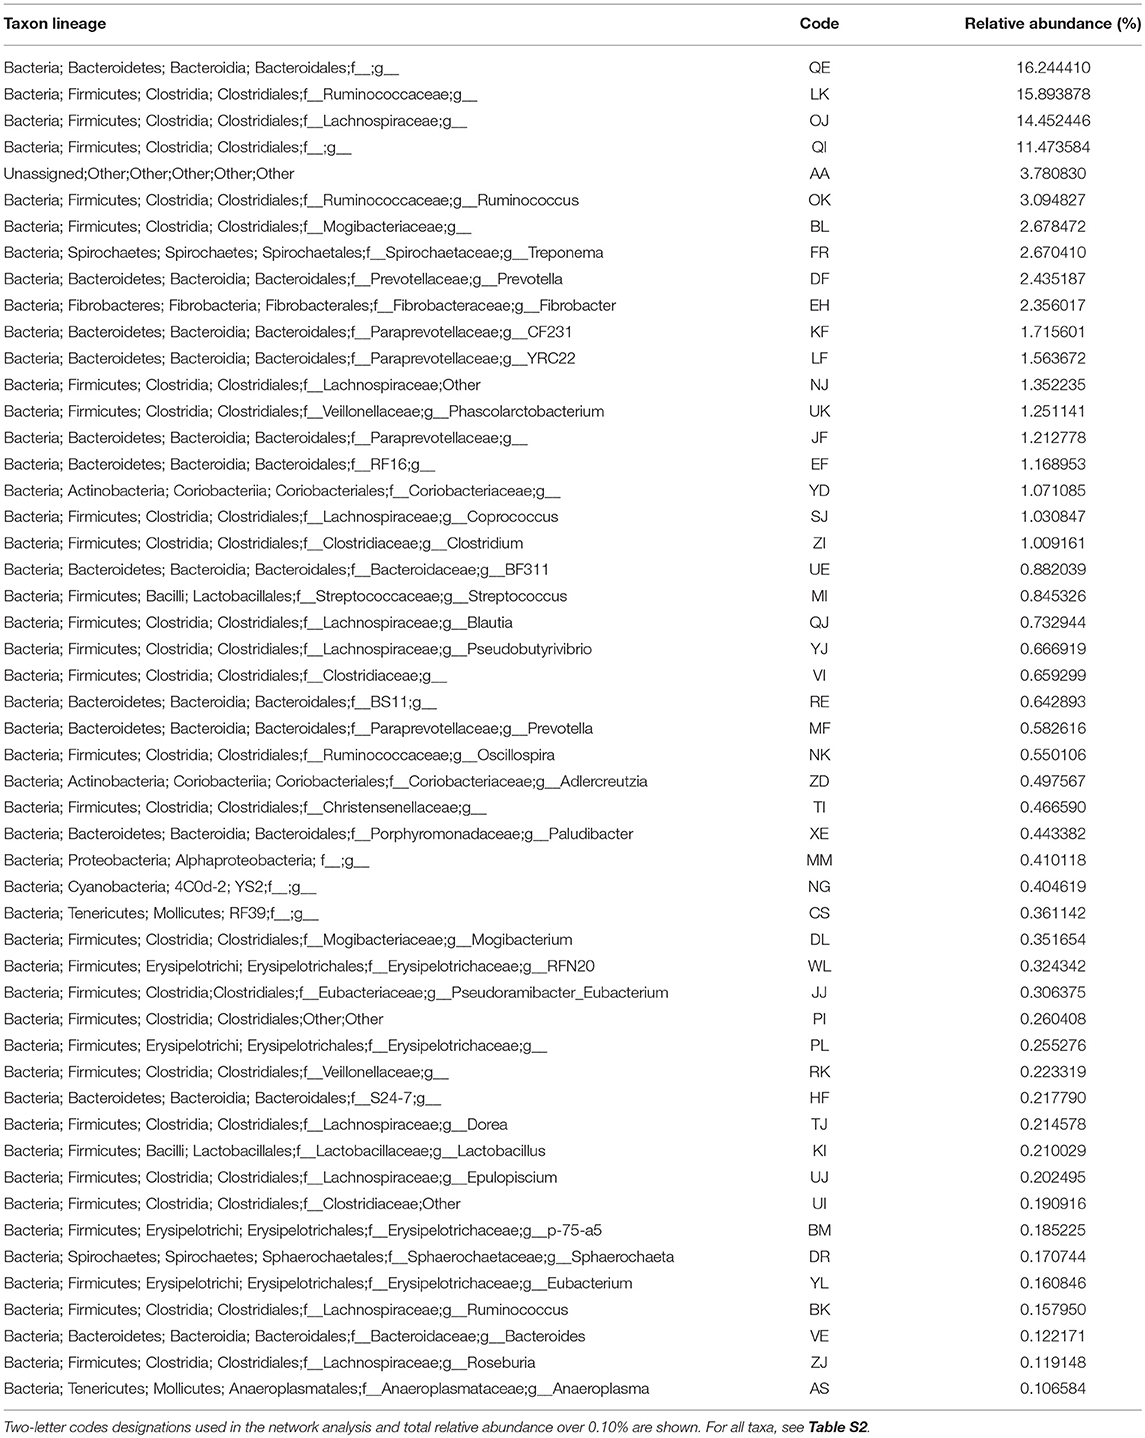
Table 3. Taxa identified and the total relative abundance in the obese, normal, and lean horse samples.
At the phyla level, comparison of communities of lean, obese, and normal horses showed no significant differences in variance (Kruskal-Wallis test, p-value > 0.05) (Figure S1), however pairwise differences were detected between obese and lean and obese and normal horses in relative abundance of Bacteroidetes and Firmicutes (two-tailed t-test assuming unequal variances, p-value < 0.05) (Figure 1). Specifically, the relative abundance of Bacteroidetes was less in obese horses, while the relative abundance of Firmicutes was higher. Consequently, the Firmicutes/Bacteroidetes ratio was higher for obese horses. Comparison of Bacteroidetes families in the gut microbiome of obese, lean, and normal horses show differences in unspecified Bacteroidales family and Porphyromonadaceae, while difference were seen in six Firmicutes families: Christensenellaceae, Erysipelotrichaceae, Lachnospiraceae, Lactobacillaceae, Mogibacteriaceae, and Ruminococcaceae (Figure S2).
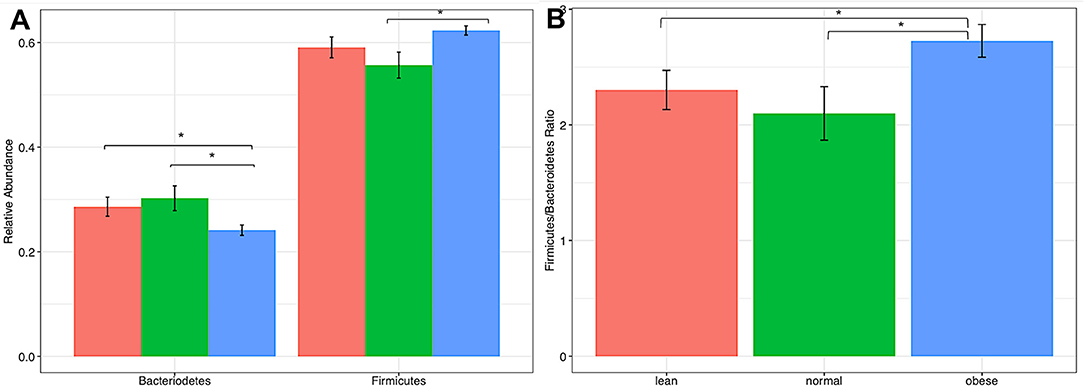
Figure 1. Comparison of firmicutes and bacteriodetes from lean, normal, and obese horses. (A) Relative abundance of each Phla. (B) Firmicutes /Bacteriodetes ratio. Error bars represent standard error. Significantly different groups (two tailed t-test assuming unequal variances) art indicated*.
Differentially abundant taxa were identified (padj < 0.05) using a negative binomial distribution in DESeq for pairwise BCS groups and All BCS groups together (Table 4). All but four differentially abundant taxa were members of Actinobacteria, Firmicutes, or Bacteroidetes. There were 5, 6, and 24 differentially abundant taxa between Obese/Lean, Normal/Lean, and Obese/Normal groups respectively. Nine taxa were found to be differentially abundant in two or more pair-wise comparisons, and three taxa were identified as differentially abundant in comparisons of all BCS categories. Differentially abundant taxa with relative abundance >0.01% were compared by BCS group (Figure 2), and found to collectively constitute between 20 and 30% of total bacterial abundance.
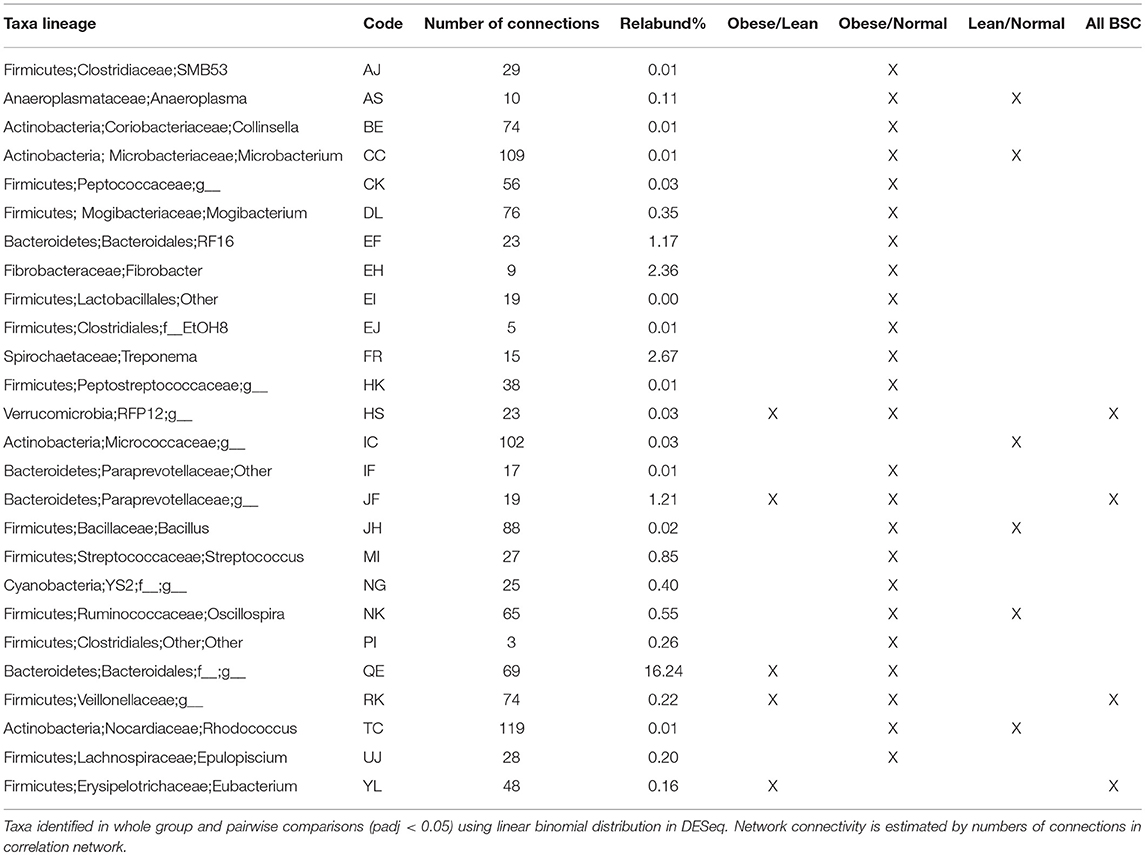
Table 4. Differentially abundant taxa.
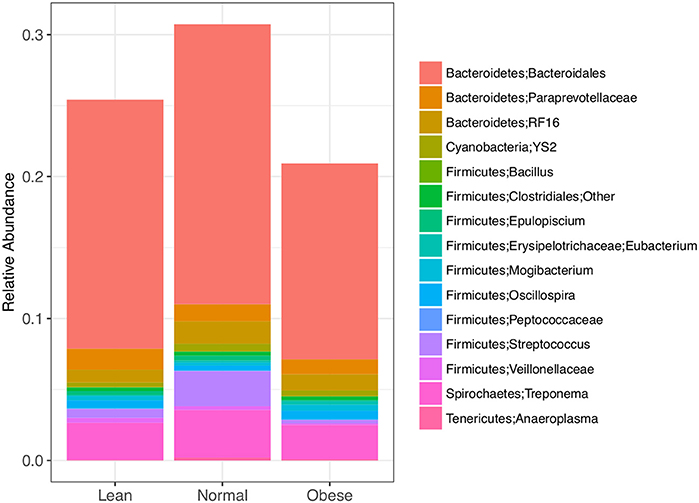
Figure 2. Differently abundant bacterial taxa between lean, normal, and obese horses as determined using a negative binomial distribution, p-value <0.05. Taxa with relative abundance ≥ 0.01 % are shown.
Bacterial Diversity
Obese horse samples were higher than both normal and lean for all measures of alpha diversity, including richness (Chao1 and Observed OTUs), richness and evenness (Shannon Index), and phylogenetic diversity (PD-whole-Tree) (Figure 3).
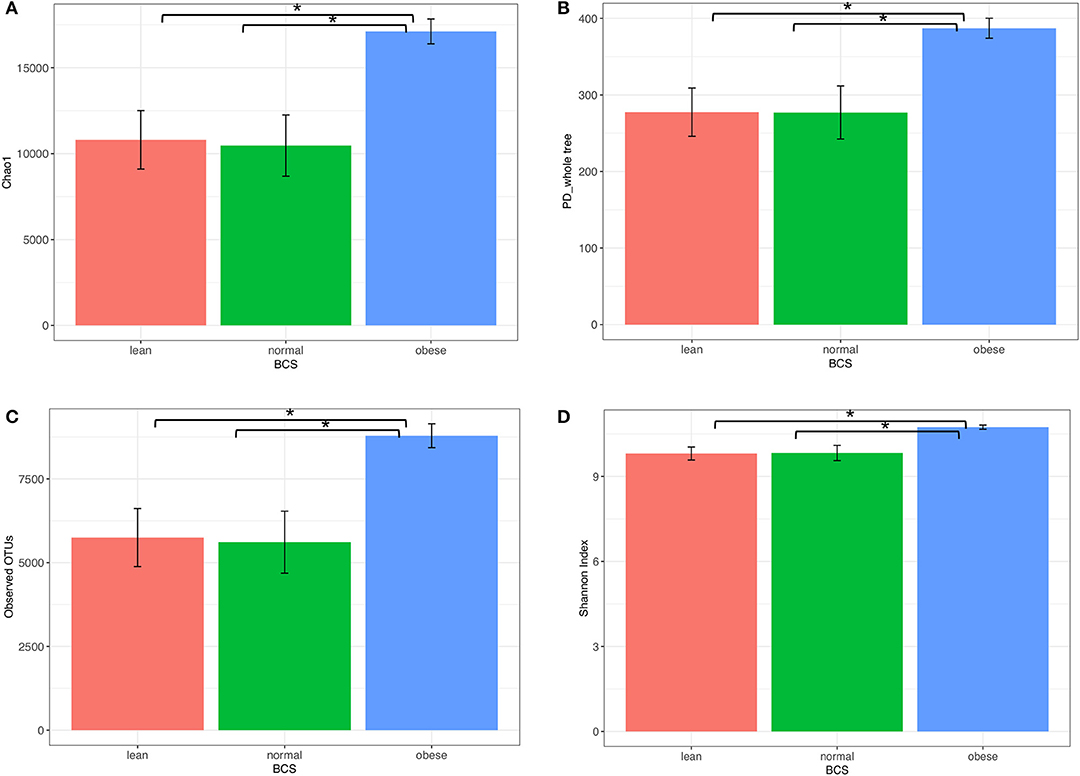
Figure 3. Alpha diversity of bacterial communities from obese, normal, and lean horses. (A) chaol, (B) PD_whole _tree, (C) observed OTUs, (D) Shannon Index. Error bars represent standard error. Significantly different groups (two tailed t-test assuming unequal variances) art indicated*.
Blood Analytes
Measurements of insulin, glucose, ACTH, cortisol, leptin, and triglycerides were measured from either serum or plasma, and summarized by BCS group in Table 5. All blood analytes by horse are reported on Table S3. Blood levels of cortisol were higher for obese horses than normal or lean horses. Levels of leptin increased with increasing BCS. Triglyceride and glucose levels were similar between normal and obese horses, and lower for lean horses (Figure 4). Statistical difference was not seen between horse groups for resting insulin or ACTH (not shown).
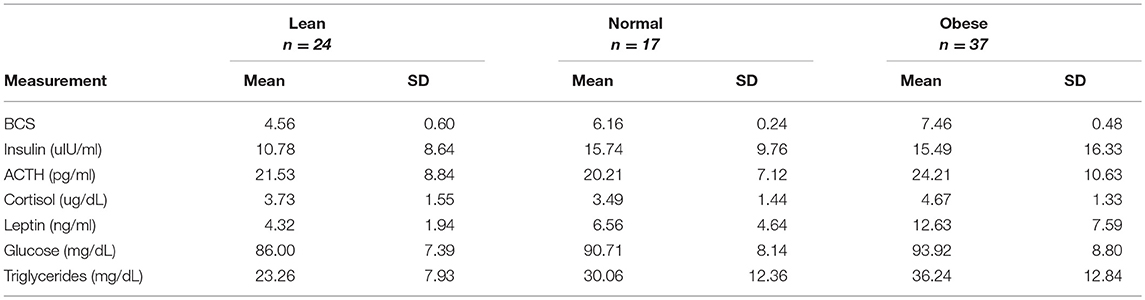
Table 5. Summary of blood analyte measurements based on BCS category.
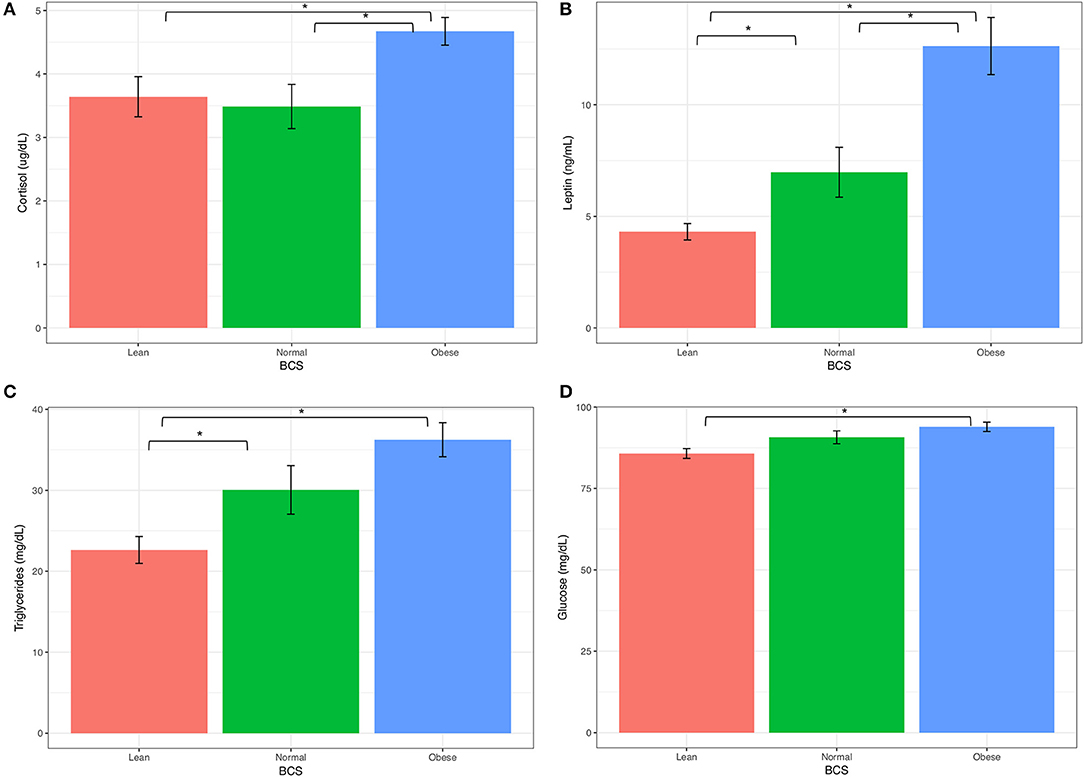
Figure 4. Keyboard analytes from obese, normal, and lean horses (A) Corsitol, (B) Leptin, (C) Triglycerides, (D) Glucose. Error bars represent standard error. Significantly different groups (two tailed t-test assuming unequal variances) art indicated*.
The relationships between pairs of blood factors was plotted with 95% confidence intervals to identify patterns based on BCS (Figure 5). At the ranges measured, clear differences were seen in the trend for insulin and glucose in obese, normal, and lean horses. A positive slope for obese and normal samples showed that glucose and insulin levels increased proportionally. An opposite trend was shown for lean horses, as glucose dropped with increasing insulin levels. There was no overlap between confidence intervals for lean and either normal or obese horses. Between normal and obese horses, overlap occurred for only the upper confidence interval. Linear modeling of triglycerides and leptin showed a more positive relationship and leptin response in the obese horses, and nearly constant leptin levels in normal and lean horses. Confidence intervals did not overlap between the obese group and either the lean or normal horses, which were more consistent with each other.
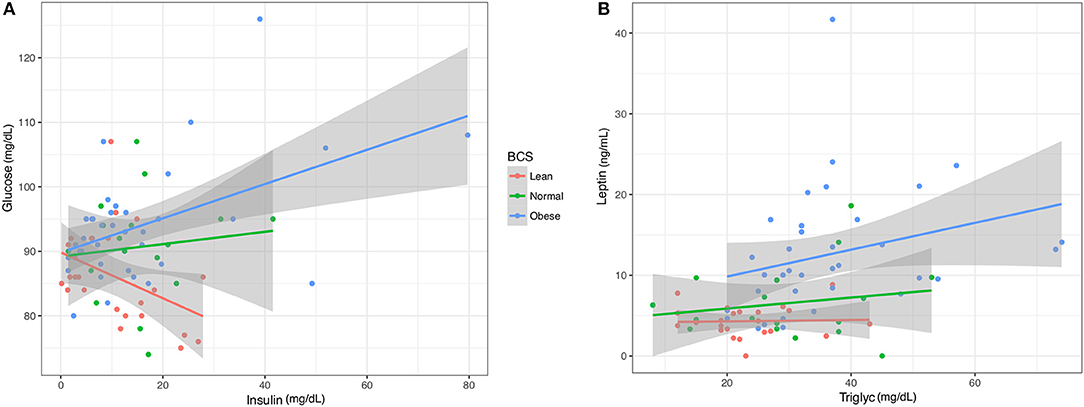
Figure 5. Linear models of key blood analytes from obese, normal, and lean horses. (A) Insulin vs. Glucose. (B). Triglycerides vs. Leptin. Gray region represents 95% confidence intervals.
Correlation Analysis
Spearman rank correlation coefficients analysis performed in JMP (Pro 13.0.0) or R (55) included all 446 taxa, six blood analytes and four metadata variables: Feed, Age, BCS, and Owner. The default alpha value for the initial pairwise analysis was 0.05. 105,570 correlations were found. Correlations with p-values ≤ 0.01 and coefficient values in the range of −0.3 to −1.0 and +0.3 to +1.0 resulted in 9,353 significant pairwise interactions for network analysis.
Network Analysis
Networks of significant Spearman correlations were visualized in Cytoscape (version 3.6.0). This step resulted in a network composed of 458 nodes and 9,353 edges. The first neighbor network, showing significant correlations between all blood analytes, metadata, and taxa (Figure 6), showed positive correlations between BCS_O (obese) and blood analytes leptin, cortisol, triglycerides, and glucose, but no correlation with ACTH or insulin. BCS_O was positively correlated with Feed_H (hay), negatively correlated with Feed_HC (hay-concentrate), and not connected with Feed_P (pasture). Focusing on the differentially abundant taxa, the microbial network positively associated with BCS_O included 32 taxa, primarily from Actinobacteria, Firmicutes, and Bacteroidetes. BCS_O had only a few negatively associated bacteria, including highly connected members of the Veillonellaceae (RK), and Lachnospiraceae (UJ).
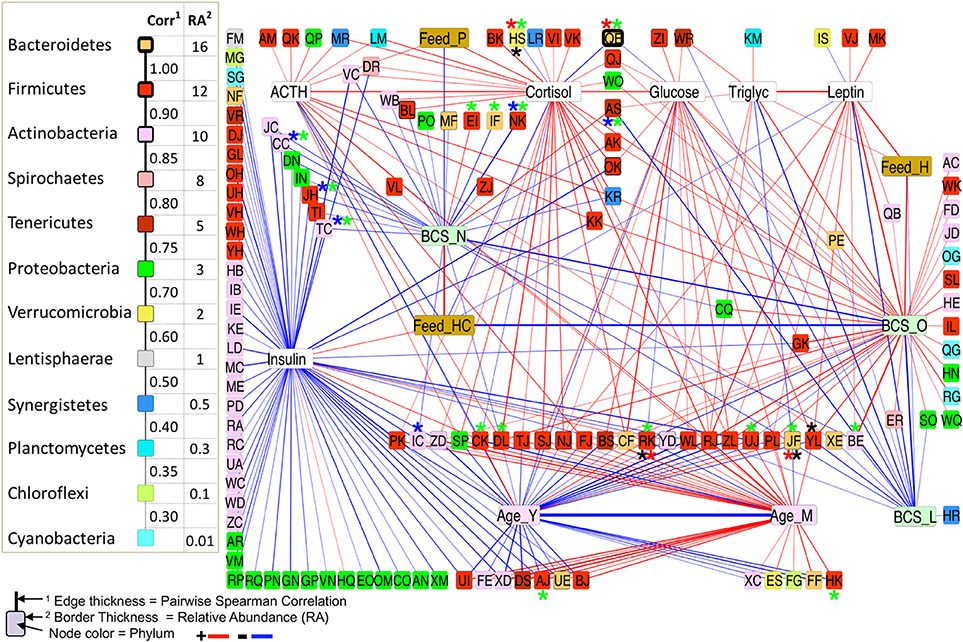
Figure 6. First-neighbors networks of significant pairwise correlations for body condition score, blood analytes and age with differentially abundant (DA) taxa highlighted. Among All BCS*, between L/O horses*, L/N horses*, and O/N horses*.
BCS_L (lean) showed negative correlations with leptin, glucose, and triglycerides, and no correlation with any feed group. The microbial network negatively associated with BCS_L included taxa positively associated with BCS_O or BCS_N, specifically Anaeroplasma (AS), Eubacterium (JF), and Paraprevotellaceae (YL).
BCS_N (normal) was not connected to any blood analyte, but showed positive correlation to Feed_HC and negative correlation to Feed_H. Negative correlations were shown for twenty taxa, including differentially abundant Oscillospira (NK), Microbacterium (CC), Bacillus (JH), and Rhodococcus (TC).
Each of the blood analytes had a small sub-network of associations, except insulin, which showed negative correlations with over 50 bacterial taxa, and no connection to BCS. Insulin did show a positive correlation to Feed_HC, and a negative correlation with Age_Y (young).
The first neighbor network of the differentially abundant taxa for all BCS groups (Figure 7) showed the connectivity of these four taxa. Veillonellaceae (RK) was positively correlated with a Bacteroidetes (QE), a highly abundant (16.24%) taxa in the dataset, but negatively associated with 24 taxa that were all positively associated with an Erysipelotrichaceae (YL), suggesting a strong relationship between these two taxa. RK was also positively associated with insulin and Feed_HC, and negatively correlated with glucose and Feed_P, while YL was positively correlated with glucose, leptin, Feed-H, BCS_O, and Age_M (middle aged), and negatively associated with Age_Y and BCS_L.
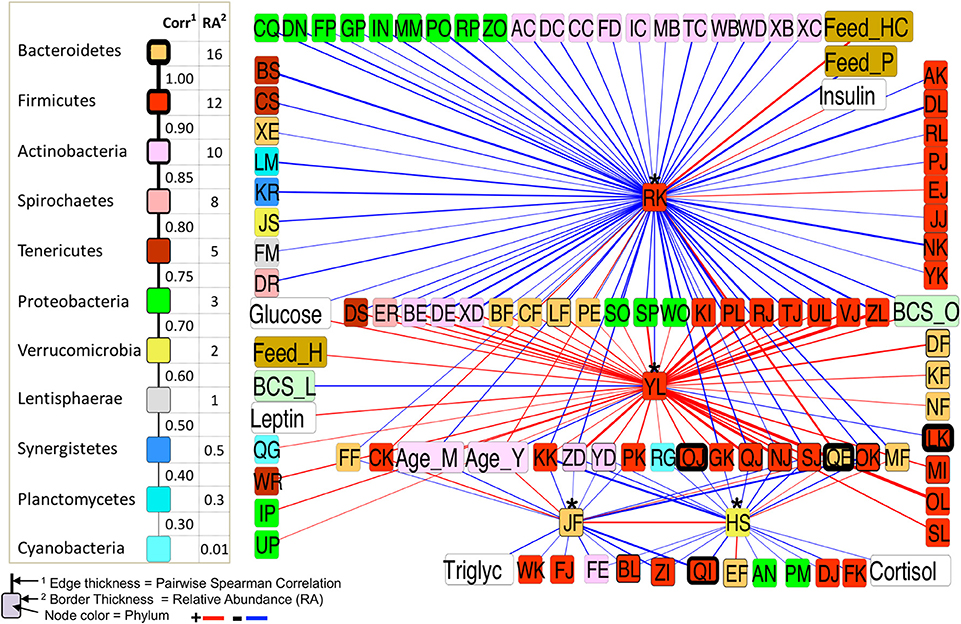
Figure 7. First-neighbor network for Spearman significant pairwise correlations of all differentially abundant (DA) taxa among all BCS categories.
A network of bacteria containing only positive correlations with two or more blood analytes points to key taxa which are also associated with BCS_O and the older age group (Figure 8). This group contained nine Firmicutes, two Synergistetes, and one each of Bacteroidetes, Planctomycetes, and Proteobacteria. Of special interest were two taxa: Firmicutes, Lachnospiraceae, Butyrivibrio, and Firmicutes, Lachnospiraceae, Other which were positively correlated to two and four pairs of associations respectively.
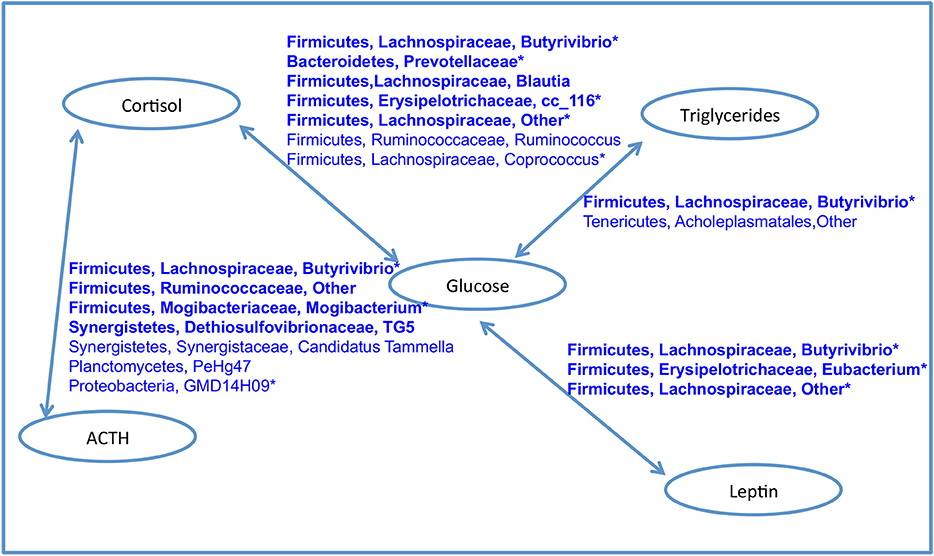
Figure 8. Network of bacteria with positive associations with both blood analytes in each connected pair. Taxa in bold were positively correlated with BCS_O. Starred taxa were positively associated with the older age group. No bacterial taxa was positively associated with BCS_O, BCS_N and any pair of analytes. No bacterial taxa was positively with insulin and any other analyte.
Analysis of Additional Metadata Factors
Significant correlations were found between owner and feed type, but not owner and BCS or any other blood analyte presumably due to consistence in management methods between farms. Three taxa were found to be uniquely correlated with owner: two Bacteroidetes (Rikenellaceae and Paraprevotellaceae, YRC22), and a Firmicutes (Streptococcus spp.) (Table 6). These were found in the dataset at 1.56, 0.012, and 0.845% respectively.
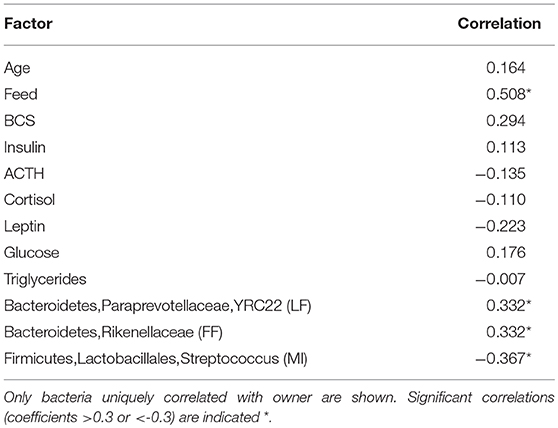
Table 6. Spearman correlations between owner, metadata factors and bacteria.
Discussion
This research compares the diversity and structure of gut microbiome communities of obese, lean, and normal horses, and correlates bacterial community assembly with blood analytes associated with obesity and metabolic issues in horses. The blood marker results (higher leptin, triglycerides, glucose, and cortisol levels, and trends toward higher insulin in obese horses) mirror what has been shown in other studies (45, 47, 57), but this is the first report correlating BCS, blood analytes, and microbial community composition in horses.
Similar to surveys of obese individuals in other systems, we report higher phylogenetic diversity and greater richness of bacteria in the gut microbiomes of the BCS_O horses (40, 41, 58). Specific Firmicutes groups (members of the Ruminococcaceae and Lachnospiraceae families) were positively correlated with two or more key blood analytes, increasing age, and obesity (Figure 8). While collectively this highly connected network of bacteria comprises <5% of the relative abundance of sequences in the data set, they could be providing beneficial metabolic products and ecosystem services.
We report obese BCS in horses to be positively correlated to four blood analytes: glucose, cortisol, triglycerides, and leptin, and lean BCS to be negatively correlated to glucose, tryglycerides, and leptin. These values were similar to prior studies in horses (27, 59, 60), and have been used in diagnostic panels for EMS. In humans, it has been estimated that the gut microbiome could explain 4.5–6% of the variation in BMI and triglyceride levels (61), specifically 114 taxa, 95 of which were members of Firmicutes (Lachnospiraceae, Ruminococcaceae, Christensenellaceae, and others). While horses typically consume a relatively low fat diet, obese BCS gut microbiomes were found to be enriched in six triglyceride associated bacterial taxa, while the lean BCS group was not positively correlated with any of these taxa. Specific obesity related taxa from human studies were positively associated with obese BCS in this study, in particular Campylobacter spp., Collinsella spp., Prevotellaceae, Selenomonas spp., Blautia spp., and Mogibacterium spp. (62, 63), three taxa of Cyanobacteria, and Adlercreutzi spp. (64), four Erysipelotrichaceae taxa associated with obesity (65) and aromatic amino acid metabolism in high fat diet (66), and Dethiosulfovibrionaceae, a family of sulfate reducing bacteria (64, 66–68). That the normal and lean BCS groups were either negatively or not correlated with all of these taxa suggests distinguishing community differences in horses based on BCS, and points to similarities in host-microbial dynamics underlying metabolic disease between horses and humans.
At the same time, four taxa associated with healthy gut status were significantly correlated with obese BCS, specifically Propionibacteriaceae (propionate producer), Butyrivibrio spp. (butyrate producer), Ruminococcaceae (fiber degrader), and Sutterella spp. (function unclear) (62). Butyrivibrio spp. was of special interest because it was significantly correlated with all four pairs of blood analytes (Figure 8). While its abundance is <1% in the dataset, the high connectivity of this bacteria suggests that it could play an important role in host interactions, regulation, or immune status related to obesity.
The lack of correlation between resting insulin and bacterial taxa abundance found in this study reflected the difficulty in estimating blood insulin values using a resting measurement (27, 46), or suggested a more complex picture. Horses with high blood insulin and glucose levels are often, but not always obese (27, 39, 47). A more complete model of the gut microbiome and insulin dynamics would be possible by comparing the microbiomes of both lean and obese horses with a wider range of insulin levels.
While gut microbiome differences were seen in horses based on diet, it was not possible to associate feed with BCS as it is a driver for management decisions, especially given the relatively small numbers of owners and the consistency of their feeding patterns. The obese BCS horses were largely being fed hay or pasture only, and the lean and normal BCS horses were consuming hay/concentrate, resulting in a significant association between owner and feed (Table 6). Significant correlations were also noted based on age, but were inconclusive since the categories were broadly divided and included no horse above 20 years. Managing older horses will continue to be a challenge in the future as the numbers of aged horses increases, therefore future work to identify bacteria correlated with obesity and blood markers associated with age-related metabolic issues is warranted.
This research points to differences in the gut microbiomes of lean, normal, and obese horses that are significantly correlated to key blood analytes associated with BCS. Network analysis points to signature species for each body condition category, laying the foundation for experiments leading to a mechanistic understanding, and more targeted microbial solutions to the issue of obesity and metabolic syndrome in horses.
Ethics Statement
This study was carried out in accordance with the recommendations of the USDA Animal Welfare Act and the NIH Public Health Service Policy on the Humane Care and Use of Animals, University of Illinois Institutional Animal Care and Use Committee (IACUC). The protocol was approved by the University of Illinois Institutional Animal Care and Use Committee (IACUC).
Author Contributions
AB obtained and prepared blood and fecal samples, gained funding, analyzed 16S rRNA sequence data, and wrote the manuscript. J-FT and ZF performed the pairwise correlation analysis in JMP and prepared the Cytoscape networks.
Conflict of Interest Statement
The authors declare that the research was conducted in the absence of any commercial or financial relationships that could be construed as a potential conflict of interest.
Acknowledgments
Thanks to the following people for assistance in obtaining samples: Megan Shepherd and Scott Pleasant (Virginia-Maryland College of Veterinary Medicine), Carlos Gradil (University of Massachusetts, Amherst), Ellyn Tighe (Plymouth Animal Hospital, Plymouth, NH), and Scott Austin (University of Illinois College of Veterinary Medicine). This project was funded, in part, by the USDA-NIFA Post-Doctoral Fellowship: 2015-67012-22767.
Supplementary Material
The Supplementary Material for this article can be found online at: https://www.frontiersin.org/articles/10.3389/fvets.2018.00225/full#supplementary-material
References
1. Argenzio RA, Southworth M, Stevens CE. Sites of organic acid production and absorption in the equine gastrointestinal tract. Am J Physiol. (1974) 226:1043–50. doi: 10.1152/ajplegacy.1974.226.5.1043
2. Glinsky MJ, Smith RM, Spires HR, Davis CL. Measurement of volatile fatty acid production rates in the cecum of the pony. J Anim Sci. (1976) 42:1465–70. doi: 10.2527/jas1976.4261465x
3. Costa MC, Arroyo LG, Allen-Vercoe E, Stämpfli HR, Kim PT, Sturgeon A, et al. Comparison of the fecal microbiota of healthy horses and horses with colitis by high throughput sequencing of the V3-V5 region of the 16S rRNA gene. PLoS ONE (2012) 7:e41484. doi: 10.1371/journal.pone.0041484
4. Costa MC, Silva G, Ramos RV, Staempfli HR, Arroyo LG, Kim P, et al. Characterization and comparison of the bacterial microbiota in different gastrointestinal tract compartments in horses. Vet J. (2015) 205:74–80. doi: 10.1016/j.tvjl.2015.03.018
5. Dougal K, Harris PA, Edwards A, Pachebat JA, Blackmore TM, Worgan HJ, et al. A comparison of the microbiome and the metabolome of different regions of the equine hindgut. FEMS Microbiol Ecol. (2012) 82:642–52. doi: 10.1111/j.1574-6941.2012.01441.x
6. Dougal K, de la Fuente G, Harris PA, Girdwood SE, Pinloche E, Newbold CJ. Identification of a core bacterial community within the large intestine of the horse. PLoS ONE (2013) 8:e77660. doi: 10.1371/journal.pone.0077660
7. Shepherd ML, Swecker WS, Jensen RV, Ponder MA. Characterization of the fecal bacteria communities of forage-fed horses by pyrosequencing of 16S rRNA V4 gene amplicons. FEMS Microbiol Lett. (2012) 326:62–8. doi: 10.1111/j.1574-6968.2011.02434.x
8. Daly K, Proudman CJ, Duncan SH, Flint HJ, Dyer J, Shirazi-Beechey SP. Alterations in microbiota and fermentation products in equine large intestine in response to dietary variation and intestinal disease. Br J Nutr. (2011) 107:989–95. doi: 10.1017/S0007114511003825
9. Dougal K, de la Fuente G, Harris PA, Girdwood SE, Pinloche E, Geor J, et al. (2014). Characterisation of the faecal bacterial community in adult and elderly horses fed a high fibre, high oil or high starch diet using 454 pyrosequencing. PLoS ONE 9:e87424. doi: 10.1371/journal.pone.0087424
10. de Fombelle A, Julliand V, Drogoul C, Jacotot E. Characterization of the microbial and biochemical profile of the different segments of the digestive tract in horses given two distinct diets. Acta Agric Scand Secion Anim Sci. (2003) 77:293–304. doi: 10.1017/S1357729800059038
11. Shirazi-Beechey SP. Molecular insights into dietary induced colic in the horse. Equine Vet J. (2008) 40:414–21. doi: 10.2746/042516408X314075
12. Elzinga SE, Weese JS, Adams AA. Comparison of the fecal microbiota in horses with equine metabolic syndrome and metabolically normal controls fed a similar all-forage diet. J Equine Vet Sci. (2016) 44:9–16. doi: 10.1016/j.jevs.2016.05.010
13. de Fombelle A, Julliand V, Drogoul C, Jacotot E. Feeding and microbial disprders in horses: 1-Effects of an abrupt incorporation of two levels of barley in a hay diet on microbial profile and activities. J Equine Vet Sci. (2001) 21:439–45. doi: 10.1016/S0737-0806(01)70018-4
14. Muhonen S, Julliand V, Lindberg JE, Bertilsson J, Jansson A. Effects on the equine colon ecosystem of grass silage and haylage diets after an abrupt change from hay. J Anim Sci. (2009) 87:2291–8. doi: 10.2527/jas.2008-1461
15. Louis P, Scott KP, Duncan SH, Flint HJ. Understanding the effects of diet on bacterial metabolism in the large intestine. J Appl Microbiol. (2007) 102:1197–208. doi: 10.1111/j.1365-2672.2007.03322.x
16. Respondek F, Goachet AG, Julliand V. Effects of dietary short-chain fructooligosaccharides on the intestinal microflora of horses subjected to a sudden change in diet. J Anim Sci. (2007) 86:316–23. doi: 10.2527/jas.2006-782
17. Elzinga S, Nielsen BD, Schott HC, Rapson J, Robison CI, McCutcheon J, et al. Comparison of nutrient digestibility between adult and aged horses. J Equine Vet Sci. (2014) 34:1164–9. doi: 10.1016/j.jevs.2014.06.021
18. Park K-D, Park J, Ko J, Kim BC, Kim H-S, Ahn K, et al. Whole transcriptome analyses of six thoroughbred horses before and after exercise using RNA-Seq. BMC Genomics (2012) 13:473. doi: 10.1186/1471-2164-13-473
19. Willing B, VöRöS A, Roos S, Jones C, Jansson A, Lindberg JE. Changes in faecal bacteria associated with concentrate and forage-only diets fed to horses in training. Equine Vet J. (2009) 41:908–14. doi: 10.2746/042516409X447806
20. Robin CA, Ireland JL, Wylie CE, Collins SN, Verheyen KLP, Newton JR. Prevalence of and risk factors for equine obesity in Great Britain based on owner-reported body condition scores: prevalence of and risk factors for equine obesity in Great Britain. Equine Vet J. (2015) 47:196–201. doi: 10.1111/evj.12275
21. Thatcher CD, Pleasant RS, Geor RJ, Elvinger F, Negrin KA, Franklin J, et al. Prevalence of obesity in mature horses: an equine body condition study. J Anim Physiol Anim Nutr. (2008) 92:222. doi: 10.1111/j.1439-0396.2007.00789_8.x
22. Thatcher CD, Pleasant RS, Geor RJ, Elvinger F. Prevalence of overconditioning in mature horses in southwest virginia during the summer. J Vet Intern Med. (2012) 26:1413–8. doi: 10.1111/j.1939-1676.2012.00995.x
23. Wyse A, McNie KA, Tannahil VJ, Love S, Murray JK. Prevalence of obesity in riding horses in Scotland. Vet Rec. (2008) 162:590–1. doi: 10.1136/vr.162.18.590
24. Henneke DR, Potter GD, Kreider JL, Yeates BF. Relationship between condition score, physical measurements and body fat percentage in mares. Equine Vet J. (1983) 15:371–2. doi: 10.1111/j.2042-3306.1983.tb01826.x
26. Frank N. Insulin resistance in horses. In: American Association of Equine Practitioners Proceedings. Seattle, WA (2006). 51–4.
27. Frank N, Elliott SB, Brandt LE, Keisler DH. Physical characteristics, blood hormone concentrations, and plasma lipid concentrations in obese horses with insulin resistance. J Am Vet Med Assoc. (2006) 228:1383–90. doi: 10.2460/javma.228.9.1383
28. Kronfeld DS, Treiber KH, Hess TM, Boston RC. Insulin resistance in the horse: definition, detection, and dietetics. J Anim Sci. (2005) 83:E22–31. doi: 10.2527/2005.8313_supplE22x
29. Vick MM, Adams AA, Murphy BA, Sessions DR, Horohov DW, Cook RF, et al. Relationships among inflammatory cytokines, obesity, and insulin sensitivity in the horse. J Anim Sci. (2007) 85:1144–55. doi: 10.2527/jas.2006-673
30. Walsh DM, McGowan CM, McGowan T, Lamb SV, Schanbacher BJ, Place NJ. Correlation of plasma insulin concentration with Laminitis Score in a field study of Equine Cushing's Disease and Equine Metabolic Syndrome. J Equine Vet Sci. (2009) 29:87–94. doi: 10.1016/j.jevs.2008.12.006
31. Agne B. Laminitis: recognition of at-risk individuals, and methods of prevention. J Equine Vet Sci. (2010) 30:471–4. doi: 10.1016/j.jevs.2010.07.012
32. Carter RA, Treiber KH, Geor RJ, Douglass L, Harris PA. Prediction of incipient pasture-associated laminitis from hyperinsulinaemia, hyperleptinaemia and generalised and localised obesity in a cohort of ponies. Equine Vet J. (2009) 41:171–8. doi: 10.2746/042516408X342975
33. Cymbaluk NF, Christison GI. Environmental effects on thermoregulation and nutrition of horses. Vet Clin North Am Equine Pract. (1990) 6:355–72. doi: 10.1016/S0749-0739(17)30546-1
34. Johnson PJ, Wiedmeyer CE, Ganjam VK. medical implications of obesity in horses—lessons for human obesity. J Diabetes Sci Technol. (2009) 3:163–74. doi: 10.1177/193229680900300119
35. Kearns CF, Mckeever KH, Kumagai K, Abe T. Fat-free mass is related to one-mile race performance in Elite standardbred horses. Vet J. (2002) 163:260–6. doi: 10.1053/tvjl.2001.0656
36. Kuyinu EL, Narayanan G, Nair LS, Laurencin CT. Animal models of osteoarthritis: classification, update, and measurement of outcomes. J Orthop Surg. (2016) 11:19. doi: 10.1186/s13018-016-0346-5
37. Norrdin RW, Kawcak CE, Capwell BA, McIlwraith CW. Subchondral bone failure in an equine model of overload arthrosis. Bone (1998) 22:133–9. doi: 10.1016/S8756-3282(97)00253-6
38. Bamford NJ, Potter SJ, Baskerville CL, Harris PA, Bailey SR. Effect of increased adiposity on insulin sensitivity and adipokine concentrations in different equine breeds adapted to cereal-rich or fat-rich meals. Vet J. (2016) 214:14–20. doi: 10.1016/j.tvjl.2016.02.002
39. Pleasant RS, Suagee JK, Thatcher CD, Elvinger F, Geor RJ. Adiposity, plasma insulin, leptin, lipids, and oxidative stress in mature light breed horses. J Vet Intern Med. (2013) 27:576–82. doi: 10.1111/jvim.12056
40. Ley RE, Turnbaugh PJ, Klein S, Gordon JI. Human gut microbes associated with obesity. Nature (2006) 444:1022–3. doi: 10.1038/4441022a
41. Turnbaugh PJ, Ley RE, Mahowald MA, Magrini V, Mardis ER, Gordon JI. An obesity-associated gut microbiome with increased capacity for energy harvest. Nature (2006) 444:1027–131. doi: 10.1038/nature05414
42. Turnbaugh PJ, Backhed F, Fulton L, Gordon JI. Diet-induced obesity is linked to marked but reversible alterations in the mouse distal gut microbiome. Cell Host Microbe (2008) 3:213–23. doi: 10.1016/j.chom.2008.02.015
43. Shepherd ML, Ponder MA, Burk AO, Milton SC, Swecker WS. Fibre digestibility, abundance of faecal bacteria and plasma acetate concentrations in overweight adult mares. J Nutr Sci. (2014) 3:1–11. doi: 10.1017/jns.2014.8
44. Cartmill JA, Thompson DL, Storer WA, Gentry LR, Huff NK. Endocrine responses in mares and geldings with high body condition scores grouped by high vs. low resting leptin concentrations 1. J Anim Sci. (2003) 81:2311–21. doi: 10.2527/2003.8192311x
45. Kearns CF, McKeever KH, Roegner V, Brady SM, Malinowski K. Adiponectin and leptin are related to fat mass in horses. Vet J. (2005) 172:460–5. doi: 10.1016/j.tvjl.2005.05.002
46. Pratt-Phillips SE, Owens KM, Dowler LE, Cloninger MT. Assessment of resting insulin and leptin concentrations and their association with managerial and innate factors in horses. J Equine Vet Sci. (2010) 30:127–33. doi: 10.1016/j.jevs.2010.01.060
47. Shepherd ML, Pleasant RS, Crisman MV, Werre SR, Milton SC, Swecker WS Jr. Effects of high and moderate non-structural carbohydrate hay on insulin, glucose, triglyceride, and leptin concentrations in overweight Arabian geldings: hay non-structural carbohydrates in overweight horses. J Anim Physiol Anim Nutr. (2012b) 96:428–35. doi: 10.1111/j.1439-0396.2011.01159.x
48. Braid MD, Daniels LM, Kitts CL. Removal of PCR inhibitors from soil DNA by chemical flocculation. J Microbiol Methods (2003) 52:389–93. doi: 10.1016/S0167-7012(02)00210-5
49. DeAngelis KM, Silver WL, Thompson AW, Firestone MK. Microbial communities acclimate to recurring changes in soil redox potential status. Environ Microbiol. (2010) 12:3137–49. doi: 10.1111/j.1462-2920.2010.02286.x
50. Griffiths RI, Whiteley AS, O'Donnell AG, Bailey MJ. Rapid method for coextraction of DNA and RNA from natural environments for analysis of ribosomal DNA-and rRNA-based microbial community composition. Appl Environ Microbiol. (2000) 66:5488–91. doi: 10.1128/AEM.66.12.5488-5491.2000
51. Caporaso JG, Lauber CL, Walters WA, Berg-Lyons D, Huntley J, Fierer N, et al. Ultra-high-throughput microbial community analysis on the Illumina HiSeq and MiSeq platforms. ISME J. (2012) 6:1621–4. doi: 10.1038/ismej.2012.8
52. Magoc T, Salzberg SL. FLASH: fast length adjustment of short reads to improve genome assemblies. Bioinformatics (2011) 27:2957–63. doi: 10.1093/bioinformatics/btr507
53. Caporaso JG, Kuczynski J, Stombaugh J, Bittinger K, Bushman FD, Costello EK, et al. QIIME allows analysis of high-throughput community sequencing data. Nat Methods (2010) 7:335–6. doi: 10.1038/nmeth.f.303
54. Biddle AS, Black SJ, Blanchard JL. An in vitro Model of the horse gut microbiome enables identification of lactate-utilizing bacteria that differentially respond to starch induction. PLoS ONE (2013) 8:e77599. doi: 10.1371/journal.pone.0077599
55. R Core Team. R: A Language and Environment for Statistical Computing. Vienna: R Foundation for Statistical Computing (2012).
56. Love MI, Huber W, Anders S. Moderated estimation of fold change and dispersion for RNA-Seq data with DESeq2. Genome Biol. (2014) 15:550. doi: 10.1186/s13059-014-0550-8
57. Buff PR, Dodds AC, Morrison CD, Whitley NC, McFadin EL, Daniel JA, et al. Leptin in horses: tissue localization and relationship between peripheral concentrations of leptin and body condition. J Anim Sci. (2002) 80:2942–8. doi: 10.2527/2002.80112942x
58. Menni C, Jackson MA, Pallister T, Steves CJ, Spector TD, Valdes AM. Gut microbiome diversity and high-fibre intake are related to lower long-term weight gain. Int J Obes. (2017) 41:1099–105. doi: 10.1038/ijo.2017.66
59. Divers TJ. Endocrine testing in horses: metabolic Syndrome and Cushing's Disease. J Equine Vet Sci. (2008) 28:315–6. doi: 10.1016/j.jevs.2008.04.004
60. Frank N, Geor RJ, Bailey SR, Durham AE, Johnson PJ. Equine metabolic syndrome. J Vet Intern Med. (2010) 24:467–75. doi: 10.1111/j.1939-1676.2010.0503.x
61. Fu J, Bonder MJ, Cenit MC, Tigchelaar EF, Maatman A, Dekens JA, et al. The Gut microbiome contributes to a substantial proportion of the variation in blood lipids. Circ Res. (2015) 117:817–24. doi: 10.1161/CIRCRESAHA.115.306807
62. Duvallet C, Gibbons SM, Gurry T, Irizarry RA, Alm EJ. Meta-analysis of gut microbiome studies identifies disease-specific and shared responses. Nat. Commun. (2017) 8:1784. doi: 10.1038/s41467-017-01973-8
63. Pu S, Khazanehei H, Jones PJ, Khafipour E. Interactions between obesity status and dietary intake of monounsaturated and polyunsaturated oils on human gut microbiome profiles in the Canola Oil Multicenter Intervention Trial (COMIT). Front Microbiol. (2016) 7:1612. doi: 10.3389/fmicb,.2016.01612
64. Yun Y, Kim H-N, Kim SE, Heo SG, Chang Y, Ryu S, et al. Comparative analysis of gut microbiota associated with body mass index in a large Korean cohort. BMC Microbiol. (2017) 17:151. doi: 10.1186/s12866-017-1052-0
65. Turnbaugh PJ, Hamady M, Yatsunenko T, Cantarel BL, Duncan A, Ley RE, et al. A core gut microbiome in obese and lean twins. Nature (2008) 457:480–4. doi: 10.1038/nature07540
66. Lin H, An Y, Hao F, Wang Y, Tang H. Correlations of fecal metabonomic and microbiomic changes induced by high-fat diet in the pre-obesity state. Sci Rep. (2016) 6:21618. doi: 10.1038/srep21618
67. Xiao S, Fei N, Pang X, Shen J, Wang L, Zhang B, et al. A gut microbiota-targeted dietary intervention for amelioration of chronic inflammation underlying metabolic syndrome. FEMS Microbiol Ecol. (2014) 87:357–67. doi: 10.1111/1574-6941.12228
Keywords: equine gut microbiome, obesity, 16S rRNA, network analysis, insulin, leptin, triglycerides, glucose
Citation: Biddle AS, Tomb J-F and Fan Z (2018) Microbiome and Blood Analyte Differences Point to Community and Metabolic Signatures in Lean and Obese Horses. Front. Vet. Sci. 5:225. doi: 10.3389/fvets.2018.00225
Received: 15 May 2018; Accepted: 29 August 2018;
Published: 20 September 2018.
Edited by:
Timothy J. Johnson, University of Minnesota Twin Cities, United StatesReviewed by:
Charlotte Sandersen, Université de Liège, BelgiumMaureen T. Long, University of Florida, United States
Copyright © 2018 Biddle, Tomb and Fan. This is an open-access article distributed under the terms of the Creative Commons Attribution License (CC BY). The use, distribution or reproduction in other forums is permitted, provided the original author(s) and the copyright owner(s) are credited and that the original publication in this journal is cited, in accordance with accepted academic practice. No use, distribution or reproduction is permitted which does not comply with these terms.
*Correspondence: Amy S. Biddle, YXNiaWRkbGVAdWRlbC5lZHU=