- 1Department of Obstetrics, Gynecology, and Reproductive Sciences, Division of Female Pelvic Medicine and Reconstructive Surgery, University of California San Diego, La Jolla, CA, United States
- 2Department of Urology, Division of Female Pelvic Medicine and Reconstructive Surgery, University of California San Diego, La Jolla, CA, United States
Introduction: Video urodynamic studies (VUDS) use fluoroscopic imaging to visualize the bladder and multichannel urodynamics to assess its function. Qualitative assessment of bladder shape is used to identify abnormal features (e.g., diverticula) that correspond with pathophysiology; however, this assessment is limited in its ability to predict bladder function. Therefore, we developed a novel quantitative approach to assess bladder shape obtained from fluoroscopic VUDS images utilizing statistical shape modeling. This method was compared to existing binary and continuous shape quantification methods and used to identify relationships between bladder shape and measures of bladder physiology categorized as related to sensation, incontinence, or emptying.
Methods: This was a retrospective, cross-sectional study of 49 participants. Bladder walls were segmented from fluoroscopic images at rest with the bladder filled to approximately 300 mL. Bladder shape was evaluated in three ways: 1) binary categorization as typical or atypical based on clinical assessment, 2) quantification of height-to-width ratios, and 3) quantification by statistical shape modeling. Independent t-tests and correlations were used to assess associations between the three shape evaluation methods and to define relationships between shape and physiologic measures: 3 volumetric measures describing sensation, 2 dichotomous variables addressing incontinence, and 1 volumetric measure representing emptying.
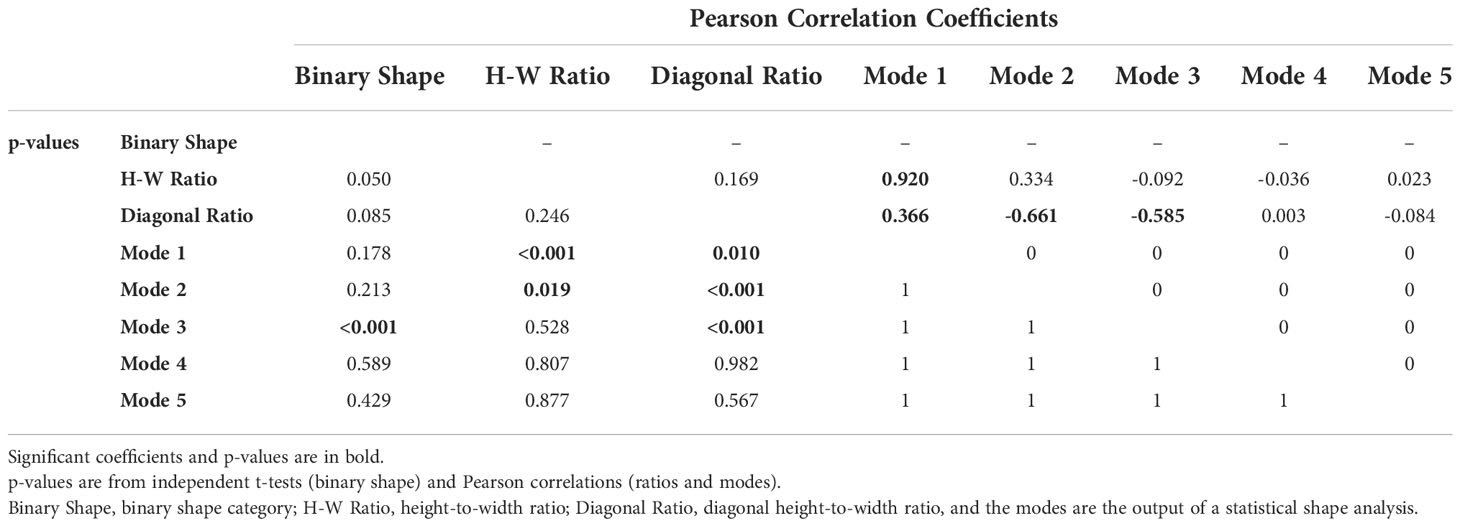
Results: The statistical shape model generated 5 modes of variation. Mode 1 corresponded with height-to-width ratio (r=0.920, p<0.001), modes 2 and 3 with diagonal height-to-width ratio (r=0.66 and -0.585, p<0.001 and <0.001), and mode 3 with binary shape categorization (p<0.001). In terms of function, those with atypical bladder shape had impaired emptying (p=0.010), modes 4 and 5 were significantly associated with measures of bladder sensation, mode 3 with urodynamic stress urinary incontinence, and mode 3 with emptying in those able to void (r=0.368, p=0.021). The relationship between mode 3 and emptying across all patients is best fitted by a quadratic function (p<0.001).
Discussion: Our results demonstrate that binary shape categorization and bladder shape quantified by statistical shape modeling correspond with measures of bladder physiology. This foundational study establishes statistical shape modeling as a robust bladder shape quantification method that can be used to relate bladder shape with physiology.
Introduction
Multichannel video urodynamic studies (VUDS) play an important role in the evaluation of multiple urologic conditions, including impaired bladder compliance, urinary retention, and various forms of urinary incontinence. To date, clinicians have relied upon qualitative assessment of the radiographic images in VUDS to observe abnormalities in bladder shape (such as diverticula, vesicoureteral reflux, and bladder wall thickening) that are correlated with the urodynamic tracing in the storage and voiding phase of the study. Fluoroscopic images of bladders with longstanding impaired compliance may demonstrate a characteristic appearance with cephalad elongation and severely thickened trabeculations and diverticula. While the value of adding these fluoroscopic images to multichannel urodynamics has been described in certain situations, there is no current method to detect subtle alterations in bladder shape that may predict early changes in bladder function.
In animal models, bladder shape has been shown to impact bladder pressure-volume curves independent of material properties, suggesting that subtle alterations in bladder shape may precede alterations in bladder function and biomechanical properties (1). Existing literature has begun to examine quantitative methods for assessment of bladder shape via ultrasound in humans (2, 3). These studies have focused on quantitative assessment via a height-to-width ratio and their association with patient-reported symptoms of overactive bladder (2). Additionally, nomograms of bladder shape have been investigated for patient-reported symptoms of overactive bladder (4). Ultrasound determined bladder “sphericity indices” have been associated with bladder contractions in a single study (5); however, additional studies with precise quantitative methods are needed to associate bladder shape with objective urodynamic measurements indicative of function.
Statistical shape modeling is a process that can quantify shape variation across a group of complex objects. It implements a principal component analysis on closely aligned shapes to determine modes of variation that provide both quantitative and qualitative descriptions of shape variance. This approach has been widely applied to bony anatomy and, more recently, has been used for the robust assessment of female pelvic organs and soft tissues (e.g., urethra and pelvic floor muscles) (6–9). Although it has been used to develop surgical planning and automatic segmentation tools for the bladder (10, 11), statistical shape modeling has not yet been applied to the study of bladder shape variation and function but has the potential to detect previously undetectable alterations in bladder shape via the quantification of fluoroscopic images. Additionally, although previous studies have examined the relationship between bladder shape visualized by ultrasound and symptoms of overactive bladder – no study has examined the relationship between bladder shape and measures of bladder physiology including bladder sensation, urodynamically demonstrated incontinence, and emptying.
The aims of this study were 1) to develop a novel quantitative analytic approach for assessment of bladder shape using radiographic imaging and statistical shape modeling and 2) to determine what relationship exists between bladder shape (evaluated using 3 different methods) and bladder physiologic measures including sensation, incontinence [urodynamic stress urinary incontinence (UDSI) and detrusor overactivity (DO)], and emptying.
Materials and methods
This was an IRB-approved cross-sectional study (UC San Diego IRB 191728X). Consecutive female participants with diagnoses of lower urinary tract symptoms (LUTS) undergoing video urodynamic study (VUDS) as part of their clinical care by were included. All VUDS were performed in the seated position. Patient demographics and existing fluoroscopic/video urodynamic images were extracted from the electronic medical record. Exclusion criteria included history of surgical modification of bladder wall (specifically bladder segmentation/augmentation), active urologic malignancy, and symptomatic urinary tract infection. Participants with ureteral reimplantation were included. Fluoroscopic images obtained were excluded if the entire bladder contour was not visible, pubic symphysis was not visible, or bladder and pubic symphysis were not aligned midsagittally (i.e., images were taken from a lateral angle precluding alignment via anatomic markers).
For the purpose of this study, fluoroscopic images at rest with the bladder filled to approximately 300 mL or maximal cystometric capacity (if less than 300 mL) were used. These images were considered representative of a moderately full bladder. Each image was qualitatively assessed by two experienced blinded clinicians, and bladders were categorized dichotomously as either typical or atypical based on the presence of one or more bladder wall abnormalities (i.e., diverticula or trabeculations). No disagreement in assessment occurred between clinicians.
For quantitative evaluation of bladder shape via computational analyses, the bladders were manually outlined in ImageJ by a researcher blinded to patient demographics and the binary shape categorization (12). Lines representing the orientation of the pubic symphysis were also drawn for later rotational alignment (Figure 1). Using a custom Mathematica script (v12.3.1, Wolfram Research, Champaign, IL, USA), the images of these bladder outlines were converted to 2D polylines with each bladder being defined by 400 evenly distributed points. These polylines were centered based on each shape’s centroid and rotated such that each pubic symphysis line was vertical. Deformetrica (13) was utilized to calculate corresponding points—meaning points that correspond to the same anatomical landmarks. This redistributes the original 400 points such that point X on each shape corresponds to the same anatomical position along the bladder wall (e.g., the bladder neck). Once corresponding points were established, a Procrustes analysis implemented in Mathematica was used to align bladder images (14). This is a process that removes differences due to translation, rotation, and scale by minimizing the distances between corresponding points across all shapes. These corresponding, aligned bladders were used in the quantification of height-to-width ratios and the statistical shape analysis.
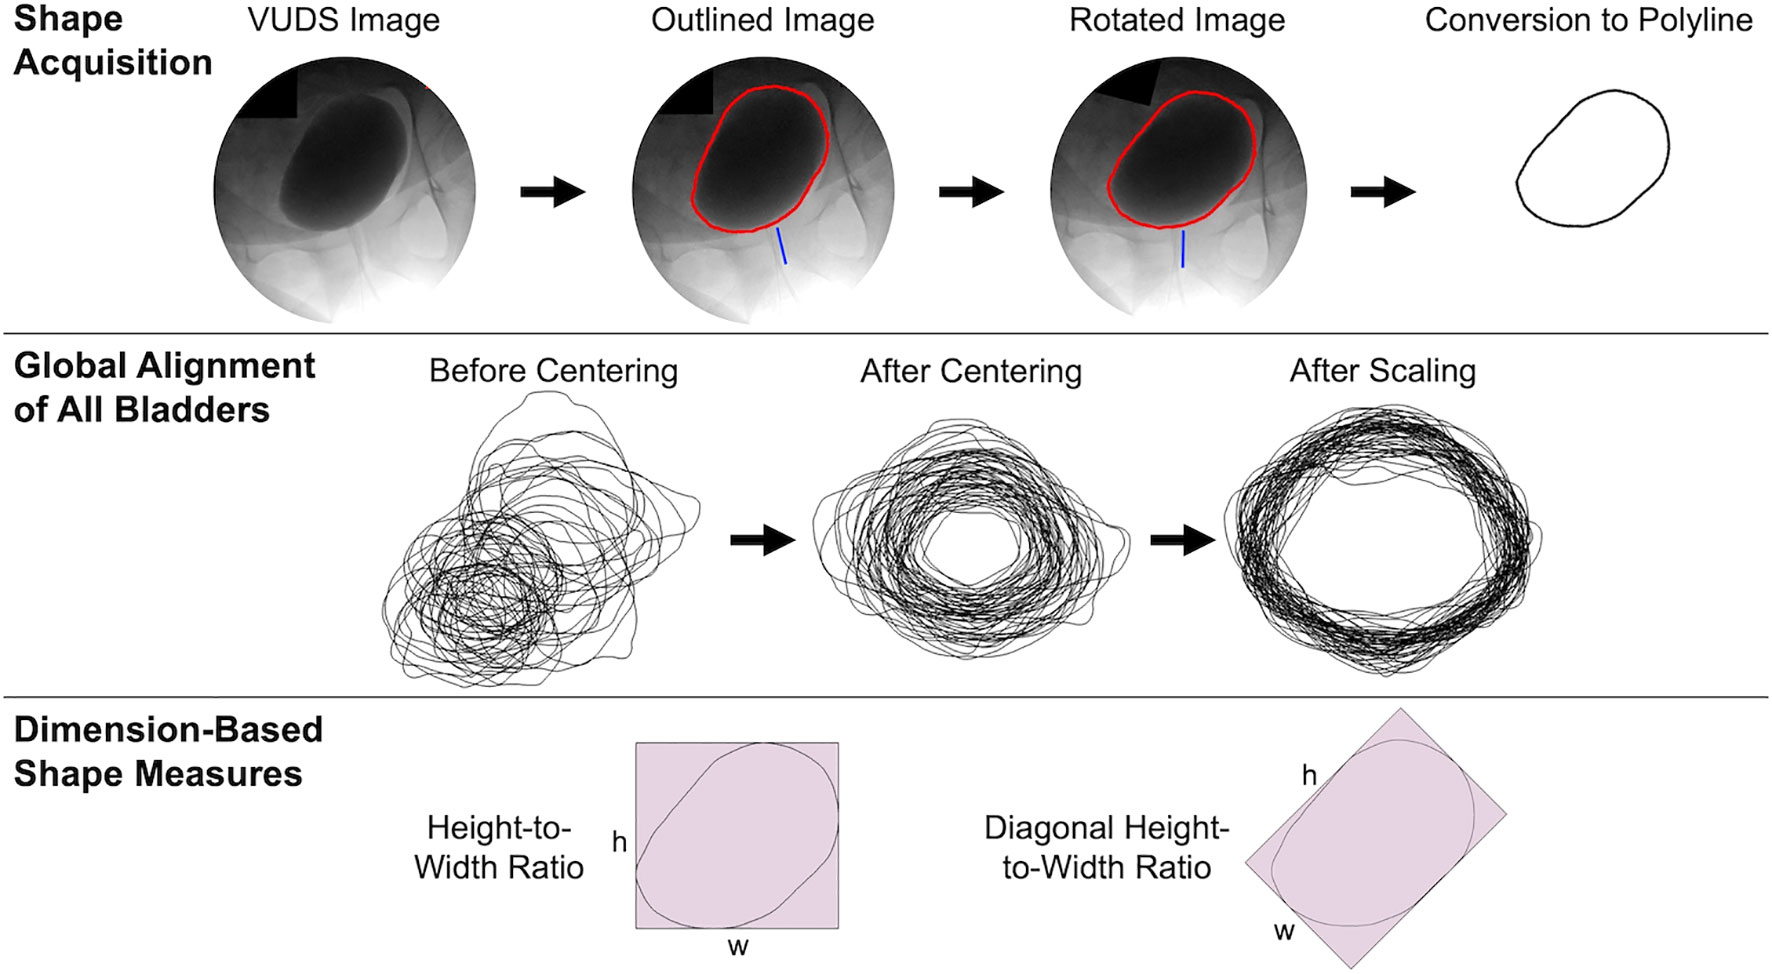
Figure 1 A schematic demonstrating the major shape acquisition and global alignment steps and height-to-width ratio measurement methods. The top row depicts, from left to right, 1) an example of a fluoroscopic image from a VUDS cropped into a circle, 2) the outline of the bladder wall (red) and identification of the main axis of the pubic symphysis (blue) on that same image, 3) the final orientation of that image/bladder after it was rotated so that the pubic symphysis axis was vertical, and 4) that bladder outline after being converted to a polyline. The middle row depicts all 49 bladders left) in their original positions, middle) after being centered (translated to the same origin), and right) after being globally scaled (to the average size). The bottom row depicts how the height-to-width ratio was quantified by fitting a rectangle to the aligned bladder shape, calculating the height and width of that rectangle, then dividing the height by the width. The diagonal height-to-width ratio (shown here with the bladder in its original orientation for straightforward comparison with the height-to-width ratio) was calculated similarly, except the rectangle was fit to the bladder at a 45° angle.
The bladder height-to-width ratio was established by a previous study (2). The height-to-width ratio is the height (superior-inferior distance) divided by the width (lateral distance) of the bladder. Values greater than 1 indicate proportionally taller/thinner and values smaller than 1 indicate proportionally wider/shorter bladders. In this study, to increase repeatability and automate this measure, the height and width were determined by fitting a rectangle to the bladder (with the bladder neck centered on the inferior edge) and then taking the height and width of that rectangle (Figure 1). It should be noted that the previous implementation of this measure did not scale the bladders first, but that scaling does not affect this measure as it is a ratio of two orthogonal line segments. If only evaluating height and width individually, the global scaling applied by the Procrustes analysis would alter these values.
Statistical shape modeling was implemented here as a more robust evaluation of bladder shape, as it results in multiple, linearly independent outputs (referred to as modes of variation) for subsequent statistical analyses. A statistical shape analysis consists of a principal component (PC) analysis carried out on corresponding, aligned shapes (9). Here this was performed using a custom Mathematica script (15). This generates modes of variation each defined by an eigenvector and eigenvalue and their visualization in 3D space that qualitatively describe shape variation and allow for quantitative comparisons. Each shape has PC scores that represent where that bladder falls along each mode. The data used to build these modes of variation is normally distributed about 0 along each mode. Values further from 0 represent more deviation from the mean shape and the mean shape has a PC score of 0 for each significant mode. A PC analysis results in as many modes as input shapes minus 1, but a mode is only considered significant if it explains more variance than that described by the noise of the dataset. A parallel analysis was used to calculate this noise and determine which modes of variation described significant shape variance (16).
Urodynamic parameters of first desire, strong desire, and maximal cystometric capacity (MCC), abnormal storage and abnormal emptying were obtained from urodynamics reports. Bladder sensations were self-reported by patients during filling at the first desire to void, strong desire to void, and MCC. The presence of UDSI and DO was obtained from formal clinical urodynamic reports. Bladder emptying was assessed by non-instrumented (ie. non-intubated during attempted voiding) post void residual (PVR) as it represents a non-invasive continuous variable. Elevated PVRs can be found in a variety of bladder functional states and there was an excellent dynamic range in our study population. In all cases, participants were permitted to void at the beginning of the study for uroflow analysis and PVR was obtained by catheterization prior to placement if the voided volume was at least 150 mL. If the voided volume was at less than 150 mL, PVR was determined at the conclusion of the study. If the participant was unable to void with catheters in place, then they were removed and the participant was permitted to attempt to void an additional time and PVR was obtained by either subtraction or catheterization. If void on initial presentation was less than 150 mL and the patient emptied with intubated PVR, then the bladder was filled to approximately 300 mL and catheters were removed to permit a non-intubated voiding attempt. In all cases, PVR was non-intubated, and if the initial void was at least 150 mL, this PVR was obtained prior to intubation.
To assess how binary shape categories and continuous shape variables corresponded with one another, independent t-tests and correlations were performed in IBM SPSS Statistics v28 (International Business Machines Corporation, Armonk, NY, USA). To determine how each type of bladder shape quantification method corresponded with bladder function, first desire, strong desire, MCC, and PVR were compared across binary shape categories via independent t-tests and evaluated with respect to both sets of continuous shape variables via correlations. UDSI and DO were compared across binary shape categories and continuous shape variables via chi-square and independent t-tests, respectively.
Results
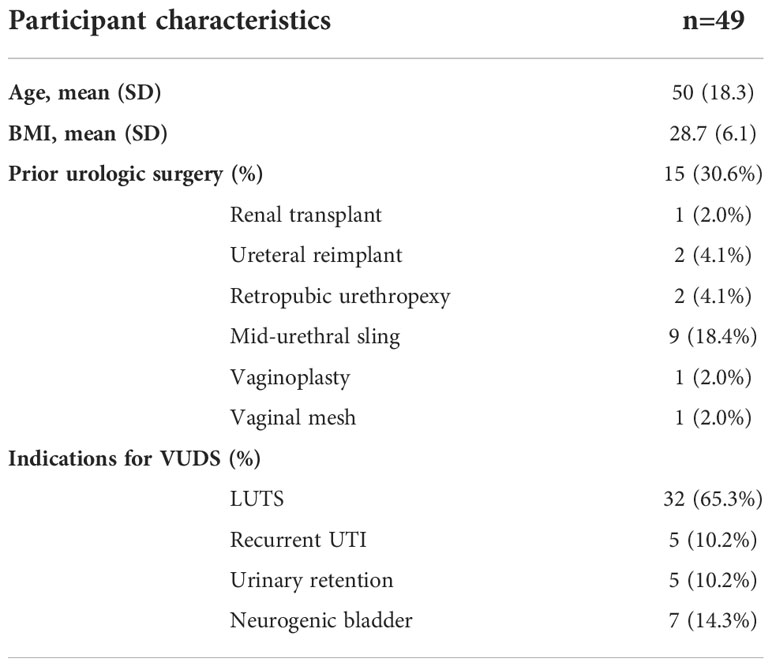
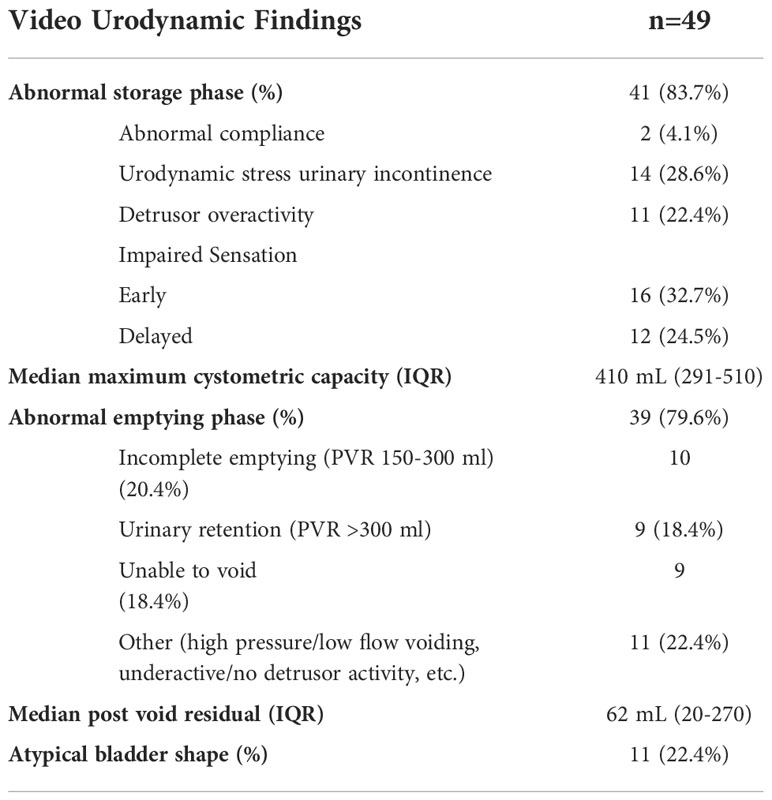
Bladder images were obtained for 49 participants (mean age 50 ± 18.3 years, mean BMI 28.7 ± 6.1 kg/m2) of which 30.6% had prior urologic surgery (N=1, 2.0% renal transplant; N=2, 4.1% ureteral reimplant; N=2, 4.1% retropubic urethropexy; N=9, 18.4% midurethral sling; N=1, 2.0% vaginoplasty; N=1, 2.0% vaginal mesh, Table 1). The most common indication for VUDS was lower urinary symptoms (LUTS, N=32, 65.3%) followed by neurogenic bladder (N=7, 14.3%), urinary retention (N=5, 10.2%), and recurrent urinary tract infection (N=5, 10.2%). On VUDS, 22.4% (N=11) had atypical bladder shape (Table 2). 83.7% (N=41) participants had abnormal storage with either abnormal compliance (N=2, 4.1%), stress urinary incontinence (N=14, 28.6%), and/or detrusor overactivity (N=11, 22.4%). Median cystometric capacity was 410 mL (IQR 291-510). 79.6% (N=39) had abnormal emptying and 18.4% (N=9) participants had urinary retention. Median PVR was 62 mL (IQR 20-270).
Statistical shape analysis revealed that 5 modes described significant bladder shape variation in this population. Modes 1, 2, 3, 4, and 5 explained 49.3%, 18.0%, 15.3%, 4.5%, and 3.5% of the total shape variance respectively. Visually, mode 1 corresponded to the height-to-width ratio (Figure 2). This was confirmed by a significant correlation between these variables (r=0.920, p<0.001, Table 3). However, neither mode 1 nor height-to-width ratio were correlated with any of the bladder sensation, incontinence, or emptying variables. Qualitatively, mode 2 and 3 described similar shape variation, with one appearing to be the vertical mirror of the other but with an inverse relationship, meaning a high mode 2 PC score is very similar to a low mode 3 PC score mirrored across a vertical line (Figure 3). However, it should be noted that although the qualitative descriptions seem analogous, modes 2 and 3 (like all modes of variation) are uncorrelated. These modes largely describe triangular shape variation where, from one end of the mode to the other, these triangles change between a classic triangle (pointing up) to an inverted triangle (pointing down). Unlike mode 1 that demonstrated horizontal and vertical variation, mode 2 and 3 seem to describe diagonal variation (along an axis that would be created by an X in the middle of the bladder). As height-to-width ratio so closely corresponded with mode 1, we aimed to define a similar variable that could correspond with modes 2 and 3. Since mode 1 can be thought of as variation along a t-shaped axis in the center of the bladder and modes 2 and 3 as variation along an x-shaped axis, we decided to recalculate the height-to-width ratio after rotating the bladders by 45° counterclockwise. This will be referred to as the diagonal height-to-width ratio. As designed, this modified height-to-width ratio was significantly correlated with modes 2 and 3 (r=-0.661 and -0.585, p<0.001, <0.001, respectively). Despite the similarities between the diagonal height-to-width ratio and modes 2 and 3, only mode 3 was related to binary shape categorization. Atypical shapes on average had more negative mode 3 PC scores (p<0.001, Figure 4), suggesting that bladders identified as atypical have a proportionally longer right superior-left inferior axis, a flatter right side, a more convex left inferior region, and are more triangularly-shaped (Figure 3). Modes 4 and 5 describe much more subtle shape variation. It should be noted that together they comprise roughly half of the percent of total variance that mode 3 does (8% vs 15%). Mode 4 describes variation from more of a square to more of a diamond shape, while mode 4 demonstrates variation in asymmetrical left vs right protrusions of the bladder. Modes 4 and 5 did not correspond with any other shape variables.
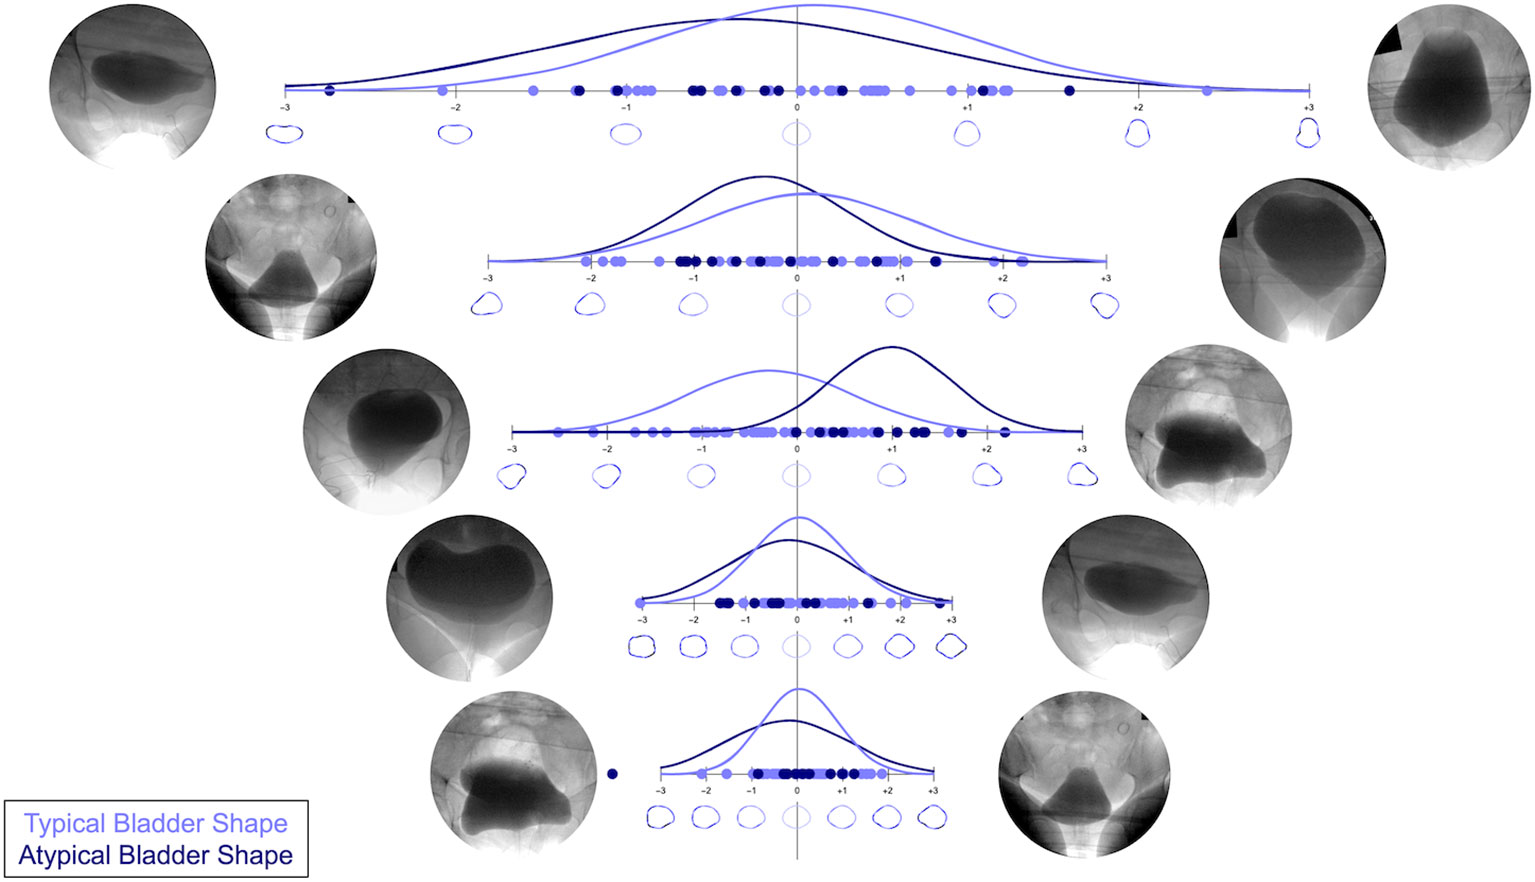
Figure 2 The 5 significant modes of variation generated by the statistical shape analysis. The fluoroscopic images of the bladders corresponding with the smallest (most negative) and largest (most positive) PC scores (dots) are shown to the left and right of each depicted eigenvector (line segment), respectively. The color-coded normal distribution curves and dots identify which bladders were labelled as atypical (dark blue) vs typical (light blue) and highlight the relationship between mode 3 and binary shape categorization. The mean bladder lies on the vertical line segment for each mode, while each shape 1, 2, and 3 standard deviations from that mean is shown. Darker regions of the bladder wall indicate more deviation and lighter regions less deviation from that mean shape.
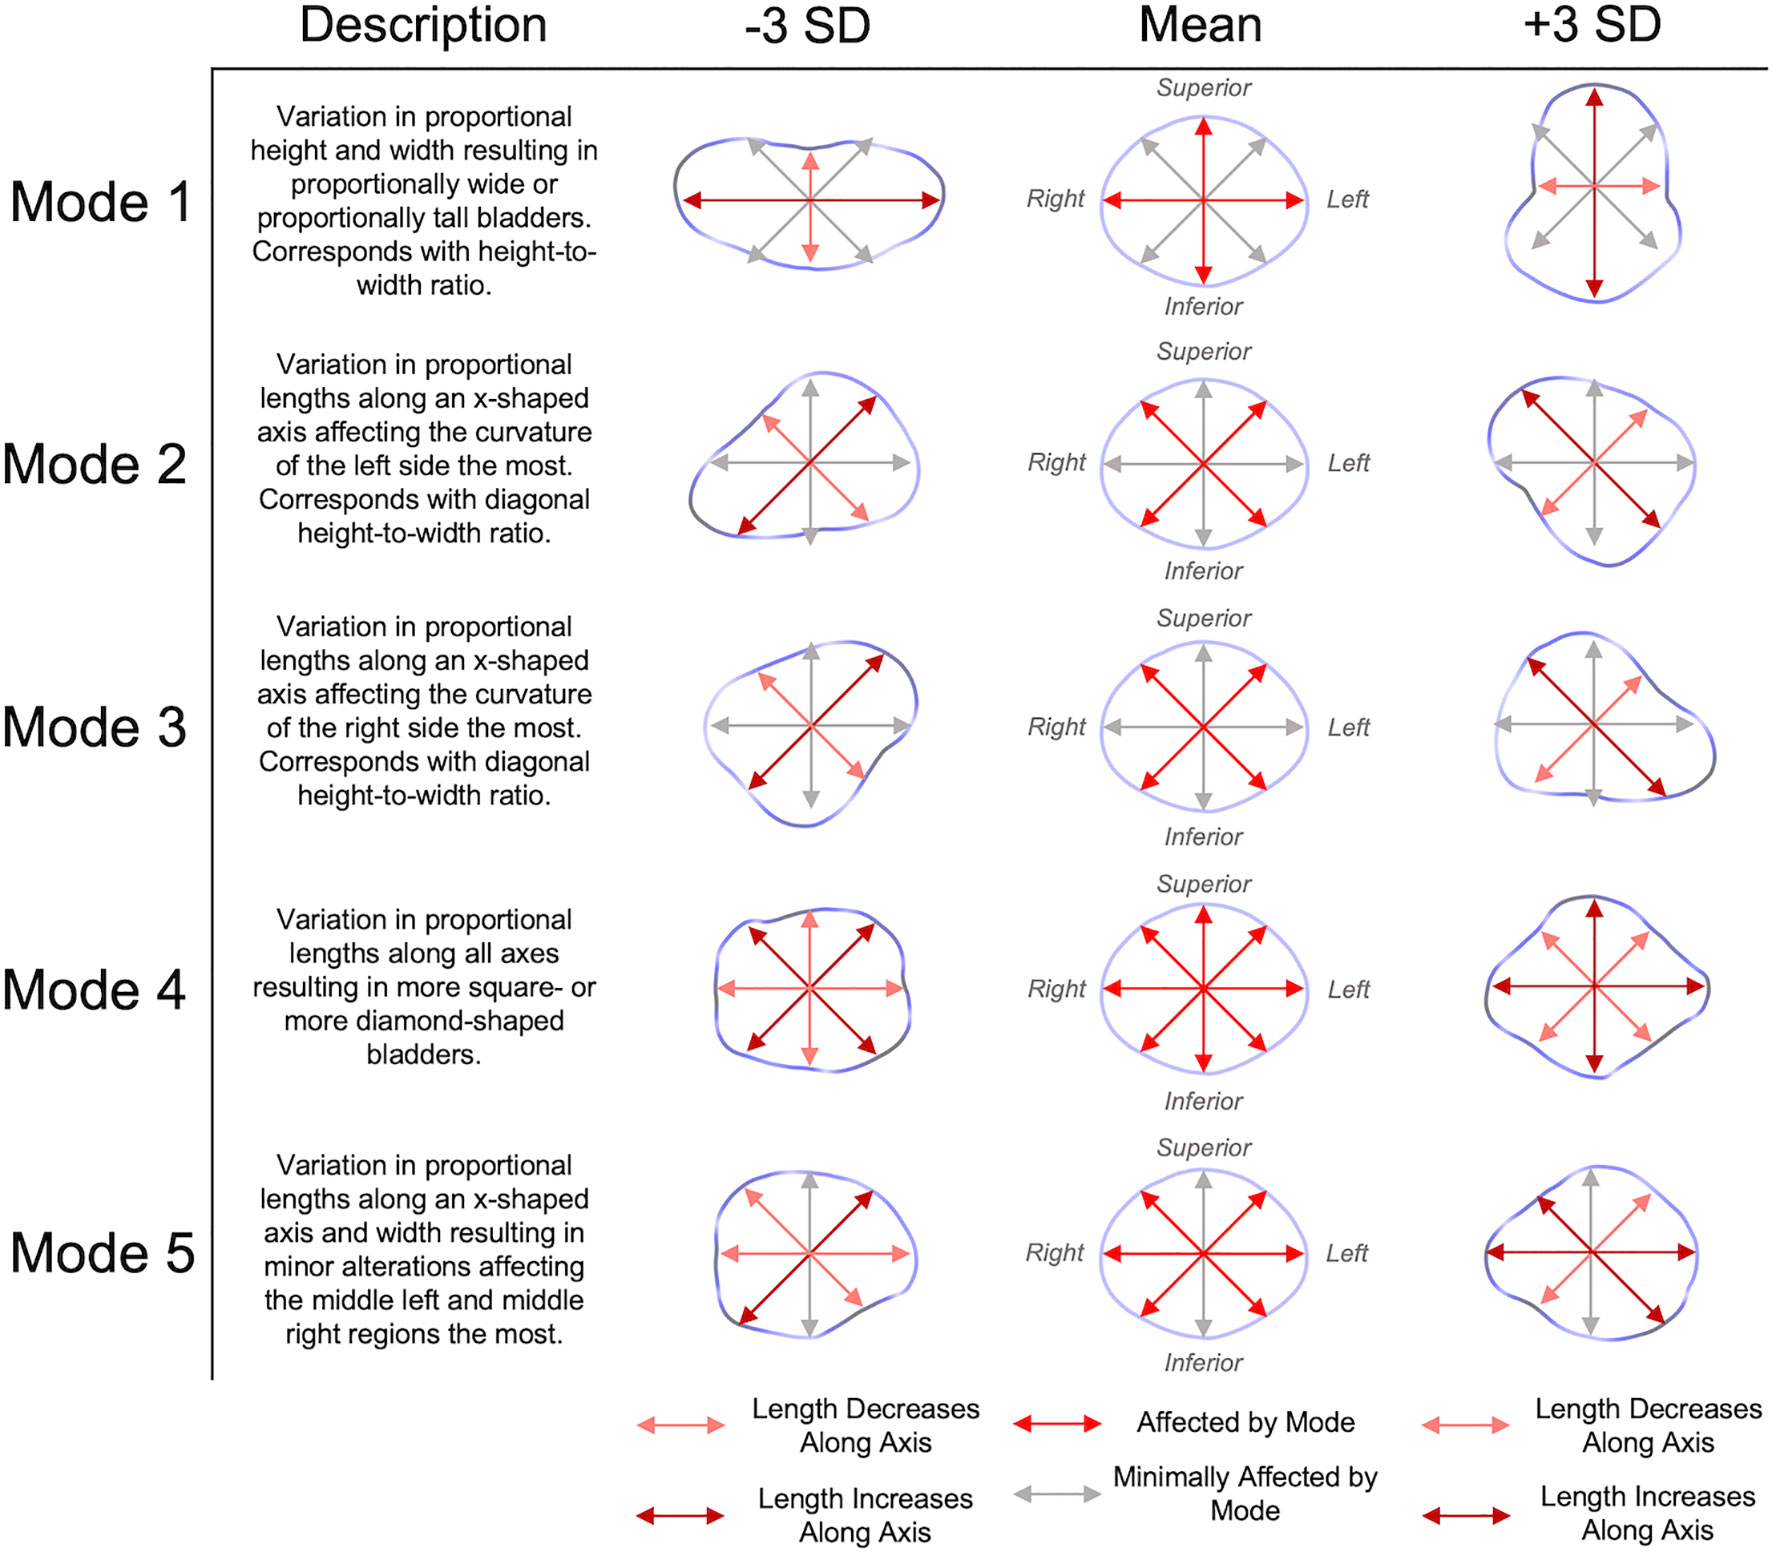
Figure 3 A table and images further explaining the specific types of bladder shape variation demonstrated by each mode. This includes a verbal description in addition to arrows highlighting the axes in which the bladder shape is varying along each mode. Gray arrows are not altered across any condition and denote axes that are minimally affected by each mode. Red arrows on the mean shape emphasize axes most influenced by each mode of variation. The shapes at each standard deviation (SD) are described by light red (indicating shorter) and dark red (indicating longer) axes (i.e., arrows) as you deviate from the mean shape in each direction along the eigenvectors.
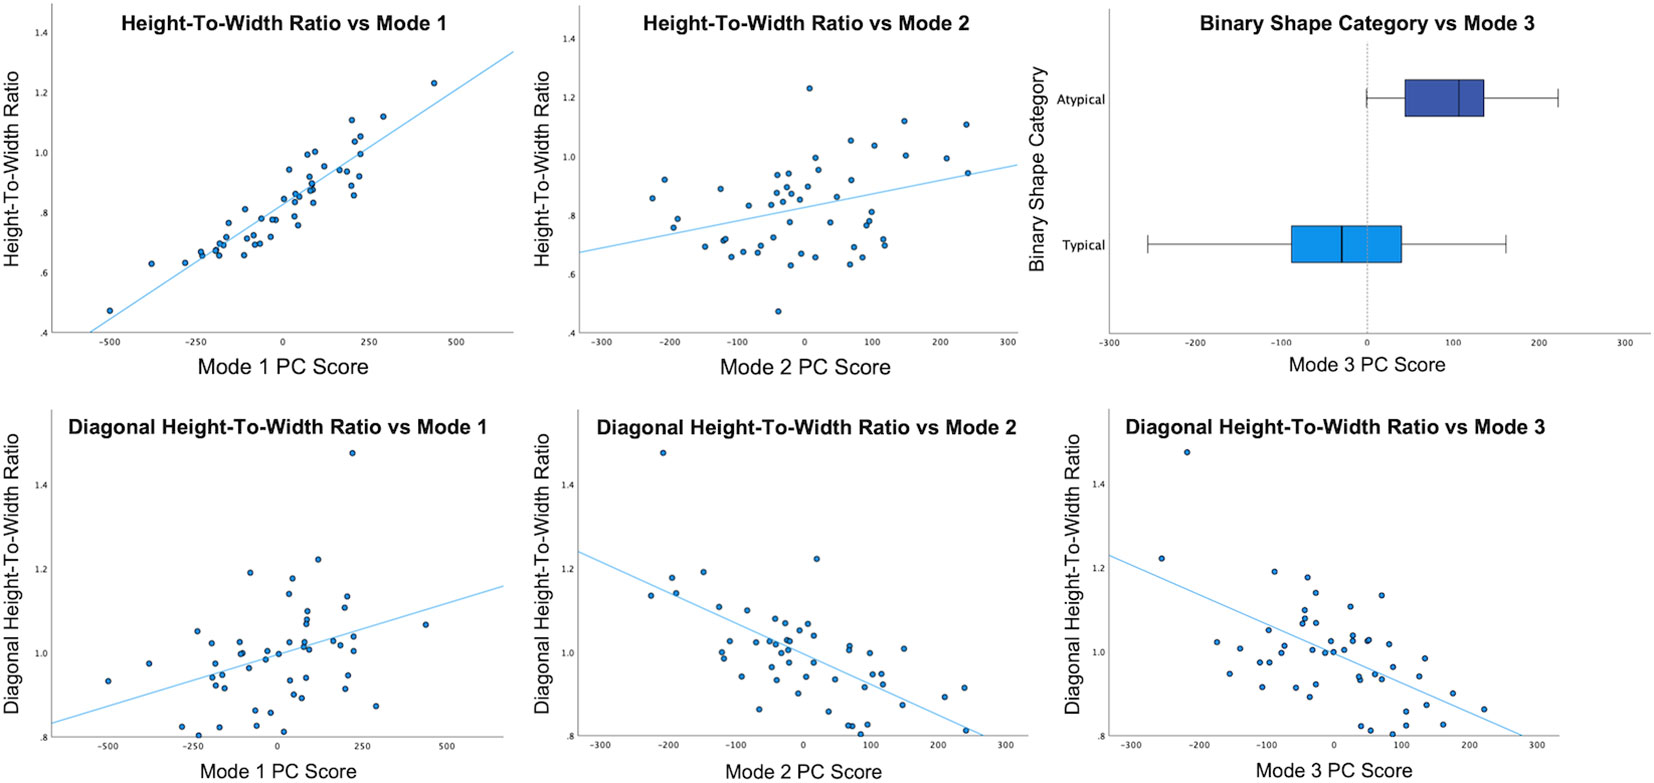
Figure 4 Scatter and boxplots demonstrating the significant relationships between bladder shape variables. The linear correlation between height-to-width ratio and modes 1 (p < 0.001) and 2 (p=0.019) was significant, although much more so for mode 1 (Table 3). The linear correlation between diagonal height-to-width ratio and modes 1 (p=0.010), 2 (p < 0.001), and 3 (p < 0.001) was also significant, but much more so for modes 2 and 3. Mode 3 PC scores significantly differed between binary shape categories (p < 0.001).
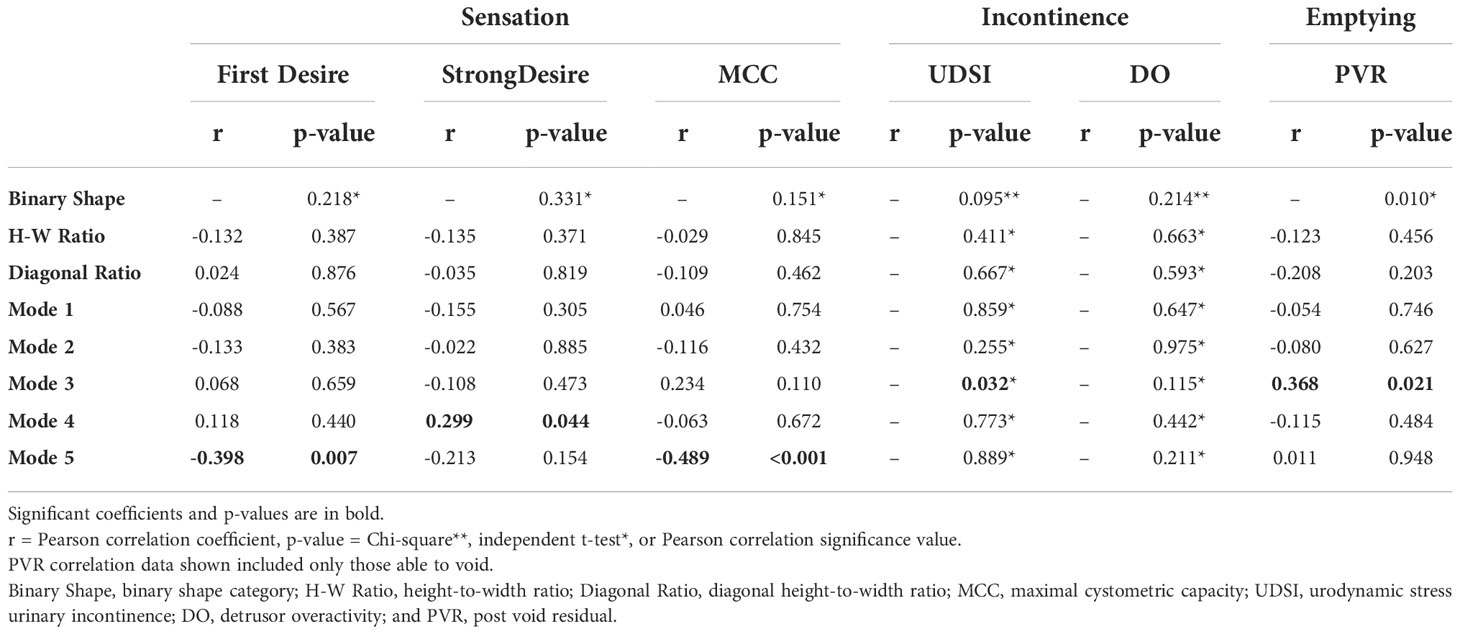
Next, we examined whether bladder shape (described by binary shape category, height-to-width ratios, or modes of variation) was associated with measures of bladder sensation (Table 4). First desire and MCC were correlated with mode 5 (r=-0.398 and -0.489, p= 0.007 and <0.001, respectively), while strong desire was correlated with mode 4 (r=0.299, p=0.044, Figure 5). Larger mode 5 PC scores (suggestive of a shorter right lateral wall) correspond with lower volumes at first desire and MCC. According to mode 4, a squarer bladder (rather than one that is more diamond-shaped) is associated with lower volumes with sensation of strong desire (Figure 2). Looking at incontinence, mode 3 was related to presence of UDSI, as participants with UDSI on average had more negative mode 3 PC scores (p=0.032, Figure 6). This suggests in those with stress urinary incontinence, the bladder has a proportionally longer right superior-left inferior axis, a flatter right side, a more convex left inferior region, and are more triangle-shaped. In contrast, no modes or other measures of shape examined were significantly correlated with the presence of DO. Meanwhile, binary shape categorization was correlated emptying (Figure 7). PVR was significantly lower (p=0.010) in shapes categorized as typical (121.0 ± 160.7 mL) vs those categorized as atypical (265.9 ± 223.2 mL). This indicated that shapes considered typical on average correspond with more adequate bladder emptying. Out of all considered continuous shape variables (ratios and modes of variation), modes 3 and 5 were significantly correlated with PVR (r=0.293 and -0.457, p=0.041 and <0.001, respectively) when all data was considered. Further visual inspection of the relationship between PVR and mode 3 revealed a potential nonlinear relationship between bladder shape and function that would not be adequately captured by a correlation (Figure 7). As mode 3 becomes more negative or positive, PVR increases, meaning that any deviation away from the mean is associated with reduced bladder emptying. This is visualized by a nonlinear U-shaped curve (a quadratic equation with R2 = 0.461, constant=71.155, beta coefficient1 = 0.728, and beta coefficient2 = 0.008) that was fit to this data (p<0.001), demonstrating a more optimal fit than a linear correlation and delineating bladder shape range along this mode associated with the lowest PVRs/optimal emptying. To remove potentially confounding effects due to pathophysiology, we repeated these correlations with only participants that were able to void (Table 4). In this analysis, mode 3 remained significantly correlated with PVR (r=0.368, p=0.021, Figure 7) and the relationship was more visibly linear. The relationship between PVR and mode 5 was affected and seems to be the result of a single influential point (a participant that was not able to void).

Figure 5 Scatter plots demonstrating the significant relationships between bladder shape variables and sensation, described by volume at first and strong desire to void and the maximal cystometric capacity (MCC). Mode 4 was linearly correlated with strong desire (p=0.044), while mode 5 corresponded with first desire and MCC (p=0.007 and < 0.001).
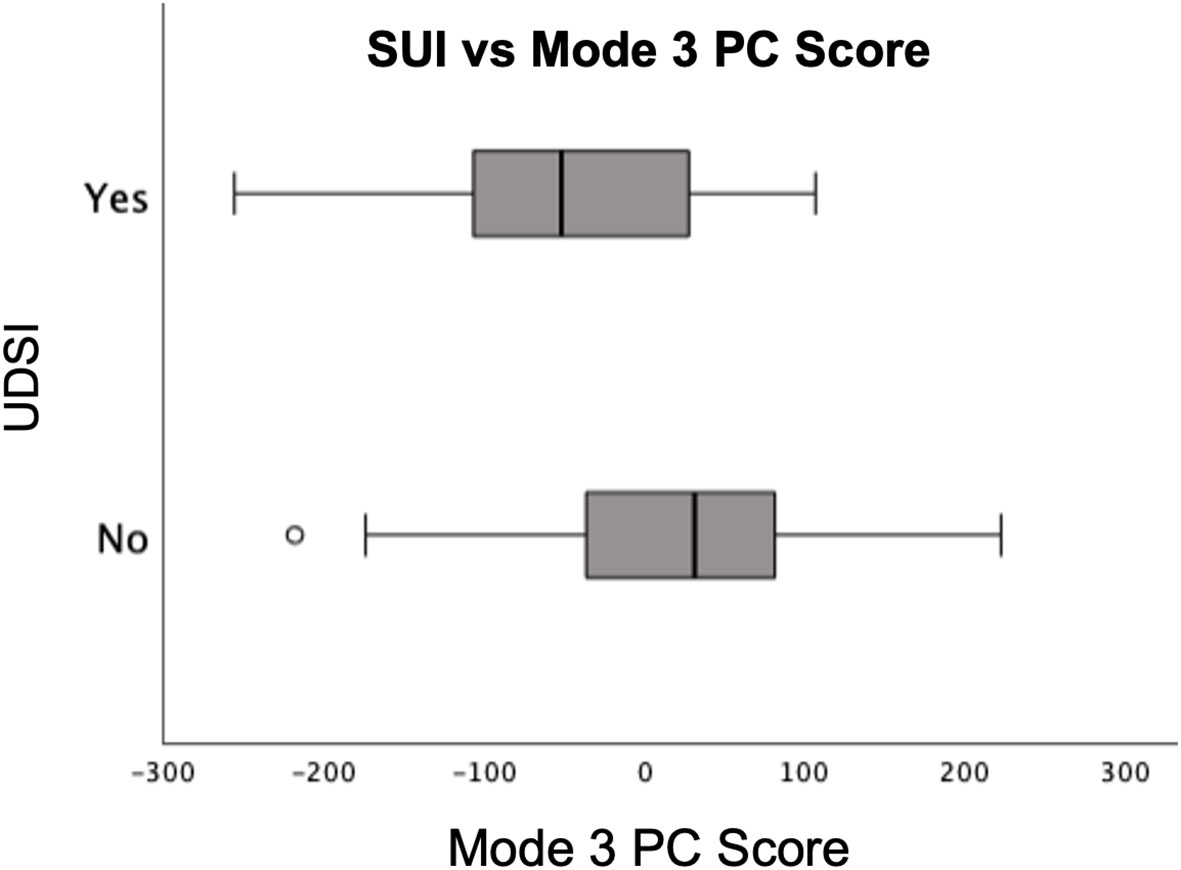
Figure 6 A boxplot demonstrating the significant relationship between bladder shape variables and incontinence, described by the presence/absence of urodynamic stress urinary incontinence (UDSI) and detrusor overactivity (DO). There was only a significant relationship between shape and UDSI. Those with UDSI had significantly smaller mode 3 PC scores than those without (p=0.032).

Figure 7 Scatter and boxplots demonstrating the significant relationships between bladder shape variables and emptying, described by post void residual (PVR). The linear correlations between PVR and modes 3 (p=0.041) and 5 (p < 0.001) were significant when all data was included, but only mode 3 (p=0.021) was significant when only those able to void were assessed. The description of the relationship between mode 3 and PVR was improved when a nonlinear regression was used (p < 0.001) highlighting the extreme points to the far left and right that demonstrate high PVR and large deviations from the mean bladder shape. PVR was also significantly larger in those with atypical bladder shapes (p=0.010).
Discussion
In this study, we developed a novel analytic approach to quantify bladder shape, determined this method’s efficacy in comparison to existing categorial and continuous shape evaluation methods, and associated bladder shape with multiple facets of bladder function. While binary shape categorization did correspond with emptying, categorical variables are limited in their predictive capability when compared to continuous variables. In contrast, statistical shape modeling is more quantitative and generated significant predictors of bladder sensation, UDSI, and PVR. Although the height-to-width ratios are also continuous and closely correspond with modes 1-3, they were not associated with bladder sensation, UDSI, or PVR. Existing literature has primarily focused on the relationship of single measures of bladder shape, including the height-to-width ratio and a variant on this described as a sphericity index (4, 5, 17). Here we expand on this literature to describe multiple modes of bladder shape variation and provide foundational data associating shape with bladder physiology. Future studies are needed to define the role of these modes in a larger array of bladder functions and physiologic states with a wider participant population.
In contrast to other shape variables, modes of bladder shape variation were associated with measures of bladder sensation, including first desire, strong desire, and MCC. These data suggest that these sensation parameters are associated with anatomic features/variations in shape across moderately full bladders that are independent of alterations in shape associated with filling and emptying. Previous studies have associated single measures of bladder shape, including the height-to-width ratio and sphericity index, with bladder overactivity during filling (4, 5, 17). Here we found no association between DO and any mode of shape variation; however, this analysis was performed with images from a single timepoint. This suggests dynamic images during filling are needed to detect shape changes associated with overactivity that are not captured in only moderately full bladders. This may be true for other shape variables as well, where evaluating bladder shape at multiple filling/emptying timepoints may elucidate additional relationships not captured by the single timepoint in this study, demonstrating the importance of evaluating both static (single time point) and dynamic (multiple time points) bladder shape and features.
While binary shape category (representing the clinical assessment of visible trabeculations and diverticula) was able to determine that atypical shapes have significantly larger PVR, it alone cannot serve as a predictor of bladder emptying and failed to identify those bladders with very negative mode 3 PC scores and high PVR. Mode 3 is a continuous variable generated by the statistical shape analysis that can account for the information provided by binary shape categorization while highlighting an association with UDSI and a linear relationship that a binary variable cannot capture. Additionally, not all relationships between shape and function appear to be linear. Mode 3 was linearly correlated with PVR (in all participants and only those able to void), but the relationship was even stronger when a quadratic fit was implemented (in all participants). This nonlinear association accounts for the elevated PVR observed at both extremes of this mode. Previous work has demonstrated a similar trend – extreme values at both ends of shape distributions being indicative of nonideal conditions – with height-to-width ratio and overactive bladder symptoms (2). This suggests that associations between bladder shape, function, and patient symptoms need to be established to adequately define these ranges and those extreme segments of distributions that are indicative of deviation from typical shape, ideal function, and an asymptomatic state. Our findings specifically give insight into a potential range of normative shape data that corresponds with optimal bladder emptying as measured by PVR.
VUDS provide critical information when diagnosing and prescribing treatment for women with urologic conditions; however, both the imaging and urodynamic components are invasive, explaining why VUDS are not performed before the presentation of symptoms/dysfunction. A future research goal is to identify metrics of bladder shape that predict function from noninvasive imaging, motivating use of more sensitive and quantitative assessments of clinical imaging to define the relationships necessary to predict bladder function. Not only would this circumvent invasive tests but would also permit earlier assessment of bladder shape and function before the development of pathophysiology. However, strengths of using VUDS in this initial application include the direct correspondence between dynamic imaging and urodynamic data and the minimization of misalignment across bladders that may result from variable placement and angling of ultrasound probes. Future applications utilizing similar shape quantification methods with 3D ultrasound could overcome many of these issues.
While this study provides a robust analysis of bladder shape quantification methods and their relation to bladder sensation, incontinence, and emptying it is limited by its retrospectively selected patient population and power to analyze bladder storage and voiding individually. As a function of assessing retrospective VUDS data, all fluoroscopic images were obtained from participants with known lower urinary tract symptoms and demonstrated abnormalities of either storage or emptying. Shapes examined in this population may be different from asymptomatic participants without any abnormalities in bladder function. Asymptomatic data will be necessary to quantify the relationships between bladder shape and the full range of bladder function. However, the inclusion of participants with LUTS and storage/emptying abnormalities did increase the dynamic range of shapes available for assessment to begin to create this continuum of bladder shape and (dys)function. Additionally, only one fluoroscopic image was used per individual – an image of a moderately full bladder. Future quantitative studies are needed to build upon previous analyses of longitudinal alterations in bladder shape with filling and emptying and to clarify the relationships between bladder shape, patient symptoms, and additional urodynamics findings, such as compliance, which were less prevalent in this study population (2).
This foundational study builds upon existing research regarding quantitative evaluation of bladder shape, finding that the existing height-to-width ratio accounts for approximately 50% of the total bladder shape variance in the coronal plane. Additionally, this study generated the novel diagonal height-to-width ratio that corresponds with roughly 33% of the total bladder shape variance calculated. Statistical shape modeling proved to be a robust quantitative measure of bladder shape as visualized by 2D fluoroscopic images during VUDS and initiates the exploration of the quantitative relationships needed to use bladder shape to predict physiology.
Data availability statement
The original contributions presented in the study are included in the article/supplementary material. Further inquiries can be directed to the corresponding author.
Ethics statement
This study was reviewed and approved by the Institutional Review Board of University of California San Diego through an expedited process, in accordance with the requirements of the Code of Federal Regulations on the Protection of Human Subjects (45 CFR 46). The Institutional Review Board waived the requirement of written informed consent for participation.
Author contributions
LB, MR, and YS-L contributed to conception and design of the study. LB, MR, and KG collected data for study. LB and MR performed the data analysis and statistical analysis. LB and MR wrote the first draft of the manuscript. All authors contributed to manuscript revision, and read and approved the submitted version.
Funding
The authors gratefully acknowledge funding by the International Urogynecological Association Basic Science Research Grant (LB) for the conduct of this research.
Acknowledgments
We gratefully acknowledge Marianna Alperin, MD, MS, Professor, Department of Obstetrics, Gynecology, and Reproductive Sciences, University of California San Diego, for her expertise and insightful discussion of this project.
Conflict of interest
The authors declare that the research was conducted in the absence of any commercial or financial relationships that could be construed as a potential conflict of interest.
Publisher’s note
All claims expressed in this article are solely those of the authors and do not necessarily represent those of their affiliated organizations, or those of the publisher, the editors and the reviewers. Any product that may be evaluated in this article, or claim that may be made by its manufacturer, is not guaranteed or endorsed by the publisher.
References
1. Damaser MS, Lehman SL. The effect of urinary bladder shape on its mechanics during filling. J Biomech (1995) 28:725–32. doi: 10.1016/0021-9290(94)00169-5
2. Glass Clark S, Nagle AS, Bernardo R, Vinod N, Carucci L, Carroll A, Speich J, Klausner AP, et al. Use of ultrasound urodynamics to identify differences in bladder shape between individuals with and without overactive bladder. Female Pelvic Med Reconstr Surg (2020) 26:635–9. doi: 10.1097/SPV.0000000000000638
3. Nagle AS, Klausner AP, Varghese J, Bernardo RJ, Colhoun AF, Barbee RW, Carucci LR, Speich JE, et al. Quantification of bladder wall biomechanics during urodynamics: A methodologic investigation using ultrasound. J Biomech (2017) 61:232–41. doi: 10.1016/j.jbiomech.2017.07.028
4. Li R, Nagle AS, Maddra KM, Vinod N, Prince SA, Tensen SI, et al. Irregular bladder shapes identified in women with overactive bladder: an ultrasound nomogram. Am J Clin Exp Urol (2021) 9:367–77.
5. Maddra KM, Li R, Nagle AS, Klausner AP, Speich JE. Repeatability of ultrasound-defined bladder shape metrics in healthy volunteers. Res Rep Urol (2022) 14:185–92. doi: 10.2147/RRU.S351347
6. Routzong MR, Abramowitch SD, Chang C, Goldberg RP, Rostaminia G. Obstructed defecation symptom severity and degree of rectal hypermobility and folding detected by dynamic ultrasound. Ultrasound Q (2021) 37:229–36. doi: 10.1097/RUQ.0000000000000565
7. Routzong MR, Chang C, Goldberg RP, Abramowitch SD, Rostaminia G. Urethral support in female urinary continence part 1: dynamic measurements of urethral shape and motion. Int Urogynecol J (2021) 33(3):541–550. doi: 10.1007/s00192-021-04765-3
8. Routzong MR, Martin LC, Rostaminia G, Abramowitch S. Urethral support in female urinary continence part 2: a computational, biomechanical analysis of valsalva. Int Urogynecol J (2021) 33(3):551–561. doi: 10.1007/s00192-021-04694-1
9. Routzong MR, Rostaminia G, Moalli PA, Abramowitch SD. Pelvic floor shape variations during pregnancy and after vaginal delivery. Comput Methods Programs BioMed (2020) 194:105516. doi: 10.1016/j.cmpb.2020.105516
10. Chai X, van Herk M, Betgen A, Hulshof M, Bel A. Automatic bladder segmentation on CBCT for multiple plan ART of bladder cancer using a patient-specific bladder model. Phys Med Biol (2012) 57:3945–62. doi: 10.1088/0031-9155/57/12/3945
11. Rigaud B, Simon A, Gobeli M, Leseur J, Duverge L, Williaume D, et al. Statistical shape model to generate a planning library for cervical adaptive radiotherapy. IEEE Trans Med Imaging (2019) 38:406–16. doi: 10.1109/TMI.2018.2865547
12. Schneider CA, Rasband WS, Eliceiri KW. “NIH Image to ImageJ: 25 years of image analysis.”Nature Methods (2012) 9, 671–675.
13. Bone A, Louis M, Martin B, Durrleman S. Workshop on shape in medical imaging, Vol. 11167. (2018), LNCS 3-13 (201). (Inria de Paris, Granada, Spain: Sorbonne Université)
14. Polly PD. Geometric morphometrics for Mathematica. (Bloomington, Indiana, USA: Department of Geological Sciences, Indiana University) (2019). Available at: https://pollylab.indiana.edu/software/
15. Routzong M. Computational modeling of variations in female anatomy to elucidate biomechanical mechanisms of pelvic organ and tissue functions. (2021). (Pittsburgh, PA, USA: University of Pittsburgh)
16. Cates J, Fletcher PT, Styner M, Shenton M, Whitaker R. Shape modeling and analysis with entropy-based particle systems. Inf Process Med Imaging (2007) 20:333–45. doi: 10.1007/978-3-540-73273-0_28
Keywords: bladder morphology, bladder sensation, detrusor overactivity, fluoroscopic imaging, post void residual volume, statistical shape modeling, urodynamic stress urinary incontinence, videourodynamics
Citation: Routzong MR, Santiago-Lastra Y, Gallo K and Burnett LA (2022) Use of statistical shape modeling to enhance the fluoroscopic evaluation of the bladder. Front. Urol. 2:915520. doi: 10.3389/fruro.2022.915520
Received: 08 April 2022; Accepted: 15 November 2022;
Published: 22 December 2022.
Edited by:
Blayne Welk, Western University, CanadaReviewed by:
Chris Elliott, Santa Clara Valley Medical Center, United StatesGenevieve Nadeau, Centre Hospitalier Universitaire de Québec, Canada
Copyright © 2022 Routzong, Santiago-Lastra, Gallo and Burnett. This is an open-access article distributed under the terms of the Creative Commons Attribution License (CC BY). The use, distribution or reproduction in other forums is permitted, provided the original author(s) and the copyright owner(s) are credited and that the original publication in this journal is cited, in accordance with accepted academic practice. No use, distribution or reproduction is permitted which does not comply with these terms.
*Correspondence: Lindsey A. Burnett, bGlidXJuZXR0QGhlYWx0aC51Y3NkLmVkdQ==
 Megan R. Routzong
 Yahir Santiago-Lastra
 Kelsey Gallo2
 Lindsey A. Burnett