Abstract
Due to the continuing large number of malaria-related deaths in tropical Africa, the need to develop a robust Malaria Early Warning System (MEWS) for effective action is growing to guide cost-effective implementation of interventions. This study employs a two-stage hierarchical evaluation technique to evaluate the ability of the VECTRI malaria model to simulate malaria dynamics at seasonal time scale (1 - 7 months) over Nigeria and West Africa. Two sets of malaria simulations are considered. The first set is based on VECTRI simulations driven by observed rainfall and temperature datasets (hereafter referred to as control run). The second is based on malaria simulations driven by the European Centre for Medium-Range Weather Forecasting (ECMWF) System5 ensemble seasonal forecasting system (hereafter referred to as Forecast run). Different metrics are employed to assess the skill of the VECTRI malaria model. Results based on the control run indicate that the model can reproduce hyper-endemic zones and the evolution of malaria cases, particularly the observed increase in cases with decreasing population density. Despite having significant biases and low correlation, the model successfully predicts annual anomalies in malaria cases across Nigeria, particularly in the savannah region that experience large malaria burden. Annual correlations between the VECTRI Forecast run and the VECTRI Control run are relatively low at all lead times (LT) and for each start date (SD) across West Africa, although correlation generally increases from the Gulf of Guinea to the Sahel. Despite low correlations, the Rank Probability Skill Score (RPSS) reveals that the model has a statistically significant skill in predicting malaria occurrences across all categories of malaria cases, regardless of start date or lead time. While the Guinea Forest has the strongest RPSS, the increase or decrease in skill from the first to seventh lead time varies significantly across the region. In addition, the VECTRI malaria model has a good ability to discriminate variability in malaria cases across all regions, with an average Area Under the Relative Operating Characteristics (ROC) Curve (AUC) of approximately 0.62. Our findings suggest that the VECTRI malaria model could be used as a reliable Malaria Early Warning System (MEWS), particularly for identifying malaria hyper-endemic zones in West Africa at seasonal time scale.
1 Introduction
Plasmodium falciparum is a parasitic species that is the primary cause of malaria in susceptible people, particularly in tropical regions of the world and Africa (1, 2) and is a major cause of death in Sub-Saharan Africa, particularly among children and pregnant women (3, 4). It is extremely prevalent in this region, and its transmission persists despite the deployment of effective control measures (3). Malaria caused 619,000 deaths in 2021, 95% of these occurring in Africa. The World Health Organization estimated that 32% of pregnancies were exposed to malaria infection over the African continent (1). In addition to the associated number of fatalities, research has shown that malaria can also limit the capacity of people to work and children to attend school. Malaria attacks, according to several studies, can incapacitate a person for an average of ten to fourteen days (5). (5) also noted that malaria-related illnesses frequently result in substantial financial demands due to the high cost of medical treatment, resulting in a dearth of domestic food supplies. Over ten billion dollars are estimated to be spent on malaria-related costs in West Africa, including treatment, prevention, and lost labor hours (6).
Female Anopheles mosquitoes are the primary vectors of the malaria parasite, as they need human blood to obtain the proteins necessary to nourish and lay their eggs (7, 8). Following an infectious blood meal, the malaria parasite is typically transmitted to humans through an infective mosquito bite (9–11). Environmental and climatic conditions can significantly influence mosquito development and survival (12–15). Usually, relative humidity, wind, temperature, and rainfall are the most frequently correlated atmospheric variables that influence the life cycle of mosquitoes. However, temperature and precipitation are by far the most important climatic variables. Temperature influences the rate at which mosquito larvae mature, the mosquito’s biting rate, and the time required for the malaria parasite to mature inside Anopheles female mosquitoes, the so-called sporogonic cycle. Rainfall creates mosquito breeding sites where adult females can lay their eggs. Consequently, accurate real-time monitoring of weather factors, such as temperature and precipitation, could provide useful information about potential malaria transmission risk and for the design of malaria early warning systems. Integrating sub-seasonal to seasonal forecasts for temperature and precipitation could further extend the lead-time of malaria predictions (16, 17).
Despite this potential to use climate information to provide early warnings, there is no implemented operational tool to assist with proactive community-based disaster risk management in sub-Saharan Africa, despite the large sums of money spent combating malaria and its extensive socioeconomic impacts. This paper aims to estimate the skill of an early warning system for the possible spread and transmission of malaria in West Africa, and hence to address a significant research gap in epidemiological research.
Various malaria models were able to predict the dynamics of malaria in response to climatic factors in different epidemic zones (16, 18). Some malaria models are dynamic and have been tested operationally. The Liverpool Malaria Model (LMM) and the ICTP’s Trieste VECtor borne disease community model (VECTRI) are two commonly employed dynamical malaria models in West Africa (7). Due to its availability as an open-source dynamic malaria model, the VECTRI model is utilized in this paper. VECTRI considers how surface hydrology, population density, and climate (rainfall and temperature) impact the distribution and magnitude of malaria.
Numerous studies utilizing both simulated and observed climate drivers have demonstrated the predictive ability of the VECTRI model in diverse regions of Africa. For instance, the predictive ability of the VECTRI model was evaluated by employing simulated and observed climate drivers in diverse regions of Africa [19, 20 and 7]. VECTRI simulations driven by observed precipitation and temperature were compared to observed malaria cases and Entomological Inoculation Rates (EIR) (19). Focusing on Bobo-Dioulasso in Western Africa, the results demonstrated that the VECTRI model could effectively reproduce observed seasonality in malaria transmission as well as changes in malaria transmission rate between rural and semi-urban areas.
An early warning system prototype was developed using the VECTRI model driven by temperature and precipitation data from the European Centre for Medium-Range Weather Forecasting (ECMWF) monthly and seasonal climate forecasts (19, 20). Despite the delays between the rainy season and malaria transmission, preliminary analysis in the highlands of Uganda and Kenya revealed that this malaria forecasting system was able to reproduce years of documented highland malaria outbreaks.
While (20) primarily focused on Eastern Africa (13), evaluated the skill of the VECTRI model over Ghana. To investigate the spatiotemporal variability of malaria transmission, they modified the standard parameterization of the VECTRI malaria model. Their findings demonstrated that the VECTRI model’s results were consistent with observed features, and of high quality for simulating monthly reported malaria cases.
The potential of using S2S seasonal forecasts (using ensemble hindcasts from European Centre for Medium-Range Weather Forecasting (ECMWF’s) VarEPS (IFS ver. 41r1), China Meteorological Administration’s BCC-CPS-S2Sv1 ver. 1, and UKMO’s GloSea4 from the S2S global repository) to drive the VECTRI malaria model in hyperendemic malaria zones of Nigeria was evaluated by (21) and (22). They demonstrated that, despite regional discrepancies, S2S forecasts were useful to identify hyperendemic areas and mobilizing responsible health departments at least one month before the occurrence of malaria outbreaks.
Although several studies have used the VECTRI malaria model over different regions of Africa, significant knowledge gaps remain. Many of these studies have only focused on small geographical areas, which cannot accurately represent the entire sub-Saharan region, especially West Africa. In addition, only a limited number of studies have employed comprehensive verification techniques with an extensive set of skill scores to evaluate the accuracy of VECTRI malaria forecasts, particularly at seasonal timescale.
Consequently, the accuracy of the VECTRI malaria model in predicting malaria dynamics over West Africa needs to be investigated in greater details with the goal of developing an operational system for Nigeria and potentially the wider West African region. We aim to answer the following questions for West Africa. Firstly, is the VECTRI malaria model skillful in predicting malaria cases in West-Africa at seasonal time-scale; Secondly, how impactful could the use of rainfall and temperature forecasts from seasonal climate models in driving the VECTRI malaria model; lastly is the use of ensembles in driving the VECTRI model beneficial? Here, we intend to study these issues in greater detail in Nigeria and West Africa to develop a reliable malaria Early Warning system at seasonal and sub-seasonal timescales.
Section 2 describes the ECMWF Seasonal forecasts and observed climate data such as ERA5 and satellite data, and the methods. Section 3 examines the primary results, while Section 4 summarizes and concludes the main work’s findings.
2 Data and methods
2.1 Input climate data
2.1.1 Seasonal data - forecast run
Precipitation (mm/day) and 2 meters temperature (°C) data from the ECMWF seasonal Forecasting ensemble was used. Simulated seasonal data was collected from the ECMWF seasonal data hub as part of the European-funded Copernicus Climate Change Services (C3S) data project. Real-time seasonal precipitation and temperature forecasts for the years 2014 to 2021 were utilized, along with reforecast data for the years 2014 to 2016. To ensure that all forecasts are contained within a one-year period, for computational efficiency and ease of comparison with observations, the data is initialized monthly, from January to June, with a seven-month lead time (LT; see Tables 1, 2). For example, a forecast initialized in January 2020, will provide daily rainfall and temperature forecast until the end of July 2020. Seasonal precipitation and temperature data were regridded to 1°x1° resolution and then used to drive the VECTRI model. The simulation resulting from these VECTRI model runs will be referred to as “VECTRI Forecast Run (VFR)” thereafter.
Table 1
| Data | Variable | Source | Date of Monthly Initialization | Periods | Resolution | Ensemble Size | Time-step | Lead Time (LT) |
|---|---|---|---|---|---|---|---|---|
| ECMWF - Seasonal-Realtime | Rainfall 2m Temperature | ECMWF | First Date | 2017 - 2021 | 100km | 50 | Daily | 7 Months |
| ECMWF - Seasonal-Hindcast | Rainfall 2m Temperature | ECMWF | First Date | 2014 - 2016 | 100km | 25 | Daily | 7 Months |
| Satelite | Rainfall | GPM-IMERGE | Not Applicable | 2014 - 2021 | 10km | – | Daily | – |
| ERA-5 | 2m Temperature | ECMWF | Not Applicable | 2014 - 2021 | 31km | – | Daily | – |
| Malaria | Cases | NMEP | Not Applicable | 2014 – 2021 | 50km | – | Monthly | – |
Summary of data used in this study.
Table 2
| START DATE (SD) | Month | Season (Seas) 1 |
Season 2 (Seas) 2 |
Season (Seas) 3 |
Season (Seas) 4 |
Season (Seas) 5 |
|---|---|---|---|---|---|---|
| 1 | January | JFM | FMA | MAM | AMJ | MJJ |
| 2 | February | FMA | MAM | AMJ | MJJ | JJA |
| 3 | March | MAM | AMJ | MJJ | JJA | JAS |
| 4 | April | AMJ | MJJ | JJA | JAS | ASO |
| 5 | May | MJJ | JJA | JAS | ASO | SON |
| 6 | June | JJA | JAS | ASO | SON | OND |
Summary of forecast start dates (SDs) corresponding Months and Seasons in this study.
JFM, January February March; FMA, February March April; MAM, March April May; AMJ, April May June; MJJ, May June July.
JJA, June July August; JAS, July August September; ASO, August September October; SON, September October November; OND, October November December.
2.1.2 Satellite and ERA5 reanalysis data– control run
Daily rainfall data from satellite-derived Integrated Multi-satellitE Retrievals for the Global Precipitation Measurement mission (GPM_IMERG) version 3 (23) and 2m temperature data from the ERA5 reanalysis data (24) from 2014 to 2021 were used. The GPM-IMERG precipitation data is available at a grid spacing of 10 kilometers and covers the entire globe. Although GPM has some inherent biases (25, 26), several studies (27–29) have used it for weather forecasting model verification, particularly over Africa (25, 26). Though the IMERG system is run twice in near-real-time, with the Early run (IMERG-E; about six hours after nominal observation time) and the Late run (IMERG-L after about 18 hours), the dataset from the Final run (IMERG-F; about 3 months after the observation month), was used in this study. with both forward and backward morphing schemes (25, 26) the IMERG final run better described the intensity in the rainfall features. The primary reason for utilizing GPM_IMERG is related to the coarse distribution of rain gauges in Africa (29).
The ECMWF produces ERA-5, a global atmospheric reanalysis of the fifth generation covering the years 1959 to the present. It replaced the well-known ERA-Interim dataset and contains numerous updates with finer temporal, horizontal and vertical resolutions (respectively, 1 h, 0.25°, and 137 vertical levels extending from the surface to 0.01 hPa), several improvements to different parameterization schemes (such as convection and microphysics) and a new data assimilation scheme. ERA-5 uses a more recent version of the ECMWF Integrated Forecast System model (IFS 41r2) than its predecessors (24). Recent research has demonstrated that these advancements lead to an overall increase in the accuracy of ERA-5 compared to its predecessors in representing a variety of climate variables, including rainfall and tropical convection (30, 31), land surface temperature (32) downwelling solar radiation at the surface (33), and wind patterns over global oceans (34, 35). The average daily temperature for this study was calculated using the hourly 2m temperature data retrieved from 2014 to 2021. The VECTRI model is driven by regridding the GPM_IMERG precipitation and ERA-5 2m temperature to a horizontal resolution of 10km (about 0.1°x0.1° at the equator). This VECTRI model’s simulation will henceforth be referred to as “VECTRI Control Run (VCR)”.
2.1.3 Observed malaria case data
Clinically confirmed monthly malaria case data in Nigeria for the period 2014-2021 was obtained from the “National Malaria Elimination Program (NMEP) program’s records (https://nmcp.gov.ng/). The retrieved point data is then converted to spatial regular grid data with a horizontal resolution of 50 kilometers using Inverse Distance Weighting (IDW) technique.
2.2 Validation metrics and skill scores
To evaluate the skill of the VECTRI malaria model, two hierarchical evaluation methods were used. First, the VCR simulated malaria cases, derived from the simulated EIR, are compared to the reported malaria cases to assess the skill of the modeled monthly malaria cases over Nigeria.
Second, we assess the quality of the seasonal VFR in simulating malaria cases against the VCR in West Africa. The spatiotemporal attribute of the VCR and VFR is evaluated utilizing both deterministic and probabilistic evaluation methods. The deterministic evaluation is based on bias (using Mean Error, see Equation 1), synchronization, and Pearson correlation coefficients (r), while the two probabilistic evaluations are based on the rank probability skill score (RPSS) and the Relative operating characteristics (ROC).
N denotes the sample size, Fi is the forecast totals, and Oi is the observation totals. Pearson correlation coefficient (r) is computed to measure the linear relationship between the VCR and the malaria observation, as well as between the VFR and the VCR. We calculated correlation coefficients between the VCR and malaria observation for each month, season, and year. Focusing on monthly data enables to estimate model skill in reproducing a realistic monthly cycle of observed malaria cases. Seasonal time scale are relevant for seasonal forecasting, as seasonal climate forecast are usually carried out for the upcoming season (7 months from start date in this study). Finally, correlations calculated at interannual time scale aim to estimate the model capability in reproducing low/high malaria years over a set time period.
The correlation is then computed between the VFR (based on the model ensemble mean) and VCR for each lead time (LT) from each start date (SD), for all SDs at each LT, for all SDs at all LTs, and finally for all seasons from each SD. Between the VCR and observation, the computed seasons (seas) are JFM (Jan-Feb-Mar), FMA (Feb-Mar-Apr), MAM (Mar-Apr-May), AMJ (Apr-May-Jun), MJJ (May-Jun-Jul), JJA (Jun-Jul-Aug), JAS (Jul-Aug-Sep), ASO (Aug-Sep-Oct), SON (Sep-Oct-Nov), and OND (Oct-Nov-Dec). The computed correlation seas from the January SD are JFM, FMA, MAM, AMJ, and MJJ, whereas those from the February SD are FMA, MAM, AMJ, MJJ, and JJA. Tables 2, 3 provide details about the forecast start dates (SDs) the corresponding seas and lead times (LT). Significance level (p = 0.05) for a two-tailed T-test is also computed to strengthen the support for any prospective linear association between the correlated parameters.
Table 3
| START DATE (SD) | Lead-Time 1 LT1 |
Lead-Time 2 LT2 |
Lead-Time 3 LT3 |
Lead-Time 4 LT4 |
Lead-Time 5 LT5 |
Lead-Time 6 LT6 |
Lead-Time 7 LT7 |
|---|---|---|---|---|---|---|---|
| 1 | January | February | March | April | May | June | July |
| 2 | February | March | April | May | June | July | August |
| 3 | March | April | May | June | July | August | September |
| 4 | April | May | June | July | August | September | October |
| 5 | May | June | July | August | September | October | November |
| 6 | June | July | August | September | October | November | December |
Summary of forecast start dates (SDs) and corresponding Lead Time (LT).
Following (36) we also applied the synchronization (37) technique to quantitatively determine how well the VCR captures the timing of yearly rainfall anomaly signals.
Applied between VFR and VCR only, the rank probability skill score (RPSS) used in this study follows (38). To denote low, medium, and high occurrences of malaria, the 10th, 50th, and 90th percentiles are utilized to calculate the RPSS (See Equation 2).
Where RPS is the rank probability score for a forecast and RPSr is the rank probability score for a reference forecast. Additionally, the ROC diagram is generated by plotting the hit rate against the false alarm rate for all LTs from all SDs in the VCR and the monthly anomaly probability from the VFR. The Area under the Curve of ROC (AUC) is computed using the monthly anomaly of malaria cases.
In addition, both Nigeria and West Africa are divided into four ecological zones based on a common climatology of rainfall onset dates, which is averaged along longitude -18°W – 18°E for West Africa and along longitude 2°E – 15°E for Nigeria. These zones include the Gulf of Guinea (GoG; latitude 4°N –8°N), the Guinea Forest (GF; latitude 8 °N–10°N), the Savannah (SAV; latitude 10°N-12°N), and the Sahel (SAH; latitude 12 °N–16°N), as depicted in Figure 1. In addition, we calculated average for the West African domain (longitude -18o°W – 18o°E and latitude 4°N–16°N), the East of Meridian longitude (MerE; 0–18°E and latitude 4°N–16°N), the West of Meridian longitude (MerW; 18°W–0°E and latitude 4°N–16°N), and the Nigeria longitude (2°E–15°E and latitude 4°N–14°N). All datasets used in this study were re-gridded to a resolution of 1° x 1° for uniformity and because this was the lowest spatial resolution used.
Figure 1
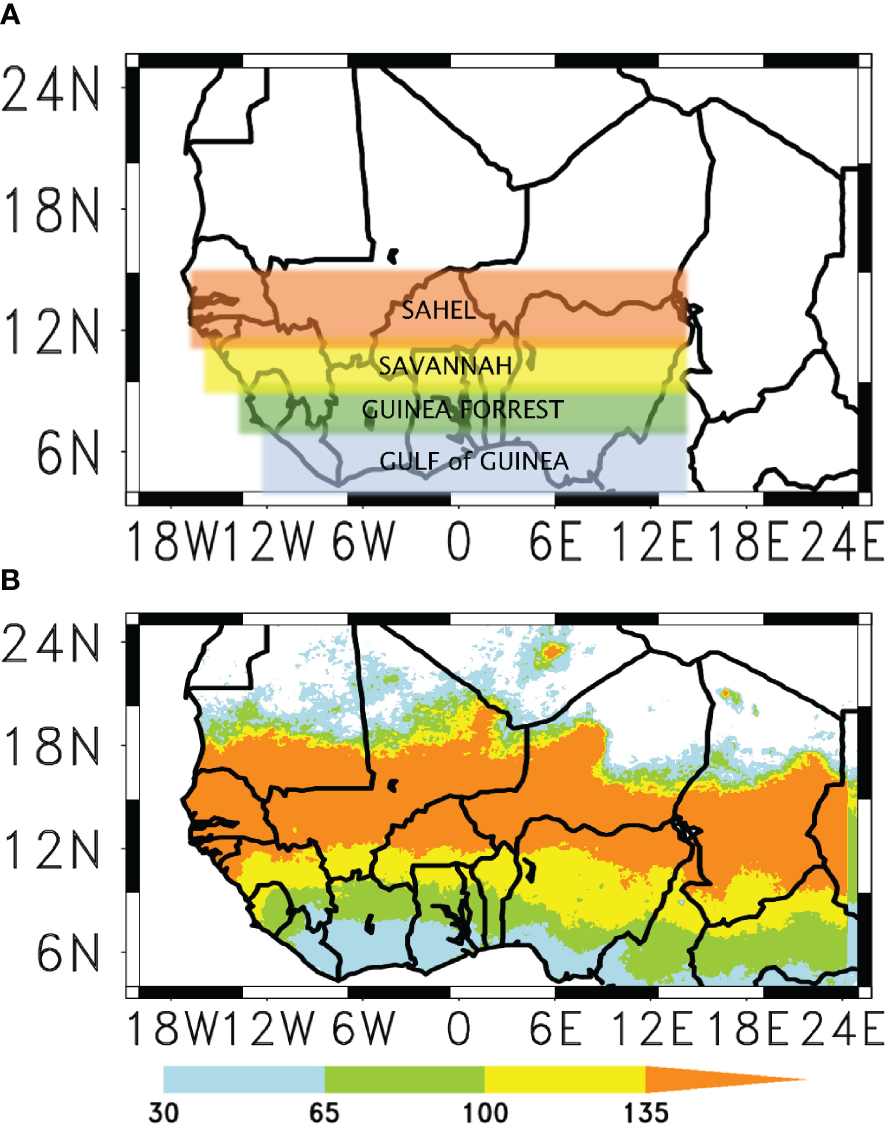
(A) Classification of ecological zones in West Africa: Gulf of Guinea (GoG region1; blue; 4 °N– 8°N, 10°W–15°E), Guinea Forrest (GFR region2; green; 8 °N–10°N, 12°W–15°E), Savannah, (SAV region3; yellow; 10 °N–12°N, 14°W–15°E), Sahel (SAH region4; brown; 12 °N–16°N, 18°W–15°E) and (B) the rainfall onset climatology derived from the GPM_IMERG satellite dataset.
2.3 The VECTRI malaria model
VECTRI is an open-source dynamical model that simulates the dynamics of malaria transmission. It was developed at the International Center for Theoretical Physics (7) and it runs at a daily time step. The spatial resolution of the model varies from a single location to a regional scale of 10 to 100 km, depending on the resolution of the input climate data. The model explicitly resolves the growth stages of the egg-larvae-pupa cycle, as well as the sporogonic cycles, using an array of bins for each process (7, 13). If temperatures are suitable for the different mosquito life cycle stages, this process continues to advance within the boxes. A schematic description of the modelling framework is shown on Figure 2. VECTRI incorporates human population density, which influences vector–host interaction dynamics. Therefore, as population density increases, the Entomological Inoculation Rate (EIR) predicted by the model tends to decrease (7). The model also contains a simple hydrological scheme. This scheme, as modified by (14) (Ernest Ohene Asare, Tompkins, and Bomblies 2016), indirectly controls habitat productivity and adult density by killing larvae when the habitat dries out. In addition, the scheme considers the negative impact of heavy rainfall on habitat productivity, as a result of larvae being flushed away (39). The VECTRI model is described in detail in (7) and (14).
Figure 2
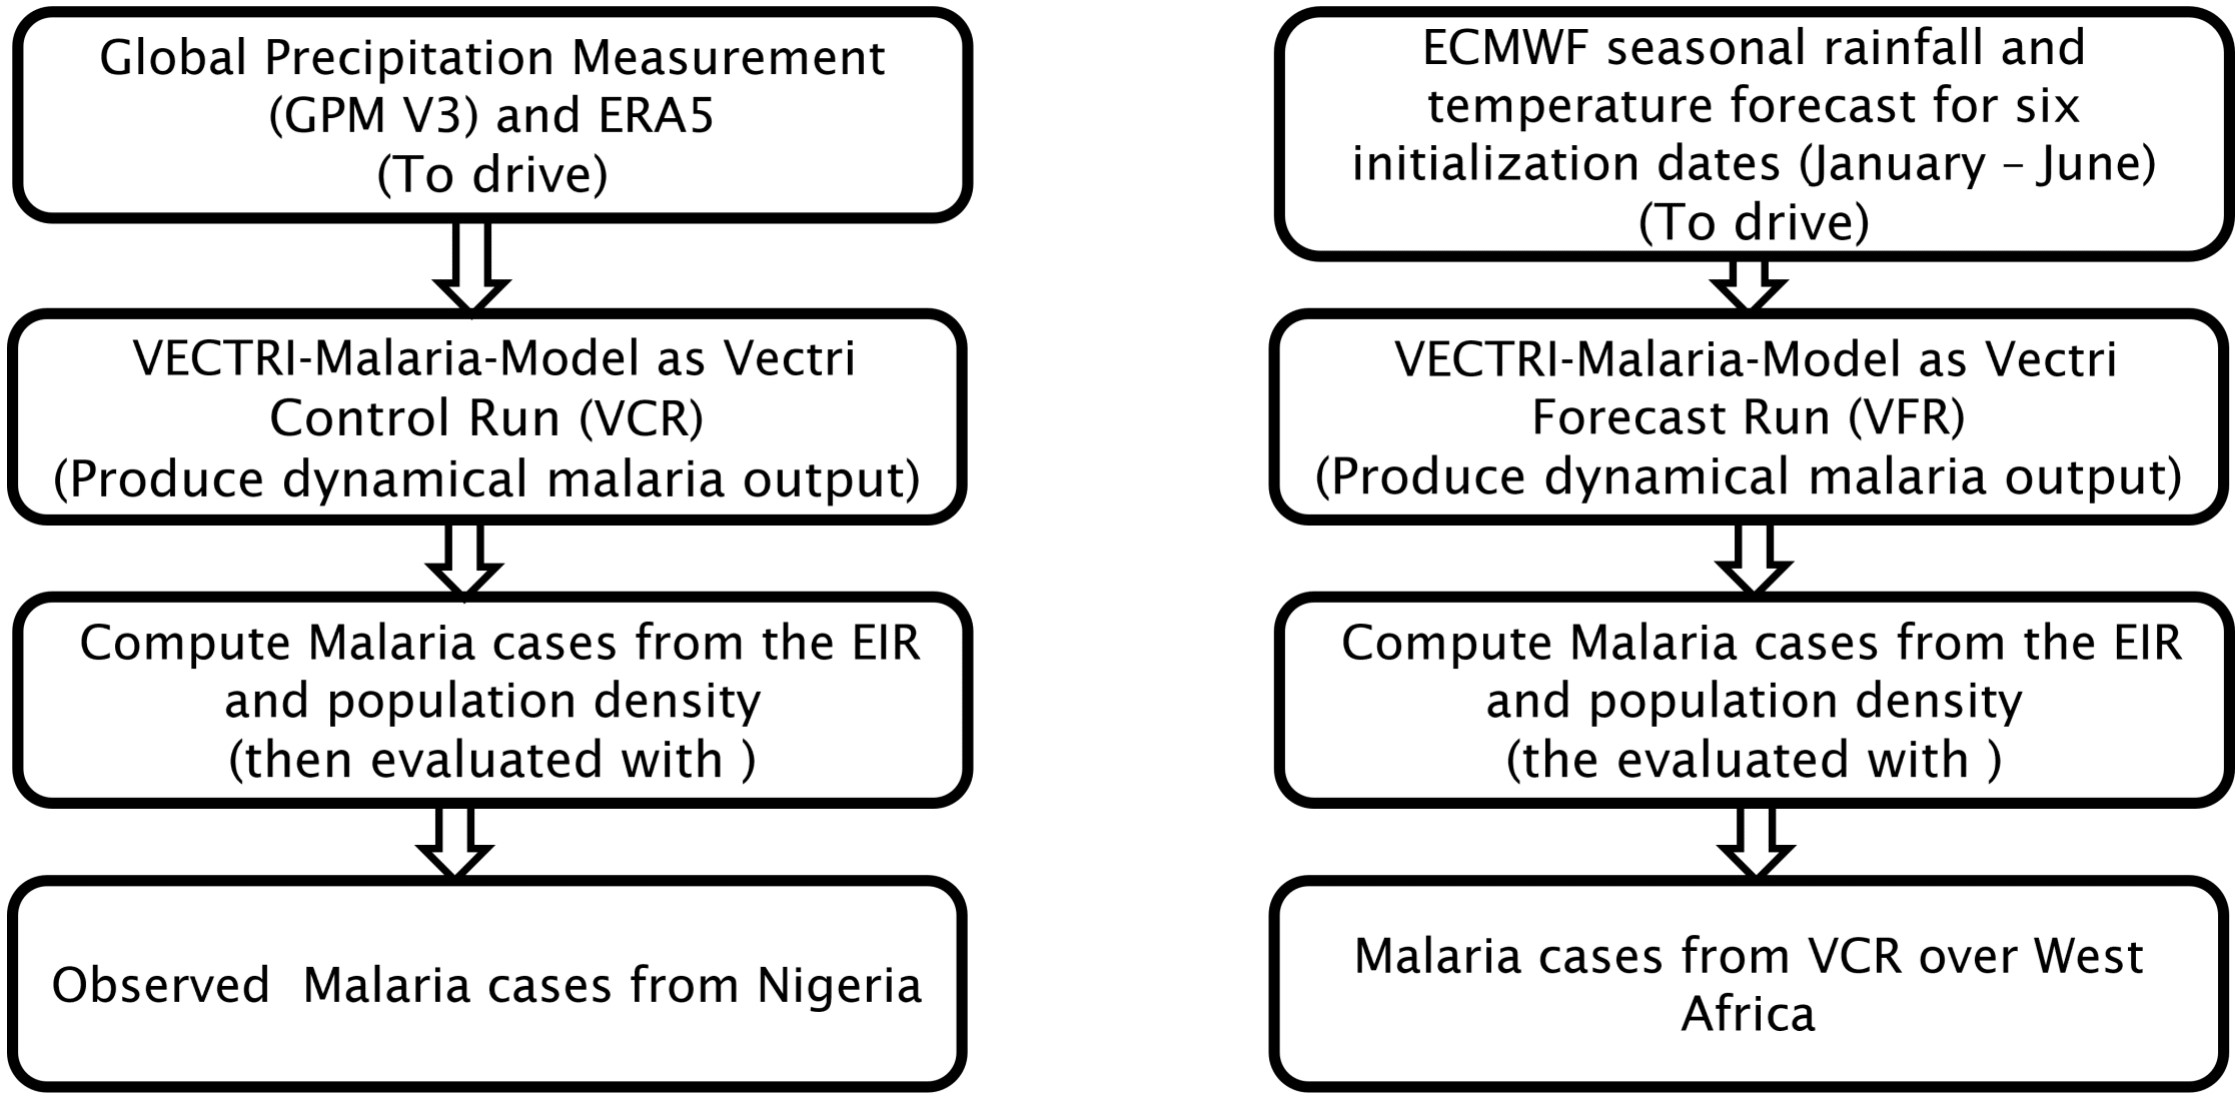
Schematic of the forecast-system setup, Adapted from Tompkins and Giuseppe, (2015).
3 Results and discussion
3.1 Observed malaria dynamics over Nigeria
Malaria transmission in Nigeria is complex because it is a year-round phenomenon (Figures 3A, E, I, M). Seasonal peaks in malaria cases follow the evolution of the West African monsoon with one to two-months lag. Variability in malaria cases exhibits different features at monthly, seasonal and annual time scales across different eco-regions of Nigeria (Figure 3). The lag between the peaks in rainfall and malaria cases may be a result of the retention capacity of soil moisture, which has been demonstrated to have a feedback effect on rainfall variability (40). Observed malaria cases exhibit bimodal characteristics over the GOG, GFR, and SAV, but mostly unimodal features over the SAH (Figures 3A, B, E, F, I, J, M, N). Peaks in malaria cases tend to primarily occur in May and November over most of Nigeria. The number of malaria cases increases latitudinally from the GoG with approximately 600,000 to the SAH with approximately 900,000 cases (Figure 4A). The studies of (41), and (20) This finding is consistent with other modelling studies that related an increase in malaria cases to a decrease in population density consistent with an increase in malaria cases with increasing latitude and larger malaria burden in rural regions (20, 41). The number of malaria cases in Nigeria is consistently low in 2016, regardless of the region, and peaks in 2017 over the GOG and SAH, and in 2021 over the GFR and SAV (Figures 3C, G, K, O). While years of above and below normal malaria cases may not be consistent over the GOG, as shown in (Figures 3D, H, I, P), fewer malaria cases were reported in 2014 to 2016 and more were observed in 2019 to 2021 in other regions.
Figure 3
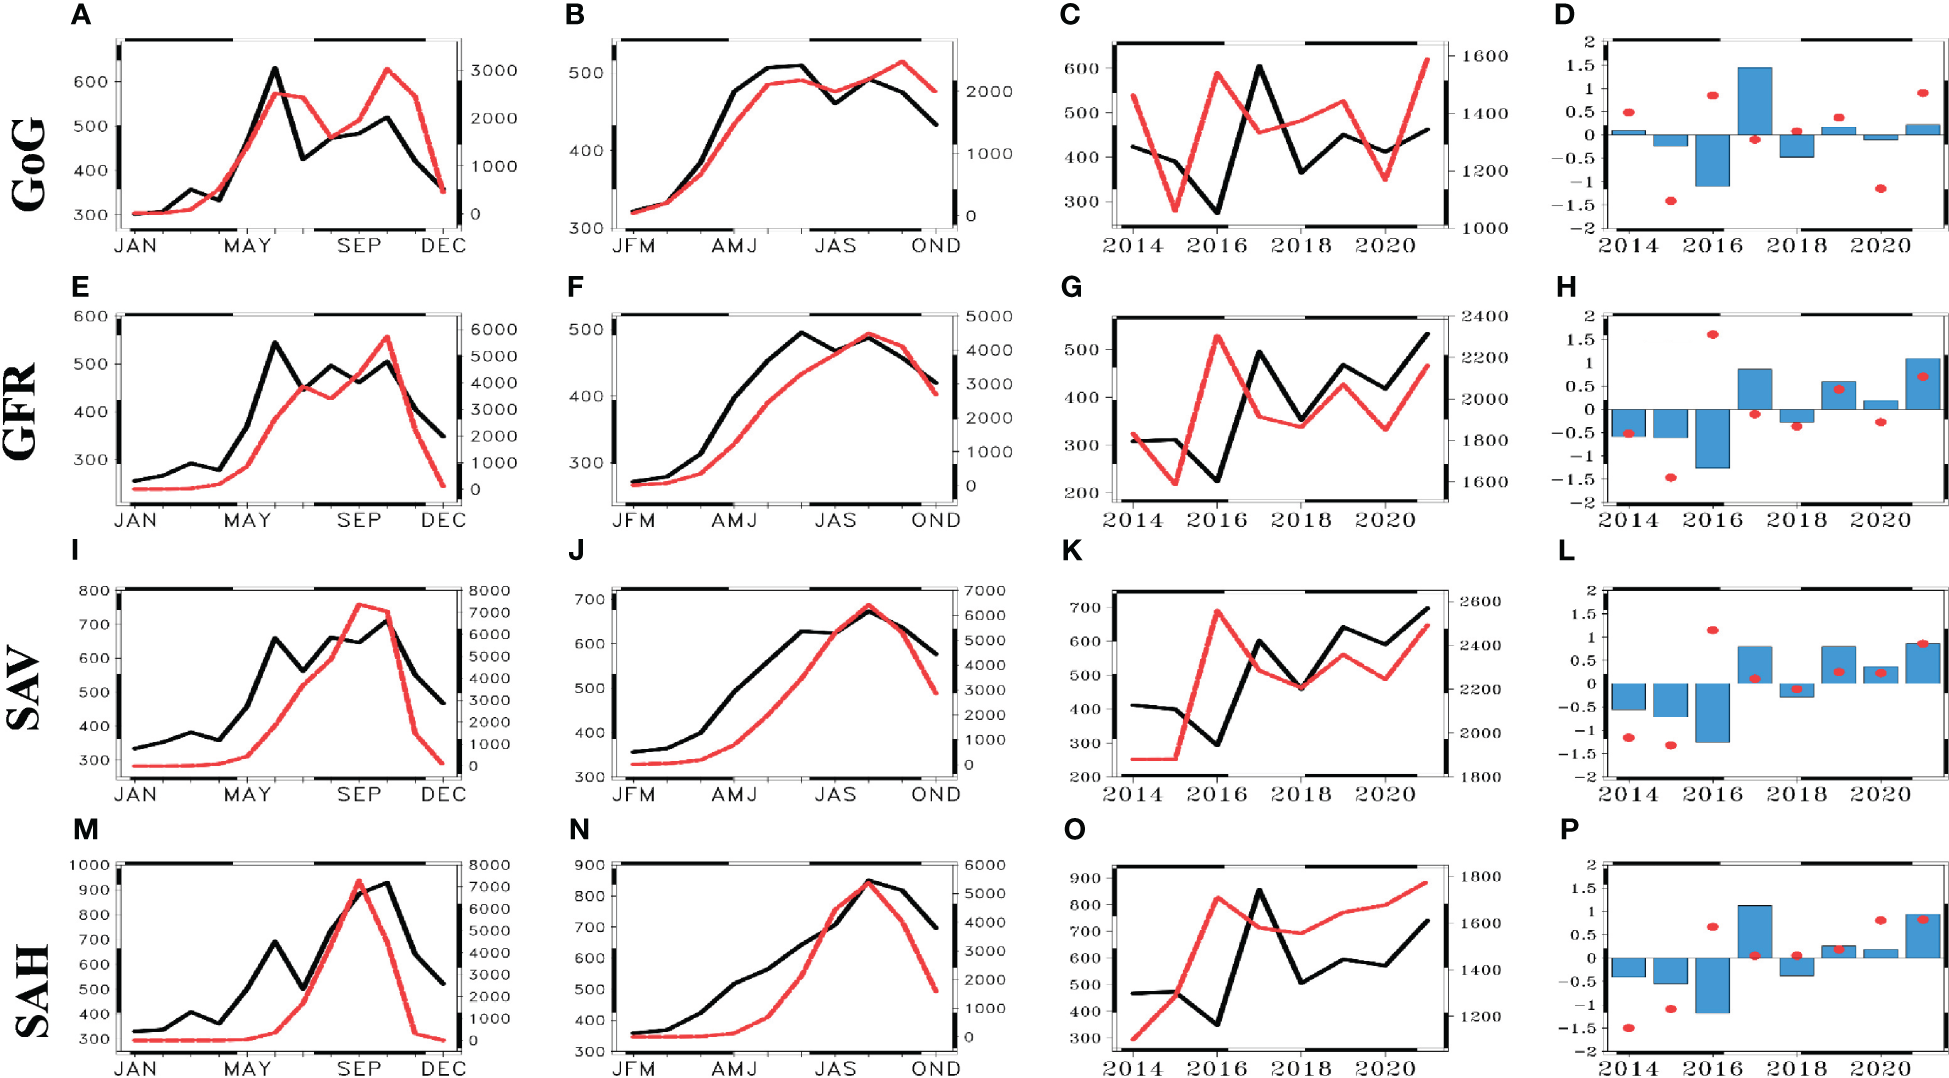
Monthly (A, E, I, M) and seasonal (B, F, J, N) climatology, yearly (C, G, K, O), and year anomaly (D, H, L, P) of observed (black line and blue bar) and VCR (red line and circle) malaria Cases (X1000) across the GoG the GFR, SAV and the SAH in Nigeria.
Figure 4
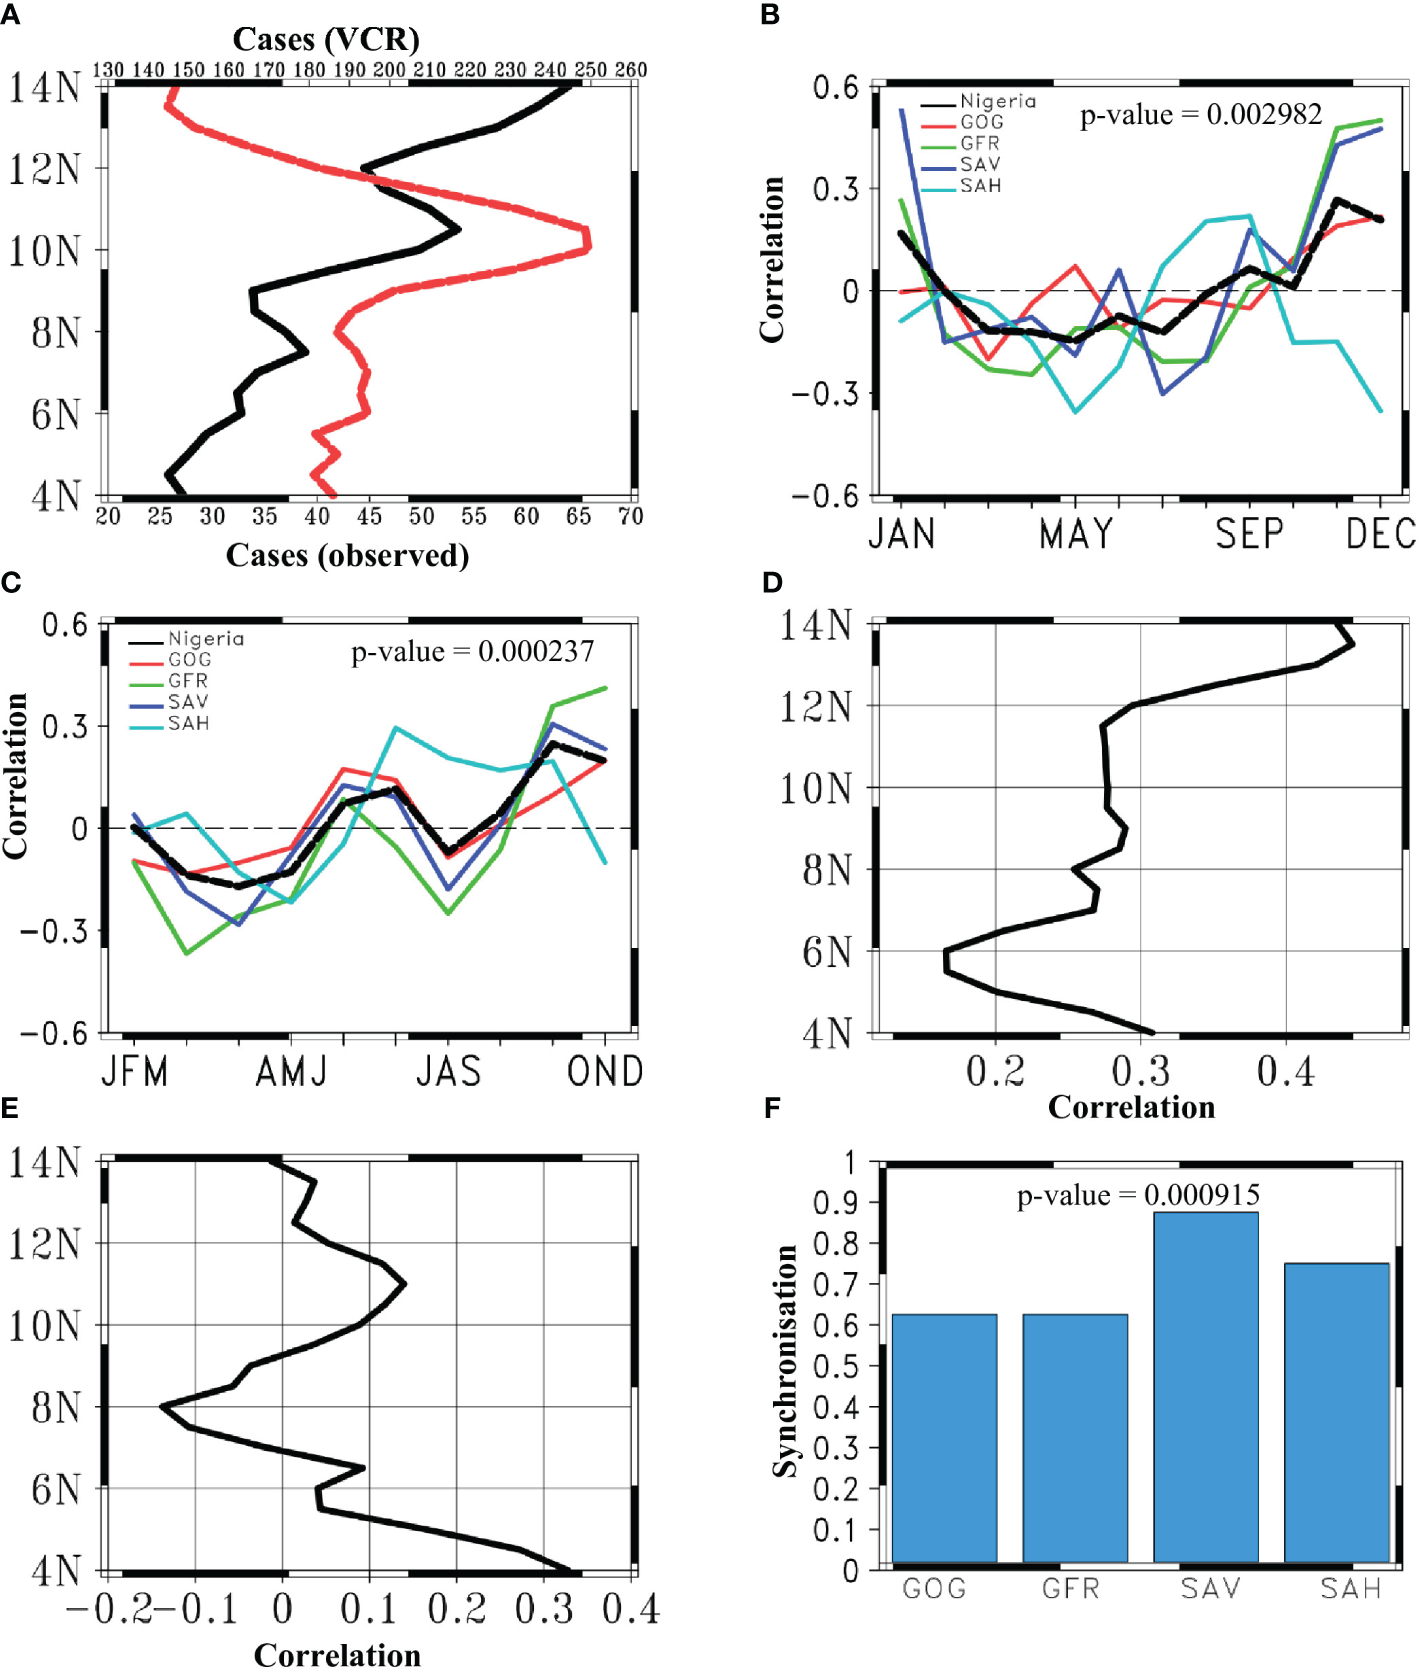
Showing (A), latitudinal evolution of malaria climatological cases over Nigeria (averaged between lon 2 -15°E), (B, C) monthly and seasonal correlation between observed and VCR across the GoG (redline) the GFR (green line) SAV (blueline), the Sahel (light blueline) and over Nigeria(blackline), (D, E), latitudinal yearly and yearly anomaly corelation and (F), percentage synchronization of the yearly anomaly.
3.2 Validation of VECTRI-Control-Run with observed malaria cases in Nigeria
The VCR captures the monthly and seasonal evolution of malaria cases (Figure 3). VCR simulates the hyperendemic characteristics of malaria, including the bi-modal and uni-modal distribution, particularly over the GoG and the SAH (Figures 3A, B, E, F, I, J, M, N). In addition, the model captures the yearly variability of observed malaria cases over most regions of Nigeria, except in 2016 where there is a systematic large overestimation with respect to observations. The model’s yearly variability is consistent from 2018 to 2021 across all regions (Figures 3G, K, O), except over the GoG (Figure 3C), where simulations are close to observations from 2019 onwards. (Figures 3D, H, I, P) demonstrate that the VECTRI model is able to reproduce annual anomaly of malaria cases for 2014-2015, and then from 2019 to 2021 for all eco-regions of Nigeria. Nevertheless, while the model significantly deviates from observations from 2016 to 2018 over the GoG, 2016-2017 over the GFR, and 2016-2018 over the SAH, it only deviates over SAV in 2016. In addition, the VCR simulation captures the observed latitudinal increase in malaria cases from the GoG to the SAH (Figure 4A).
Correlation coefficients between the VCR simulation and observed malaria cases vary by region at monthly (Figure 4B) and seasonal time scale (Figure 4C), but they are generally low. Monthly correlations are negative across Nigeria (Figures 4B) except in January and from September to December. During the dry seasons, the model is negatively correlated with observation estimates, particularly in FMA, MAM, and AMJ (Figure 4C). Correlation increases during the wet seasons of MJJ and JJA, then ASO to OND, but weakens during JAS. Overall, annual correlations between the VCR simulation and the observations are low (Figures 4A–C). Despite low correlations at annual time scale, correlations are strong over the Sahelian part of Nigeria during the second half of the transmission season (July to-October), when observed seasonal cases tend to increase (Figures 3M, N).
The observed discrepancies in correlation coefficients, specifically the moderate to negative and positive correlations between malaria and VCR depicted in Figure 4, may be ascribed to a multitude of factors. A fundamental element is the inherently intricate nature of malaria (which may include various species of Anopheles) transmission dynamics, which are impacted by several human, environmental, and ecological factors that are not considered by the VECTRI model.
Figure 4F shows a synchronization of 65% over both the GoG and GFR, with a maximum synchronization of 90% over SAV and a synchronization of approximately 75% over the SAH. The VECTRI model can predict the annual anomaly of malaria cases in the SAV region of Nigeria nine times out of ten (Figure 4F).
3.3 VECTRI-Forecast-Run and VECTRI-Control-Run
(Figures 5A–D) demonstrate that the correlations between VFR and VCR vary across regions for each year for all SDs and LTs. Despite being low, Figure 5A reveals that the correlation between LT1 and LT3 to LT7 is better to that of the GoG. While the correlation of LT1 across other regions is negative, the correlation of LT3 to LT7 across the SAH was the lowest. In comparison, LT2 has the highest correlation for the SAH but the lowest correlation for the GoG. Theoretically, seasonal climate forecast (used as inputs to the VECTRI model) tend to be more skillful at short lead times. In addition, there are large uncertainties in predicting rainfall at seasonal time scale over West Africa (42) (Pirret et al., 2020).
Figure 5
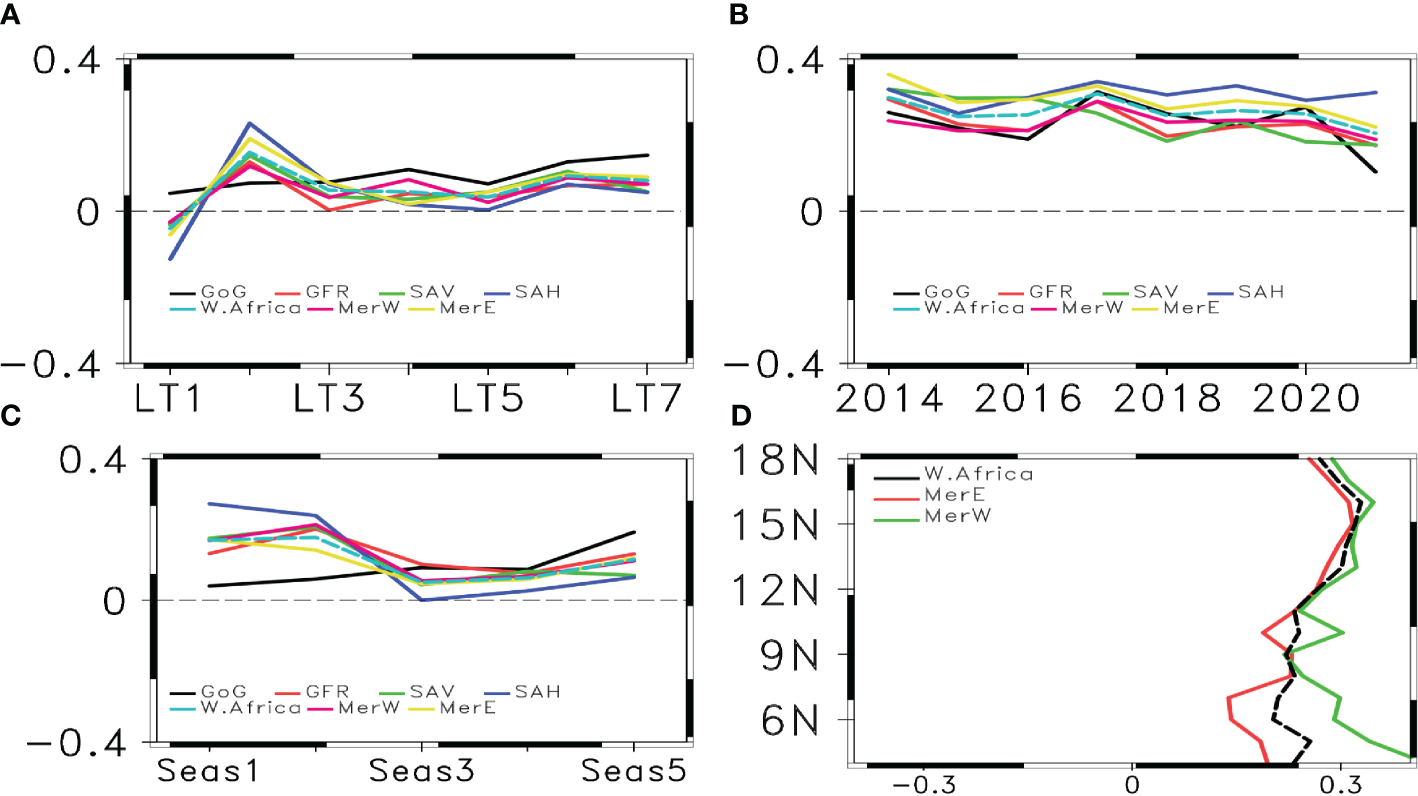
Correlation between the VCR and VFR malaria cases for (A), each LT from all SDs, (B) each year from all SDs and LTs, (C) each season from all SDs across the GoG (blackline), GFR (redline), SAV (green line), SAH (blueline), W. Africa (light blueline), MerW (magenta line), and MerE (yellow line) regions. (D) Latitudinal correlation coefficients for all LTs from all SDs, across W. Africa (blackline), MerW (redline), and MerE (green line) regions.
The correlation between VFR and VCR improved marginally annually from all SDs at all LTs (Figure 5C), compared to the correlation from all SDs at each LT across the MerE, MerW, and West African regions. The yearly correlation over the SAH is the highest, particularly from 2016 to 2021 (Figure 4B), whereas the correlation over the SAV is the lowest during this period. Over West Africa, the yearly correlation is greater over MerE than MerW, with 2017 exhibiting a significant improvement in correlations across all regions except for SAV.
Additionally, the correlations for all SDs and all seasons are weak. Figure 5C demonstrates an increase in correlation from Seas 3 to Seas 5 across all regions, except for the GoG region, where correlation increases from Seas 1 to Seas 5. In addition, while correlation improves from Seas 1 to Seas 2 over the majority of regions, Figure 5C indicates that correlation decreases in the SAH and MerE regions. The correlation between VCR and VFR tends to increase with increasing latitude. Figure 5C indicates that correlations between VCR and VFR for all SDs and all LTs are larger in MerW regions. The correlation computed across months seasons and years is statistically significant as their p-values range between 0.0002 and 0.002, i.e.,<< 0.05.
The probabilistic accuracy of the model is significant with some variation across regions for all SDs and all LT. Figure 6A demonstrates that while the LT1 has the largest RPSS over the SAH and the lowest RPSS over the GoG, the GFR has the highest RPSS from LT3 to LT6, whereas the RPSS over the SAH has the lowest RPSS at the same LTs. In addition, the order of RPSS increase or decrease is not sequential. Figure 6A demonstrates that while the RPSS decreases from LT1 to LT3, it increases from LT3 to LT7. MerW exhibits the strongest RPSS from LT3 to LT7, just as MerE exhibits the strongest RPSS from LT1 to LT3. As depicted in Figure 6B, although the model RPSS is stronger in regions MerW, particularly above latitude 9°N, it exhibits a bimodal distribution latitudinally.
Figure 6
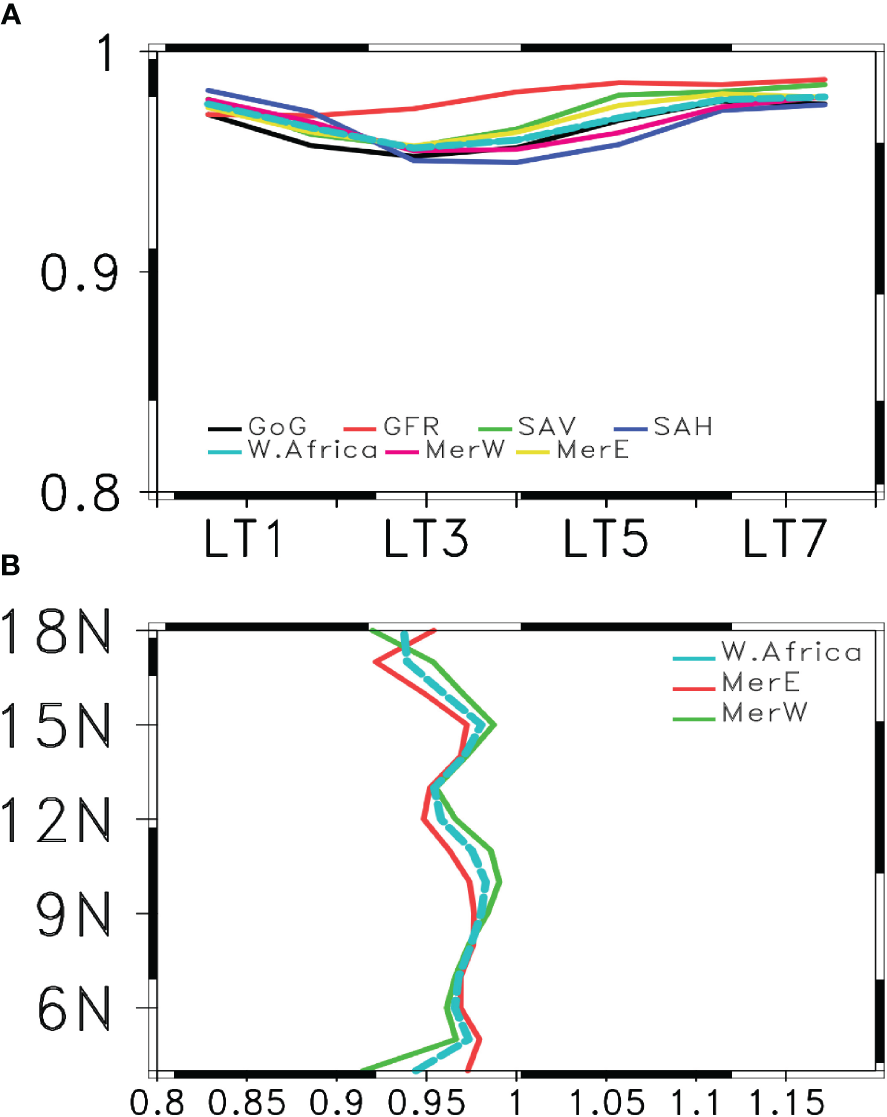
Rank Probability Skill Scores (RPSS) between the VCR and VFR simulations for each LT, from all SDs over (A) the GoG (blackline), GFR (redline), SAV (green line), Sahel (blueline), W.Africa (light blueline), MerW (magenta line), and MerE (yellow line) regions. (B) Latitudinal RPSS over W. Africa (blackline), MerW (redline), and MerE (green line) regions.
As depicted in Figure 7, the propensity of the model to distinguish anomalous malaria cases across all SDs and LTs varies by region. With an AUC of 0.59 and 0.51, it shows low skill over the SAH (Figure 7B) and MerE (Figure 7B). The model’s skill over the GoG, GFR, and SAV (Figure 7A) is moderate, with AUCs of 0.64, 0.66, and 0.62 respectively. The separability of the model supports the utility of the synchronization technique, which compensates for low correlation skill, especially when considering time anomalies.
Figure 7
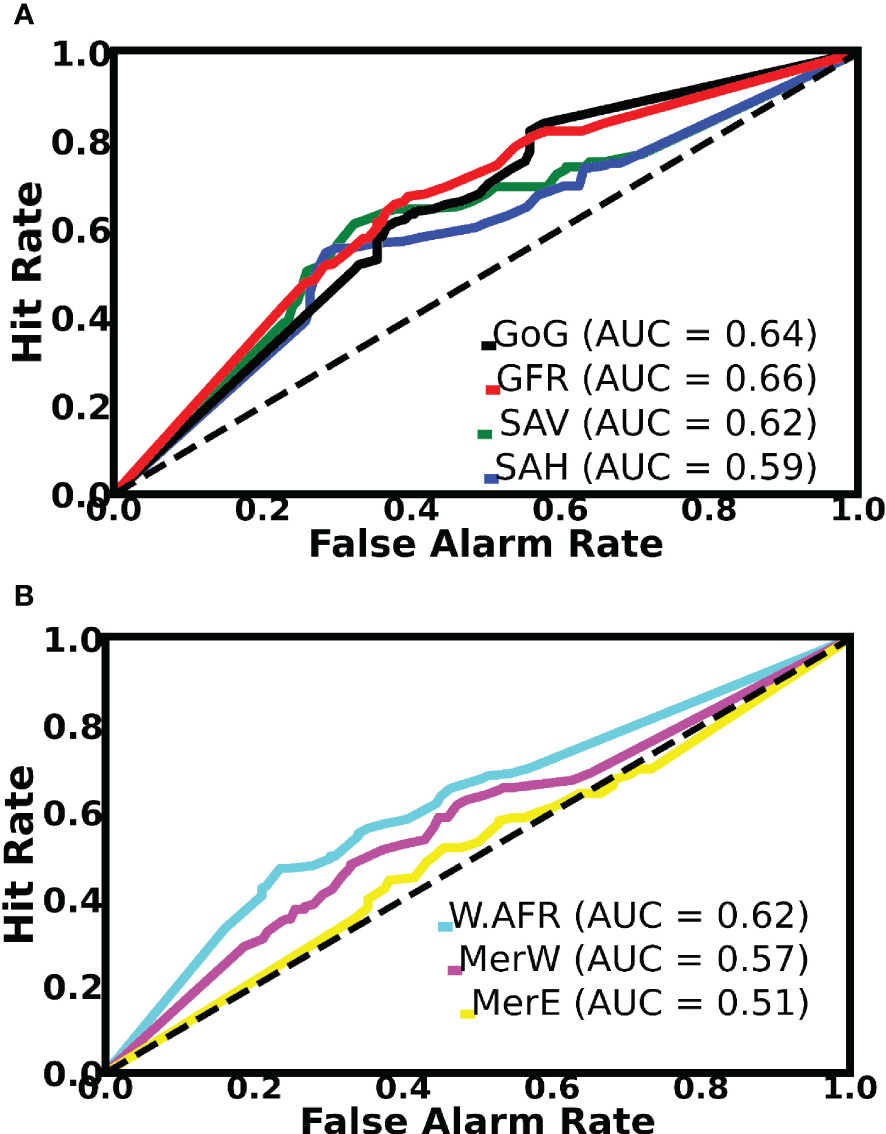
Relative operating characteristic (ROC) diagram based on VCR and VFR probability standardized anomaly over (A), the GoG (black line), GFR (red line), SAV (green line), SAH (blue line), and (B), across W. Africa (light blueline), MerW (magenta line), and MerE (yellow line) for all SDs and each LT.
4 Conclusion
Malaria continues to be a leading cause of death, financial burden over the African continent. In this study, we investigate the capability of the VECTRI model to simulate malaria cases over a seasonal time range of 1 to 7 months using multiple verification metrics and a two-hierarchical evaluation technique.
The results of the VCR indicate that VECTRI is able to reproduce the hyperendemic nature and evolution of malaria in Nigeria, specifically the increasing number of cases with decreasing population density in rural areas. Despite having inherent biases and low correlations with observations, the model demonstrates strong synchronization ability in predicting annual anomalies in malaria cases across Nigeria, particularly in the savannah region.
For all years, the model correlation coefficients at all LTs from each SD date across West Africa are low, with an improvement in lead time from the Gulf of Guinea to the Sahel region.
The observed variability in correlation coefficients may be attributed to several environmental, ecological and human factors that are not considered in the current version of the VECTRI model. Variation in vector species (including insecticide resistant strains) as well as control efforts, availability of public health facilities and human behavior modulate malaria transmission risk locally.
Probabilistic RPSS scores, which reflect the model’s reliability and resolution, indicates that the model has significant skill in predicting categories of malaria cases, regardless of SD, LT, or year under scope. In addition, the highest skill is shown over the Guinean Forest region, the order of increase or decrease of the RPSS from LT1 to LT7 varies and is not sequential across regions.
Furthermore, with an average Area Under the ROC Curve (AUC) of approximately 0.62, the model’s ability to distinguish the variability of malaria cases in all regions is relatively good. Additionally, the results suggest that the use of an ensemble seasonal forecast is an added value.
Our results suggest that the VECTRI malaria model could be a reliable Malaria Early Warning System (MEWS) tool, particularly for identifying malaria hyper-endemic zones in Nigeria and West Africa at seasonal time scale.
Statements
Data availability statement
Publicly available datasets were analyzed in this study. This data can be found here: https://endmalaria.org/resources.
Author contributions
EO: Conceptualization, Data curation, Formal analysis, Investigation, Methodology, Software, Visualization, Writing – original draft. CC: Conceptualization, Methodology, Supervision, Writing – review & editing. AT: Conceptualization, Methodology, Software, Supervision, Visualization, Writing – review & editing.
Funding
The author(s) declare that no financial support was received for the research, authorship, and/or publication of this article.
Acknowledgments
The authors would like to express their gratitude to Roll Back Malaria Nigeria Abuja for providing the data used in this study. We also want to thank Adrian Tompkins (International Center for Theoretical Physics,ICTP, Trieste, Italy) for his enormous contribution to the success of this work. The first author would also like to thank the Abdus Salam ICTP for their support.
Conflict of interest
The authors declare that the research was conducted in the absence of any commercial or financial relationships that could be construed as a potential conflict of interest.
Publisher’s note
All claims expressed in this article are solely those of the authors and do not necessarily represent those of their affiliated organizations, or those of the publisher, the editors and the reviewers. Any product that may be evaluated in this article, or claim that may be made by its manufacturer, is not guaranteed or endorsed by the publisher.
References
1
WHO . World Malaria Report 2022. Geneva: WHO (2023).
2
Kar NP Kumar A Singh OP Carlton JM Nanda N . A review of malaria transmission dynamics in forest ecosystems. Parasites Vectors. (2014) 7:1–12. doi: 10.1186/1756-3305-7-265
3
Ibeji JU Mwambi H Iddrisu AK . Spatial variation and risk factors of malaria and anaemia among children aged 0 to 59 months : A cross − Sectional study of 2010 and 2015 datasets. Sci Rep. (2022) 12, 11498. doi: 10.1038/s41598-022-15561-4
4
Snow RW Guerra CA Noor AM Myint HY Hay SI . The global distribution of clinical episodes of plasmodium falciparum malaria. Nature. (2005) 434:214–17. doi: 10.1038/nature03342
5
Salihu OM Sanni NA . Malaria burden and the effectiveness of malaria control measures in nigeria : A case study of asa local government area of Kwara State. J Economics Sustain Dev. (2013) 4:295–308.
6
Plan, Strategic . “Federal Ministry of Health, National Malaria Control Programme, Abuja, Nigeria. Strategic Plan 2009-2013 A Road Map for Malaria Control in Nigeria DRAFT 16 June 2008,”. (2013) FMOH. pp. 1–39.
7
Tompkins AM Ermert V . A regional-scale, high resolution dynamical malaria model that accounts for population density, climate and surface hydrology. Malaria J. (2013) 12:1–24. doi: 10.1186/1475-2875-12-65
8
Jones AE Morse AP . Application and validation of a seasonal ensemble prediction system using a dynamic malaria model. J Climate. (2010) 23:4202–15. doi: 10.1175/2010JCLI3208.1
9
Bayoh MN Lindsay SW . Temperature-related duration of aquatic stages of the afrotropical malaria vector mosquito anopheles Gambiae in the laboratory. Med Veterinary Entomology. (2004) 18:174–79. doi: 10.1111/j.0269-283X.2004.00495.x
10
Githeko AK Lindsay SW Confalonieri UE Patz JA . Climate change and vector-borne diseases: A regional analysis. Bull World Health Organ. (2000) 78:1136–47.
11
Lindsay SW Martens WJM . Malaria in the African highlands: Past, present and future. Bull World Health Organ. (1998) 76:33–45.
12
Abiodun GJ Witbooi P Okosun KO . Modeling and analyzing the impact of temperature and rainfall on mosquito population dynamics over Kwazulu-Natal, South Africa. Int J Biomathematics. (2017) 10:1750055. doi: 10.1142/S1793524517500553
13
Asare EO Amekudzi LK . Assessing climate driven malaria variability in Ghana using a regional scale dynamical model. Climate. (2017) 5:1–15. doi: 10.3390/cli5010020
14
Asare EO Tompkins AM Bomblies A . A regional model for malaria vector developmental habitats evaluated using explicit, pond-resolving surface hydrology simulations. PLoS One. (2016) 11:3–8. doi: 10.1371/journal.pone.0150626
15
Lyons CL Coetzee M Chown SL . Stable and fluctuating temperature effects on the development rate and survival of two malaria vectors, anopheles arabiensis and anopheles funestus. Parasites Vectors. (2013) 6:1–9. doi: 10.1186/1756-3305-6-104
16
Thomson MC Doblas-Reyes FJ Mason SJ Hagedorn R Connor SJ Phindela T et al . Malaria early warnings based on seasonal climate forecasts from multi-model ensembles. Nature. (2006) 439:576–79. doi: 10.1038/nature04503
17
Thomson MC Connor SJ . The development of malaria early warning systems for Africa. Trends Parasitol. (2001) 17:438–45. doi: 10.1016/S1471-4922(01)02077-3
18
Ceccato P Ghebremeskel T Jaiteh M Graves PM Levy M Ghebreselassie S et al . Malaria stratification, climate, and epidemic early warning in Eritrea. Am J Trop Med Hygiene. (2007) 77:61–8. doi: 10.4269/ajtmh.2007.77.61
19
Tompkins AM Colón-gonzález FJ Di Giuseppe F . Dynamical Malaria Forecasts Are Skillful at Regional and Local Scales in Uganda up to 4 Months Ahead GeoHealth. GeoHealth (2019) 3:58–66. doi: 10.1029/2018GH000157
20
Tompkins AM Di Giuseppe F . Potential predictability of malaria in Africa using ECMWF monthly and seasonal climate forecasts. J Appl Meteorology Climatology. (2015) 54:521–40. doi: 10.1175/JAMC-D-14-0156.1
21
White CJ Domeisen DIV Acharya N Adefisan EA Anderson ML Aura S et al . Advances in the application and utility of subseasonal-to-seasonal predictions. Bull Am Meteorological Soc. (2021) 103, 1–57. doi: 10.1175/BAMS-D-20-0224.1
22
Olaniyan E Adefisan EA Balogun AA Oyedepo JA . Of sub-seasonal to seasonal (S2S) weather forecasts in predicting recent malaria occurrence in Nigeria using a regional scale dynamical malaria model. Academiascholarlyjournal.Org. (2020) 6:560–78.
23
Skofronick-Jackson G Petersen WA Berg W Kidd C Stocker EF Kirschbaum DB et al . The global precipitation measurement (GPM) mission for science and society. Bull Am Meteorological Soc. (2017) 98:1679–95. doi: 10.1175/BAMS-D-15-00306.1
24
Hersbach H Bell B Berrisford P Hirahara S Horányi A Muñoz-Sabater J et al . The ERA5 global reanalysis. Q J R Meteorological Soc. (2020) 146:1999–2049. doi: 10.1002/qj.3803
25
Maranan M Fink AH Knippertz P Amekudzi LK Atiah WA Stengel M . A process-based validation of gpm imerg and its sources using a mesoscale rain gauge network in the West African forest zone. J Hydrometeorology. (2020) 21:729–49. doi: 10.1175/JHM-D-19-0257.1
26
Stein THM Keat W Maidment RI Landman S Becker E Boyd DFA et al . An evaluation of clouds and precipitation in convection-permitting forecasts for South Africa. Weather Forecasting. (2019) 34:233–54. doi: 10.1175/WAF-D-18-0080.1
27
Sharifi E Steinacker R Saghafian B . Assessment of GPM-IMERG and Other Precipitation Products against Gauge Data under Different Topographic and Climatic Conditions in Iran: Preliminary Results. Remote Sens. (2016) 8:135. doi: 10.3390/rs8020135
28
Cafaro C Woodhams BJ Stein THM Birch CE Webster S Bain CL et al . Do convection-permitting ensembles lead to more skillful short-range probabilistic rainfall forecasts over tropical east Africa? Weather Forecasting. (2021) 36:697–716. doi: 10.1175/WAF-D-20-0172.1
29
Woodhams BJ Birch CE Marsham JH Bain CL Roberts NM Boyd DFA . What is the added value of a convection-permitting model for forecasting extreme rainfall over tropical East Africa? Monthly Weather Rev. (2018) 146:2757–80. doi: 10.1175/MWR-D-17-0396.1
30
Nogueira M Nogueira M Luiz ID De Ciências F Universidade De Lisboa Campo Grande . Based analysis of systematic and random differences. Journal of Hydrology (2020) 583:124632.
31
Beck HE Wood EF Pan M Fisher CK Miralles DG van Dijk AIJM et al . MSWEP V2 global 3-hourly 0.1° Precipitation: methodology and quantitative assessment. Bull Am Meteorological Soc. (2019) 100:473–500. doi: 10.1175/BAMS-D-17-0138.1
32
Johannsen F Ermida S Martins PA Trigo IF Nogueira M Dutra E . Cold bias of ERA5 summertime daily maximum land surface temperature over Iberian Peninsula. Remote Sensing (2019) 11:2570. doi: 10.20944/preprints201909.0268.v1
33
Ruben U Huld T Gracia-Amillo A Martinez-de-Pison FJ Sanz-Garcia A Kaspar F . Evaluation of Global Horizontal Irradiance Estimates from ERA5 and COSMO-REA6 Reanalyses Using Ground and Satellite-Based Data. Elsevier Enhanced Reader. Available online at: https://reader.elsevier.com/reader/sd/pii/ (Accessed July 11, 2022).
34
Ramon J Lledó L Torralba V Soret A Doblas-Reyes FJ . What global reanalysis best represents near-surface winds? Q J R Meteorological Soc. (2019) 145:3236–51. doi: 10.1002/qj.3616
35
Belmonte Rivas M Stoffelen A . Characterizing ERA-interim and ERA5 surface wind biases using ASCAT. Ocean Sci. (2019) 15:831–52. doi: 10.5194/os-15-831-2019
36
Olaniyan E Adefisan EA Balogun AA Lawal KA . The influence of global climate drivers on monsoon onset variability in Nigeria using S2S models. Modeling Earth Syst Environ. (2019) 5:1405–28. doi: 10.1007/s40808-019-00606-x
37
Misra J . 1 problem statement 2 an informal description of the solution. Inf Process Lett (1990) 38:101–05.
38
Weigel AP Liniger MA Appenzeller C . The discrete brier and ranked probability skill scores. Monthly Weather Rev. (2007) 135:118–24. doi: 10.1175/MWR3280.1
39
Paaijmans KP Wandago MO Githeko AK Takken W . Paaijmans2007.Pdf. PlusOne. (2007) 2:1–7.
40
Berg A Lintner B Findell K Giannini A . Soil moisture influence on seasonality and large-scale circulation in simulations of the West African Monsoon. J Climate. (2017) 30:2295–317. doi: 10.1175/JCLI-D-15-0877.1
41
Martens P Kovats RS Nijhof S De Vries P Livermore MTJ Bradley DJ et al . Climate change and future populations at risk of malaria. Global Environ Change. (1999) 9:S89–107. doi: 10.1016/S0959-3780(99)00020-5
42
Pirret JSR Daron JD Bett PE Fournier N Foamouhoue AK . Assessing the skill and reliability of seasonal climate forecasts in Sahelian West Africa. Wea. Forecasting. (2020) 35:1035–50. doi: 10.1175/WAF-D-19-0168.1
Summary
Keywords
ECMWF-seasonal-forecasts, malaria, early warning system, VECTRI, West Africa
Citation
Olaniyan EA, Tompkins AM and Caminade C (2024) Predicting malaria hyper endemic zones in West Africa using a regional scale dynamical malaria model. Front. Trop. Dis 5:1322502. doi: 10.3389/fitd.2024.1322502
Received
16 October 2023
Accepted
24 June 2024
Published
16 July 2024
Volume
5 - 2024
Edited by
Ramesh C. Dhiman, National Institute of Malaria Research (ICMR), India
Reviewed by
Alain M. Dikande, University of Buea, Cameroon
Ibrahima Diouf, Cheikh Anta Diop University, Senegal
Updates
Copyright
© 2024 Olaniyan, Tompkins and Caminade.
This is an open-access article distributed under the terms of the Creative Commons Attribution License (CC BY). The use, distribution or reproduction in other forums is permitted, provided the original author(s) and the copyright owner(s) are credited and that the original publication in this journal is cited, in accordance with accepted academic practice. No use, distribution or reproduction is permitted which does not comply with these terms.
*Correspondence: Eniola A. Olaniyan, olaniyan.eniola67@gmail.com
Disclaimer
All claims expressed in this article are solely those of the authors and do not necessarily represent those of their affiliated organizations, or those of the publisher, the editors and the reviewers. Any product that may be evaluated in this article or claim that may be made by its manufacturer is not guaranteed or endorsed by the publisher.