 Ibrahima Diouf
 Ibrahima Sy2
 Moussa Diakhaté
94% of researchers rate our articles as excellent or good
Learn more about the work of our research integrity team to safeguard the quality of each article we publish.
Find out more
ORIGINAL RESEARCH article
Front. Trop. Dis. , 09 February 2024
Sec. Major Tropical Diseases
Volume 4 - 2023 | https://doi.org/10.3389/fitd.2023.1287499
This study examines the relationship between climate change and public health in Haiti, a country already facing socioeconomic challenges. The well-being of Haiti’s vulnerable population is expected to be further affected by climate change, leading to an increase in vector-borne, water-borne, and heat-related diseases. As one of the most vulnerable countries to climate change effects, Haiti is currently experiencing an increase in vector-borne diseases such as malaria, dengue, and chikungunya, as well as water-borne diseases and emerging zoonotic outbreaks. This study aims to improve planning, decision-making, and responses to public health challenges by utilizing health data, climatic information, and impact models. The methodology involves the creation of a comprehensive climate and health database to uncover detailed spatial-temporal relationships on a national scale. By evaluating disease indicators from historical periods (1950-2014) and future projections (2015-2100) using the Shared Socio-Economic Pathways (SSPs) from the multi-model ensemble mean of the CMIP6 models, target diseases, including malaria, meningitis, dengue, and heat-sensitive chronic diseases are assessed. Our results highlight a decrease in rainfall and a strong increase in temperatures, especially within western Haiti under the extreme SSP585 scenario. The ability of the impact models to simulate the seasonality and spatial distribution of malaria incidence, dengue and heatwaves was performed. The analysis of risks related to climate-sensitive diseases’ climatic parameters shows that Haiti’s west and central regions are mostly exposed to vector-borne and water-borne diseases. Models predict a decrease in malaria cases due to climate change with hot temperatures and a decline in rainfall, while dengue transmission patterns may undergo changes. These findings will inform the implementation of context-specific early-warning systems and adaptation strategies for climate-sensitive diseases while acknowledging the challenges of integrating climate-altered data into health policies.
The Pan American Health Organization (PAHO) and the World Health Organization (WHO) in Haiti are collaborating with the Ministère de la Sante Publique et de la Population de Haiti (MSPP, Ministry of Public Health and Population) to offer technical assistance aimed at accelerating the development and execution of its national health adaptation plan. The primary aim is to bolster the healthcare system’s resilience in the face of climate change impacts. This technical support aligns with the vision outlined in the World Health Organization’s (WHO) 2017-2021 framework on climate change and health, which primarily targets leaders, professionals, and managers in the healthcare sector within the region (1).
The overarching goal of this framework is to fortify healthcare systems’ resilience to climate change by proposing a systematic program to streamline the public health response within the healthcare sector and related fields (2). This objective can be realized by enhancing the Ministry of Health in Haiti’s capacity to safeguard public health in the midst of varying and evolving climatic conditions. This includes the anticipation, prevention, preparedness, and management of health risks linked to climate change. Furthermore, the WHO’s support aims to facilitate the establishment of partnerships and access to financial resources to strengthen the healthcare sector’s response to climate change (Ministry of the Environment, hereafter referred to as MDE in French, 2022).
Haiti is indeed one of the countries most susceptible to the consequences of climate change, particularly in the healthcare sector. This vulnerability is marked by a surge in vector-borne diseases such as malaria, filariasis, dengue, and chikungunya, as well as waterborne diseases with a high epidemic potential, including typhoid, cholera, and diarrhea. Additionally, there are recurrent instances of bronchitis and rhinitis, alongside emerging outbreaks of zoonotic diseases in specific regions (3; Civil Protection Directorate, hereafter referred to as DPC in French, 2019; Ministère de la Santé Publique et de la Population, hereafter referred to as MSPP in French, 2020. These health challenges, closely linked to climate-related risks, have resulted in numerous fatalities in Haiti, presenting substantial developmental hurdles that have captured the attention of healthcare sector stakeholders and underscored the significance of addressing climate change and health.
In response to these emerging health risks associated with climate change impacts, the National Climate Change Plan (PNCC) and the Nationally Determined Contribution (NDC), coordinated processes led by the MDE, recommend a set of adaptation options and measures for the healthcare sector to enhance its resilience (3, 4). Achieving this necessitates the strengthening of the Ministry of Public Health and Population’s (MSPP’s institutional capacities concerning climate change and health. This entails the development of instruments and documents that incorporate this new health concern into the planning and implementation of national health development policies as a top priority.
In a broader context, the objective of the technical assistance mission is to aid the healthcare sector in conducting vulnerability and adaptation assessments, assisting in the evaluation of emission sources, proposing mitigation strategies, and preparing for the implementation of its national climate change adaptation plan alongside a financing mobilization strategy. One of the primary anticipated outcomes of the mission is the production of a report on the vulnerability and adaptation assessment of health systems and services to climate change. This report will help formulate strategies for enhancing the healthcare sector’s resilience to climate change effects, as well as a multi-year adaptation plan to mitigate the impact on the most vulnerable populations.
To achieve these critical objectives of the technical assistance mission, it is imperative to collect and analyze both quantitative and qualitative data. Consequently, this paper’s primary objective is to present a report of the findings from the analysis of quantitative data, particularly those related to climate and health. This step is foundational before conducting participatory workshops to gather qualitative data for assessing the vulnerability and adaptability of Haiti’s healthcare system.
Haiti, situated in the Caribbean region, shares the island of Hispaniola with the Dominican Republic. Its geographic coordinates span from 18°N to 20°N latitude and 71°W to 74°W longitude (Figure 1).
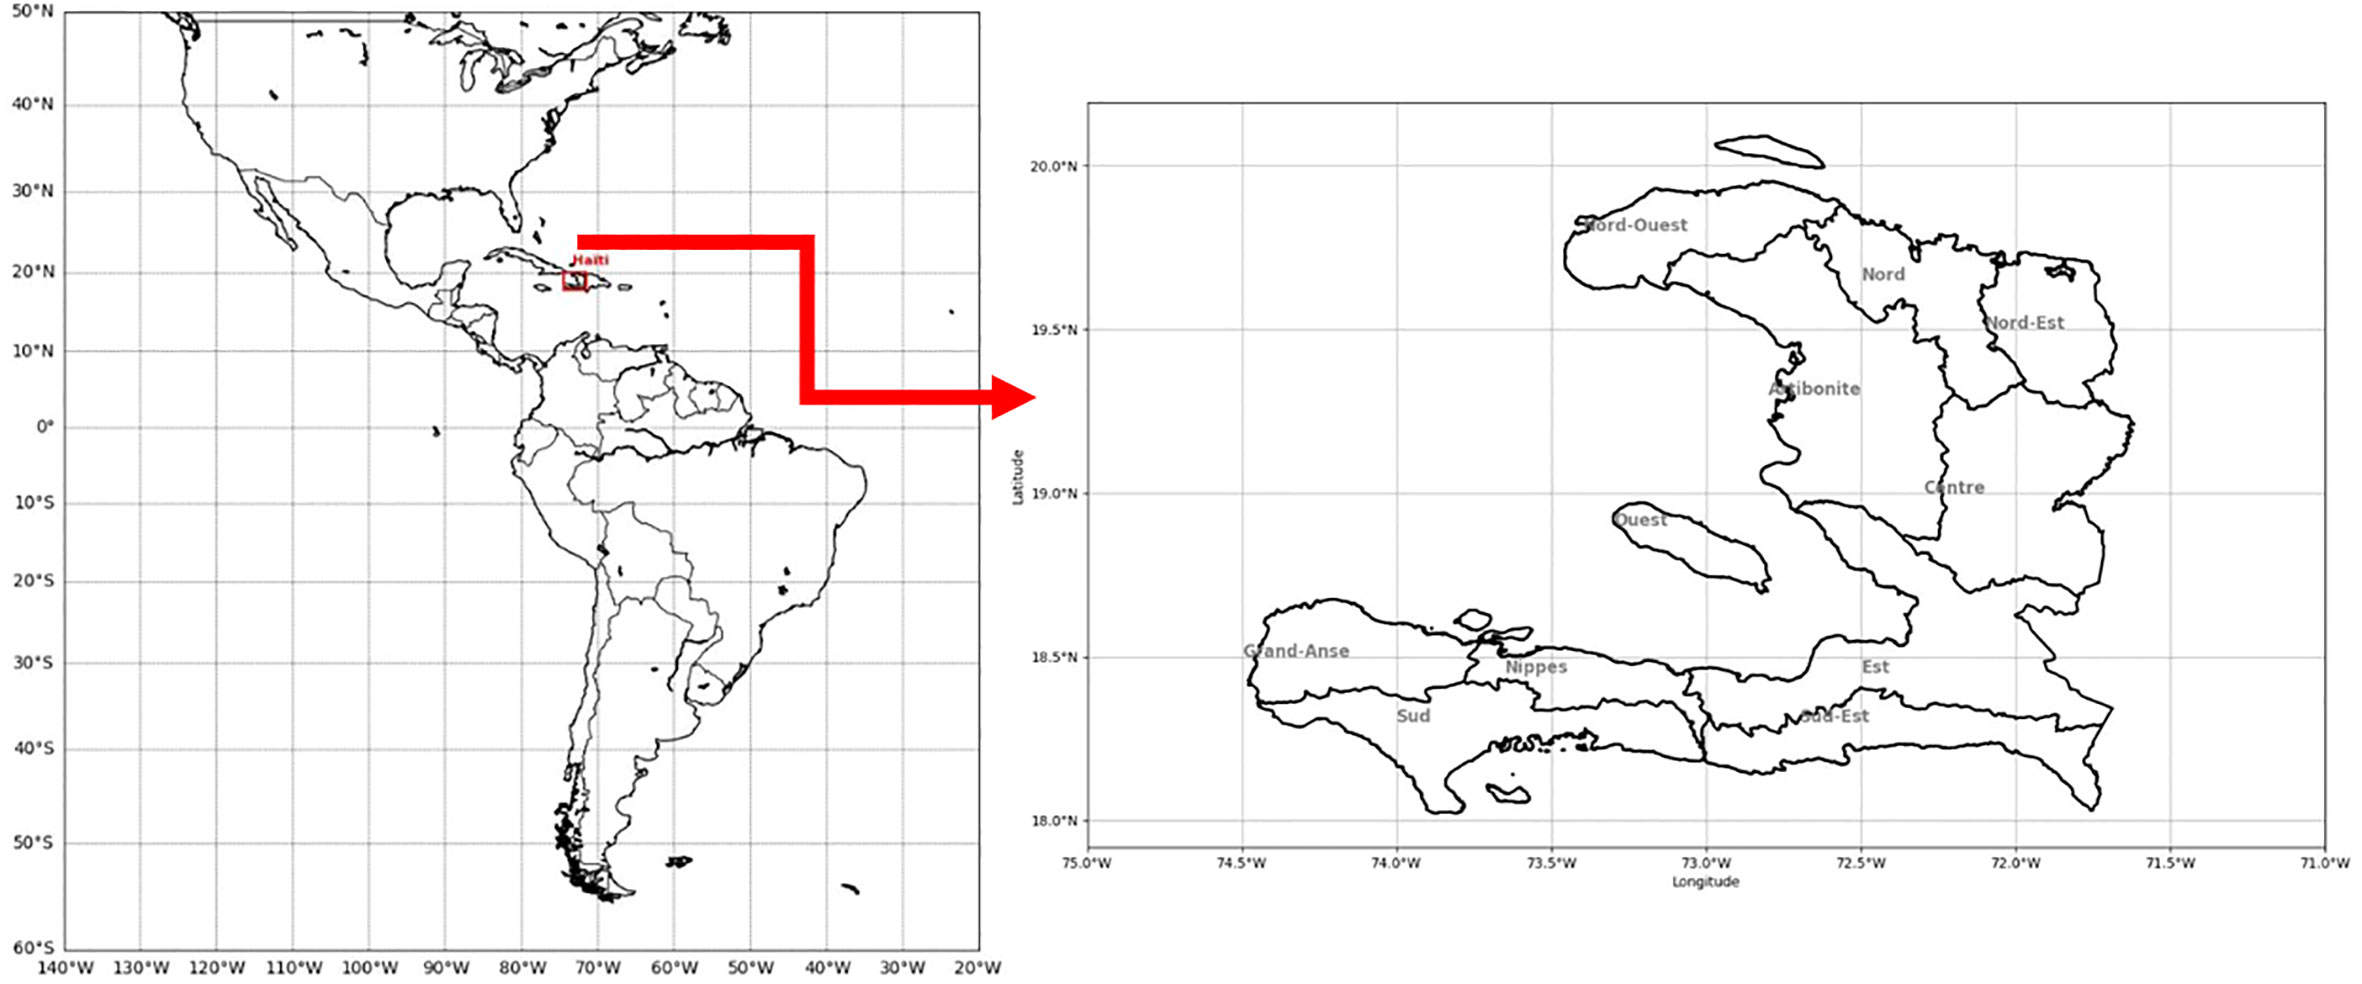
Figure 1 Map of Haiti, showing its position (left panel), and its various departments (right panel).
Haiti displays a diverse range of climate characteristics across its distinct ecoregions. Factors such as topography, elevation variations, and its proximity to the Caribbean Sea contribute to the climate variations within the country. Below is a summary of the climate features found in various ecoregions within Haiti:
● Lowland Coastal Areas: These regions experience a tropical maritime climate, featuring consistently elevated temperatures with minimal seasonal fluctuations. The proximity to the sea results in significant humidity levels. Frequent rainfall occurs, particularly during the wet season from May to October. These areas are also susceptible to the impacts of hurricanes and tropical storms during the hurricane season from June to November.
● Central Plateau: This area has a subtropical highland climate due to its elevated terrain. Temperatures are cooler compared to coastal regions, especially at night. Precipitation is concentrated in the wet season, while the dry season (November to April) sees reduced rainfall. Notably, there is a discernible variation in rainfall patterns between the northern and southern sections of the plateau.
● Mountainous Areas: The elevated regions exhibit a highland or mountainous climate characterized by cooler temperatures and more pronounced daily temperature fluctuations. On the windward sides of mountains, increased rainfall occurs due to orographic influences. At higher elevations, there’s a likelihood of fog and mist.
● Northern Plains: These regions have a transitional climate, situated between tropical maritime and subtropical highland conditions. The weather features moderate temperatures with distinct wet and dry periods. Precipitation is concentrated primarily during the wet season, which can extend into the early part of winter.
● Southern Peninsula: This area displays a tropical arid or semi-arid climate characterized by lower precipitation levels compared to other regions of Haiti. It experiences elevated temperatures and faces the potential for water scarcity, making it susceptible to drought conditions.
● Northern Coastal Areas: Like the lowland coastal zones, these territories encounter a tropical maritime climate with high temperatures and humidity levels. They receive frequent rainfall throughout the wet season and are also prone to hurricanes and tropical storms during the hurricane season.
The structure of this study is as follows: Section 2 presents the data types used and the methods applied. In Section 3, we analyze the spatiotemporal dynamics of health and climatic data, specifically focusing on rainfall and temperature, across Haiti. This section also includes the results of simulated diseases using impact models driven by the collected data. Finally, in Section 4, we provide a concise summary of the main findings of this study.
Regarding our data collection efforts, we have gathered health data from the various health districts of Haiti. This health-related data encompasses the reported cases of diseases documented at the departmental level. Detailed information about the health database used can be found in Table 1.
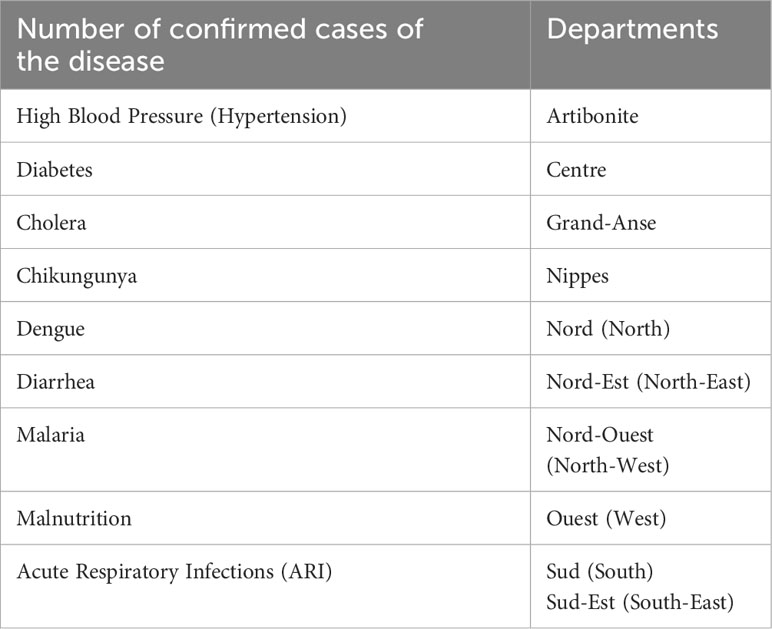
Table 1 Monthly health database on non-communicable diseases (2015-2022).
However, it essential to clarify that while the health database covers a wide range of diseases, not all of them are sensitive to climate variations. There is a vital distinction to be made between two aspects: scientific evidence, which provides us with insights into our existing knowledge, and non-climatic factors.
We emphasize the significance of considering scientific evidence when selecting diseases for further investigation. In the context of certain poorly documented diseases, it becomes apparent that these particular diseases are not influenced by climate factors, making it challenging to assert that climate changes will impact them. This assertion holds especially true for specific chronic ailments or neglected tropical diseases. While the link between these diseases and climate may not be in question, it is also imperative to demonstrate the existence of scientific research within the study area that is pertinent to climate or climate variations.
ERA5, a climate reanalysis dataset, has been developed by the Copernicus Climate Change Service (C3S) and encompasses data from 1979 to the current date. This dataset is readily accessible and can be downloaded free of charge through the C3S Climate Data Store. The European Centre for Medium-Range Weather Forecasts (ECMWF) is responsible for the data processing of ERA5, utilizing the Integrated Forecasting System (IFS) model.
ERA5 represents the fifth significant global reanalysis conducted by ECMWF, and its acronym, “ERA,” stands for “European Centre for Medium-Range Weather Forecasts Reanalysis.” Presently, the dataset is accessible with a 3-month time lag, covering the timeframe from 1979 to 2023.
ERA5 includes most of the parameters that were available in its predecessor, ERA-Interim, and also introduces several additional parameters. It maintains the same 37 pressure levels as ERA-Interim. The temporal resolution for ensemble data is 3 hours, while the deterministic ERA5 product provides hourly resolution. The dataset is stored in the GRIB file format, offering access to all ensemble members as well as mean and spread values.
https://cds.climate.copernicus.eu/cdsapp#!/dataset/reanalysis-era5-pressure-levels?
To examine potential future consequences, the Intergovernmental Panel on Climate Change (IPCC) in its 6th Assessment report (AR6) (5), utilizes five scenarios referred to as Shared Socio-economic Pathways (SSPs), often called “economic trajectories.” Economists and sociologists evaluate the costs associated with adapting to and mitigating the effects of climate change based on various socio-economic scenarios that align with Representative Concentration Pathway (RCP) scenarios.
RCP scenarios encompass four radiative forcing pathways extending up to the year 2100. These pathways were established by the IPCC for its 5th assessment report, AR5 (6). A RCP scenario serves as a tool to model future climate conditions. In the AR5, each RCP scenario is rooted in four distinct assumptions regarding the quantification of greenhouse gas emissions from 2000 to 2100. Each RCP scenario provides an anticipated representation of the climate outcomes linked to the selected emission level. These scenarios are named after the radiative forcing range projected for the year 2100: RCP 2.6 corresponds to a forcing of +2.6 W/m² (Watts per square meter), RCP 4.5 to +4.5 W/m², and similarly for RCP 6 and RCP 8.5. The higher the value, the greater the energy that the Earth-atmosphere system accrues, resulting in increased warming. These scenarios, known as SSPs, are presented based on the efforts required for adaptation and mitigation if the world adheres to these trajectories.
In this research, we utilized the multi-model ensemble mean derived from fifteen (15) global circulation models, including the Coupled Model Intercomparison Project, version 6. To enhance data accuracy, we employed a bias correction technique, specifically the CDF-t (Cumulative Distribution Function transform) method (7). These simulations are available at a daily time step, spanning the periods 1850-2014 (Historical) and 2015-2100 (projections). Both observed and simulated datasets were harmonized onto a shared grid to ensure consistency in the analysis and interpolation. The reference period chosen for this study spans from 1985 to 2014. Detailed information regarding the data, scenarios, and temporal scale of CMIP6 data can be found in Tables 2, 3.
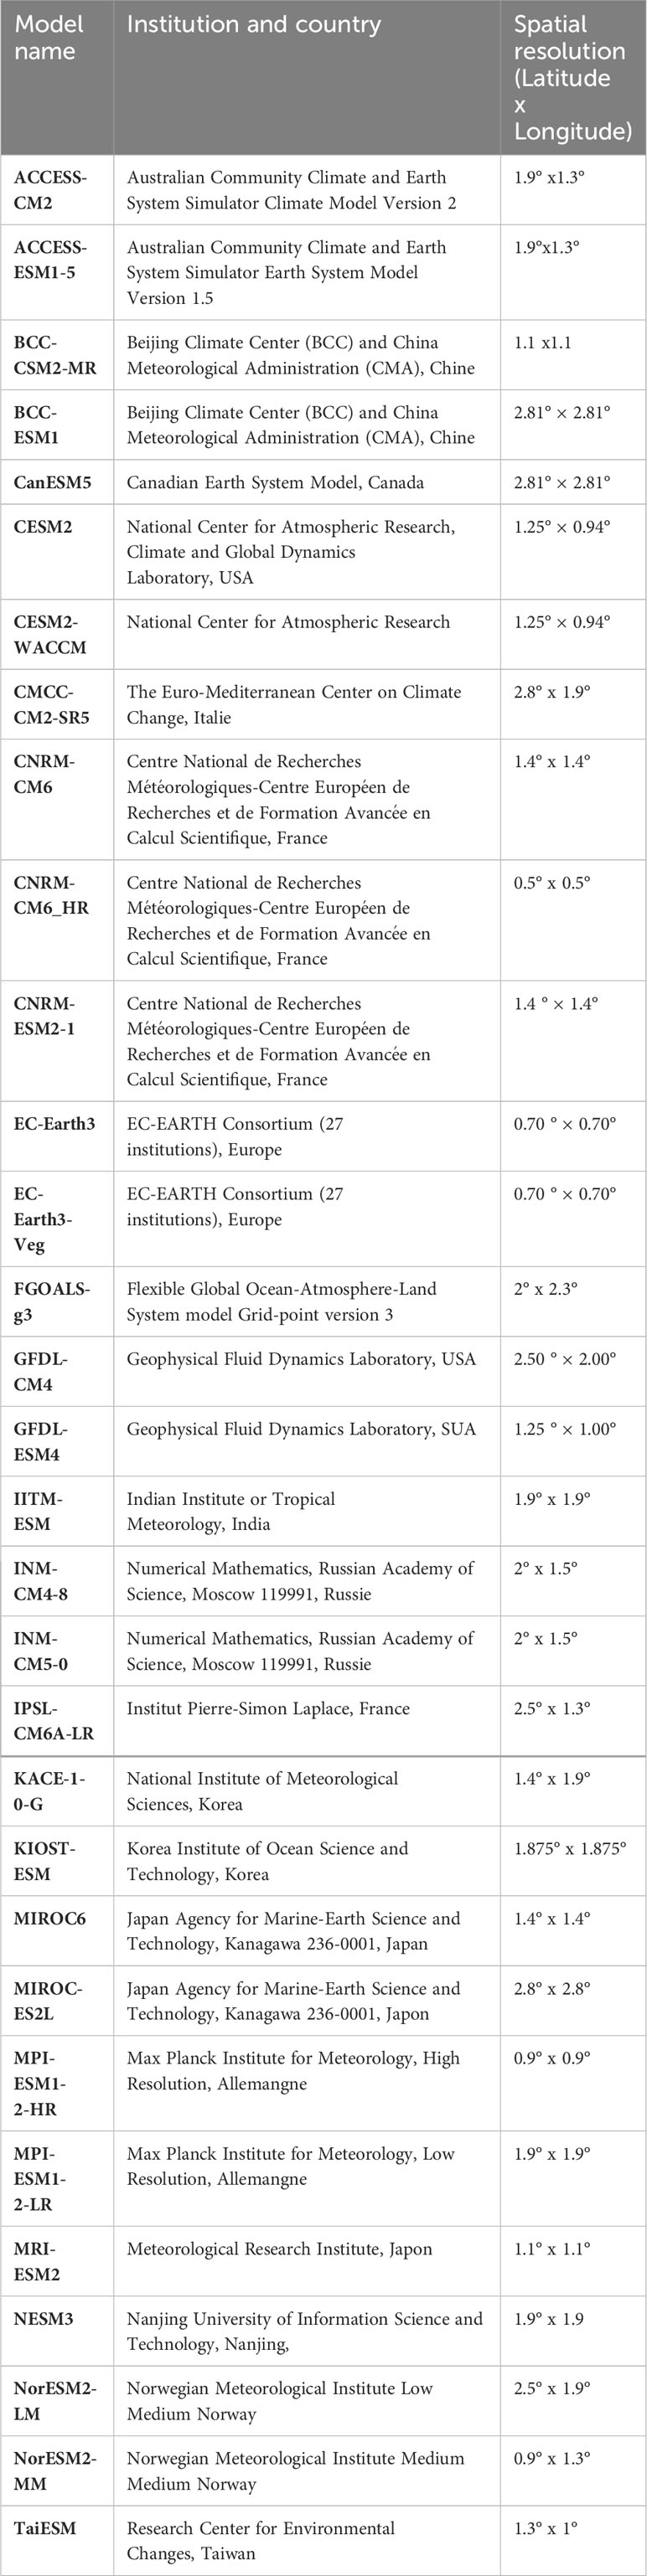
Table 2 CMIP6 models, their institutions and countries of origin, and their resolution.
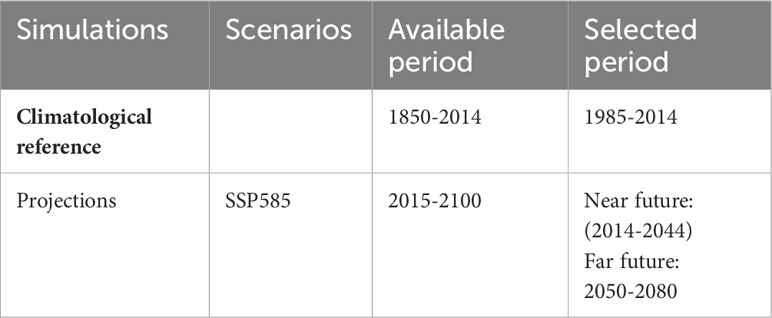
Table 3 CMIP6 data, scenario, and time scales.
The Liverpool Malaria Model (LMM) is a dynamic model designed for studying malaria, utilizing daily time series data for precipitation and temperatures. For a detailed understanding of the model’s components and parameter calibration, see Hoshen and Morse (8) and Ermert et al. (9). The LMM is a mathematical-biological model that primarily focuses on parasite dynamics. It encompasses both an intra-vector phase, which is influenced by weather conditions, and an intra-host phase that operates independently of weather conditions.
Within the LMM, the mosquito population is simulated by considering both larval and adult stages. The number of eggs deposited in breeding sites and the larval mortality rate are influenced by the amount of rainfall in the preceding 10 days. In contrast, the mortality rate of adult mosquitoes and the egg-laying/biting cycle, known as the gonotrophic cycle, are temperature-dependent. The model also accounts for the transmission of parasites between humans and mosquitoes, taking into consideration temperature-dependent factors, such as the reproduction rate of the parasite (sporogonic cycle) and mosquito biting rate. These cycles evolve based on the accumulation of “degree-days” above a specific temperature threshold. For instance, the gonotrophic cycle accumulates around 37 degree-days, while the sporogonic cycle accumulates approximately 111 degree-days with a threshold of 9°C (18°C) (10).
The LMM has found widespread application in climate and health studies across Southern Africa, including Botswana, as well as across the African continent (11, 12). The model generates key output variables, including incidence, prevalence, and mosquito population dynamics, among others. The current version of the model, known as LMM2010, has demonstrated significant enhancements in simulating malaria dynamics in Sub-Saharan African countries, including Haiti. Researchers have also utilized this version to assess the future risk of malaria due to climate change, as exemplified by studies conducted in Senegal by Diouf et al. (13, 14).
The relative Vectorial capacity (rVc) model is a mathematical framework used to evaluate a vector’s ability to transmit a disease within human populations. This model considers multiple factors, including interactions between hosts and vectors as well as between viruses and vectors, assuming the existence of these three parameters (15, 16). Its primary function is to estimate the average daily number of secondary cases that can be generated by an initial case introduced into a fully susceptible population (15). The expression of the rVc model is as follows:
rVc= α2 βhβme-μmn)/μm; où:
- 1) α =Biting rate (17).
- 2) βm = probability of infection from humans to vector per bite (18).
- 3) βh = probability of transmission from vector to human per bite (17, 18);
- 4) η = Extrinsic incubation period (19–21).
- 5) μm = Mortality rate (22).
The equations for these five parameters are respectively provided below:
1) Biting rate (α).
2) The probability of infection from humans to vector per bite (βm).
3) The probability of transmission from vector to human per bite (βh).
4) Extrinsic incubation period (η).
5) Mortality rate (μm).
The computation of the heat and discomfort index is employed in the analysis of the multi-model ensemble mean derived from CMIP6 data. This forms a crucial component of our study, which aims to investigate forthcoming alterations in thermal stress levels and identify high-risk departments under varying time scales of climate warming scenarios in Haiti. To evaluate the stress induced by the joint influence of temperature and humidity, we have implemented the heat index formulation developed by Rothfusz and NWS Region Headquarters (23), as provided by the National Oceanic and Atmospheric Administration (NOAA) National Weather Service (NWS). This index, commonly referred to as HI, is expressed by the following equation:
where T is the temperature in degrees Fahrenheit (°F), and RH is the relative humidity in percentage.
This formulation was developed by conducting a multiple regression analysis of the Steadman equation (24), which calculates the apparent temperature, taking into account various physiological and environmental factors. The goal was to simplify this equation by expressing it in terms of two commonly used and well-understood variables: ambient air temperature and relative humidity. As a result, the Heat Index (HI) is represented as the apparent temperature in degrees Fahrenheit.
It is important to note that the complete regression equation is applicable only when the temperature and humidity values yield a heat index (HI) above 80°F (27°C). In cases meeting this criterion, the formula undergoes several adjustments based on the temperature and relative humidity values.
To illustrate, if the relative humidity (RH) falls below 13% and the ambient air temperature (T) falls within the range of 80°F to 112°F, the following adjustment is subtracted from the HI:
Secondly, if RH is greater than 85% and T is between 80°F and 87°F, the following adjustment is added to the HI:
This function calculates the heat index based on the temperature in degrees Fahrenheit and the relative humidity. The heat index is provided in Fahrenheit, and comfort is categorized into 4 classes: “uncomfortable” = 1; “extremely uncomfortable” = 2; “dangerous” = 3; “extremely dangerous” = 4.
The variability of temperature and precipitation is a major climatic characteristic of Haiti, irrespective of the spatial and temporal scale of analysis. Figure 2 illustrates the annual and interannual variations of precipitation for both the historical period and projections under the SSP585 scenario. In Figure 2A, the amplitude variation of precipitation is more pronounced during the August-October period, both in the historical data and the projections. The precipitation pattern remains relatively consistent between the historical data and the SSP585 scenario, with a peak of over 125 mm in October. Both time series align with the annual cycle characterized by a single rainy season (from May to November) with maximum precipitation in August-October. From August to September, there is a slight decrease in monthly rainfall in the projections compared to historical data, while towards the end of the season (October-December), an inversion is observed, meaning the monthly cumulative rainfall is higher than that of historical data. The significant difference between the historical period and projections under the extreme SSP585 scenario is notable in terms of interannual variability (Figure 2B). The comparison of interannual variability reveals a clear decrease in precipitation for the distant future projections under the extreme SSP585 scenario. Of particular interest in Figure 2B is the fact that it shows a more significant rainfall deficit than ever recorded during the historical period of 1950-2014 in Haiti. There was a notable drought during the 1990s, which stands as the most severe event recorded in the historical period. The multi-decadal variability reveals an alternation of wet and dry periods.
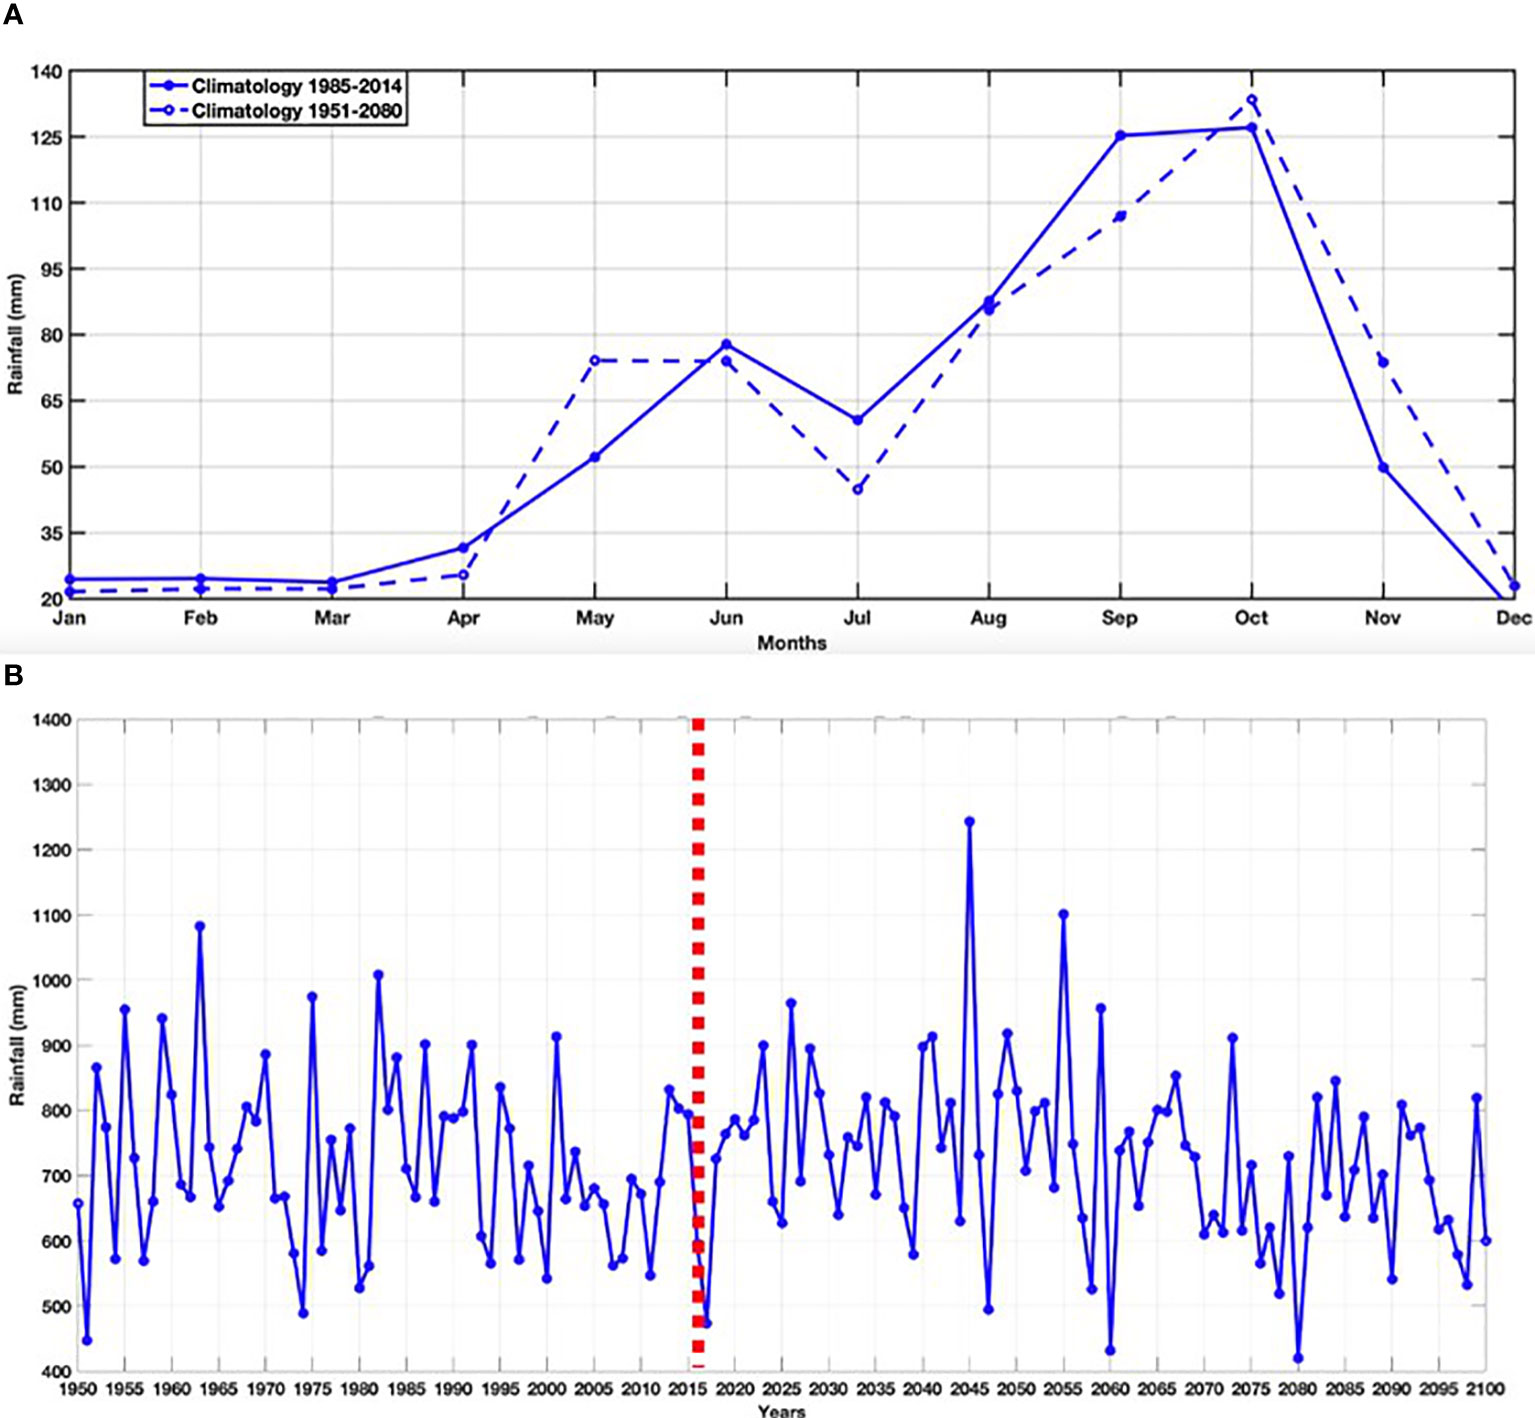
Figure 2 (A, B) respectively represent the annual cycle (climatology 1985-2014 versus 1951-2080) and interannual precipitation variability in Haiti using historical data (1950-2014) and projections (2015-2080) for the SSP585 scenario from the multi-model ensemble mean of the CMIP6 models.
Figures 3A, B depict the spatial distribution of precipitation for the climatological period (1985-2014) and for the SSP585 scenario during the projection period 2051-2080 (distant future). A zonal (East-West) gradient is observed in the precipitation maps. These results also indicate a decrease in precipitation for the projections. Additionally, the results show an increase in precipitation in the projections for departments located in the western and central regions of the country. There is a notable signal illustrating a pronounced decrease in precipitation for departments situated in the far southeastern region.
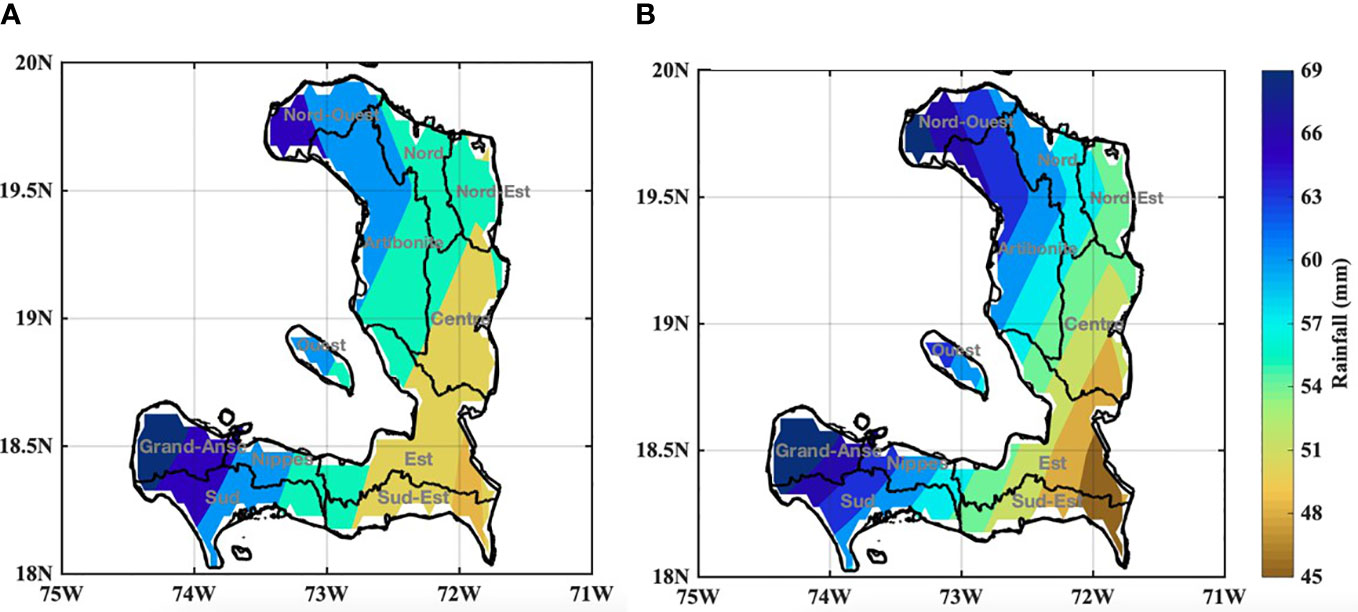
Figure 3 Spatial distribution of precipitation in Haiti using (A) historical data (1985-2014) and (B) projections (2051-2080) for the SSP585 scenario from the multimodel ensemble mean of the CMIP6 models.
Figure 4A illustrates the distribution of normalized precipitation anomalies for each year of the validation period by comparing historical time series with ERA5 data (reference). The box-and-whisker plot highlights the minimum, maximum, median, and mean values of average rainfall over Senegal during the climatological period from 1985 to 2013 for ERA5 and CMIP6 (historical). The years when the CMIP6 median precipitation is positive (negative) largely correspond to the years when the ERA5 median is also positive (negative).
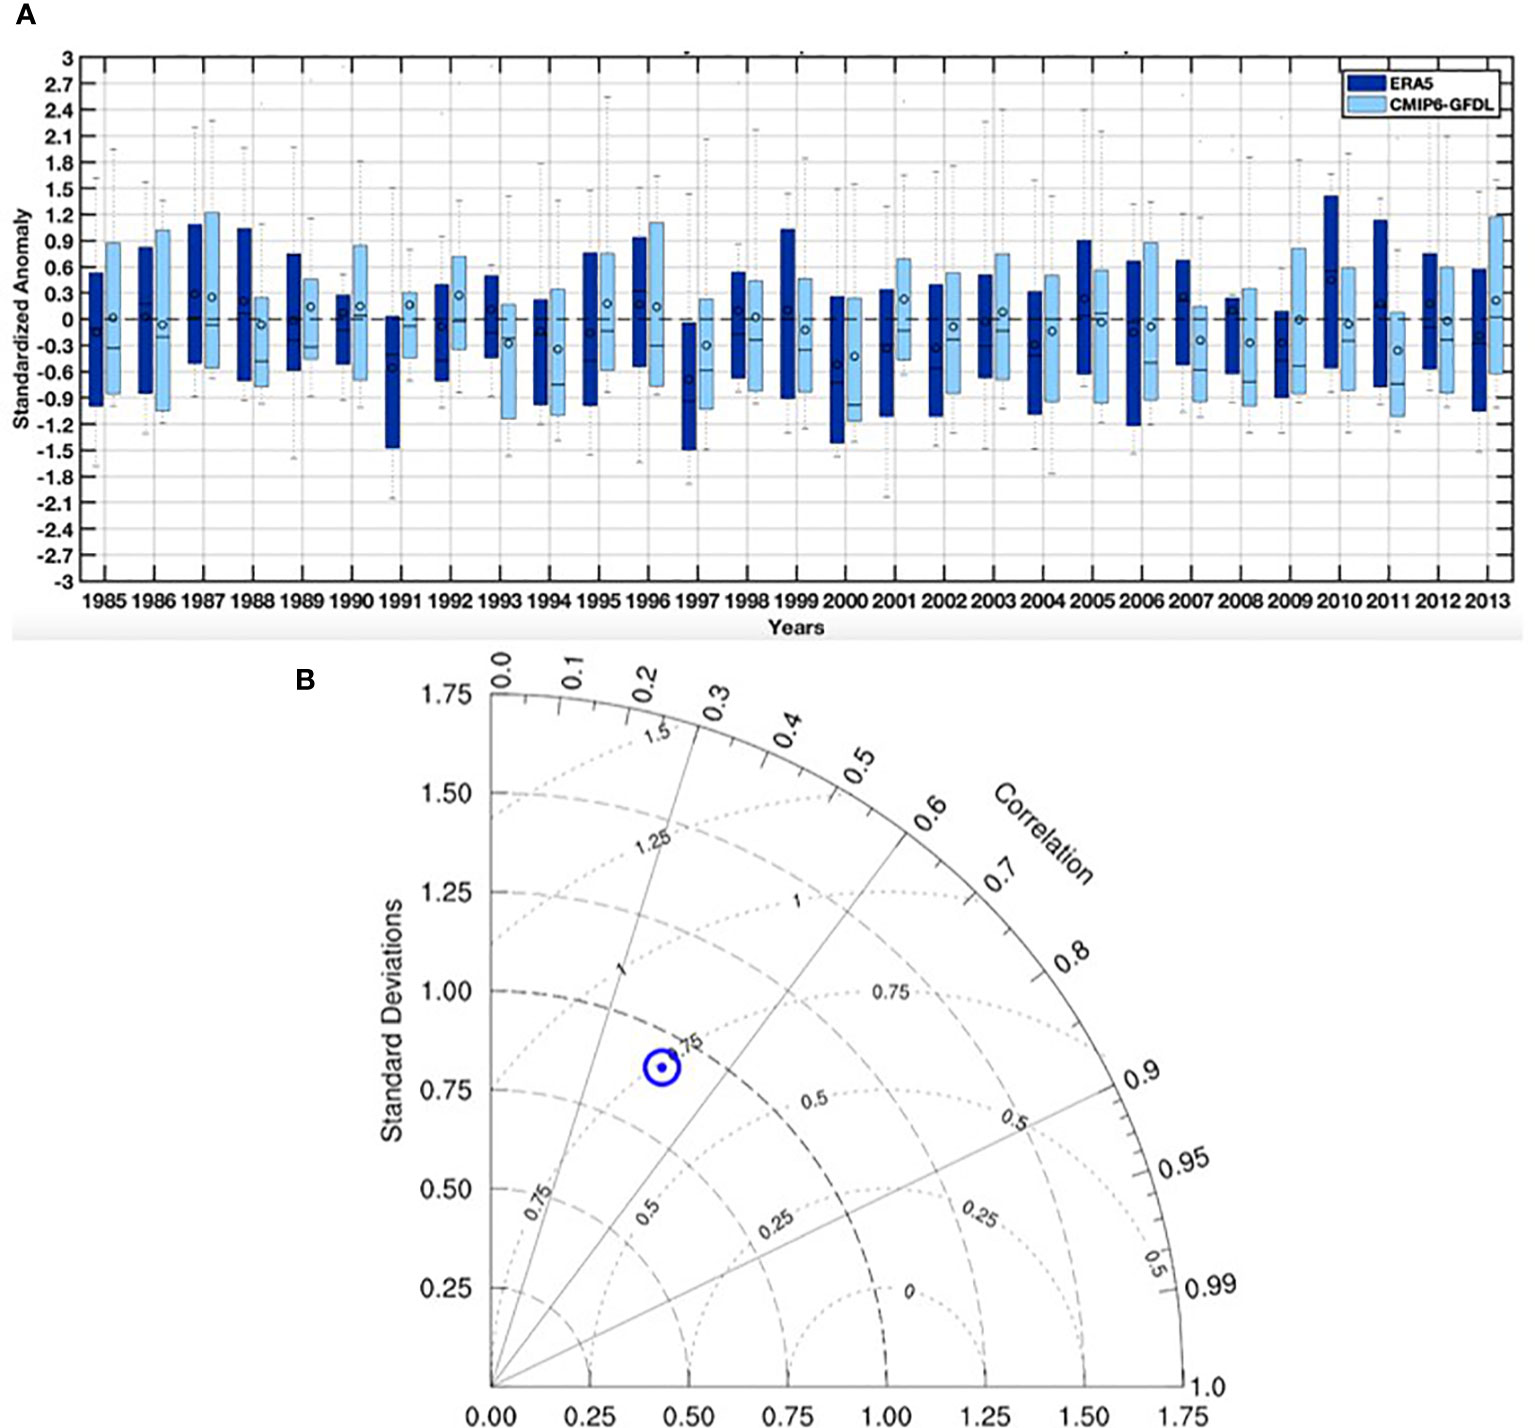
Figure 4 (A) Standardized precipitation anomalies were calculated for each year during the validation period, spanning from 1985 to 2013, using data from both ERA5 and the multi-model ensemble mean of the CMIP6 models, (B) A normalized Taylor diagram was employed to visually represent the correlation coefficients, standard deviations, and root mean square errors between modeled precipitation values from the CMIP6 models and observed data from ERA5 for the time frame of 1985-2013.
In Figure 4B, the Taylor diagram, as described by Taylor (25), is used to assess the performance of the multi-model ensemble mean of the CMIP6 models compared to ERA5 reference data. This diagram offers the advantage of representing three statistics simultaneously: root mean square error (RMSE), standard deviation of the simulation compared to the observation, and the correlation coefficient between observation and simulation. Invented by researcher Karl E. Taylor in 1994, it is a widely-used tool in meteorology and atmospheric science.
Regarding Figure 4A, projecting onto the correlation axis reveals that the correlation coefficient is approximately 0.45. In terms of RMSE, when considering the semicircles centered around 1, the RMSE is 0.75. For the standard deviation, when considering the semicircles centered around 0, the corresponding value is approximately 0.8. These three statistical values collectively illustrate the performance of CMIP6 compared to the reference data (ERA5).
Figures 5A, B provide a representation of two essential time series: historical temperature data and projections based on the SSP585 scenario. These figures also illustrate the annual and the interannual changes in average temperatures in Haiti spanning from 1950 to 2100. In Figure 5B, the depiction of the annual temperature pattern highlights a noticeable increase during the projection period, specifically under the SSP585 scenario. The annual cycle, as depicted in Figure 5A, follows a unimodal pattern with the highest temperatures occurring in August, consistent across both historical data and projections. Analyzing the monthly temperature evolution reveals that the lowest temperatures are typically observed in December, January, February, and, to a lesser extent, March and April. During these months, temperatures generally fall below 25°C in historical climatology and 26°C in the distant future climatology. Conversely, temperatures are relatively lower in October and November due to cloud cover and heavy rainfall during the rainy season. On the other hand, temperatures tend to remain elevated from June to September, with values hovering around 28°C in historical climatology and 30°C in distant future climatology.
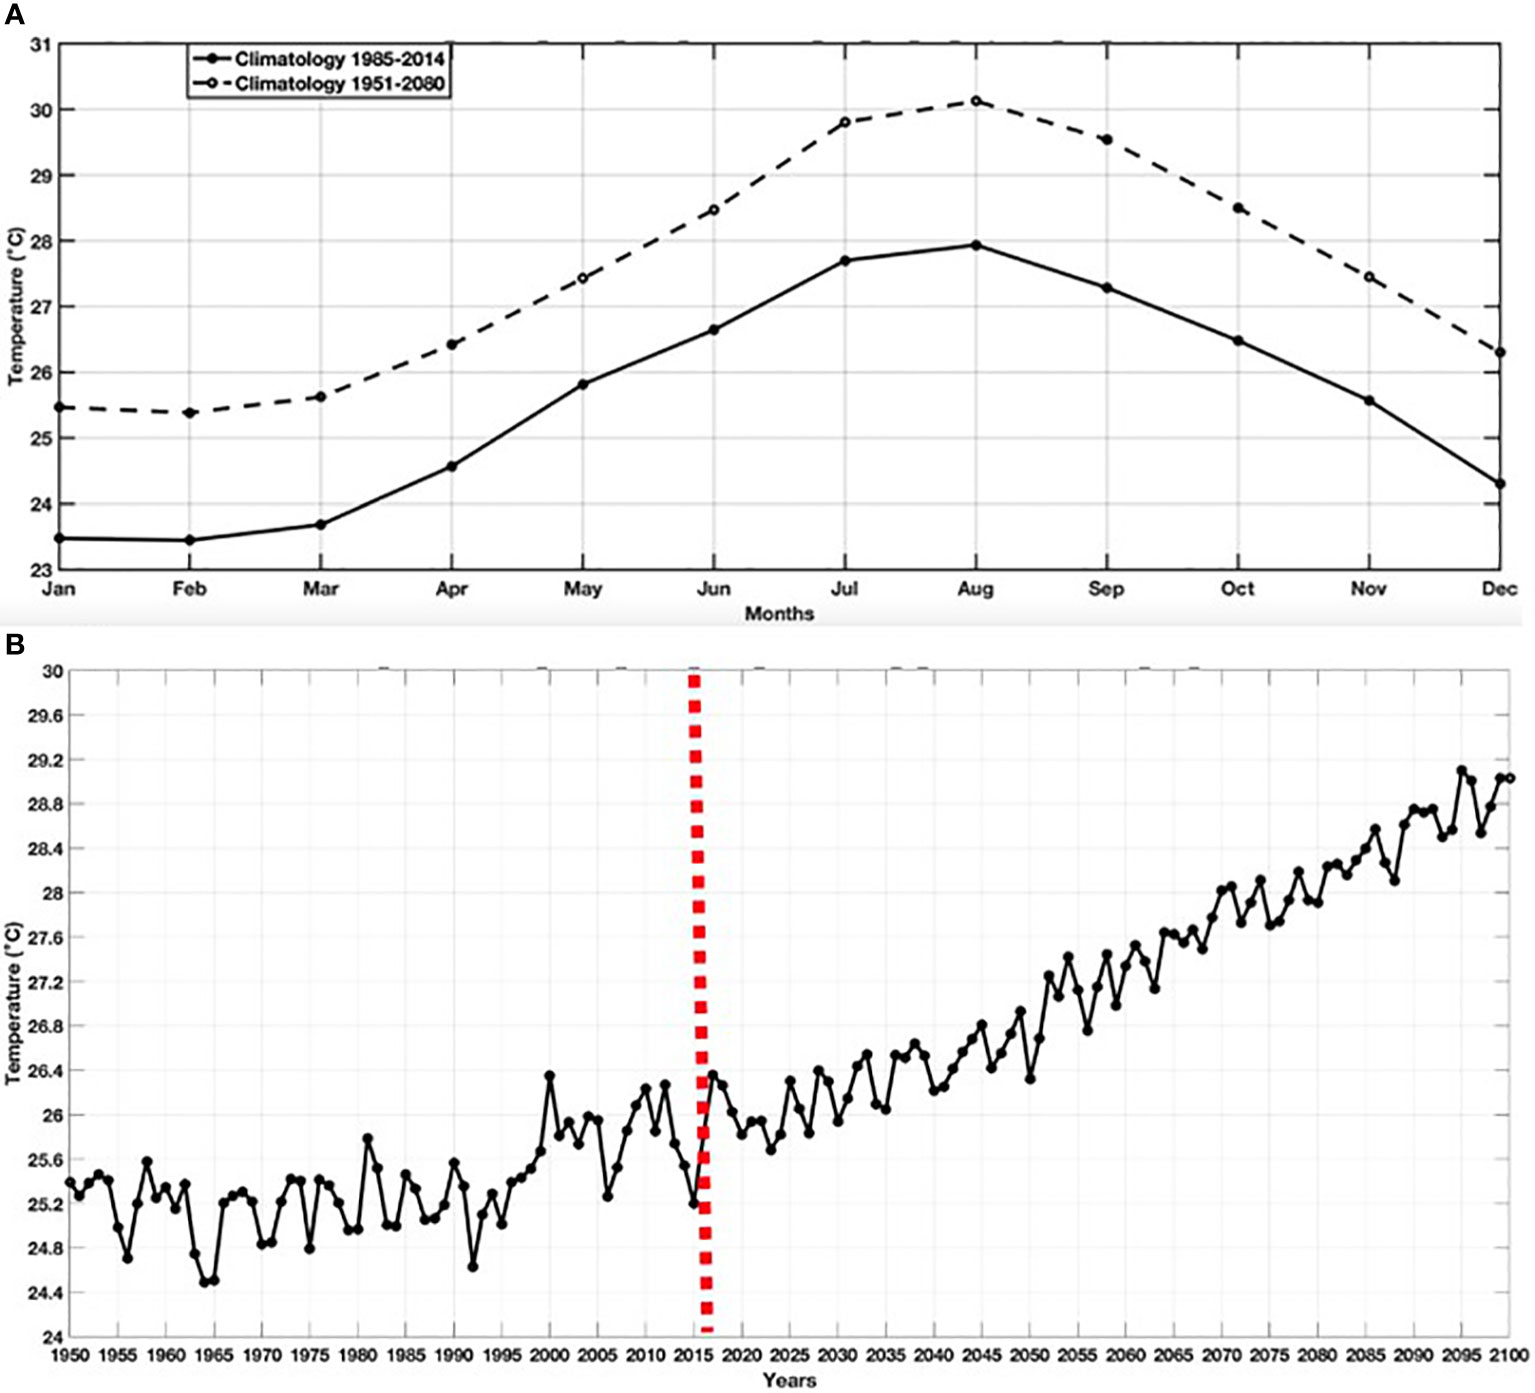
Figure 5 (A, B) respectively represent the annual cycle and interannual variability of temperatures in Haiti using historical data (1950-2014) and projections (2015-2080) for the SSP585 scenario from the multi-model ensemble mean of the CMIP6 models.
Regarding interannual variability (Figure 5B), significant temperature changes are evident. A consistent upward trend in temperatures is noticeable, starting as early as the beginning of the projection period in 2015. This upward trend is even discernible when examining historical data, and it becomes more pronounced in the projections. This trend is further reflected in the spatial distribution of temperatures in Haiti, comparing historical data (1985-2014) with projections (2051-2080) for the SSP585 scenario, based on the multi-model ensemble mean of the CMIP6 models.
The analysis of the spatial distribution of temperatures in Haiti in Figure 6 combines historical temperature data from 1985 to 2014 (Figure 6A) with future projections spanning 2051 to 2080 (Figure 6B). These projections are based on the SSP585 scenario, a specific climate scenario, and are derived from the multi-model ensemble mean of the CMIP6 models. By juxtaposing past temperature trends with these future projections, the study provides a comprehensive understanding of how temperatures in Haiti have evolved and are anticipated to increase in the coming decades, particularly in the context of the SSP585 scenario’s climate conditions.
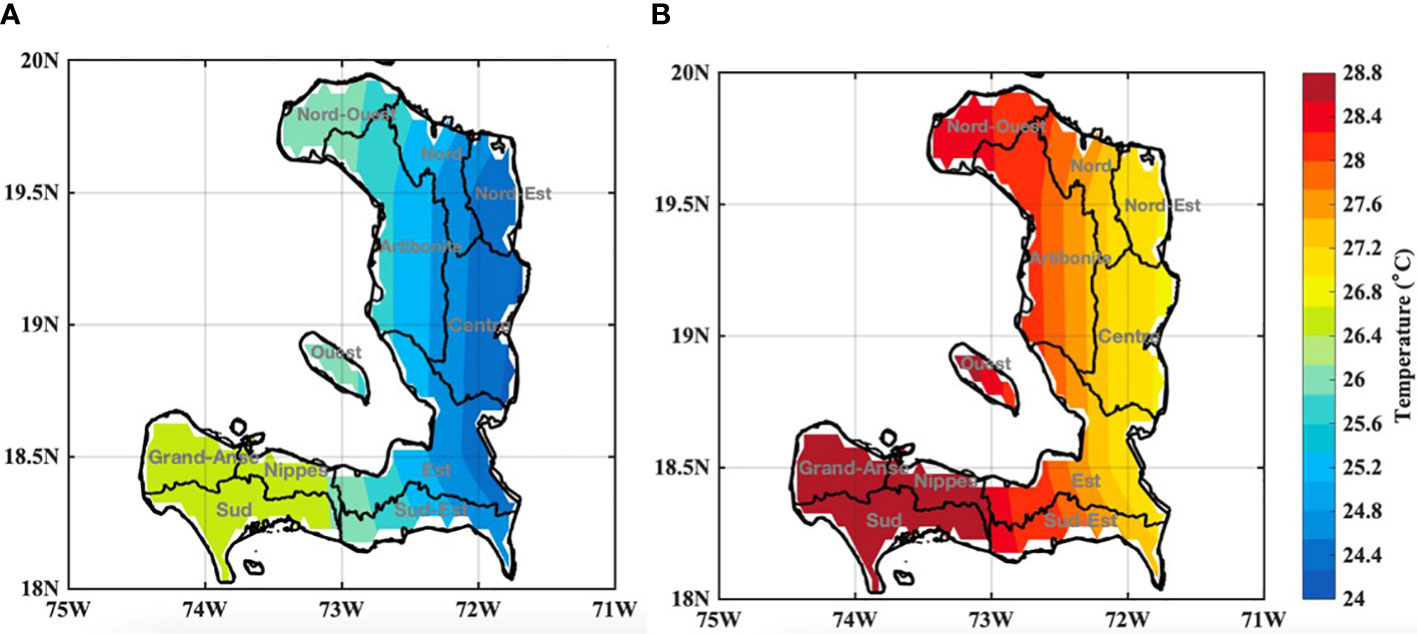
Figure 6 Spatial distribution of temperatures in Haiti using (A) historical data (1985-2014) and (B) projections (2051-2080) for the SSP585 scenario from the multimodel ensemble mean of the CMIP6 models.
Figure 7A presents the distribution of normalized temperature anomalies for each year throughout the validation period, offering a comparison between historical time series and ERA5 data (the reference dataset). In this context, the box-and-whisker plot provides a visual representation of the minimum, maximum, median, and mean values of precipitation averaged over Senegal during the climatological period spanning from 1985 to 2013. This comparison is made using both ERA5 and CMIP6 historical data. Notably, the years in which the median of CMIP6 precipitation is positive (or negative) broadly align with those in which ERA5’s median exhibits a similar trend. However, there are a few exceptions, including the years 1987 and 2000.
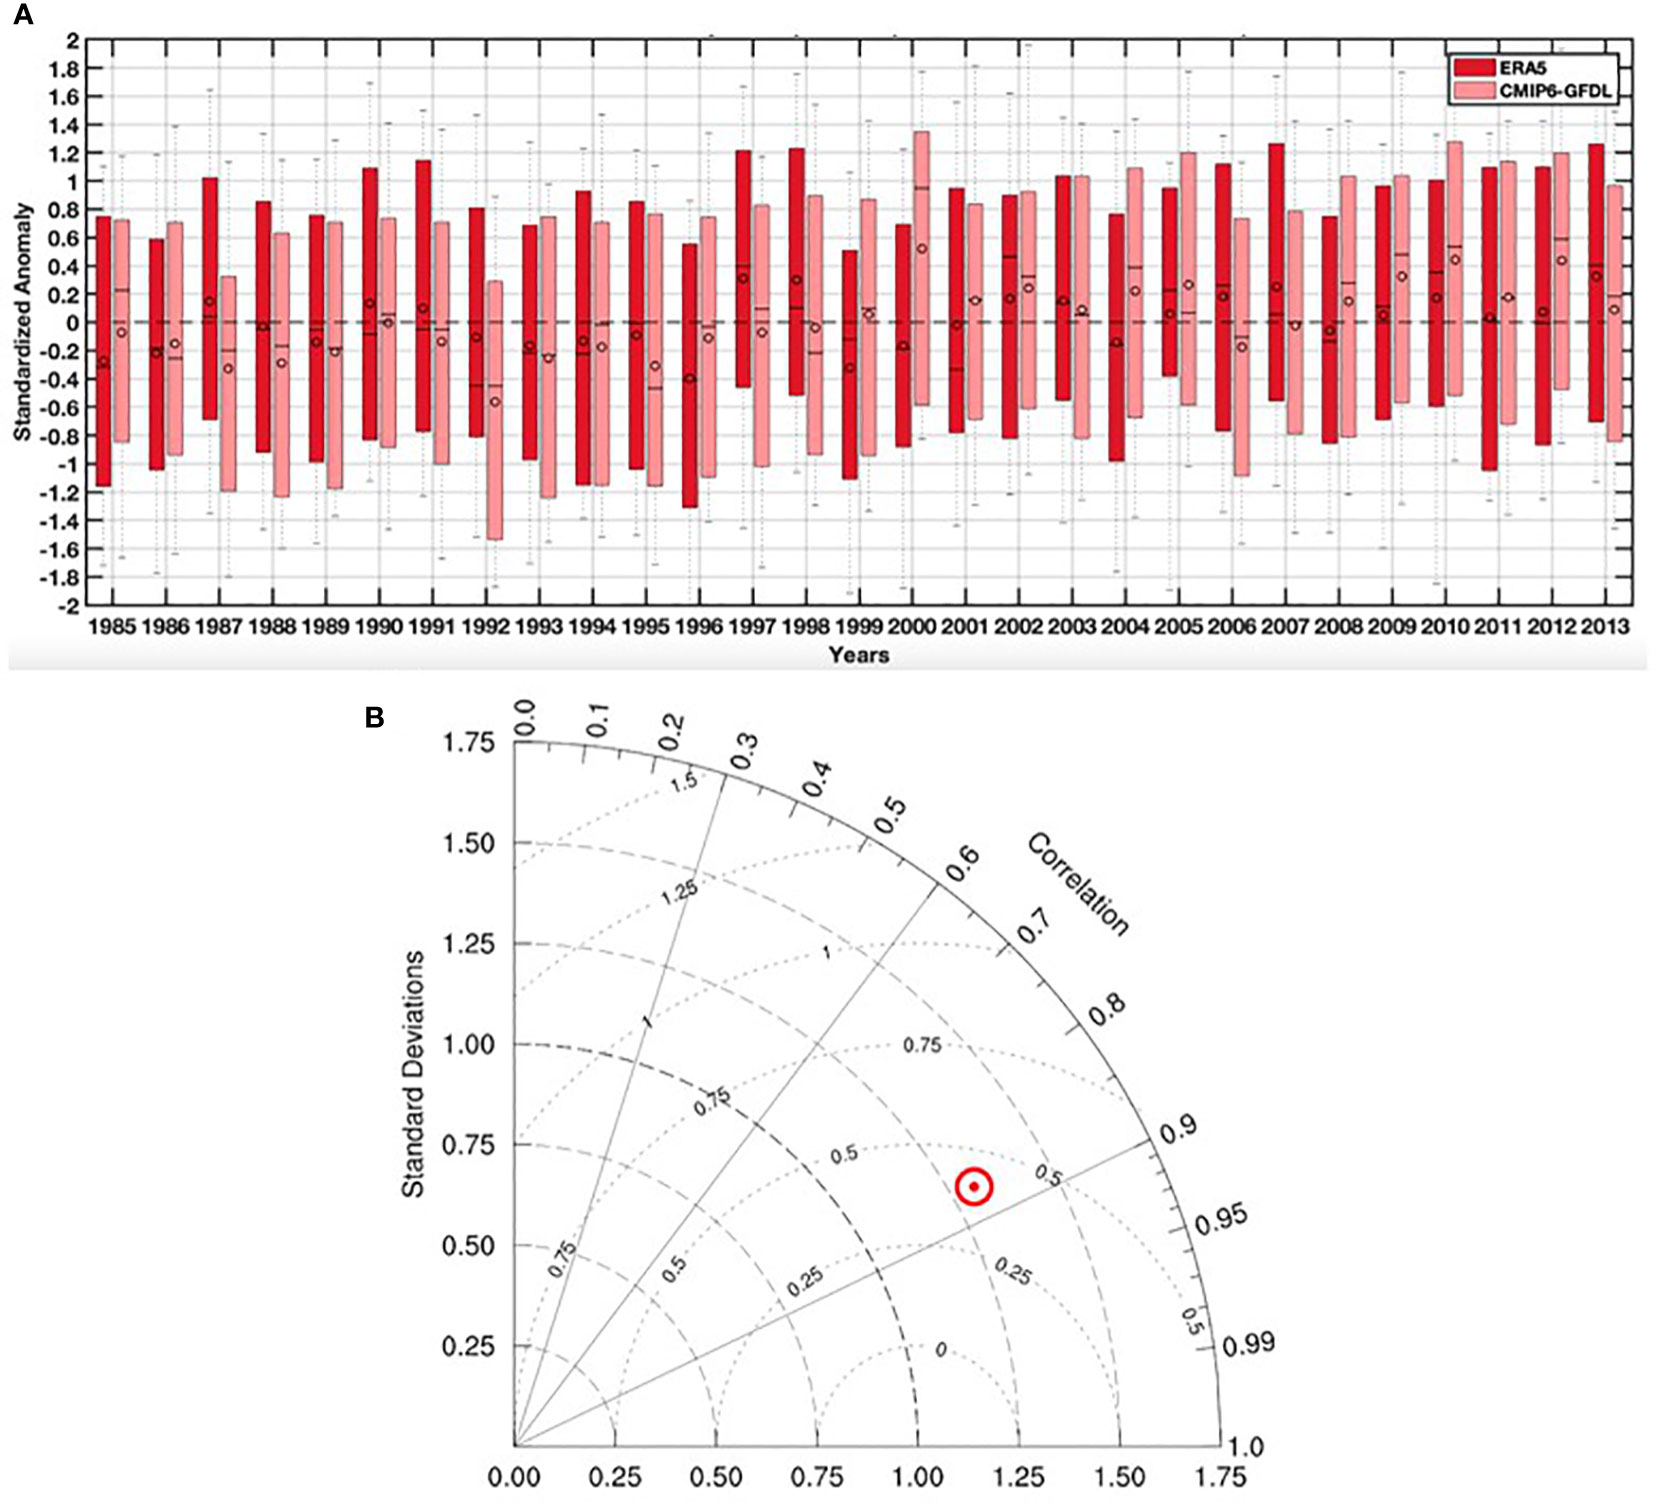
Figure 7 (A) Standardized temperature anomalies for each year of the validation period (1985-2013) for ERA5 and the multi-model ensemble mean of the CMIP6 models, (B) Normalized Taylor diagram showing correlation coefficients, standard deviations, and root mean square errors between modeled precipitation values (CMIP6) and observations (ERA5) for the period 1985-2013.
Moving to Figure 7B and focusing on the correlation axis, we observe a correlation coefficient of approximately 0.87. Regarding the root mean square error (RMSE), when taking into account the semi-circles centered around 1, the red point falls within the range of 0.25 to 0.27, yielding an approximate value of 0.28. Finally, regarding the standard deviation, considering the semi-circles centered around 0, the corresponding value slightly exceeds 1.25.
Figures 8A–I provide a visual representation of the spatial distribution of various diseases recorded in Haiti from 2015 to 2022. Each of these figures corresponds to the spatial variations of specific pathologies within the country. Notably, Figure 8B illustrates the distribution of diabetes, Figure 8C shows cholera, Figure 8D presents chikungunya, Figure 8E displays dengue, Figure 8F focuses on diarrhea, Figure 8G depicts malaria, and Figure 8H represents malnutrition.
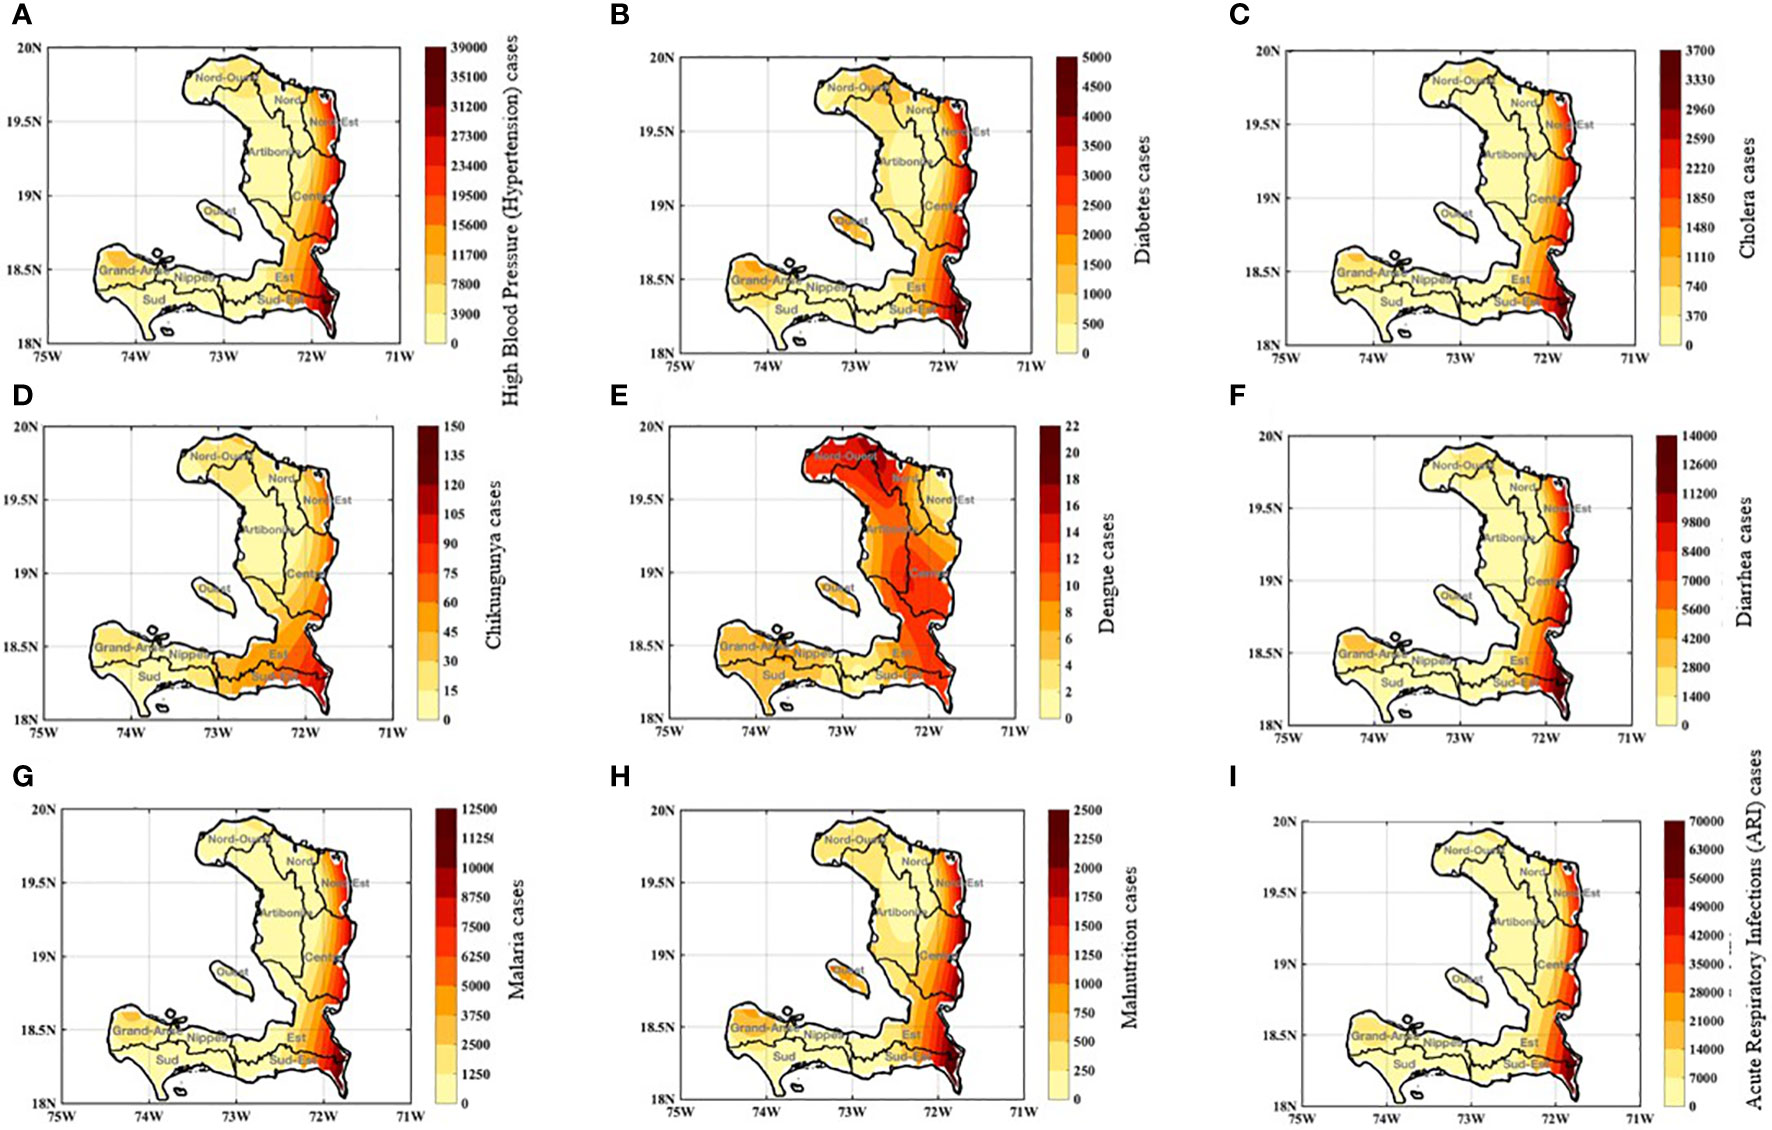
Figure 8 Spatial-temporal distribution of climate-sensitive diseases in Haiti between 2011-2021: (A, B) High Blood Pressure and Diabetes, (C, D) Cholera and Chikungunya, (E, F) Dengue and Diarrhea, and (G, H) Malaria andMalnutrition, (I) Acute Respiratory Infections (ARI).
It is evident that several departments in Haiti, including Nord-Est, Centre, Est, and Sud-Est, experience a significant burden of these diseases. For instance, the prevalence of dengue (as seen in Figure 8E) is widespread across the central part of the country, affecting departments such as Nord-Ouest, Nord, Artibonite, Centre, as well as substantial portions of the Est and Sud-Est regions.
Interestingly, despite less favorable mosquito-climate conditions characterized by lower rainfall and temperatures in the Eastern departments, the data shows a substantial occurrence of vector-borne diseases like malaria and dengue in these areas. This anomaly can be attributed to the regularity of clinical data collection in the Eastern departments. The population in these regions is more inclined to seek medical care, resulting in more consistent data collection. It is worth noting that these Eastern departments often serve as healthcare hubs, receiving patients not only from local urban areas but also from other regions. However, for modeling purposes, it is essential to emphasize that only climatic factors are considered, as impact models do not account for socio-economic parameters, unlike observational data.
Table 4 outlines the occurrence of diseases within the regions, establishing connections with climate and temperature parameters. This Table 4 reveals a spectrum of diseases, encompassing vector-borne diseases as well as other climate-sensitive conditions, including malnutrition and Acute Respiratory Infections.
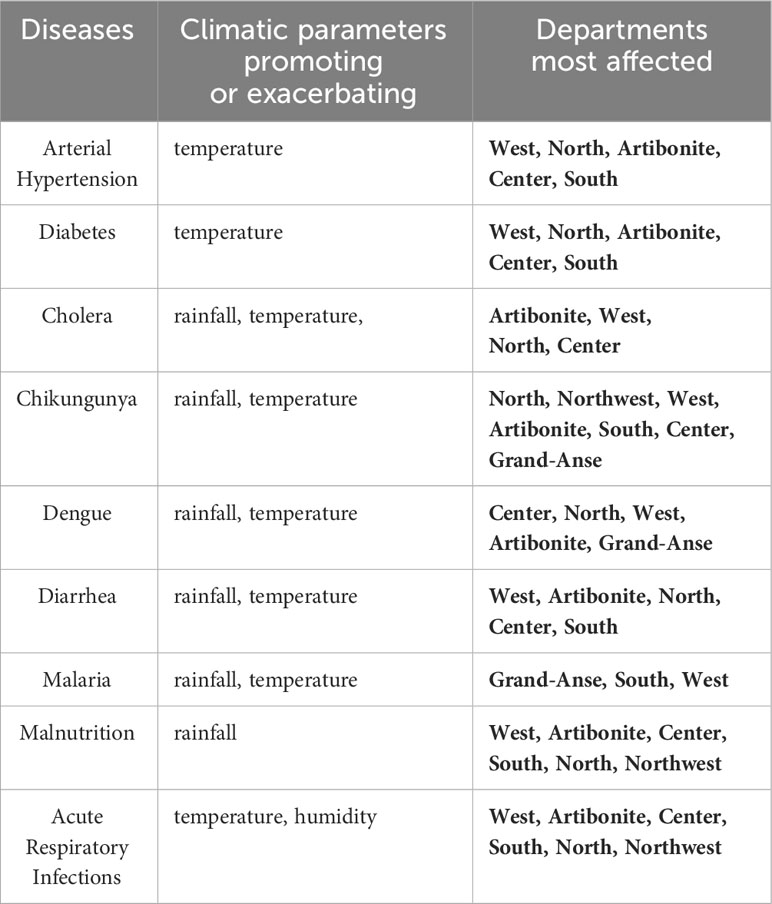
Table 4 The diseases mentioned in the study, along with the relevant climatic parameters and the departments most affected or exposed, are as follows.
In Figure 9, we conducted an analysis of the spatiotemporal variability in simulated malaria incidence using the LMM model, driven by daily precipitation and temperature data. Our goal was to illustrate the distribution of malaria in Haiti over time and space. When it comes to spatial variability, we observed variations in the intensity of malaria incidence signals among different departments within the country. Specifically, there was a more pronounced signal in the western part of Haiti compared to the eastern regions. Nevertheless, significant transmission was evident throughout the entire country. Notably, the period from September to December exhibited a notably high incidence signal, reaching its peak in November. It ‘is worth mentioning that the LMM model, which considers only precipitation and temperature, must account for this heightened signal by considering the cumulative precipitation and temperature data.
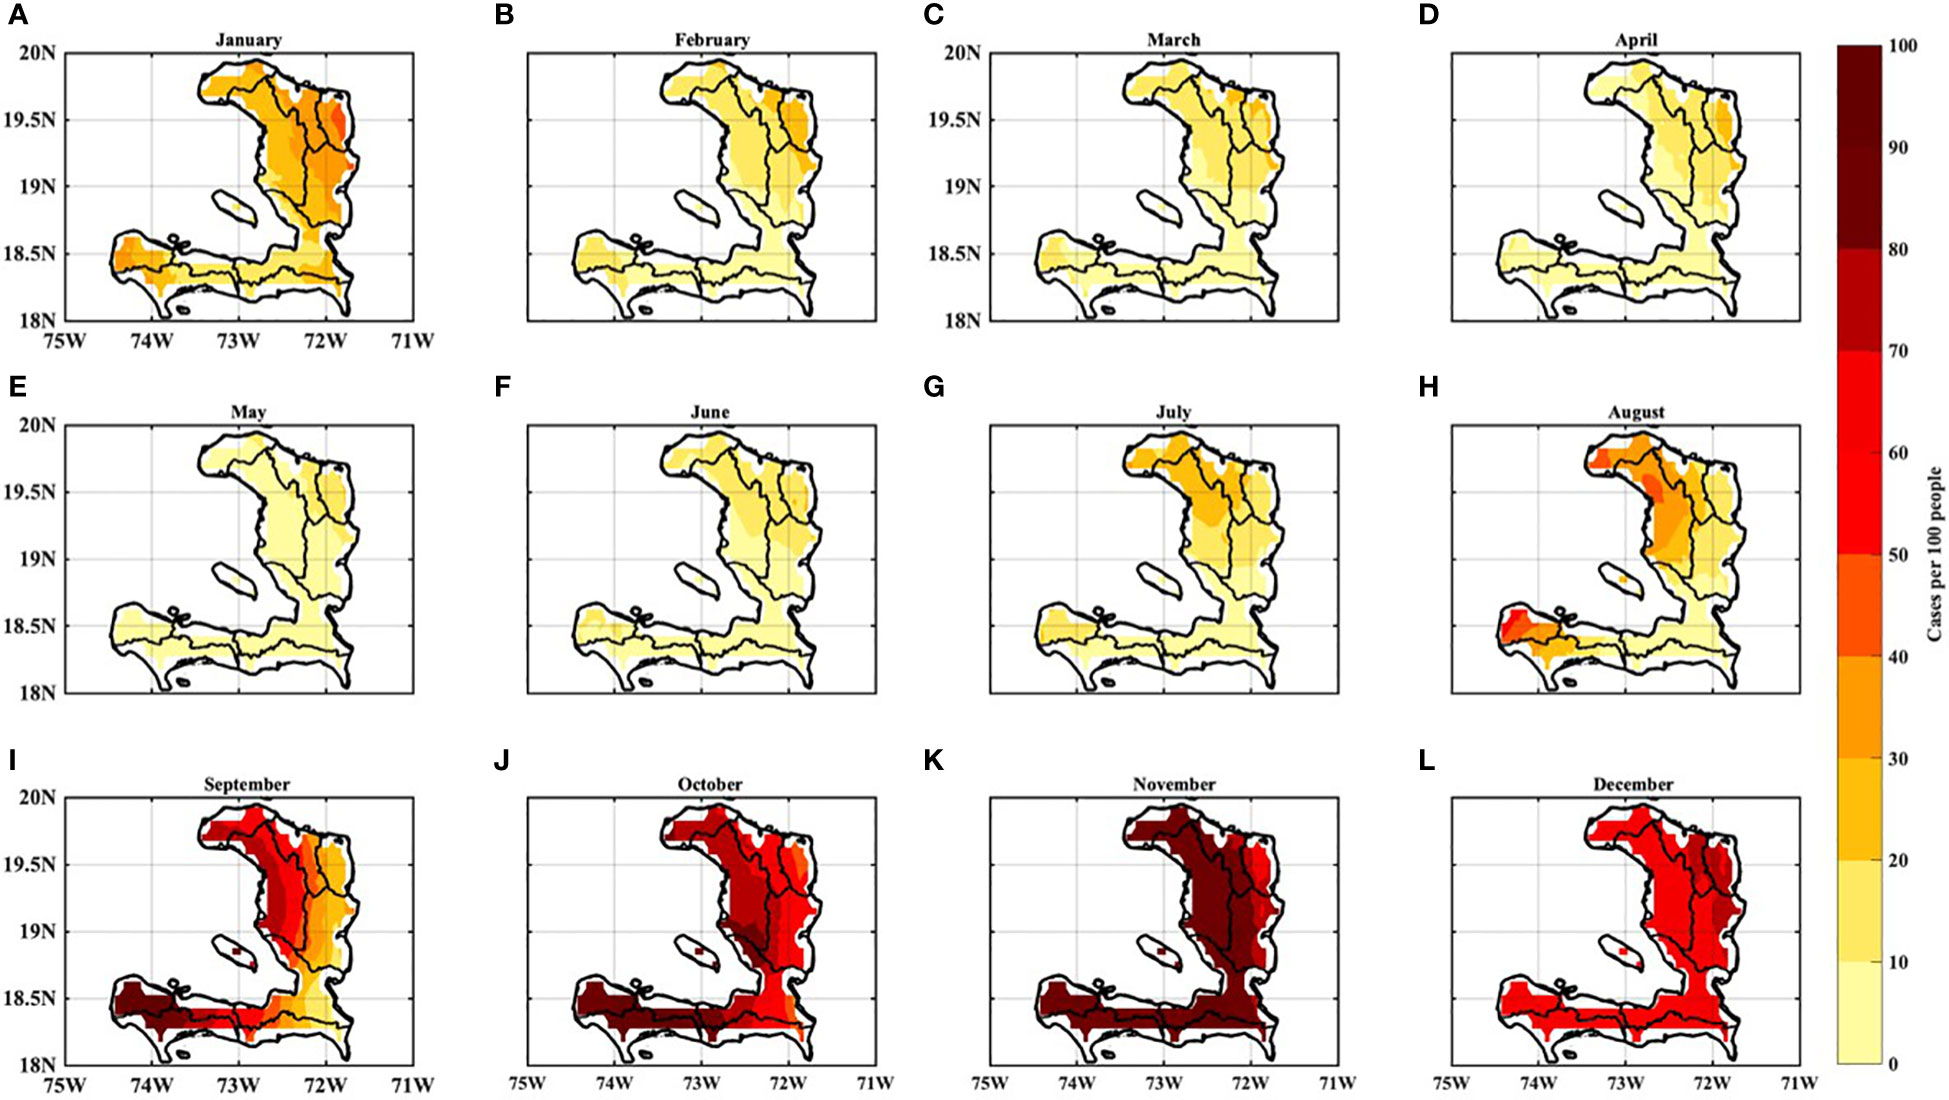
Figure 9 Spatial variation of malaria incidence in Haiti: LMM model simulations based on historical data (1985-2014) from the multi-model ensemble mean of the CMIP6 models. (A–L)( correspond to the evolution of malaria incidence from January to December respectively.
Figure 9 also presents the seasonal pattern of simulated malaria incidence. Our analysis indicates that the incidence rate remained below 10% from February to June (Figures 9B-F). However, from July to August (Figures 9G, H), we observed a gradual increase in the incidence rate signal, primarily in the northern regions of the country. This signal reached its highest median point in November, with an incidence rate ranging between 40% and 45%. Notably, malaria transmission closely followed the pattern of precipitation, with the rainy season corresponding to the period of elevated mosquito activity. Figure 10 further demonstrates that the peak malaria transmission season occurs one month after the peak of rainfall. This discrepancy can be explained by several factors. In October, intermittent rains or occasional showers enhance the mosquito vector population’s development, initiated by the onset of initial rains. However, the heavy August rains tend to submerge mosquito eggs laid on water surfaces. Additionally, the low temperatures resulting from successive rainy days do not favor the rapid growth of vectors, from larvae to infectious mature mosquitoes, including the nymph stage.
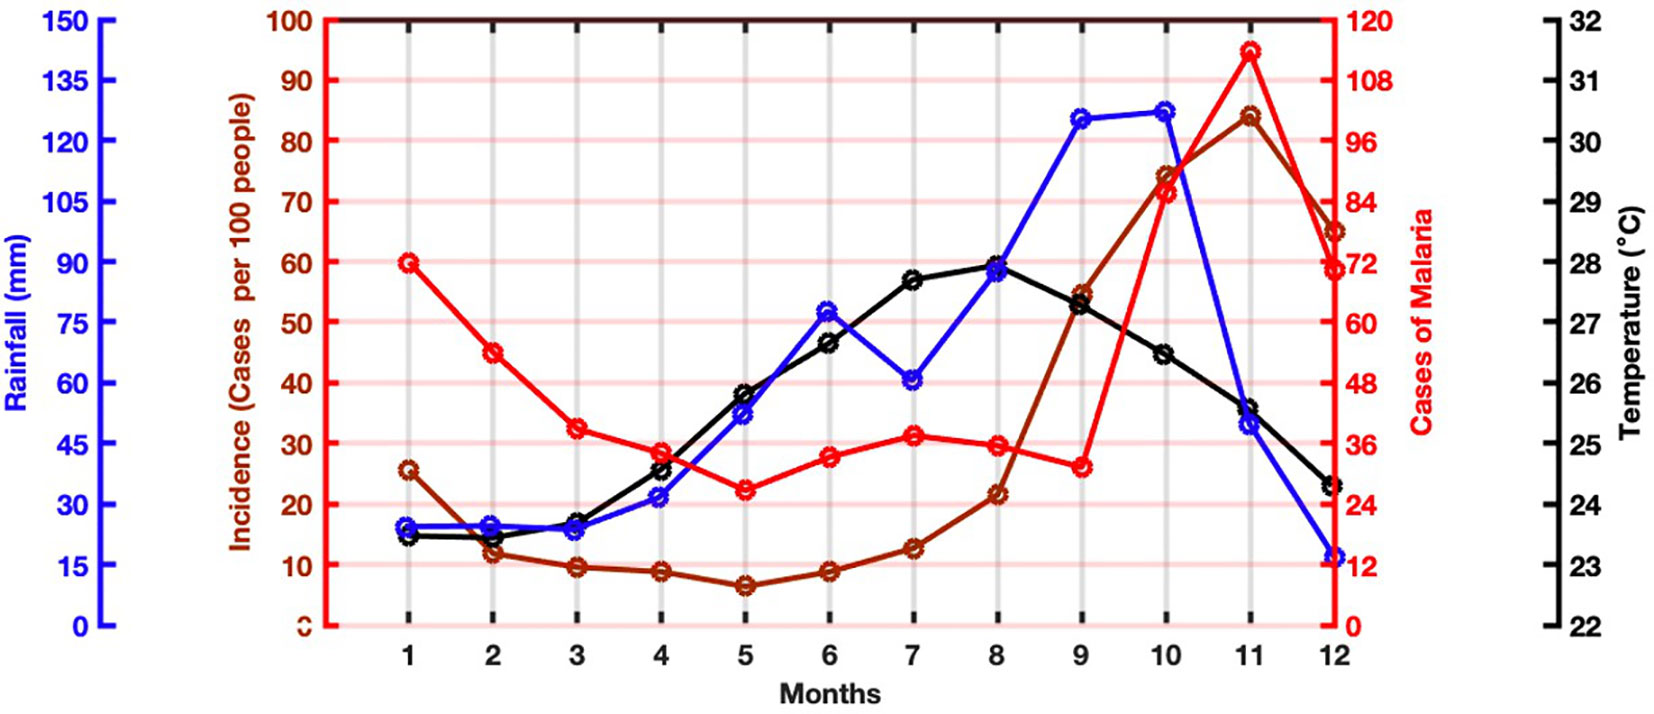
Figure 10 Comparison of the annual variability of temperature, precipitation, observed malaria cases, and simulated malaria incidence in Haiti from 2015 to 2022.
Conversely, with a one-month delay, mosquito vectors experience improved living conditions in terms of wastewater availability, the intense heat of this still-humid month (which extends mosquito longevity), and favorable environmental conditions such as abundant large larval breeding sites and ample vegetation cover, all of which constitute ideal mosquito breeding grounds. This delay aligns logically with what is known about the biology of the Anopheles vector and the sporogonic cycle of the Plasmodium parasite.
A noticeable contrast in the intensity of malaria incidence signals between the western and eastern departments of Haiti is evident. The zonal gradient of malaria distribution in Haiti seems to persist. When comparing historical and projected data (Figures 11A, B), it becomes apparent that simulated malaria incidence is declining in certain Haitian departments, especially those in the eastern and central regions. This decline in malaria in the distant future appears to be linked to climate changes, as noted by Béguin et al. (26) and Diouf et al. (14). Specifically, excessively high temperatures could adversely affect the survival of adult mosquitoes, potentially leading to a decrease in the adult mosquito population within the model and, consequently, a reduction in malaria transmission.
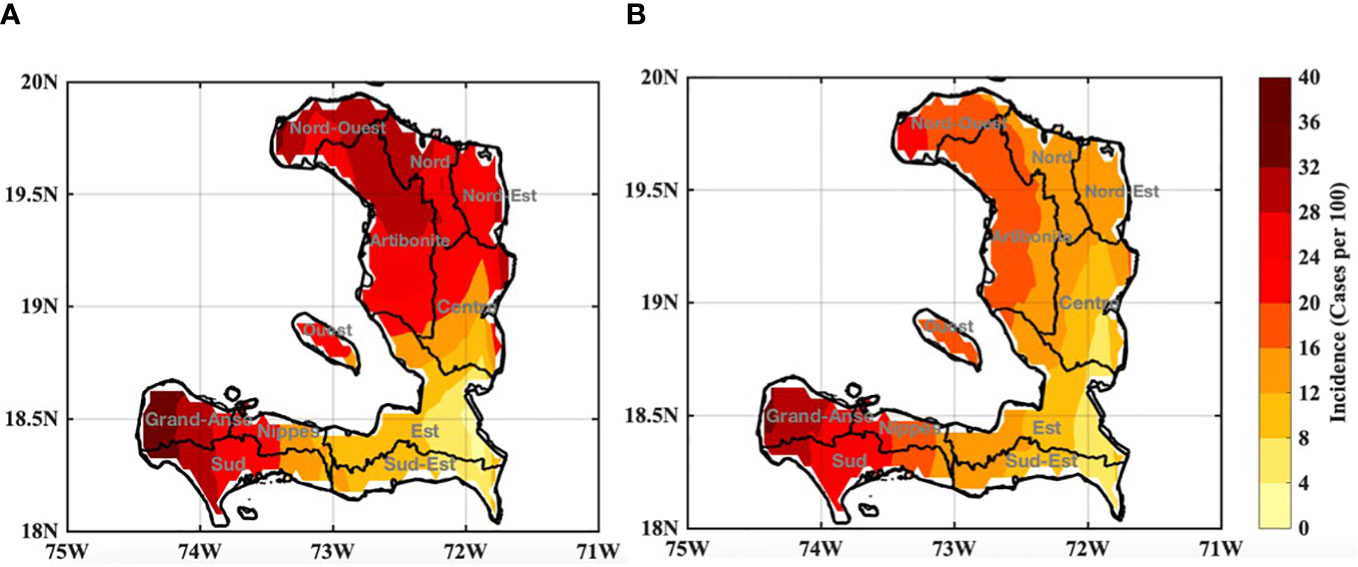
Figure 11 Spatial distribution of malaria incidence in Haiti with (A) historical data (1985-2014) and (B) projections (2051-2080) for the SSP585 scenario from multi-model ensemble mean of the CMIP6 models.
Béguin et al. (26) illustrated an inverse relationship between climate changes and the global distribution of malaria. They observed a decrease in simulated malaria incidence throughout the Sahel region, irrespective of the period or scenario considered, primarily due to temperature effects. It is anticipated that by the 2080s, the climate will become unsuitable for the northern part of the Sahel, including the northern departments of Haiti, resulting in a reduced population at risk, as indicated by Caminade et al. (27).
Figure 12 illustrates that the western departments of Haiti, particularly Nord-Ouest, Ouest, Artibonite, and Nippes, exhibit signals of dengue indicators, including the biting rate (α), the probability of human infection by the vector per bite (βh), and the probability of human infection by the vector per bite (βm). These same western departments are also the most affected by the high occurrence of the rVc index for dengue. In contrast, the extrinsic incubation period (η) and the mortality rate (μm) are lower in these western departments compared to the eastern ones, which can be attributed to the west-east temperature gradient in Haiti.
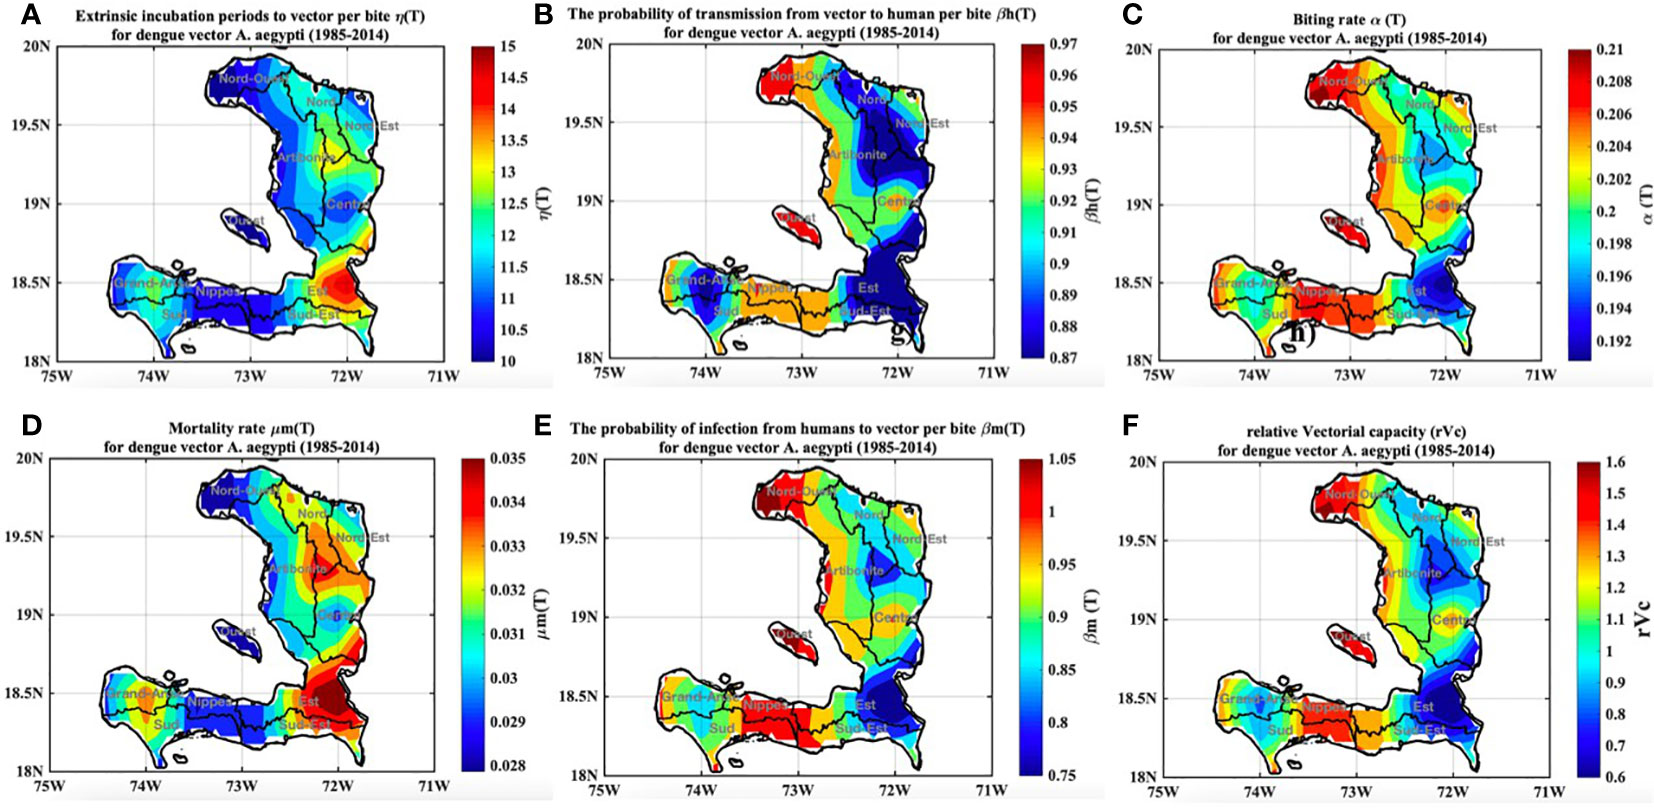
Figure 12 Spatial patterns of temperature effects on dengue occurrence in Haiti were examined for both the historical period (1985-2014) and the SSP585 scenario, including: (A) The spatial distribution of the extrinsic incubation period η(T), (B) The spatial distribution of the probability of transmission from vector to human per bite βh(T), (C) The spatial distribution of the Biting Rate α(T), (D) The spatial distribution of the Mortality Rate μm(T), (E) The spatial distribution of the probability of infection from humans to the vector per bite βm(T), (F), the spatial distribution of rVc (relative vectorial capacity).
Figures 13A, B, which pertain to historical and projection data for dengue, reveal an increase in the rVc index due to climate change, impacting the future distribution of dengue in Haiti. For example, in Figure 13B (extreme scenario SSP585), there is a notable increase in the simulated dengue rVc index in the eastern part of Haiti (Nord-Ouest, Ouest, Grande-Anse, Sud, and Nippes).
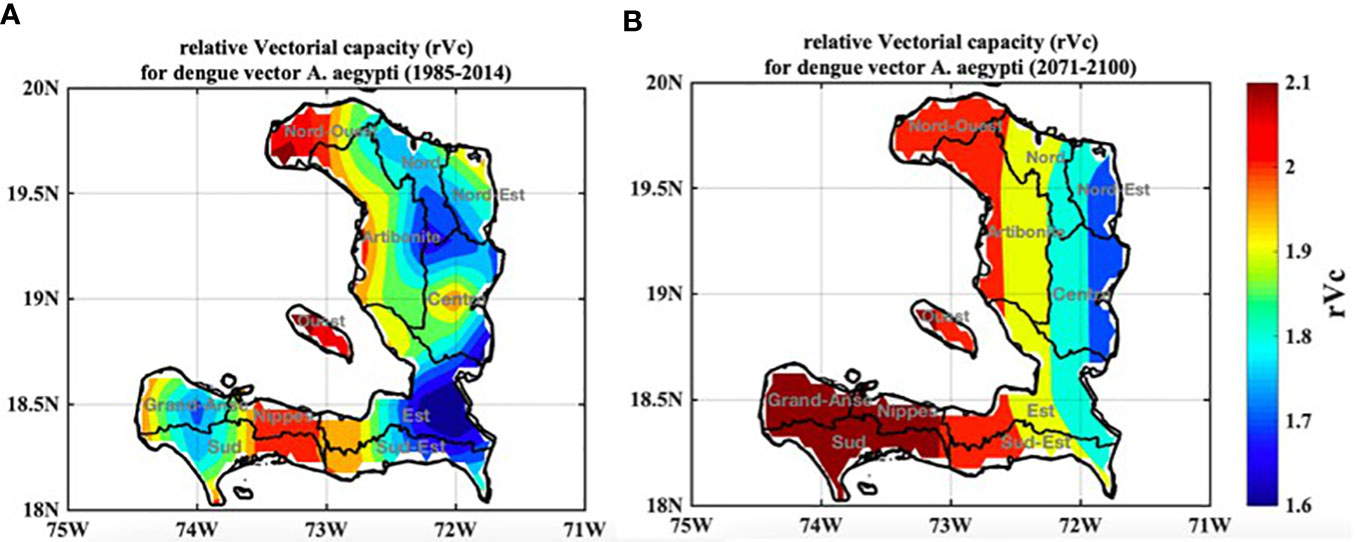
Figure 13 Spatial distribution of rVc (relative vectorial capacity) in Haiti: (A) historical period (1985-2014), and (B) projections (2071-2100) under the SSP585 scenario.
According to Figure 13, the future spread of dengue in Haiti is anticipated to shift from the western regions toward the central areas. This projection implies that the central regions may witness an increase in dengue cases over time. However, in certain areas, a decrease in dengue fever could occur due to reduced rainfall and exceptionally high temperatures, which may lead to the mortality of adult mosquitoes and a subsequent reduction in disease transmission. This effect has the potential for a long-term impact on vector-borne diseases in those regions.
Figure 14 displays the heat index (HI) and categories of comfort index (CI) or thermal stress, utilizing temperature and humidity data from ERA5. The heat index was calculated to derive these comfort index categories. Figures 14A-H correspond to the HI and CI for the four seasons: December-January (DJF) in Figures 14A, B, March-May (MAM) in Figures 14C, D, June-August (JJA) in Figures 14E, 14F, and September-November (SON) in Figures 14G, H.
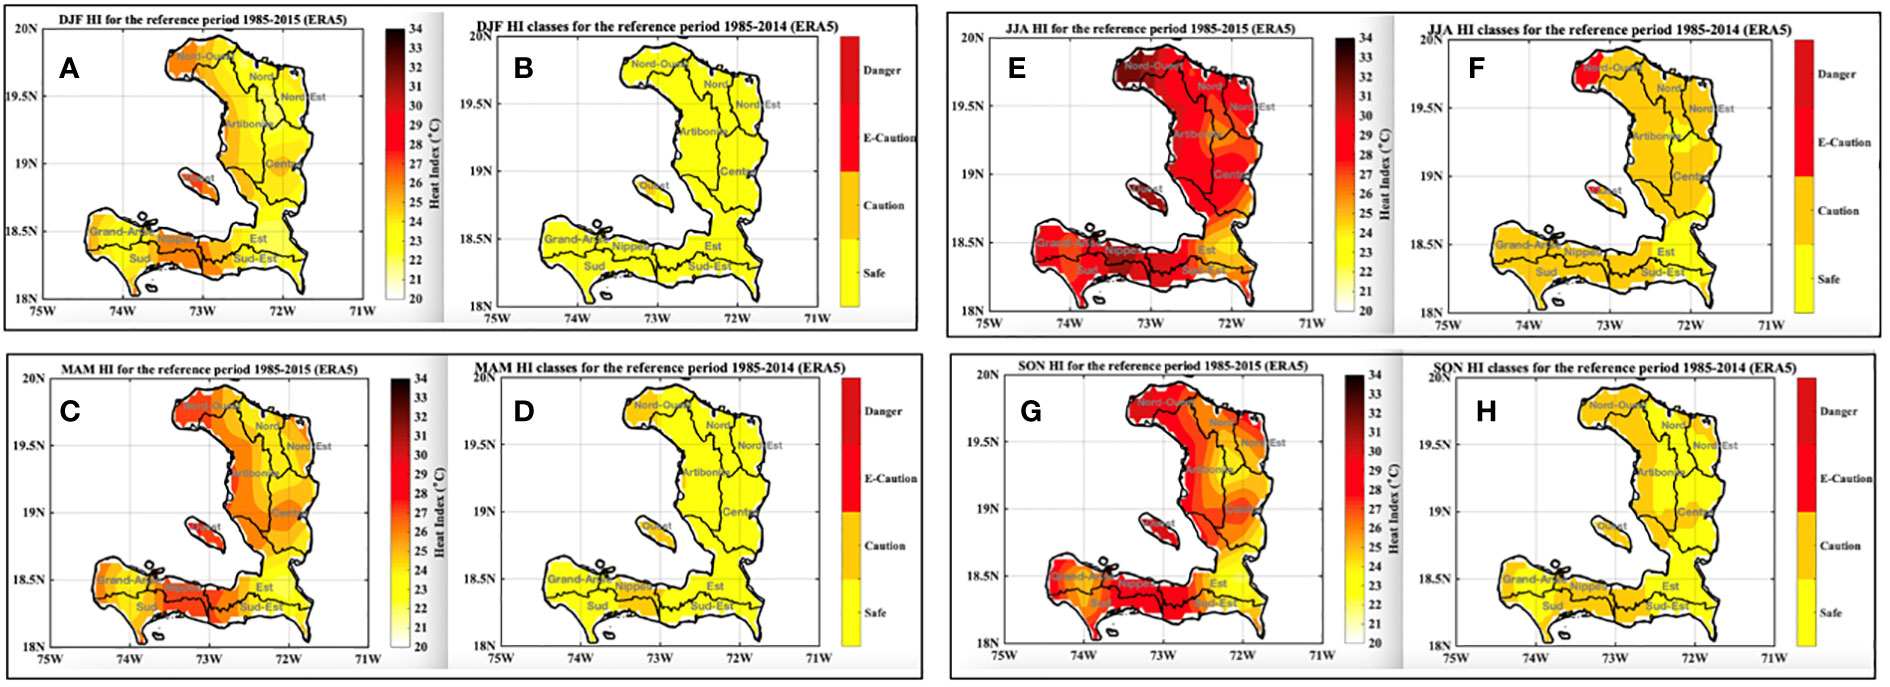
Figure 14 Distribution of seasonal comfort index (CI) classes or thermal stress categories for the reference period (1985-2014) using ERA5 reference data. HI stands for heat index, and E-Caution stands for Extreme Caution. (A, B) DJF = December-January-February; (C, D) MAM = March-April-May; (E, F) JJA = June-July-August; (G, H) SON = September-October-November.
During DJF, most of Haiti experiences a low heat index signal (Figure 14A), indicating conditions of mild discomfort (Figure 14B). However, areas of caution are observed in Nord-Ouest, Ouest, and Nippes during the MAM season, while the remaining departments experience conditions of mild discomfort (Figures 14C, D). In the JJA season (Figures 14E, F), a notable heat index signal indicative of extreme caution is concentrated across the Haitian territory, with the exception of the East and South-East departments. During the SON period (Figures 14G, H), conditions are quite like those of the JJA period but with slightly reduced HI and CI signals.
This paper investigates the relationships between climate dynamics, disease patterns, and modeling in the specific context of Haiti. The research highlights Haiti’s distinct temperature and precipitation variations across different timeframes. Through the analysis of historical data and future projections under the SSP585 scenario, we have identified a clear annual cycle characterized by a singular rainy season extending from May to November, with its zenith occurring between August and October. Additionally, the projected decrease in year-to-year rainfall, especially in the far future as suggested by the SSP585 scenario, raises concerns about potential challenges related to water resources. Furthermore, the extreme SSP585 scenario highlights a significant climate shift characterized by substantial decreases in precipitation and simultaneous temperature increases, further exacerbated by an amplified warming trend during the projection phase, deviating from historical trends.
The study also examines the distribution of diseases in Haiti, encompassing a range of ailments including diabetes, cholera, chikungunya, dengue, diarrhea, malaria, and malnutrition. These diseases exhibit regional variations. Notably, vector-borne diseases, particularly malaria and dengue, are intimately linked to climatic factors, with transmission patterns closely mirroring periods of elevated precipitation and temperature. In contrast, non-communicable diseases such as hypertension, diabetes, and malnutrition remain consistent and significant public health concerns throughout the study’s duration.
The utilization of the LMM model has unveiled the association between malaria transmission in Haiti and cumulative precipitation and temperature effects. The pattern of malaria incidence follows a distinct seasonal cycle, with its peak during the rainy season, albeit with a noticeable lag compared to peak rainfall. Crucially, the projected changes in malaria incidence under various climate change scenarios suggest potential reductions in specific departments, attributable to the impact of heightened temperatures on vector survival.
Similarly, the distribution patterns of dengue, closely tied to climatic determinants, are elucidated through the rVc index, which highlights regions at an elevated risk of transmission. However, the potential consequences of climate change introduce the possibility of shifts in dengue’s geographical distribution. These predictions hint at potential reductions in certain departments, driven by the influence of elevated temperatures on vector populations.
In comparing the results regarding malaria and dengue in Haiti, we can see that both diseases show spatial and temporal variability. In the case of malaria in Haiti, there is a more pronounced signal in the western part of the country compared to the eastern regions. However, significant transmission is evident throughout the entire country. The period from September to December exhibits a notably high incidence signal, reaching its peak in November. On the other hand, dengue is projected to shift from the western regions toward the central areas in Haiti. This suggests that the central regions may witness an increase in dengue cases over time. However, certain areas may experience a decrease in malaria and dengue fever due to reduced rainfall and high temperatures, which can lead to the mortality of adult mosquitoes and a subsequent reduction in disease transmission. It is interesting to note that despite less favorable mosquito-climate conditions in the Eastern departments, both malaria and dengue still occur in these areas. This can be attributed to the regularity of clinical data collection and the presence of healthcare hubs in these regions.
Furthermore, the study analyzes fluctuations in the heat index and the corresponding categories of thermal comfort across different seasons, with particular attention to the JJA season characterized by elevated heat index values and conditions indicating extreme caution. This paper offers a comprehensive exploration of the complex web of interactions between climate dynamics, disease propagation, and modeling, within the specific context of Haiti. The findings underscore the foreseeable implications of climate change on disease transmission, with a prominent emphasis on vector-borne diseases such as malaria and dengue. Importantly, these findings stress the necessity of integrating considerations of climate variability and change when assessing disease vulnerability and devising effective public health strategies for the region.
However, it is worth noting that there exist notable gaps and deficiencies in our current understanding of climate change and health, especially in the context of vulnerability and adaptation studies within the healthcare sector. Future research in this domain can play a crucial role in identifying health determinants influenced by changing climatic factors, assessing the health consequences of climate variability and change, developing simulations and projections related to climate and health, evaluating levels of vulnerability and health risk across geographical regions, and prioritizing adaptation strategies for the healthcare system.
The original contributions presented in the study are included in the article/supplementary material. Further inquiries can be directed to the corresponding author.
ID: Conceptualization, Data curation, Formal Analysis, Investigation, Methodology, Software, Visualization, Writing – original draft. IS: Funding acquisition, Supervision, Validation, Resources, Writing – review & editing. MD: Methodology, Software, Writing – review & editing, Formal Analysis, Validation.
The author(s) declare financial support was received for the research, authorship, and/or publication of this article. This study is a component of the Haiti National Adaptation Plan (NAP) Support Project. The authors express their heartfelt gratitude to the NAP for providing funding for the research.
The authors extend their warm thanks to the World Health Organization (WHO) and the Ministry of Health of Haiti for their invaluable contribution in providing health data.
The authors declare that the research was conducted in the absence of any commercial or financial relationships that could be construed as a potential conflict of interest.
The handling editor CC declared a past co-authorship with one of the authors ID.
All claims expressed in this article are solely those of the authors and do not necessarily represent those of their affiliated organizations, or those of the publisher, the editors and the reviewers. Any product that may be evaluated in this article, or claim that may be made by its manufacturer, is not guaranteed or endorsed by the publisher.
1. WHO. Climate Change and Health: Action Framework 2017-2021. Geneva: World Health Organization (WHO (2017). 12p.
2. WHO. Climate change and health vulnerability and adaptation assessment. Geneva: World Health Organization (2021). 84p.
3. MDE. National Policy on Climate Change Mitigation (PNCC). Haiti: Government of the Republic of Haiti Ministry of the Environment (MDE (2019). 52p.
4. MDE. Revised Nationally Determined Contribution (NDC) Vol. 2022. . Haiti: Government of the Republic of Haiti Ministry of the Environment (MDE (2022). 62p.
5. Masson-Delmotte V, Zhai P, Pirani A, Connors SL, Péan C, Berger S, et al. Climate change 2021: the physical science basis. In: Contribution of working group I to the sixth assessment report of the intergovernmental panel on climate change. Geneva, Switzerland, vol. 2. (2021).
6. Pachauri RK, Allen MR, Barros VR, Broome J, Cramer W, Christ R, et al. Climate change 2014: synthesis report. In: Contribution of Working Groups I, II and III to the fifth assessment report of the Intergovernmental Panel on Climate Change. Geneva, Switzerland: Ipcc (2014). p. 151.
7. Michelangeli PA, Vrac M, Loukos H. Probabilistic downscaling approaches: Application to wind cumulative distribution functions. Geophys Res Lett (2009) 36(11), L11708. doi: 10.1029/2009GL038401
8. Hoshen MB, Morse AP. A weather-driven model of malaria transmission. Malaria J (2004) 3:1–14. doi: 10.1186/1475-2875-3-32
9. Ermert V, Fink AH, Jones AE, Morse AP. Development of a new version of the Liverpool Malaria Model. I. Refining the parameter settings and mathematical formulation of basic processes based on a literature review. Malaria J (2011) 10(1):1–17. doi: 10.1186/1475-2875-10-35
10. Caminade C, Ndione JA, Kebe CMF, Jones AE, Danuor S, Tay S, et al. Mapping Rift Valley fever and malaria risk over West Africa using climatic indicators. Atmos Sci Lett (2011) 12(1):96–103. doi: 10.1002/asl.296
11. Jones AE, Morse AP. Application and validation of a seasonal ensemble prediction system using a dynamic malaria model. J Climate (2010) 23(15):4202–15. doi: 10.1175/2010JCLI3208.1
12. MacLeod DA, Jones A, Di Giuseppe F, Caminade C, Morse AP. Demonstration of successful malaria forecasts for Botswana using an operational seasonal climate model. Environ Res Lett (2015) 10(4):044005. doi: 10.1088/1748-9326/10/4/044005
13. Diouf I, Rodriguez-Fonseca B, Deme A, Caminade C, Morse AP, Cisse M, et al. Comparison of malaria simulations driven by meteorological observations and reanalysis products in Senegal. Int J Environ Res Public Health (2017) 14(10):1119. doi: 10.3390/ijerph14101119
14. Diouf I, Ndione JA, Gaye AT. Malaria in Senegal: recent and future changes based on bias-corrected CMIP6 simulations. Trop Med Infect Dis (2022) 7(11):345. doi: 10.3390/tropicalmed7110345
15. Garrett-Jones C, Ferreira Neto JA, World Health Organization. The prognosis for interruption of malaria transmission through assessment of the mosquito's vectorial capacity. Geneva, Switzerland: World Health Organization (1964).
16. Liu-Helmersson J. Mathematical Modeling of Dengue -Temperature Effect on Vectorial Capacity, in: Master of Science Thesis (2012). Umea˚ University. Available at: http://www.phmed.umu.se/digitalAssets/104/104555_jing-helmersson.pdf (Accessed 11 December 2012).
17. Scott TW, Amerasinghe PH, Morrison AC, Lorenz LH, Clark GG, Strickman D, et al. Longitudinal studies of Aedes aEgypti (Diptera: Culicidae) in Thailand and Puerto Rico: blood feeding frequency. J Med entomol (2000) 37(1):89–101. doi: 10.1603/0022-2585-37.1.89
18. Lambrechts L, Paaijmans KP, Fansiri T, Carrington LB, Kramer LD, Thomas MB, et al. Impact of daily temperature fluctuations on dengue virus transmission by Aedes aEgypti. Proc Natl Acad Sci (2011) 108(18):7460–5. doi: 10.1073/pnas.1101377108
19. McLean DM, Clarke AM, Coleman JC, Montalbetti CA, Skidmore AG, Walters TE, et al. Vector capability of Aedes aEgypti mosquitoes for California encephalitis and dengue viruses at various temperatures. Can J Microbiol (1974) 20(2):255–62. doi: 10.1139/m74-040
20. Watts DM, Burke DS, Harrison BA, Whitmire RE, Nisalak A. Effect of temperature on the vector efficiency of Aedes aEgypti for dengue 2 virus. Am J Trop Med Hyg (1987) 36(1):143–52. doi: 10.4269/ajtmh.1987.36.143
21. Focks DA, Daniels E, Haile DG, Keesling JE. A simulation model of the epidemiology of urban dengue fever: literature analysis, model development, preliminary validation, and samples of simulation results. Am J Trop Med Hyg (1995) 53(5):489–506. doi: 10.4269/ajtmh.1995.53.489
22. Yang H, Macoris MDLDG, Galvani KC, Andrighetti MTM, Wanderley DMV. Assessing the effects of temperature on the population of Aedes aEgypti, the vector of dengue. Epidemiol Infect (2009) 137(8):1188–202. doi: 10.1017/S0950268809002040
23. Rothfusz LP, NWS Southern Region Headquarters. The heat index equation (or, more than you ever wanted to know about heat index). Fort Worth, Texas: National Oceanic and Atmospheric Administration, National Weather Service, Office of Meteorology (1990). p. 9023.
24. Steadman RG. The assessment of sultriness. Part I: A temperature-humidity index based on human physiology and clothing science. J Appl Meteorol Climatol (1979) 18(7):861–73. doi: 10.1175/1520-0450(1979)018<0861:TAOSPI>2.0.CO;2
25. Taylor KE. Summarizing multiple aspects of model performance in a single diagram. J Geophys Res: Atmos (2001) 106(D7):7183–92. doi: 10.1029/2000JD900719
26. Béguin A, Hales S, Rocklöv J, Åström C, Louis VR, Sauerborn R. The opposing effects of climate change and socio-economic development on the global distribution of malaria. Global Environ Change (2011) 21(4):1209–14. doi: 10.1016/j.gloenvcha.2011.06.001
Keywords: climate variability and climate change, projections, impacts, health, diseases
Citation: Diouf I, Sy I, and Diakhaté M (2024) Assessing climate change impacts on public health in Haiti: a comprehensive study of disease distribution, modeling, and adaptation strategies. Front. Trop. Dis 4:1287499. doi: 10.3389/fitd.2023.1287499
Received: 01 September 2023; Accepted: 13 December 2023;
Published: 09 February 2024.
Edited by:
Cyril Max Caminade, The Abdus Salam International Centre for Theoretical Physics (ICTP), ItalyReviewed by:
Nathalia Zini, Instituto de Ciência e Tecnologia de Vacinas (INCTV), BrazilCopyright © 2024 Diouf, Sy and Diakhaté. This is an open-access article distributed under the terms of the Creative Commons Attribution License (CC BY). The use, distribution or reproduction in other forums is permitted, provided the original author(s) and the copyright owner(s) are credited and that the original publication in this journal is cited, in accordance with accepted academic practice. No use, distribution or reproduction is permitted which does not comply with these terms.
*Correspondence: Ibrahima Diouf, aWJyYWhpbWEyMy5kaW91ZkB1Y2FkLmVkdS5zbg==
Disclaimer: All claims expressed in this article are solely those of the authors and do not necessarily represent those of their affiliated organizations, or those of the publisher, the editors and the reviewers. Any product that may be evaluated in this article or claim that may be made by its manufacturer is not guaranteed or endorsed by the publisher.
Research integrity at Frontiers
Learn more about the work of our research integrity team to safeguard the quality of each article we publish.