
94% of researchers rate our articles as excellent or good
Learn more about the work of our research integrity team to safeguard the quality of each article we publish.
Find out more
ORIGINAL RESEARCH article
Front. Trop. Dis. , 02 November 2023
Sec. Neglected Tropical Diseases
Volume 4 - 2023 | https://doi.org/10.3389/fitd.2023.1240617
 Collins Okoyo1,2,3*
 Mark Minnery4
 Idah Orowe1
 Chrispin Owaga5Christin Wambugu6Nereah Olick7Jane Hagemann4Wyckliff P. Omondi8Paul M. Gichuki2Kate McCracken4
 Antonio Montresor9
 Claudio Fronterre10
 Peter Diggle10
 Charles Mwandawiro2
Background: Infections caused by both Schistosoma mansoni and Schistosoma haematobium are endemic in Kenya, with over six million children at risk. A national school-based deworming programme was launched in 2012 with the goal of eliminating parasitic worms as a public health problem. This study used a model-based geostatistical (MBG) approach to design and analyse the impact of the programme and inform treatment strategy changes for schistosomiasis (SCH).
Methods: A cross-sectional survey of 200 schools across 27 counties of Kenya was utilised. The study design, selection of the schools, and analysis followed the MBG approach, which incorporated historical data on treatment, morbidity, and environmental covariates.
Results: The overall SCH prevalence was 5.0% (95% CI 4.9%–5.2%) and was estimated, with a high predictive probability of 0.999, to be between 1% and< 10%. The predictive probabilities at county level revealed county heterogeneity, with that of four counties estimated to be between 0% and< 1%, that of 20 counties estimated to be between 1% and< 10%, that of two counties estimated to be between 10% and< 20%, and that of one county estimated to be between 20% and< 50%.
Conclusion: SCH treatment requirements can now be confidently refined based on the World Health Organization’s guidelines. The four counties with prevalences of between 0% and< 1% may consider suspending treatment only in areas (i.e., sub-counties and wards) where the prevalence is< 1%.
Over 200 million people living in Africa, Asia, South America, and the Caribbean are infected with schistosomiasis (SCH)-causing parasites (1). Although the global distribution of infection has changed, the majority of the disease burden is now concentrated in sub-Saharan Africa, which is largely due to the effective control and economic development in other regions (2). SCH has been recognised as having a significant impact on the development and educational attainment of school-age children (SAC), hindering their ability to lead a full healthy life while also affecting productivity into adulthood (3). Infection with SCH can lead to local and systemic pathological effects including anaemia, stunted growth, impaired cognition, decreased physical fitness, and organ-specific effects (4). Repeated preventative chemotherapy (PC) with praziquantel, which has a known safety profile, high levels of tolerability, and is low cost, is used to control morbidity within at-risk populations. PC is usually administered through school platform, which enables control programmes to achieve high coverage levels, minimise cost, and target those who are most at risk. School-based deworming is a proven, cost-effective strategy that can limit the negative health and educational consequences of the infection (5).
Infections caused by soil-transmitted helminths (STHs) and SCH infections are endemic in Kenya, with over six million children at risk of both types of infection (6). In 2012, Kenya launched a national school-based deworming programme (NSBDP), with the goal of eliminating these parasitic worms as a public health problem (EPHP), by providing PC for both diseases to all SAC and preschool-age children (PSAC) in all endemic counties across the country (7). The NSBDP is aligned with the disease-specific targets within the World Health Organization (WHO)’s road map for neglected tropical diseases (NTDs) 2021–2030 (8). The programme aims to treat over 80% of all children aged between 5 years and 14 years, whether enrolled or unenrolled in school, within all areas (counties) endemic for SCH necessitating annual treatment based on WHO guidelines, as determined at the beginning of the programme (9).
After 10 years of NSBDP operations it is important to establish the impact of treatment, assess prevalence and intensity changes, and have a more granular understanding of SCH prevalence across Kenya. Furthermore, it is expected that after 5–6 years of consistent mass drug administration (MDA), the infection prevalence will be substantially reduced and that the SCH prevalence classification will need to be reviewed with the aim of changing the treatment delivery frequency based on the WHO decision tree (9). The survey results may inform treatment strategy changes, including if and where treatment may be suspended and surveillance systems implemented, as recommended by WHO, and where to target reservoirs of continued disease transmission. To this end, a year 9 (Y9: 2021/2022) impact assessment was conducted. Differing from previous surveys, the Y9 survey design made use of the large numbers of survey, environmental, coverage, and spatial data to geostatistically optimise survey design and analysis for both STH and SCH infections.
The recent innovations in survey design using geospatial statistical methods, such as model-based geostatistics (MBG), to select survey sites have been shown to deliver more precise results, given the same resources, than traditional design approaches, such as multistage sampling (10). MBG differs from traditional survey design in the selection of sites for surveying and the information, which is derived from those sites post survey (11). While traditional design suggests randomisation of sites for surveying across some representative areas such as ecological zones, MBG uses predictive models to identify sites which provide the most predictive power for post-survey modelling of prevalence (12). In this way, spatially regulated sampling can be used to target the most informative sites and maximise survey precision under given resource constraints. The use of MBG maximises the potential of integration of STHs and SCH, given their similarities in risk factors, and it allows the estimation of probabilities that post-analysis prevalences are within some predefined programmatically relevant thresholds (13).
The overall goal of the survey was to determine the probability of various levels of implementation units (IUs) and that prevalences for the overall NSBDP geographic area, counties, sub-counties, and wards, were within programmatically relevant disease prevalence thresholds for SCH. The prevalence ranges were 0% to< 1%, 1% to< 10%, 10% to< 20%, 20% to< 50%, and 50%. In this way, the future treatment strategy of school-based deworming in Kenya could be optimised to ensure that resources are most efficiently targeted across the country.
We used a cross-sectional study design to survey 200 schools drawn from all 27 counties in parts of the seven regions of Kenya. The schools were sampled using a spatially regulated design (11), incorporating a constrained randomisation that imposes a minimum distance of 10 km between any two sampled locations. This design results in a more even coverage of the geographical region of interest and usually leads to better predictive performance (14). The counties were included in the survey as IUs with spatially regulated sampling conducted within each IU. In each school, a minimum random sample of 70 children of equal sex per class for seven classes, one early childhood development (ECD) class and classes one to six, was taken. The sample size calculations used the MBG approach to achieve a prespecified proportion of 87% of correctly classified IUs (11).
The selected schools were visited three days prior to the survey date to brief the school headteacher and the school committee on the purpose of the survey, seek permission to conduct the study in the school, and convey information about the survey to the parents/guardians of the children. On the day of the survey, each participating child was given two polypot containers, each labelled with a unique identifier to place, separately, a sample of his or her own stool and urine in them. The stool samples were then processed in the laboratory within 24 hours and examined in duplicate for the presence of Schistosoma mansoni eggs by two technicians using the Kato–Katz technique (15). The urine samples were processed using the urine filtration method in the laboratory within 24 hours using polycarbonate membrane filters and examined in duplicate for the presence of Schistosoma haematobium eggs by two technicians. The survey procedures used during this survey, including the diagnosis technique, were similar to those used during previous impact assessments; only the design and analysis of the survey differed.
The survey data were collected one month prior to the year 10 MDA in two phases: phase one took place between 6 September 2021 and 24 September 2021, and phase two took place between 9 May 2022 and 22 June 2022. The infection prevalence and intensity data were collected by examining a single stool and urine samples from each selected child and recording the number of S. mansoni and S. haematobium eggs, respectively. The survey laboratory reporting form was programmed onto android smart phones, which were used to capture data electronically using the Open Data Kit system that incorporated in-built data quality checks to reduce data entry errors (16). Data were then sent to a secure server in Nairobi and processed as per the institutional data policies and guidelines.
The statistical analysis and modelling were twofold; fitting the geostatistical model to the available collected data and estimating model parameters, and then calculating the predictive probabilities for IU classification.
The data obtained from the ith surveyed school were: , the number of children tested; , the school’s location; and , the number of children whose test result was positive, where “positive” can mean the detection of any eggs in the stool/urine sample or of a number of eggs corresponding to a light, moderate, or heavy infection. Prevalence, defined as the probability of a positive test result, at any location in the geographical region of interest , is denoted by . Given , the probability distribution of is binomial, with the denominator .
Finally, is modelled as a mixed-effects logistic regression:
where is a set of context-specific covariates associated with location , is the corresponding set of regression parameters, is a spatially correlated Gaussian stochastic process, and the are zero-mean normally distributed random variables realised independently at each sampled location. The terms and represent spatial variation in prevalence that can and cannot, respectively, be explained by covariates that are available throughout the geographical region of interest, while represents spatially unstructured extra-binomial variation at each sampled location, for example, due to the familial clustering of infection status (10). A set of covariates were included in the models used to design the year 9 impact survey but not to analyse the collected data, as the very low prevalence did not allow the reliable estimation of the association between outcome and explanatory variables.
The inferential target in each IU is the population-weighted prevalence:
where is the population density at and the integration is over the whole of the IU in question. If the locations and enrolments of all schools in the IU are known, the integral would reduce to a sum; here, for we use population density data on a regular grid at a spacing of 5 km, which we obtained from WorldPop (17). After the model parameters were estimated using Monte Carlo maximum likelihood approximation, we took samples from the predictive distribution of T, from which we calculated the probability distribution of T over the designated set of prevalence intervals and classified the IUs accordingly.
During the year 9 survey, 200 schools (13,416 children in total) with a median age of 9 years (range 1–19 years) were surveyed across all the 27 counties covered by NSBDP. Half of the surveyed children, that is, 6,790 (50.6%) of them, were male. The distribution of the children per class was as follows: ECD 1,863 (13.9%), class one 842 (6.2%), class two 2,635 (19.6%), class three 2,636 (19.7%), class four 2,646 (19.7%), class five 2,625 (19.6%), and class six 169 (1.3%). The numbers of schools and children surveyed varied per county and are shown in Table 1.
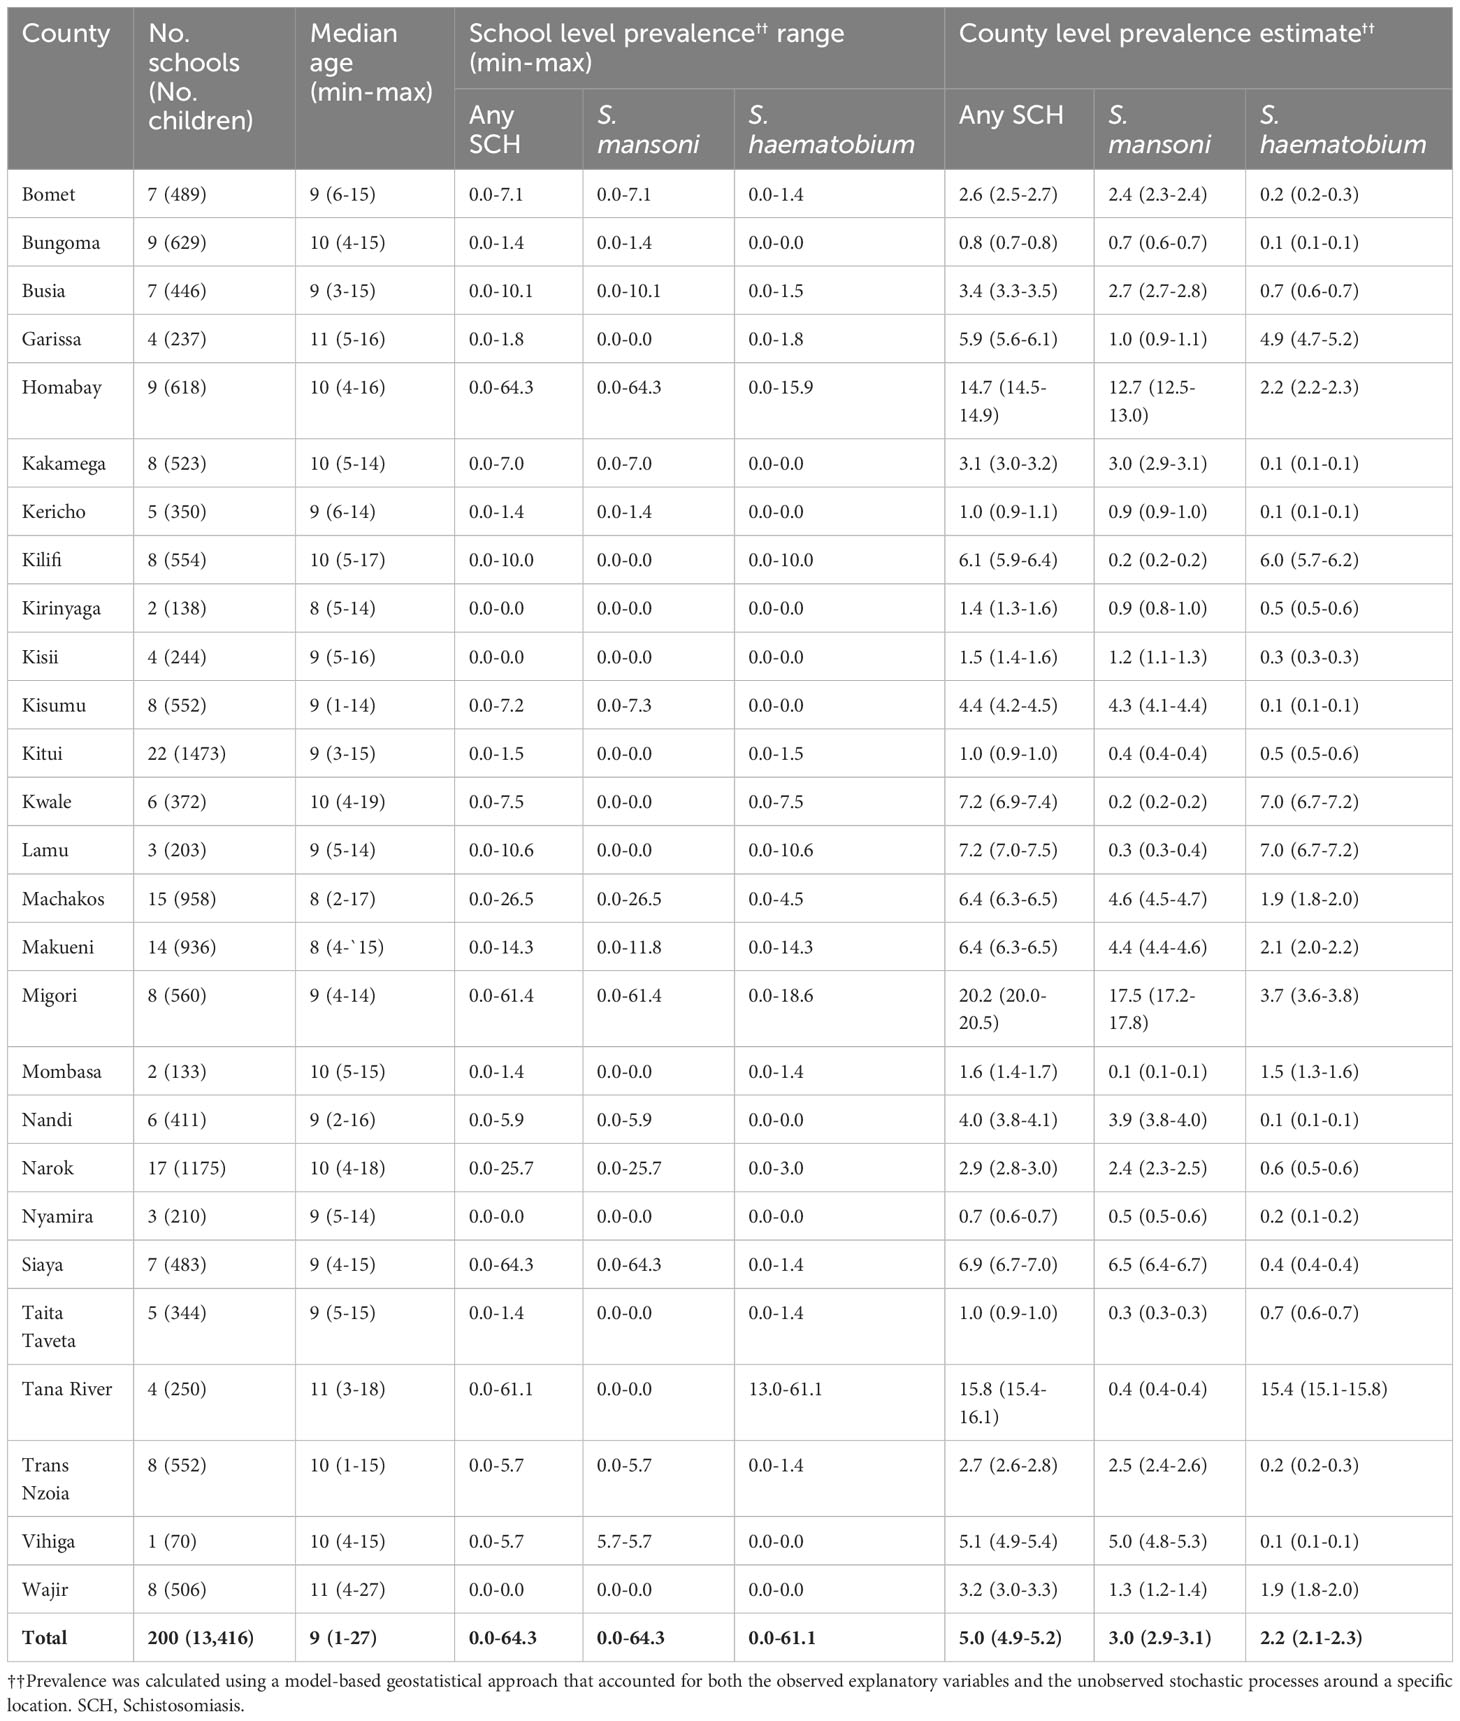
Table 1 Number of schools, children examined by county, school-level SCH prevalence range (minimum–maximum), and county-level SCH prevalence estimates among schoolchildren in Kenya.
The SCH prevalence thresholds were set a priori at 0% to< 1%, 1% to< 10%, 10% to< 20%, 20% to< 50%, and 50% and above. The overall prevalence of any SCH was estimated to be between 1% and< 10%, with a 0.999 predictive probability. This represented a 0.999 probability that the thresholds for both S. mansoni and S. haematobium were between 1% and< 10%.
Of the 27 NSBDP counties, the prevalence was predicted to be between 0% and< 1% in four counties (Bungoma, Kitui, Nyamira, and Taita Taveta). These prevalence estimates were associated with a > 0.999 predictive probability in two counties (Bungoma and Nyamira), a 0.998 predictive probability in Kitui, and a 0.711 predictive probability in Taita Taveta. Furthermore, the prevalence was predicted to be between 1% and< 10% in 20 counties, with prevalence estimates associated with a > 0.999 predictive probability in all these counties, except in Kericho which had a 0.878 predictive probability. Finally, the prevalence was predicted to be between 10% and< 20% in two counties (Homabay and Tana River), with a > 0.999 predictive probability, and to be between 20% and< 50% in only one county (Migori), with a 0.953 predictive probability (Table 2 and Figure 1).
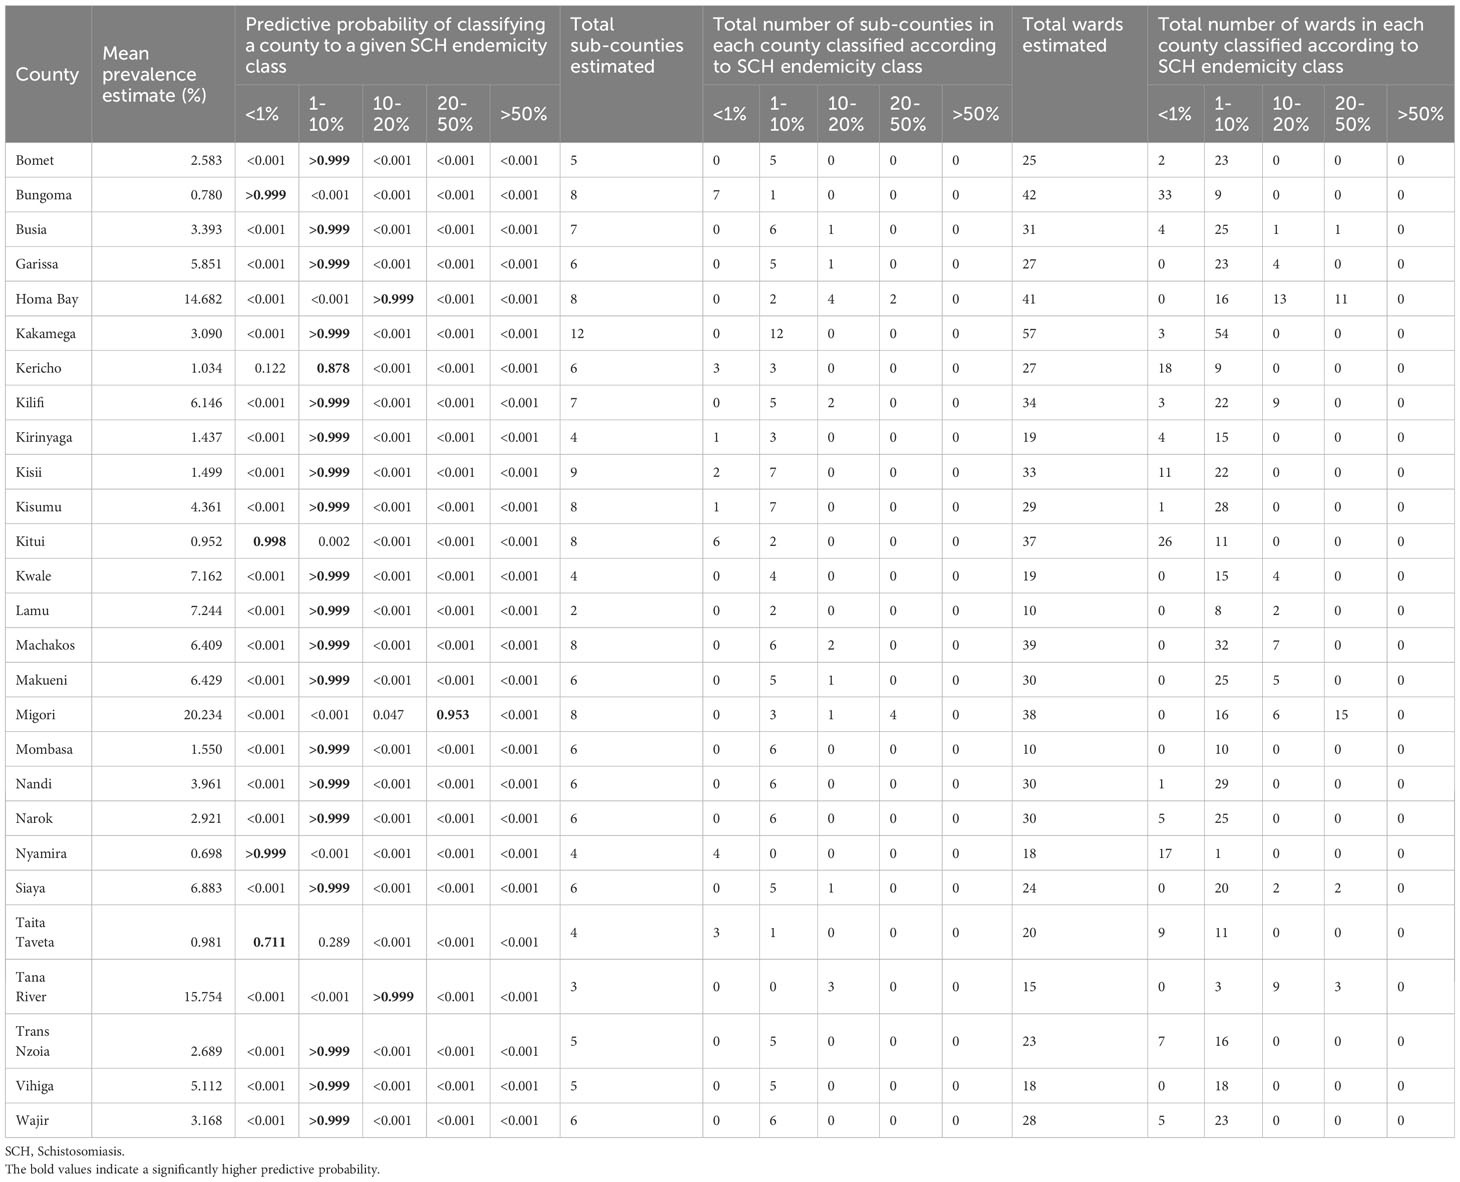
Table 2 SCH county endemicity classification using predictive probabilities and the number of sub-counties and wards classified according to the SCH endemicity of their respective county, which was calculated using the fitted MBG model.
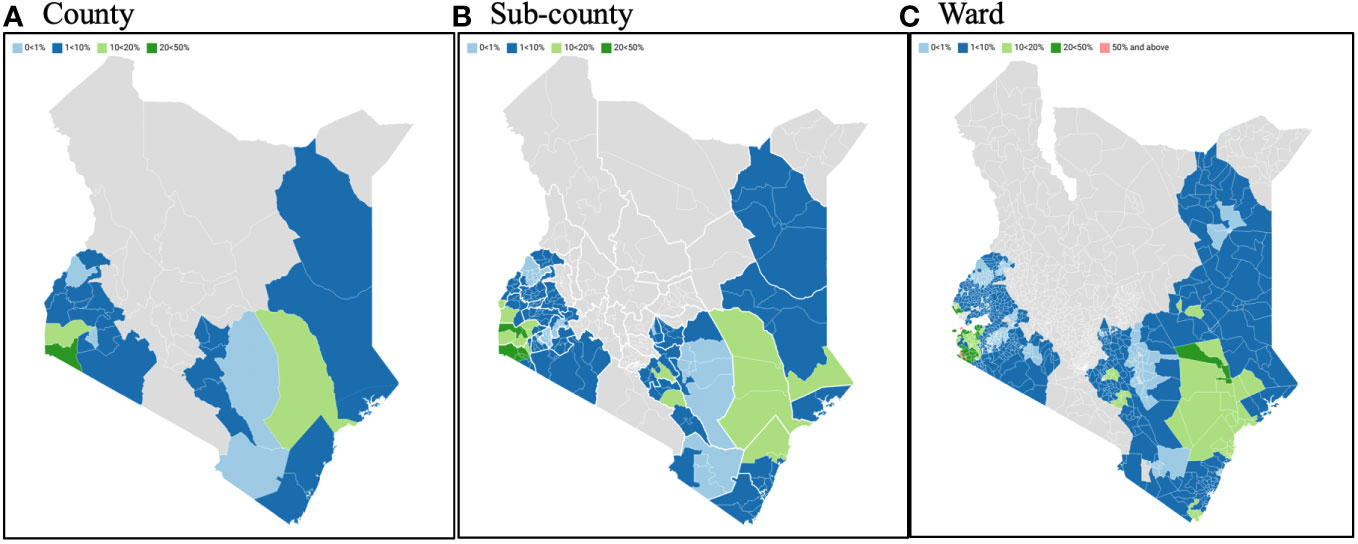
Figure 1 SCH county, sub-county, and ward endemicity classification using predictive probabilities calculated using the fitted MBG model. SCH, Schistosomiasis; MBG, Model-based geostatistics.
The analysis was extended to determine lower-level geographic variation in prevalence thresholds. As with more geographic focality, less confidence can be placed on assumptions made to derive prevalence thresholds and probabilities. Regardless, sub-county analysis suggested that 15 of the 27 NSBDP counties showed differential prevalence thresholds across their respective sub-counties. As an example, for the eight sub-counties in Homabay County, two were assumed to be between 1% and< 10%, four were assumed to be between 10% and< 20% and two were assumed to be between 20% and< 50% (Table 2 and Figure 1).
Furthermore, SCH analysis was extended to wards, showing 25 of the 27 counties having differential prevalence thresholds at the ward level. As an example, of the 31 wards which comprise Busia County, four were assumed to be between 0% and< 1%, 25 were assumed to be between 1% and< 10%, one was assumed to be between 10% and <20%, and another one was assumed to be between 20% and< 50% (Table 2 and Figure 1).
The overall prevalence of any schistosome infections was 5.0% (95% CI 4.9%–5.2%), with a species-specific prevalence of 3.0% (95% CI 2.9%–3.1%) for S. mansoni and 2.2% (95% CI 2.1%–2.3%) for S. haematobium (Table 1). The county-level prevalence ranged from 0.7% to 20.2% for any SCH, and specifically 0.1% to 17.5% for S. mansoni, and from 0.1% to 15.4% for S. haematobium. The pixel-level geographical distribution of schistosomiasis prevalence across the NSBDP geographic area is shown in Figure 2.
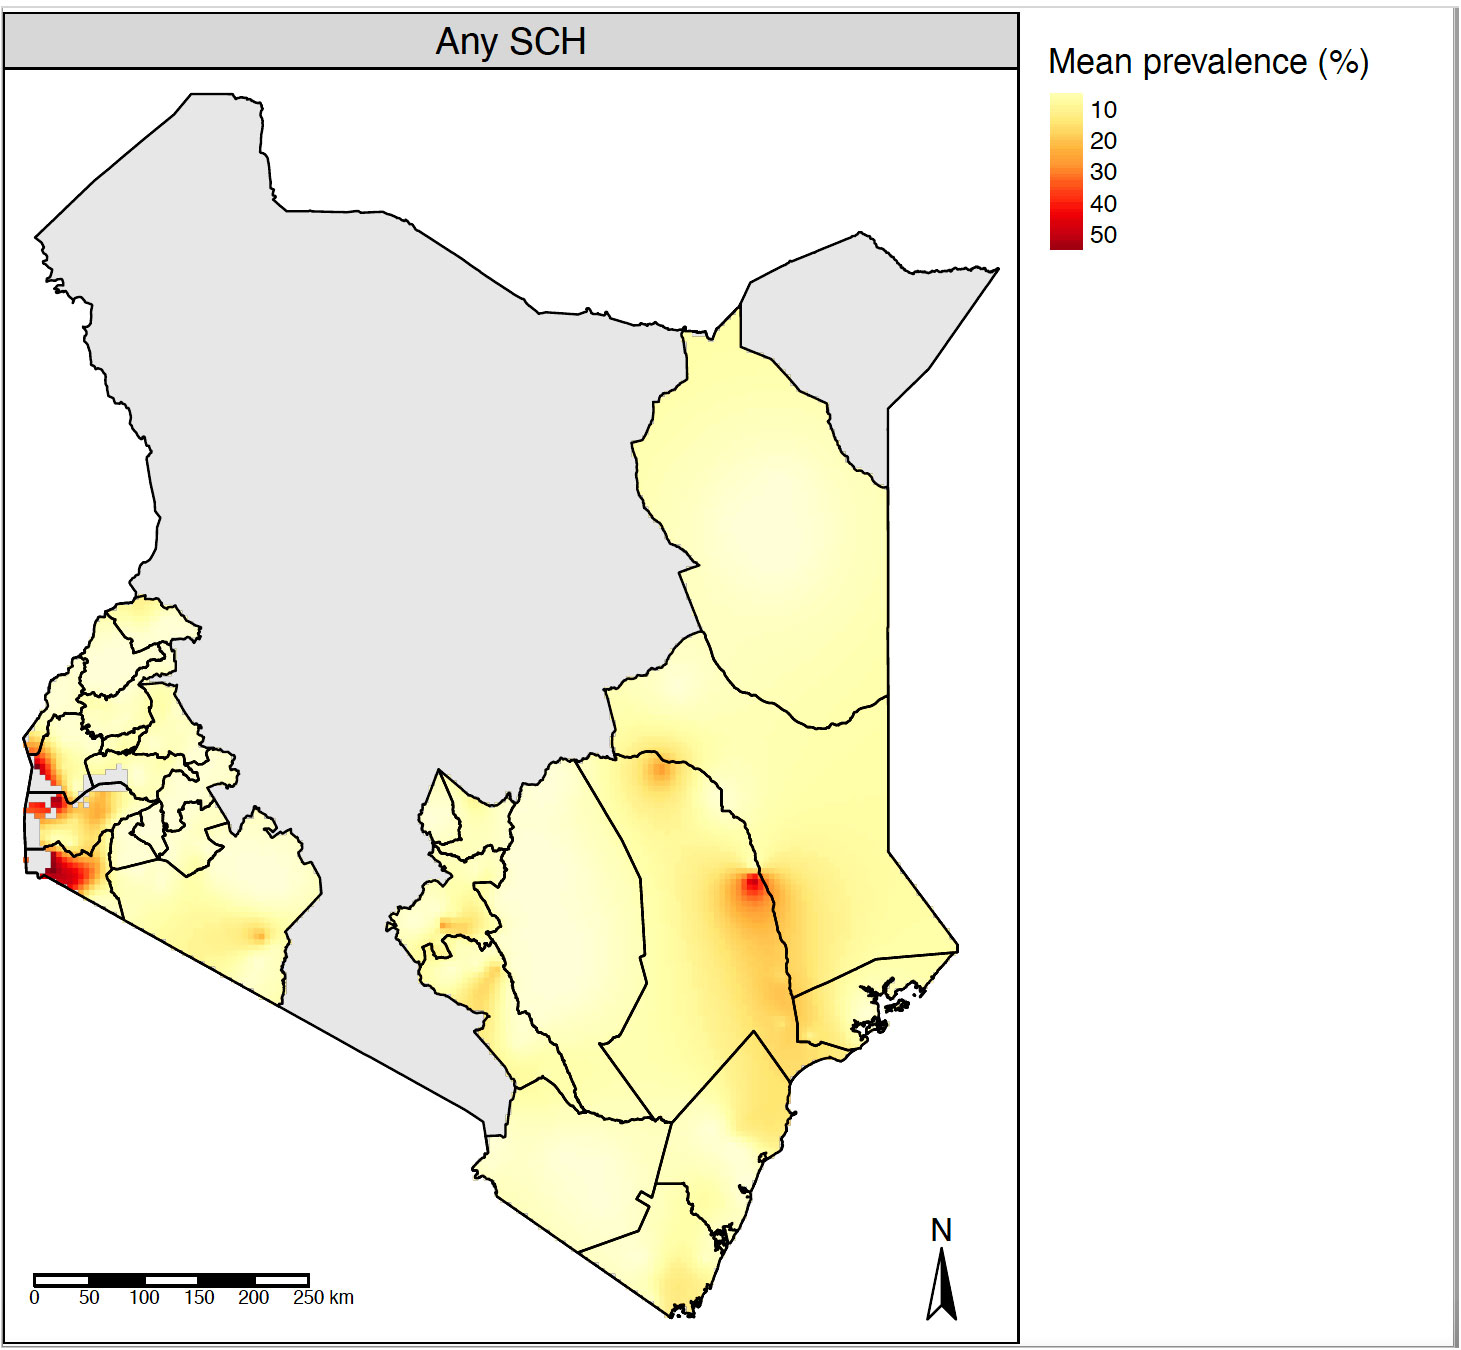
Figure 2 Pixel-level geographical distribution of SCH mean prevalence estimated using the fitted MBG model. SCH, Schistosomiasis; MBG, Model-based geostatistics.
The prevalence of SCH intensity classes was analysed only using the classical statistical approach by assuming a binomial sampling distribution for the number of moderate to heavy infections with the denominator taken as the total number of children examined. The use of a classical statistical approach was necessitated by the low frequency of moderate to heavy infections in the data, which prevented the use of a standard geostatistical modelling approach. The prevalence of moderate- to heavy-intensity infections is an important criterion for determining EPHP for schistosomes with the threshold taken as less than 1%.
The overall prevalence of moderate to heavy infections for S. mansoni was 1.6% (95% CI 1.4%–1.8%), whereas the prevalence of heavy infections for S. haematobium was 0.1% (95% CI 0.1%–0.2%). The comparison of the prevalence of moderate to heavy SCH infection between baseline and year 9 evaluation is given in Figure 3A.
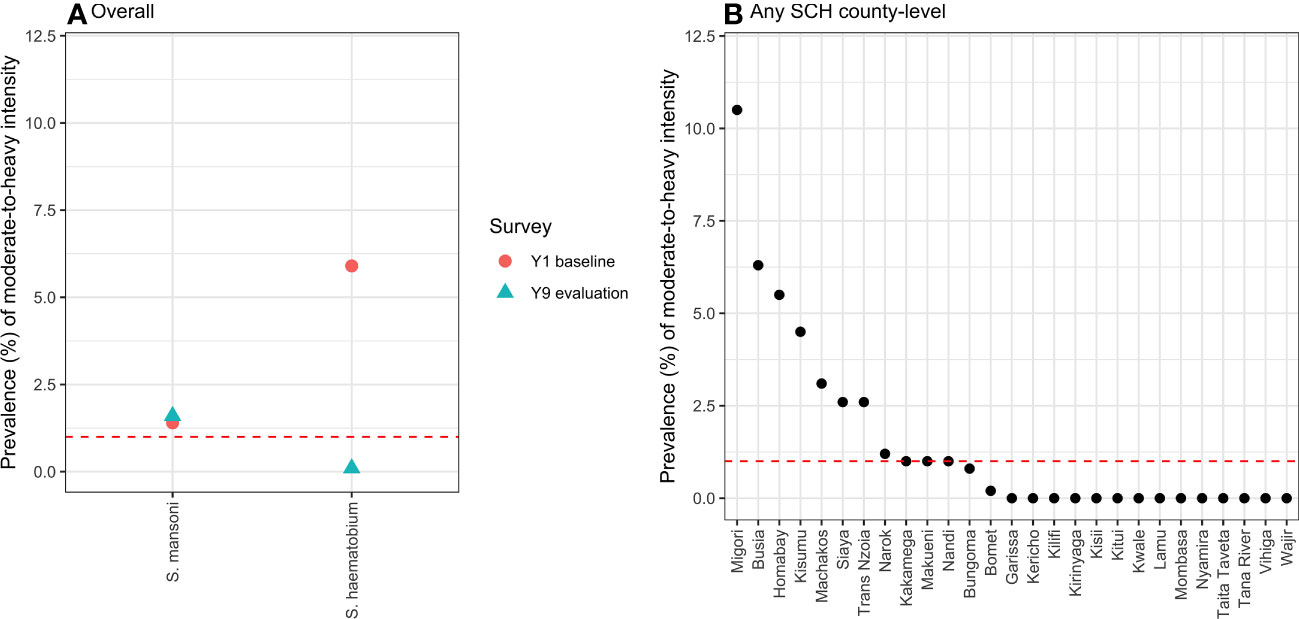
Figure 3 The overall ( A) and county-level (B) prevalence of moderate- to heavy-intensity SCH infection calculated using the classical statistical models, with the total number of children examined taken as the denominator. The red dotted lines indicate the cut-off level (1.0%) for the prevalence of moderate- to heavy-intensity infection, below which the NSBDP geographic area or a county is considered to have attained EPHP. SCH, Schistosomiasis; NSBDP, National school-based deworming programme; EPHP, Elimination as a public health problem.
The county-level prevalence of moderate- to heavy-intensity schistosome infections is shown in Figure 3B, and it varied from 0% to 10.5%. From these results, 9 out of the 27 counties have not eliminated SCH as a public health problem.
The available WHO guidelines stipulate that for a given geographical area, SCH prevalence should be estimated based on population-level surveys (9). The results from the survey are then used to determine whether or not MDA should be initiated, and the treatment frequency required. In areas where MDA has been delivered consistently for about 5–6 years, an impact assessment survey needs to be conducted to further refine the MDA requirements. This study used a novel model-based geostatistics approach to design and analyse a large-scale nationwide impact assessment survey conducted after nine rounds of MDA in 27 counties to accurately determine the probability that the overall NSBDP geographic area, counties, sub-counties, and wards were within programmatically relevant prevalence thresholds. The prevalence threshold enabled us to confidently refine the MDA requirements for the NSBD programme.
The design of the SCH mapping and impact assessment surveys usually follows WHO recommendations to sample 50 children per village (or school), with five villages sampled per ecological zone (18). However, sometimes the number of villages (schools) is limited to the available budget. The selection of village (school) locations follows random sampling designs. The empirical data obtained from these surveys are often spatially sparse within the region of interest (19). In a programmatic context, the prevalence analysis of data from these surveys is often performed by computing the raw prevalence (9). However, in the context of research studies, the prevalence is usually computed using classical statistical models in the form of a generalised linear mixed model with binomial error distribution, logistic link, and a set of explanatory variables (20). The estimates resulting from these raw prevalence calculations or classical models are mostly biased and inefficient, provided that both schools and children were randomly selected from the general population (11).
In this survey, the results indicated that the overall prevalence for any SCH was estimated to be between 1% and< 10%, with a high predictive probability of 0.999. Typically, this implies that this geographic area would need to be treated once every 2 years, as per the WHO guidelines (9). However, this analysis was powered to provide predictive probabilities at the county level, and possibly at lower levels such as sub-county and wards. This is owing to the fact that heterogeneity in infection burden exists within counties.
Out of the 27 counties, four counties (Bungoma, Kitui, Nyamira and Taita Taveta) were estimated with high predictive probability to be within 0% to< 1% prevalence. This is a strong indication that the SCH prevalence in these counties is below the MDA threshold set by WHO. However, a more-detailed look at the four counties revealed that in Bungoma, one sub-county and nine wards had SCH prevalence of between 1% and< 10%. In Kitui, two sub-counties and 11 wards had prevalences of between 1% and< 10%. In Nyamira, zero sub-counties and one ward had SCH prevalence of between 1% and< 10%, while in Taita Taveta one sub-county and 11 wards had prevalences between 1% and 10%. This implies that, instead of suspending SCH treatment in the whole county, treatment should only be suspended in areas (i.e., sub-counties and wards) within the county that are estimated to be between 0% and< 1%.
Furthermore, 20 out of the 27 counties had their SCH prevalence estimated with a high predictive probability to be within 1% to< 10%, and, as such, require MDA only once after every 2 years. Lastly, two counties (Homabay and Tana River), and one county (Migori), had their SCH prevalences estimated with a high predictive probability to be between 10% and< 20%, and 20% and 50%, respectively. Therefore, these counties should consider maintaining the previous treatment plan of an annual MDA. Even though the treatment decision was made at county level, the sub-county and ward level predictive probabilities were taken into account primarily because of the county heterogeneity in prevalence thresholds.
From the analysis, the overall prevalence of any SCH decreased to a low level of 5.0%, a reduction from an initial level of 18.0%, after nine rounds of MDA (6). However, the prevalence was still above the no-MDA requirement threshold of< 1% (9). In addition, the county- and sub-county-level prevalences were heterogeneous, and some counties had a prevalence of up to 17.5%. Hence, there is a need to continue with MDA, but with a delivery frequency that is county and sub-county focussed. This kind of treatment strategy allows decisions to be made regarding the areas within counties where the treatment may be suspended and surveillance systems implemented and will counteract the effect of scarce resources and target the reservoirs of continued disease transmission to increase programme impact.
The prevalence of moderate- to heavy-intensity infection is an important metric in determining areas where the programme has achieved EPHP. EPHP is defined as a geographic area where the prevalence of moderate- to heavy-intensity of SCH infection is less than 1% (8). In view of our prevalence of moderate- to heavy-intensity infection, out of the 27 counties surveyed, 18 counties have attained EPHP, whereas nine counties, which include Migori (10.5%), Siaya (8.1%), Homabay (5.5%), Machakos (3.1%), Kisumu (2.0%), Busia (1.8%), Kakamega (1.0%), and Makueni (1.0%), have not attained the threshold and show a relatively high disease burden in some wards. Previous surveys have documented the challenges in some of these counties related to transmission drivers, including nearness to water bodies, poor sanitation and hygiene conditions, low treatment coverage, environmental conditions that are suitable for parasite persistence, and economic activities that expose individuals to contact with parasites (21). In addition, a lack of precision sampling of transmission hotspots for treatment is another probable cause (22). Improved interventions targeting the attainment of EPHP in these counties should be explored, and research studies documenting the reasons for the persistence of SCH in these areas should be carried out.
The study used a novel MBG approach to design and analyse the SCH results for the NSBD programme. The approach had the following strengths and advantages: (i) the design was optimised to target both STHs and SCH, as they have similar spatial correlation properties, and the utilisation of an integrated survey design approach resulted in the prudent use of the limited resources typical of settings in low- and middle-income countries (23); (ii) the MBG approach used pre-intervention infection information to design a stratified impact assessment survey through which areas with a historically low prevalence could be under sampled, resulting in the more efficient use of scarce resources (11); and (iii) the design balanced the best-possible predictive performance at an affordable cost (i.e., cost-effectiveness) and an acceptable level of predictive performance (i.e., precision).
The prevalence of schistosomiasis has continued to decline since the start of the NSBD programme in 2012. The morbidity due to SCH is no longer an issue at the population level among the majority of schoolchildren. This, however, may not be the case when monitoring the infection at specific county, sub-county, or ward levels. Using the MBG approach, the SCH treatment requirements can now be confidently refined to target treatment requirements for all the counties, sub-counties, and wards based on their prevalence and predictive probability. Finally, the results showed that a number of counties have a very high predictive probability and a prevalence of between 1% and 10%. As such, the programme should adopt county-level treatment frequencies while focussing on sub-counties and wards with high predictive probabilities of sitting on higher endemicity classes.
The original contributions presented in the study are included in the article/Supplementary Material. Further inquiries can be directed to the corresponding author.
Ethics approval for the study protocol was obtained from the KEMRI Scientific and Ethics Review Unit (SERU Number 2206). Permission to access the schools for the survey was obtained from the national-level Ministry of Education. At the county level, approval was provided by the respective county health and education authorities. At the school level, parental consent from parents/guardians of the children was based on passive, opt-out consent rather than written opt-in consent due to the low-risk nature of the survey procedure. In addition, individual assent was obtained from each child before participation in the study. All the data used were anonymised..
COk, MM, CF, PD, and CM conceptualised and designed the study. COk, MM, COw, PG, CF, PD, and CM directly accessed and verified the underlying data reported in the manuscript. COk, MM, CF, and PD did the statistical analysis and created the figures. COk, MM, CF, and PD wrote the first draft of the manuscript. IO, CW, NO, JH, WO, PG, KM, and AM provided additional critical review, project supervision, and administrative and material support. All authors interpreted the results, critically revised the manuscript for important intellectual content, and gave final approval for the version to be published. All authors had full access to all the data in the study and take responsibility for the decision to submit for publication.
The financial support for this study was provided by The END Fund, GiveWell, and the Epic Foundation via Evidence Action. The funders had no role in the study design, data collection and analysis, decision to publish, or preparation of the manuscript.
We are grateful to the National Ministry of Health and Ministry of Education, Kenya, and the respective County Ministries of Health and Education for their support, facilitation, and guidance during the implementation of this work. We extend an additional thanks to the sub-county health management teams, sub-county education officials, teachers, children, and their parents/guardians for their tireless effort and cooperation throughout the study. We are deeply indebted to all the study team members, field personnel, and the entire staff at the Eastern and Southern Africa Centre of International Parasite Control (ESACIPAC), KEMRI for their efforts and dedication towards the success of this programme.
The authors declare that the research was conducted in the absence of any commercial or financial relationships that could be construed as a potential conflict of interest.
The author(s) PD, CF, and CO declared that they were editorial board members of Frontiers, at the time of submission. This had no impact on the peer review process and the final decision.
All claims expressed in this article are solely those of the authors and do not necessarily represent those of their affiliated organizations, or those of the publisher, the editors and the reviewers. Any product that may be evaluated in this article, or claim that may be made by its manufacturer, is not guaranteed or endorsed by the publisher.
The Supplementary Material for this article can be found online at: https://www.frontiersin.org/articles/10.3389/fitd.2023.1240617/full#supplementary-material
1. Chitsulo L, Engels D, Montresor A, Savioli L. The global status of schistosomiasis and its control. Acta Trop (2000) 77(1):41–51. doi: 10.1016/S0001-706X(00)00122-4
2. Hotez PJ, Bundy DAP, Beegle K, Brooker S, Drake L, de SN, et al. Helminth infections: soil-transmitted helminth infections and schistosomiasis, in: Disease control priorities in developing countries (2006). Available at: https://www.ncbi.nlm.nih.gov/books/NBK11748/ (Accessed 2023 Jun 7).
3. Bundy D, Shaeffer S, Jukes M, Beegle K, Gillespie A, Drake L, et al. School-based health and nutrition programs, in: The international bank for reconstruction and development/the world bank (2006). Available at: https://www.ncbi.nlm.nih.gov/books/NBK11783/ (Accessed 2023 Jun 7).
4. Colley DG, Bustinduy AL, Secor WE, King CH. Human schistosomiasis, in: The lancet (2014). Elsevier. Available at: https://www.sciencedirect.com/science/article/pii/S0140673613619492 (Accessed 2018 May 23).
5. Hamory J, Miguel E, Walker M, Kremer M, Baird S. Twenty-year economic impacts of deworming (2021). Available at: https://pubmed.ncbi.nlm.nih.gov/33790017/ (Accessed 2023 Jun 7).
6. Okoyo C, Campbell SJ, Williams K, Simiyu E, Owaga C, Mwandawiro C. Prevalence, intensity and associated risk factors of soil-transmitted helminth and schistosome infections in Kenya: Impact assessment after five rounds of mass drug administration in Kenya (2020) (Accessed 2021 Oct 4).
7. Mwandawiro CS, Nikolay B, Kihara JH, Ozier O, a MD, Mwanje MT, et al. Monitoring and evaluating the impact of national school-based deworming in Kenya: study design and baseline results. Parasit Vectors (2013) 6(1):198. doi: 10.1186/1756-3305-6-198
8. Montresor A, Mupfasoni D, Mikhailov A, Mwinzi P, Lucianez A, Jamsheed M, et al. The global progress of soil-transmitted helminthiases control in 2020 and world health organization targets for 2030. PloS Negl Trop Dis (2020) 14(8):1–17. doi: 10.1371/journal.pntd.0008505
9. WHO. Helminth control in school-age children. In: A guide for managers of control programmes. Geneva: World Health Organization. World Health Organization (2011). p. 2017 Jul 2790. Available at: http://apps.who.int/iris/bitstream/10665/44671/1/9789241548267_eng.pdf.
10. Diggle PJ, Giorgi E. Model-based Geostatistics for Global Public Health: Methods and Applications. In: Model-based Geostatistics for Global Public Health: Methods and Applications. (New York, USA: Chapman & Hall / CRC). (2019). p. 1–247.
11. Johnson O, Fronterre C, Amoah B, Montresor A, Giorgi E, Midzi N, et al. Model-Based Geostatistical Methods Enable Efficient Design and Analysis of Prevalence Surveys for Soil-Transmitted Helminth Infection and Other Neglected Tropical Diseases (2021). Available at: https://pubmed.ncbi.nlm.nih.gov/33905476/ (Accessed 2023 Feb 21).
12. Amoah B, Fronterre C, Johnson O, Dejene M, Seife F, Negussu N, et al. Model-based geostatistics enables more precise estimates of neglected tropical-disease prevalence in elimination settings: mapping trachoma prevalence in Ethiopia (2022) (Accessed 2023 Mar 8).
13. Fornace KM, Fronterrè C, Fleming FM, Simpson H, Zoure H, Rebollo M, et al. Evaluating survey designs for targeting preventive chemotherapy against Schistosoma haematobium and Schistosoma mansoni across sub-Saharan Africa: a geostatistical analysis and modelling study. Parasit Vectors (2020) 13(1):1–13. doi: 10.1186/s13071-020-04413-7
14. Chipeta M, Terlouw D, Phiri K, Environmetrics PD. Inhibitory geostatistical designs for spatial prediction taking account of uncertain covariance structure (2017) (Accessed 2022 Oct 24).
15. Chaves N, A. Pellegrino J. A simple device for quantitative stool thick smear technique in Schistosomiasis mansoni. Rev Soc Bras Med Trop (1972) 14(6):397–400. Available at: https://pubmed.ncbi.nlm.nih.gov/4675644/.
16. ODK. Open data kit (2009). Available at: https://opendatakit.org/ (Accessed 2018 Feb 18).
17. WorldPop. WorldPop Open spatial demographic data and research (2023). Available at: https://www.worldpop.org/ (Accessed 2023 Jun 7]).
18. WHO. Guide for mapping neglected tropical diseases amenable to preventive chemotherapy in the african region (2014). World Health Organization Regional Office for Africa. Available at: https://www.eliminateschisto.org/sites/gsa/files/content/attachments/2020-02-13/AFRO%20NTD%20Mapping%20Guide%20vFeb2014_Revised%20March%202018.pdf (Accessed 2023 Sep 26).
19. Diggle PJ, Giorgi E. Model-based geostatistics for prevalence mapping in low-resource settings. J Am Stat Assoc (2016) 111(515):1096–120. doi: 10.1080/01621459.2015.1123158
20. Lin L, Chu H. Meta-analysis of proportions using generalized linear mixed models (2020). Available at: https://journals.lww.com/10.1097/EDE.0000000000001232 (Accessed 2023 Feb 21).
21. Okoyo C, Campbell SJ, Owaga C, Onyango N, Medley G, Mwandawiro C. Statistical regression model of water, sanitation, and hygiene; treatment coverage; and environmental influences on school-level soil-transmitted helminths and schistosome prevalence in Kenya: secondary analysis of the national deworming program data. Am J Trop Med Hyg (2021) 104(6):2251. doi: 10.4269/ajtmh.20-1189
22. Kepha S, Ochol D, Wakesho F, Omondi W, Njenga SM, Njaanake K, et al. Precision mapping of schistosomiasis and soil-transmitted helminthiasis among school age children at the coastal region, Kenya. PloS Negl Trop Dis (2023) 17(1):e0011043. doi: 10.1371/journal.pntd.0011043
23. Chipeta M, Terlouw D, Phiri K. Adaptive geostatistical design and analysis for sequential prevalence surveys (2015). Available at: https://arxiv.org/abs/1509.04448 (Accessed 2023 Mar 5).
Keywords: schistosomiasis, Schistosoma mansoni, Schistosoma haematobium, model-based geostatistics, modelling, national school-based deworming, prevalence, Kenya
Citation: Okoyo C, Minnery M, Orowe I, Owaga C, Wambugu C, Olick N, Hagemann J, Omondi WP, Gichuki PM, McCracken K, Montresor A, Fronterre C, Diggle P and Mwandawiro C (2023) Using a model-based geostatistical approach to design and analyse the prevalence of schistosomiasis in Kenya. Front. Trop. Dis 4:1240617. doi: 10.3389/fitd.2023.1240617
Received: 15 June 2023; Accepted: 16 October 2023;
Published: 02 November 2023.
Edited by:
Roch Christian Johnson, CIFRED UAC, BeninReviewed by:
Emmanuel Abraham Mpolya, Nelson Mandela African Institution of Science and Technology, TanzaniaCopyright © 2023 Okoyo, Minnery, Orowe, Owaga, Wambugu, Olick, Hagemann, Omondi, Gichuki, McCracken, Montresor, Fronterre, Diggle and Mwandawiro. This is an open-access article distributed under the terms of the Creative Commons Attribution License (CC BY). The use, distribution or reproduction in other forums is permitted, provided the original author(s) and the copyright owner(s) are credited and that the original publication in this journal is cited, in accordance with accepted academic practice. No use, distribution or reproduction is permitted which does not comply with these terms.
*Correspondence: Collins Okoyo, Y29tb25kaUBrZW1yaS5nby5rZQ==
Disclaimer: All claims expressed in this article are solely those of the authors and do not necessarily represent those of their affiliated organizations, or those of the publisher, the editors and the reviewers. Any product that may be evaluated in this article or claim that may be made by its manufacturer is not guaranteed or endorsed by the publisher.
Research integrity at Frontiers
Learn more about the work of our research integrity team to safeguard the quality of each article we publish.