
94% of researchers rate our articles as excellent or good
Learn more about the work of our research integrity team to safeguard the quality of each article we publish.
Find out more
ORIGINAL RESEARCH article
Front. Trop. Dis. , 25 July 2023
Sec. Major Tropical Diseases
Volume 4 - 2023 | https://doi.org/10.3389/fitd.2023.1204195
This article is part of the Research Topic Challenges For Diagnosis, Treatment And Elimination Of Malaria View all 11 articles
 Gabriel Luíz Costa1†
 Denise Anete Madureira de Alvarenga1†
 Gabriela Maíra Pereira de Assis1
 Anna Caroline Campos Aguiar2Jaime Louzada3
 Dhélio Batista Pereira4
 Anielle de Pina-Costa5,6,7,8
 Zelinda Maria Braga Hirano9,10
 Sílvia Bahadian Moreira11Alcides Pissinatti11,12
 Patrícia Brasil5
 Cláudio Tadeu Daniel-Ribeiro6,7Taís Nóbrega de Sousa1
 Cristiana Ferreira Alves de Brito1*
Background: High-copy genomic sequences could be used as PCR targets for the detection of Plasmodium infections, providing increased sensitivity over single- or low-copy genes. Mitochondrial genomes of malaria parasites are present in multiple copies in a single mitochondrion, and each parasite has many mitochondria. Here, we describe the development of seven species-specific qPCR assays for the diagnosis of Plasmodium vivax and Plasmodium falciparum, targeting coding and non-coding mitochondrial genomic regions.
Methods: The optimization of the qPCR protocols involved a gradient of annealing temperatures and concentrations of primers and probes, as well as the inclusion of PCR additives/enhancers [e.g., dimethyl sulfoxide (DMSO), glycerol, bovine serum albumin (BSA)] to improve the specificity of qPCR amplification.
Results: Non-specific amplification of other Plasmodium species and of human targets was observed in different levels for all assays. Regardless of the late Cq values for most non-specific amplifications, the application of a cutoff value did not completely exclude false-positive amplification, compromising the specificity and also the sensitivity of the assays.
Conclusions: Therefore, although mitochondrial targets have higher sensitivity, they frequently lose specificity due to their high levels of sequence conservation. A screening to evaluate the cross-reaction between Plasmodium species and the non-specific amplification of human malaria-free samples must be performed for Plasmodium mitochondrial assays.
Malaria remains an important public health problem in many tropical and subtropical countries, despite the efforts that are currently being undertaken toward controlling the disease around the world. In 2021, 247 million human malaria cases and 619,000 deaths were reported worldwide (1). A rapid and accurate malaria diagnosis is crucial for the effectiveness of the disease control. Microscopy of Giemsa-stained blood smears is the most widely used approach for malaria diagnosis due to its low cost and relatively simple procedure, despite its poor sensitivity (2). Molecular approaches, such as polymerase chain reaction (PCR), are more specific and sensitive, and have improved the capacity to diagnose submicroscopic infections, defined as a low density of Plasmodium parasites in blood. This is of paramount importance for Plasmodium vivax infections, as this species generally presents with lower levels of parasitemia than P. falciparum due to its preferential invasion of the reticulocyte, rather than the mature red blood cell. Moreover, P. vivax is more difficult to diagnose and control because of its early gametogenesis, which allows transmission even before symptoms appear (3). In the context of malaria elimination, the detection of asymptomatic carriers of the infection is highly relevant, since they present a silent reservoir for ongoing transmission (4).
Nested PCR based on the 18S rRNA gene is largely used for molecular-based malaria diagnosis (5). Quantitative PCR (qPCR) has been increasingly implemented as it provides fast results in high-throughput screening. It is highly sensitive and specific, and allows parasite quantification (6–8). PCR sensitivity is greatly influenced by the copy number of the target molecule; therefore, a target with a low copy number limits the detection capability of these assays, particularly for low parasitemia. The Plasmodium mitochondrial (mt) genome is an ideal target for PCR, because it has higher copy number per parasite (20–150 copies) than single-copy targets or than the 18S rRNA gene (4–8 copies), thus allowing a greater sensitivity (9–14). The genus Plasmodium has one of the smallest mt genomes in the form of a tandemly repeated linear element of 6 kb (15). This genome encodes only three genes: cytochrome c oxidase subunit 1 gene (cox1), cytochrome c oxidase subunit III gene (cox3), and cytochrome b gene (cytb).
Despite the high sensitivity of mtDNA-based assays, in this study we describe the pitfalls related to the development of malaria diagnosis assays by qPCR targeting the mt genome of P. vivax and P. falciparum. Seven species-specific assays were designed to amplify regions of the Plasmodium mt genome (i.e., coding and non-coding) by qPCR. Because all our assays showed some level of non-specificity, we strongly recommend that the mt assays for Plasmodium species diagnosis undergo a screening of different Plasmodium species samples to access this potential issue.
DNA of P. falciparum and P.vivax was obtained from blood samples of patients previously diagnosed as having a single infection by well-trained microscopists, and PCR using ribosomal and non-ribosomal targets (5, 16). One hundred and eleven blood-positive samples were used from patients from different regions of the Brazilian Amazon infected with P. vivax and P. falciparum or stored at the biorepository of Laboratory of Malaria at Instituto René Rachou (Supplementary Table 1). Parasite density was determined as the number of asexual parasites observed per 200 white blood cells on a thick smear and was estimated by assuming a leukocyte count of 8,000 per µL. Parasitemia ranged from 90 to 16,950 parasites/µL for P. falciparum-infected individuals, and from 30 to 17,100 parasites/µL for P. vivax-infected individuals. The inclusion criteria were mild malaria or asymptomatic, more than 5 years old, absence of pregnancy, and a signed informed consent form.
The collection of human samples for DNA extraction was performed in accordance with relevant guidelines and regulations. All participants and/or their legal guardians provided written informed consent. Ethical and methodological aspects of this study were approved by the Ethical Committee of Research on Human Beings from the IRR (N° 2.243.058), in accordance with the Brazilian National Council of Health (Resolutions 196/96 and 466/12). The INI-Fiocruz Ethical Board approved the study concerning the patients from the Atlantic Forest (number 0062.0.009.000-11).
DNA extraction from blood samples was performed using a QIAamp® DNA Blood Mini Kit (Qiagen, Hilden, Germany) or Gentra® Puregene® Blood Kit (QIAGEN, Chatsworth, CA, USA), using 300 µL of blood and a final volume of 50 µL, in accordance with the manufacturer’s instructions. Both blood and extracted DNA material were stored at –20°C.
Seventeen blood samples were included from patients from the Atlantic Forest area diagnosed as being positive for Plasmodium simium by PCR analysis (17, 18). Samples from 26 non-infected individuals (i.e., human negative controls tested with distinct malaria PCR protocols) from a non-transmission malaria area (i.e., Belo Horizonte, Minas Gerais, Brazil) were included as negative controls in the assays.
Thirteen P. simium and 15 P. malariae/P. brasilianum DNA samples obtained from free-living and captive non-human primates (NHPs) from the Brazilian Atlantic Forest were included; these samples were stored at the biorepository of the Laboratory of Malaria (18–20). Samples from 12 NHPs from areas without malaria transmission, negative in distinct PCR protocols (5, 18), were included as negative controls in the assays. All samples were processed to obtain DNA, as mentioned above, and stored at –20°C. NHPs were diagnosed by only PCR (17, 18), as their low parasitemia hampers the diagnosis by light microscopy. The Brazilian government (Ministry of Environment) authorized the capture, handling, and collection and transport of biological samples from NHPs (SISBIO numbers: 43375–4/2015, 54707–137362–2 and 52472–1; and INEA license 012/2016012/2016). This study was approved by the Institutional Ethics Committee of Animal Use (CEUA license L037/2016).
qPCR assays for the diagnosis of P. vivax and P. falciparum, targeting coding and non-coding mt genome regions were designed. Whole-mt sequences of P. falciparum (GenBank accession number: AY282930.1), P. malariae (GenBank accession number: AB354570.1), and P. vivax (GenBank accession number: PvP01, GCA_900,093,555.1) were aligned using ClustalW software in the BioEdit package. For primer design, regions of mt genome that contained polymorphisms between Plasmodium species, preferentially in the 3ʹ ends, were used to ensure assay specificity. The primer design followed the optimal primer recommendations, such as: (i) a primer length around 18–30 bases; (ii) a GC content > 40 (whenever possible, because of the high A/T content of Plasmodium genomes); (iii) a melting temperature between 50°C and 62°C; and (iv) an absence or reduced regions of secondary structure, intra-primer homology (self-dimer), or inter-primer homology (primer dimers). Primers/probes with the highest stringency in the parameters of the Primer Express™ software (Applied Biosystems™) and Oligo (Molecular Biology Insights, Inc) were chosen (Supplementary Figure 1). Probes for the cox1 gene assays contained minor groove binders (MGBs) and for the cytb gene and non-coding regions assays, two different quenchers were used: an internal quencher, ZEN, and a Black Hole Quencher™ at the 5′ end.
For the qPCR assays, the optimum concentrations of the primers and probes were defined using a concentration gradient (0.3–0.9 µM of each primer and 0.15–0.25 µM of each probe) (Supplementary Table 2). A gradient of annealing temperatures (52°C–63°C) was also tested. To improve the specificity of qPCR amplification, PCR additives/enhancers [e.g., dimethyl sulfoxide (DMSO), glycerol, bovine serum albumin (BSA)] were used in different concentrations (21) (Supplementary Table 2). All assays used TaqManTM Universal PCR Master Mix (Applied Biosystems), and the reactions were standardized on 384-well plates using QuantStudio® 12K Flex Real-Time PCR System (Applied Biosystems) for the cox1 gene assays or the ViiA™ 7 Real-Time PCR System (Applied Biosystems) for the cytb and non-coding regions assays. All results were analyzed using QuantStudio Real-Time PCR Software (Applied Biosystems) or QuantStudio 12K Flex Real-Time PCR Software (Applied Biosystems).
Positive and negative (no-DNA) controls were used in each round of amplification. The positive controls in the qPCR assays used DNA from Plasmodium species previously diagnosed by well-trained microscopy and/or by other molecular tests (nested PCR and qPCR) (5, 16): (i) P. falciparum DNA strain 3D7, which was maintained in the Laboratory of Malaria at IRR, (ii) DNA extracted from the blood of patients with high parasitemia for P. vivax, (iii) DNA of P. simium from a NHP (Alouatta guariba clamitans—MB), and (iv) DNA of P. brasilianum from the MR4 Malaria Research and Reference Resource Center [American Type Culture Collection (ATCC), USA].
To prevent cross-contamination, the DNA extraction and reaction mix preparation were performed in “parasite DNA-free rooms” distinct from each other. Each of these separate areas had different sets of pipettes and all procedures were performed using plugged pipette tips. Furthermore, DNA extraction was performed twice on different days, and for each sample with non-specific amplification, two or three independent PCR reactions were performed using the same conditions (i.e., with reagents and thermal cycler).
A cutoff value for each assay was established by the receiver operating characteristic (ROC) curve given by MedCalc for Windows, version 20.123 (MedCalc Software, Ostend, Belgium), which considered the positive Cq values of specific and non-specific amplifications. The Cq values from positive samples were considered “true positives”, whereas for the negative samples (i.e., negative for the species to be tested) were considered “true negatives”. These samples were previously diagnosed by molecular tests with ribosomal (5) and non-ribosomal targets (16). Thus, the combined results of these two molecular tests were used as the reference to estimate the sensitivity and specificity of each mt assay. From each cutoff value, the true- and false-negative/-positive samples were determined using the R package, as well as the sensitivity and specificity values. The optimal value for the cutoff was determined as a specificity of ≥ 90%.
The overlap in the Cq values between specific and non-specific amplifications for each assay was established as the percentage of samples showing similar Cq values of non-specific and specific amplifications, that is, overlap occurred when Cq values between specific and non-specific amplifications superimposed each other and included the same Cq data (Cq min. non-specific < x < Cq max. specific).
Seven TaqMan-based qPCR assays were designed for the detection of P. falciparum and P. vivax. Coding genes and non-coding regions of the Plasmodium mt genome were targeted in the assays: cox1 gene (PV_COX1_1; PV_COX1_2), cytb gene (PV_CYTB, PF_CYTB), and non-coding regions (PF_NC_1; PF_NC_2; PV_NC) (Figure 1 and Supplementary Figure 1).
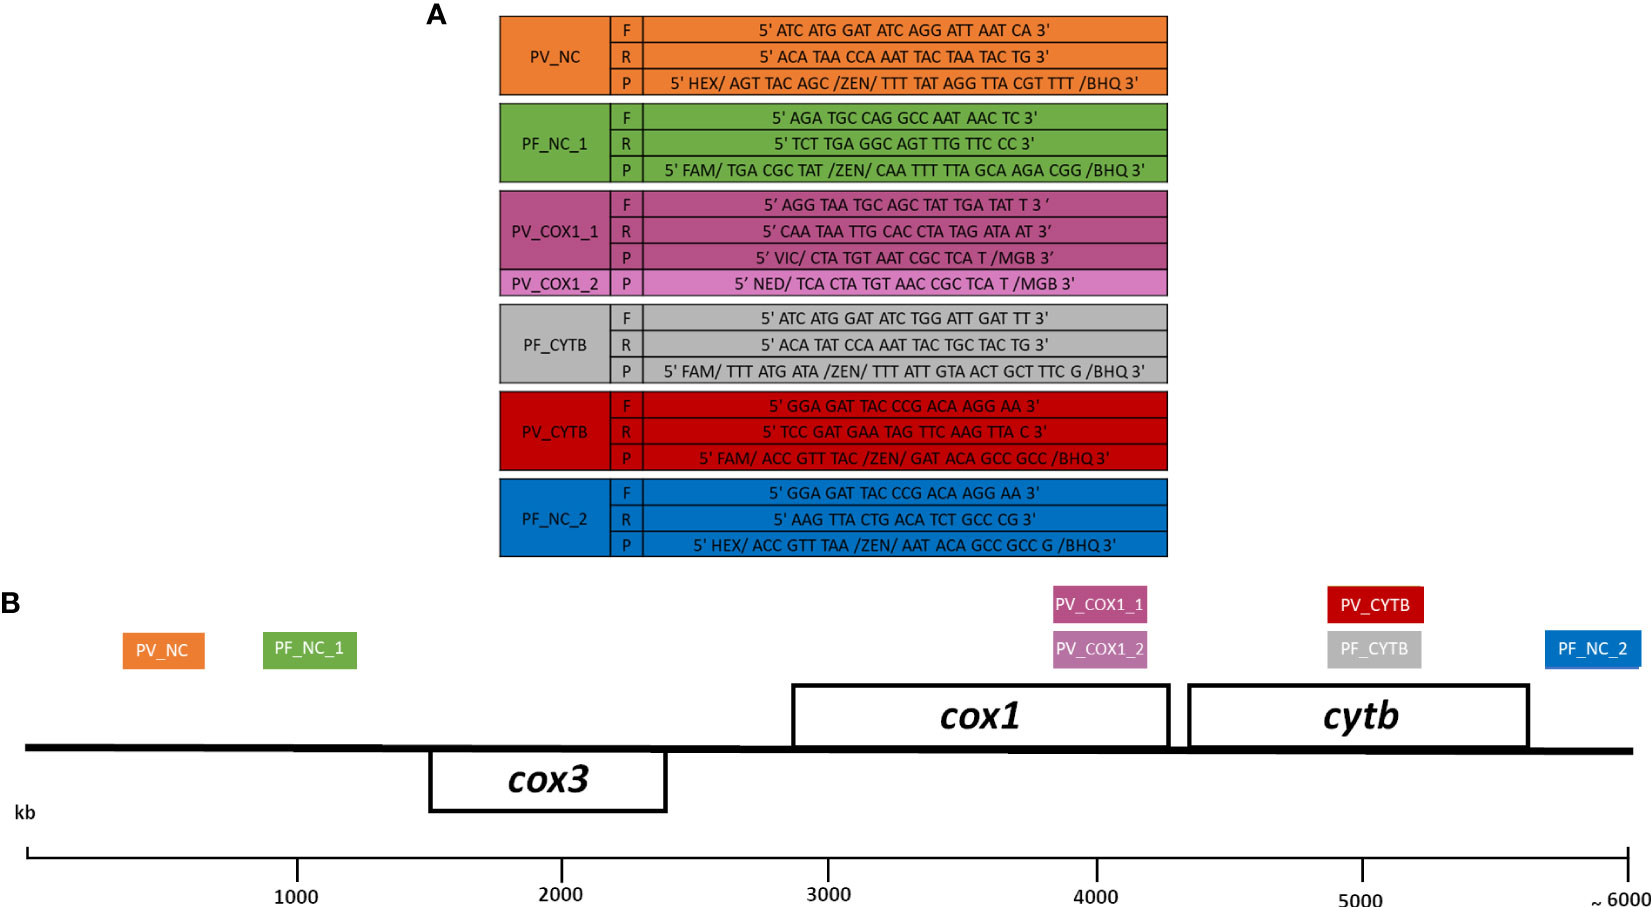
Figure 1 Sequences of primers and probes (A) and schematic representation of amplicons (B) from each assay in the Plasmodium mitochondrial genome. Seven assays were developed targeting the cox1 gene (PV_COX1_1; PV_COX1_2), the cytb gene (PV_CYTB, PF_CYTB), and the non-coding regions (PV_NC, PF_NC_1; PF_NC_2). Each assay is represented by colored boxes, and the positions are based on the P. falciparum mitochondrial genome sequence (accession number NC_037526.1). Primers (F: forward; R: reverse) and probes (P) sequences of each assay are shown in the same color of boxes. PF and PV correspond to P. falciparum and P. vivax, respectively.
Although the mt genome is highly conserved among Plasmodium species, the sequence alignments of the amplicon, primers, and probes of each assay showed the presence of some single-nucleotide polymorphisms (SNPs) used to distinguish the different Plasmodium species (particularly at the 3′ ends of the primers) (Supplementary Figure 1).
A wide screening to verify the cross-reaction between the Plasmodium species or amplification using human malaria-free samples was performed in all Plasmodium mt assays. A panel of 153 Plasmodium samples, which had been diagnosed by well-trained microscopists and/or had been previously assayed with ribosomal and non-ribosomal targets and samples from 26 healthy volunteers, were used. Non-specific amplification was observed in all assays for other Plasmodium species and/or human negative control samples, as described below. The geometric mean of parasitemia was 2,528 parasites/μL (CI95 1,914–3,338) for P. vivax samples and 1,697 parasites/μL (CI95 1,009–2,854) for P. falciparum samples used in the assays.
For the cox1 gene assays (PV_COX1_1; PV_COX1_2), optimization included different primer and probe concentrations and DNA quantities. To improve the specificity of qPCR amplification, PCR enhancers (DMSO, glycerol, BSA) were also evaluated. For both cytochrome oxidase 1 assays, no non-specific amplifications with human malaria-free samples (0/15) were observed. The Plasmodium vivax PV_COX1_1 assay was tested with 40 P. vivax samples, all of them amplified (Cq mean = 29.0; range = 20.6–38.2) and did not cross-react with any of 30 P. simium samples. However, non-specific amplification was identified in five out of nine (55.5%) reactions using well-characterized P. falciparum samples (with known parasitemia and confirmed by other PCR protocols to exclude co-infection) amplified with a Cq mean value of 39.2 (range = 36.6–40.8) (Supplementary Table 2). To reduce non-specific amplification, the probe PV_COX1_2 was redesigned by including nucleotides spanning a more polymorphic region. Using the new probe, 49/50 (98%) P. vivax samples were amplified correctly and did not cross-react with any of the 20 P. simium samples or with the 15 P. malariae/P. brasilianum samples. Nevertheless, 8 out of 38 (21.0%) reactions showed non-specific amplification using P. falciparum samples, even using the enhancer DMSO (Supplementary Table 2). The Cq mean values were 42.3 (range = 35.3–44.6) and 32.4 (range = 24.2–42.0), for non-specific and specific amplifications, respectively (Supplementary Table 2).
The assay targeting the non-coding region, PV_NC, was tested with 19 P. vivax samples, all of them amplified (Cq mean = 23.0; range = 18.0–32.4). Non-specific amplification was identified in 8 out of 29 (27.6%) reactions using well-characterized P. falciparum samples (Cq mean = 37.4; range = 35.2–39.9) and in 1 out of 56 (1.8%) reactions using human uninfected controls (Cq = 39.3) (Supplementary Table 1).
For the PV_CYTB assay, which uses the cytb gene as target, 22 out of 23 (95.6%) P. vivax samples were amplified correctly (Cq mean = 30.6; range = 27.0–37.4). However, non-specific amplification was identified in three out of six (50%) reactions using P. falciparum, P. simium, or P. brasilianum (Cq mean = 34.8; range = 32.7–38.8) and in 8 out of 68 (11.8%) reactions using human uninfected controls (Cq mean = 34.5; range = 30.7–38.6) (Supplementary Table 2).
In the assay targeting the P. falciparum cytb gene (PF_CYTB), 33 out of 48 (68.7%) reactions using P. falciparum samples (Cq mean = 23.8; range = 14.7–33.3) were amplified correctly. However, non-specific amplification was identified in five out of six (83.3%) reactions using P. vivax, P. simium, or P. malariae/ P. brasilianum (Cq mean = 38.3; range = 38.0–38.4) and in 29 out of 104 (27.9%) reactions using human uninfected control (Cq mean = 37.2; range = 36.1–39.8) (Supplementary Table 2). To reduce non-specific amplification, different DMSO concentrations were used: 1%–5% without significant improvement for specificity (data not shown).
For the PF_NC_1 assay, based on different regions of the non-coding mt genome, 12 out of 13 (92.3%) reactions using P. falciparum samples were amplified correctly (Cq mean = 24.9; range = 19.3–29.7), while 7 out of 18 (38.9%) and 18 out of 42 (42.9%) reactions showed non-specific amplification for P. vivax (Cq mean = 35.0; range = 29.2–37.4) and human uninfected control samples (Cq mean = 35.3; range = 34.6–38.7), respectively (Supplementary Table 2). For the PF_NC_2 assay, also based on the non-coding region, 10 out of 14 (71.4%) reactions using P. falciparum samples were amplified correctly (Cq mean = 20.9; range = 12.7–34.6), whereas two out of nine (22.2%) P. vivax reactions (Cq mean = 34.7; range = 33.4–36.0) and 9 out of 43 (20.9%) reactions using human uninfected control (Cq mean = 36.3; range = 33.0–39.7) showed non-specific amplification (Supplementary Table 2).
A cutoff value for each assay was stablished by the ROC curve considering the positive Cq values of specific and non-specific amplifications. From each cutoff value, the true and false negative/positive samples were determined, as well as the sensitivity and specificity values (Figure 2). The Figure 2A shows the accuracy for each assay. Comparing all assays, PV_CYTB presents the best accuracy for P. vivax detection, with 95% of the sensitivity and 96% of the specificity. The PF_CYTB assay was the only P. falciparum assay with a specificity of > 90%. For these two assays with best results for each Plasmodium species, the cutoff was not able to totally discriminate the Cq values for specific and non-specific amplifications (Figure 2B).
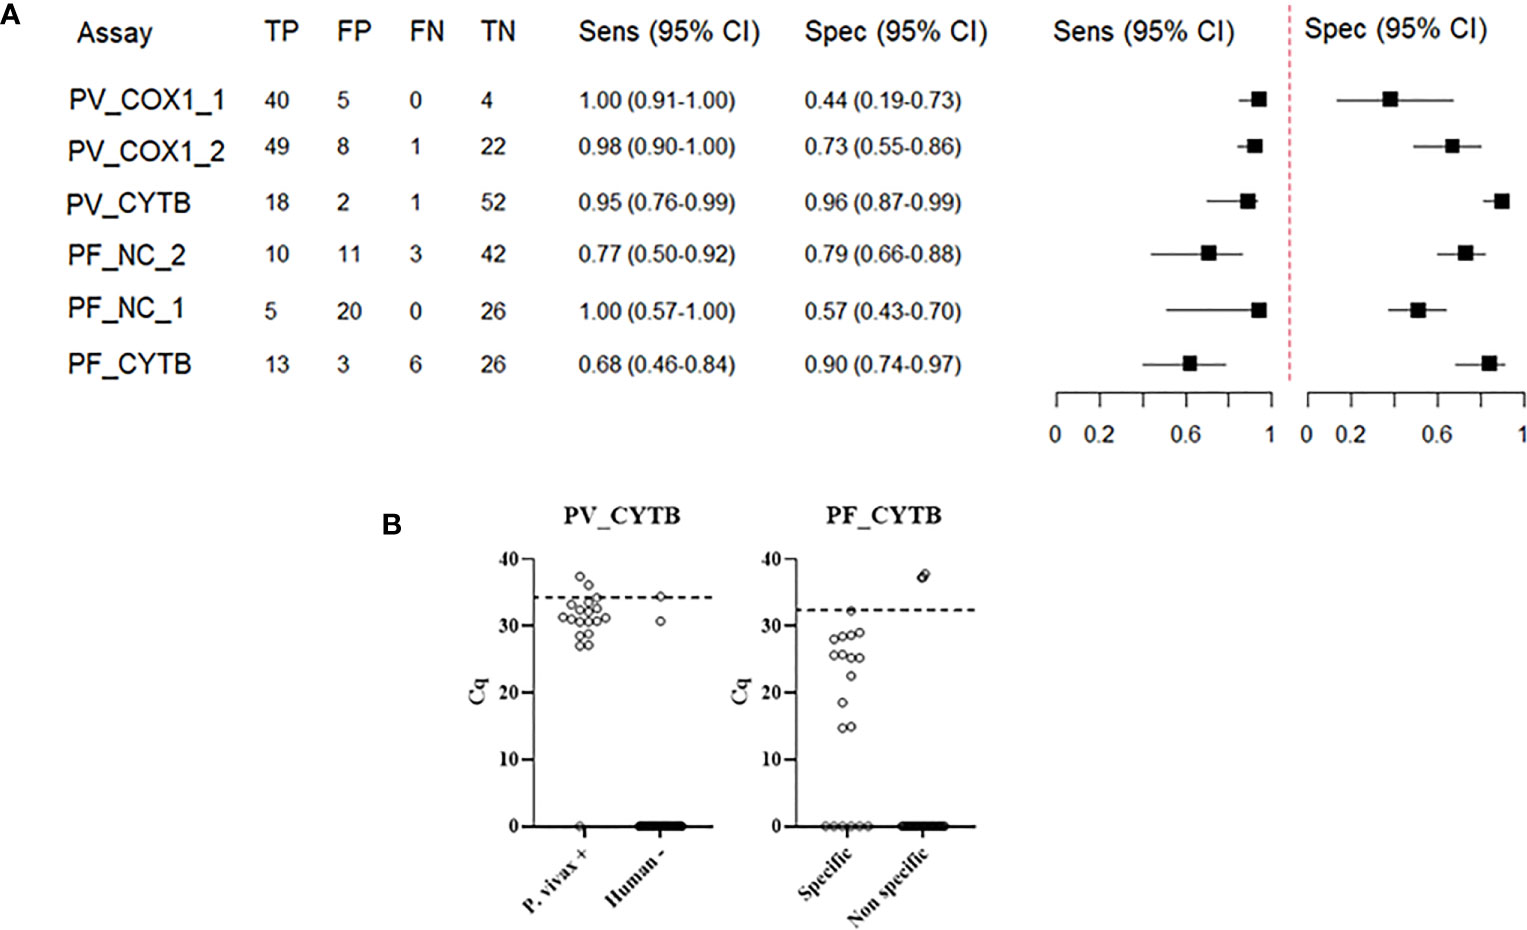
Figure 2 Determination of accuracy of each assay. (A) Sensitivity (Sens) and specificity (Spec) estimate for each assay. PV_NC assay was not represented here because of the low number of samples analyzed. TP = true positive; FP = false positive; FN = false negative; TN = true negative (B) Distribution of Cq values for specific and non-specific amplifications of different samples and the cutoff value for PV_CYTB and PF_CYTB assays, with a specificity of > 90%. To estimate the sensitivity and specificity of each assay, we defined the combined results of two other molecular tests targeting ribosomal and non-ribosomal genes as a reference (4).
Initially, to minimize the non-specific amplification, a set of parameters was modified, such as the concentration of primers/probes in each assay, the denaturing and annealing conditions, and the number of cycles. The primer concentrations varied from 0.3–0.9 µM and from 0.15–0.25 µM for probes. The annealing temperature tested varied from 52°C–63°C. An incremental annealing temperature in progressive cycles was also tested (Supplementary Table 2). These modifications decreased the number of non-specific amplifications in some cases, but did not eliminate all of them. However, the Cq values for the specific amplifications increased, showing that changes in annealing temperature and primer/probe concentrations interfered with assay sensitivity (Supplementary Table 2). A variety of PCR additives/enhancers (DMSO, glycerol and BSA) has also been used to increase the specificity, yield, or consistency of reactions (Supplementary Table 2). The reduction of non-specific amplification was notable in most of the samples; however, the use of these additives hampered the efficacy of specific amplifications. For the PV_COX1_2 assay, 5% of DMSO, glycerol, or BSA was individually tested, and only DMSO was able to reduce non-specific amplifications. Nevertheless, the use of additives also had an impact on the specific amplifications, increasing the Cq values (Supplementary Table 3). Different concentrations of DMSO and DNA were also tested. The best combination to avoid non-specific amplification without interference with specific amplification was using 3.5% DMSO and 2 μL of DNA (Supplementary Table 3). Then, a large panel (n = 30) of well-characterized P. falciparum samples were screened using this combination of DMSO, and eight samples were amplified, with a mean Cq of 42.3 (range = 35.3–44.6) (Supplementary Table 2). None of the adopted strategies eliminated the non-specific amplification. For the PF_CYTB, all concentrations of DMSO tested (1–5%) were not able to eliminate the non-specific amplification (using 52 samples, including P. vivax and human uninfected control, data not shown). In a single experiment with 1% DMSO, 3 out of 29 human uninfected control samples were non-specifically amplified for P. falciparum, with a Cq mean of 37.4 (range = 37.2–37.8), whereas 13 out of 19 P. falciparum samples were amplified specifically (Cq mean = 24.5, range = 14.7–32.3). Once again, the use of DMSO hampered the efficiency of specific amplifications, and it explains the decreased sensibility of PF_CYTB assay, which amplified only 68% of specific samples (Supplementary Table 2).
In the past decade, improved nucleic acid amplification techniques have established increasingly high standards in diagnosis sensitivity using multi-copy target genes. Mitochondrial (mt) genomic sequences can provide alternative PCR targets for the detection of malaria infections, offering increased sensitivity over single- or low-copy targets such as the 18S rRNA genes (4). We evaluated the specificity of seven different assays targeting the mt genome of P. vivax and P. falciparum. To test assays’ specificities, a screening with Plasmodium samples, which were well characterized with known parasitemia and confirmed by molecular protocols with ribosomal (5) and non-ribosomal targets (16) to exclude co-infection, was performed. Here, the exclusion of co-infections was essential to truly access the specificity of the assays.
After an exhaustive evaluation with different qPCR assays targeting polymorphic sequences in coding and non-coding regions of mt genomes to distinguish Plasmodium species, the non-specific amplification of other Plasmodium species or human DNA was observed for almost all assays. Different studies have demonstrated the use of the Plasmodium mt genome as a useful target for malaria genus-specific diagnoses using conventional PCR (8), nested PCR (15), and qPCR (22). However, only a few studies have demonstrated a species-specific malaria diagnosis, based on loop-mediated isothermal amplification (LAMP) (23), PCR (24), and qPCR (4, 25, 26). It is not clear in some published reports whether cross-reactivity between Plasmodium species or with human malaria-free samples was evaluated. Even though most studies have screened a large number of samples, they lack information about assay specificity, such as cross-reactivity tests and melting curve analyses for qPCR tests using DNA intercalating dye (4, 25–28).
Determining which Cq cutoff value discriminates between positive and negative amplifications should be based on the PCR efficiency of the assay. According to MIQE guidelines (The Minimum Information for Publication of Quantitative Real-Time PCR Experiments, a guideline that describes the minimum information necessary for evaluating qPCR experiments) (29), Cq values of >40 are uncertain because of the implied low efficiency and generally should not be reported; however, the use of arbitrary Cq cutoff values is not ideal, because they may be either too low (eliminating valid results) or too high (increasing false-positive results). In this study, to differentiate between specific and non-specific amplifications based on Cq values, a cutoff value was defined for each assay by applying the ROC curve analysis. The optimal value for the cutoff was determined as a specificity of ≥ 90%. Although the cutoff value determination was not able to completely exclude false-positive results for most assays, it was possible to select a cutoff value with a good specificity value for two of them (the PV_CYTB and PF_CYTB assays). Cytochrome b has been used for many authors as a target for genus Plasmodium or species-specific diagnoses, based on DNA intercalating dye or using probes (9, 30–32). Haanshuus et al. (22), comparing different quantitative PCR methods, showed similar sensitivity: the lowest was for a 18S rRNA protocol and the highest was for their cytb SYBR assay (22). The dilemma of cutoff value determination consists in a trade-off between sensitivity and specificity. The correct identification of Plasmodium species is of paramount importance and is one of the major challenges in malaria diagnosis. Misdiagnosis of the Plasmodium species, particularly in areas with transmission of more than one Plasmodium species, such the Amazon region, may have a significant negative impact on the effectiveness of treatment and prognosis of the disease. On the other hand, a good sensitivity is also relevant to diagnose low parasitemia, preventing individuals from remaining untreated and at risk of greater disease severity. Moreover, in the context of malaria elimination, detection of asymptomatic carriers able to maintain the transmission is crucial (4).
To improve the sensitivity and specificity of the assays, a set of parameters was modified, such as time and temperature of the denaturing and annealing, the number of cycles, and the concentration of primers and probes in each assay. These modifications decreased the number of non-specific amplifications but did not eliminate all of them. A variety of PCR additives and enhancers was used to increase the specificity of PCR reactions such as DMSO, glycerol, and BSA. DMSO has been proven to considerably enhance both the specificity and the efficiency of DNA polymerization (21). Several polyhydroxyl alcohols are also potent PCR enhancers, such as glycerol, which improves PCR specificity (21). The addition of bovine serum albumin (BSA) to PCR reactions is often beneficial for its ability to scavenge and neutralize several contaminants that inhibit Taq, including hemin and iron chloride (21). They interfere with hydrogen bonding, thus facilitating strand separation, lowering DNA melting temperature (TM), and consequently improving the specificity of primer binding (21). The beneficial effects of additives are often template and primer specific and must be determined empirically. Herein, the PCR additives tested reduced but did not eliminate non-specific amplifications; besides, the use of these additives hampered the efficiency of specific amplifications.
We observed that P. vivax assays had the best sensitivity and specificity values when compared with P. falciparum assays. P. falciparum parasites have about 20 mt genomes per ring stage; however, with sequestered late stages, the gain in sensitivity from using a mt marker rather than nuclear markers is potentially limited in P. falciparum assays (9). On the other hand, P. vivax parasites have late stages present in peripheral blood with multiple replicating mt genomes; then, a substantial template multiplication factor can be expected. Thus, the gain in sensitivity from targeting the mt genome might be greater for P. vivax than for P. falciparum (4). This is of great importance for P. vivax infections, as this species generally presents lower levels of parasitemia due to its preferential invasion of the reticulocyte (33). Alternatively, other multi-copy genes could be used, particularly for P. falciparum, such as the varATS or pfr364 genes (14, 34, 35). This study has some limitations, particularly that a standardized mt target was not included for comparison with our new studied targets and the same samples panel was not tested in all assays.
The Plasmodium mt genome is an attractive target for PCR-based detection of malaria parasites. However, as P. vivax and P. falciparum have at least 90% of conservation mtDNA, the design of species-specific primers and probes is a challenge (36). The high degree of conservation of the Plasmodium mt genome may be due to structural constraints on the genome. Thus, a rigorous testing including the screening of a panel of well-characterized samples should be performed to verify the existence of non-specific amplifications in Plasmodium mt assays.
The original contributions presented in the study are included in the article/Supplementary Material. Further inquiries can be directed to the corresponding author.
The studies involving human participants were reviewed and approved by the Ethical Committee of Research on Human Beings from the IRR (number 2.243.058) and INI-Fiocruz Ethical Board for patients from Atlantic Forest (number 0062.0.009.000–11). The patients/participants provided their written informed consent to participate in this study. The animal study was reviewed and approved by the Brazilian government (Ministry of Environment), which authorized the capture, handling, and collection and transport of biological samples from NHPs (SISBIO numbers. 43375-4/2015, 54707-137362-2 and 52472-1, and INEA license 012/2016012/2016). This study was approved by the Institutional Ethics Committee of Animal Use (CEUA license L037/2016).
CB, TS, DA, and GC conceived the idea and participated in the study design; DA, AA, JL, DP, AP-C, ZH, PB, CD-R, SM, and AP were responsible for sample collection. GC, DA, and GA extracted human and NHP DNA and performed the previous molecular diagnosis; GC and DA performed qPCR assays and data analysis; and CB, TS, DA, and GC wrote the manuscript. All authors contributed to the article and approved the submitted version.
The study was supported by the Conselho Nacional de Desenvolvimento Científico e Tecnológico (CNPq) (Grant nos. 457274/2014-0, 310477/2017-4), the Secretaria de Vigilância em Saúde (SVS) of the Ministry of Health (Grant nos. IOC-017-FIO-17 and IOC-028-FIO-18, the Fundação de Amparo à Pesquisa do Estado de Minas Gerais (FAPEMIG) (Grant no. CBB-APQ-02620-15, and Fiocruz Inova Grant for generation of Knowledgment (VPPPCB-007-FIO-18-2-11130) the Coordenação de Aperfeiçoamento de Pessoal de Nível Superior - Brasil (CAPES; Finance code 001). Scholarships from CNPq (CB, TS, GC) and SVS/MS (DA) are also acknowledged. CD-R also receives a fellowship from the FAPERJ, as a “Cientista do Nosso Estado”. The funders had no role in study design, data collection and analysis, decision to publish, or preparation of the manuscript.
The authors thank the PDTIS sequencing facilities of Fiocruz for use of the Real-Time PCR Facility (RPT09D) at René Rachou Institute, the team of the Primate Center of Rio de Janeiro (CPRJ/INEA), and Secretaria de Vigilância em Saúde (SVS) of the Ministry of Health.
The authors declare that the research was conducted in the absence of any commercial or financial relationships that could be construed as a potential conflict of interest. The author CD-R declared that they were an editorial board member of Frontiers at the time of submission. This had no impact on the peer review process and the final decision.
All claims expressed in this article are solely those of the authors and do not necessarily represent those of their affiliated organizations, or those of the publisher, the editors and the reviewers. Any product that may be evaluated in this article, or claim that may be made by its manufacturer, is not guaranteed or endorsed by the publisher.
The Supplementary Material for this article can be found online at: https://www.frontiersin.org/articles/10.3389/fitd.2023.1204195/full#supplementary-material
1. World Health Organization. World malaria report 2022 . Available at: https://www.who.int/teams/global-malaria-programme/reports/world-malaria-report-20227.
2. Cheng Q, Cunningham J, Gatton ML. Systematic review of Sub-microscopic p. vivax infections: prevalence and determining factors. PloS Negl Trop Dis (2015) 9(1):e3413. doi: 10.1371/journal.pntd.0003413
3. Boyd MF, Kitchen S. On the infectiousness of patients infected with Plasmodium vivax and Plasmodium falciparum. Am J Trop Med Hyg (1937) 1(2):253–62. doi: 10.4269/ajtmh.1937.s1-17.253
4. Gruenberg M, Moniz CA, Hofmann NE, Wampfler R, Koepfli C, Mueller I, et al. Plasmodium vivax molecular diagnostics in community surveys: pitfalls and solutions. Malar J (2018) 19:319. doi: 10.1186/s12936-020-03374-7
5. Snounou G, Viriyakosol S, Zhu XP, Jarra W, Pinheiro L, do Rosario VE, et al. High sensitivity of detection of human malaria parasites by the use of nested polymerase chain reaction. Mol Biochem Parasitol (1993) 61(2):315–20. doi: 10.1016/0166-6851(93)90077-B
6. Divis PCS, Shokoples SE, Singh B, Yanow SK. A TaqMan real-time PCR assay for the detection and quantitation of Plasmodium knowlesi. Malar J (2010) 9(1):344. doi: 10.1186/1475-2875-9-344
7. Kamau E, Alemayehu S, Feghali KC, Saunders D, Ockenhouse CF. Multiplex qPCR for detection and absolute quantification of malaria. PloS One (2013) 8(8):e71539. doi: 10.1371/journal.pone.0071539
8. Alemayehu S, Feghali KC, Cowden J, Komisar J, Ockenhouse CF, Kamau E. Comparative evaluation of published real-time PCR assays for the detection of malaria following MIQE guidelines. Malar J (2013) 12(1):277. doi: 10.1186/1475-2875-12-277
9. Preiser PR, Wilson RJ, Moore PW, McCready S, Hajibagheri MA, Blight KJ, et al. Recombination associated with replication of malarial mitochondrial DNA. EMBO J (1996) 15:684–93. doi: 10.1002/j.1460-2075.1996.tb00401.x
10. Berry A, Fabre R, Benoit-Vical F, Cassaing S, Magnaval JF. Contribution of PCR-based methods to diagnosis and management of imported malaria. Med Trop (2005) 65:176–83.
11. Berry A, Benoit-Vical F, Fabre R, Cassaing S, Magnaval JF. PCR-based methods to the diagnosis of imported malaria. Parasite (2008) 15:484–8. doi: 10.1051/parasite/2008153484
12. Imwong M, Nguyen TN, Tripura R, Peto TJ, Lee SJ, Lwin KM, et al. The epidemiology of subclinical malaria infections in south-East Asia: findings from cross-sectional surveys in Thailand-Myanmar border areas, Cambodia, and Vietnam. Malar J (2015) 14:381. doi: 10.1186/s12936-015-0906-x
13. Hofmann N, Mwingira F, Shekalaghe S, Robinson LJ, Mueller I, Felger I. Ultra-sensitive detection of Plasmodium falciparum by amplification of multi-copy subtelomeric targets. PloS Med (2015) 12:e1001788. doi: 10.1371/journal.pmed.1001788
14. Hofmann NE, Gruenberg M, Nate E, Ura A, Rodriguez-Rodriguez D, Salib M, et al. Assessment of ultra-sensitive malaria diagnosis versus standard molecular diagnostics for malaria elimination: an in-depth molecular community cross-sectional study. Lancet Infect Dis (2018) 18:1108–16. doi: 10.1016/S1473-3099(18)30411-0
15. Hikosaka K, Watanabe Y-I, Kobayashi F, Waki S, Kita K, Tanabe K. Highly conserved gene arrangement of the mitochondrial genomes of 23 Plasmodium species. Parasitol Int (2011) 60(2):175–80. doi: 10.1016/j.parint.2011.02.001
16. Amaral LC, Robortella DR, Guimarães LFF, Limongi JE, Fontes CJF, Pereira DB, et al. Ribosomal and non-ribosomal PCR targets for the detection of low-density and mixed malaria infections. Malar J (2019) 18:154. doi: 10.1186/s12936-019-2781-3
17. Brasil P, Zalis MG, de Pina-Costa A, Siqueira AM, Júnior CB, Silva S, et al. Outbreak of human malaria caused by Plasmodium simium in the Atlantic forest in Rio de Janeiro: a molecular epidemiological investigation. Lancet Glob Heal (2017) 5(10):e1038–46. doi: 10.1016/S2214-109X(17)30333-9
18. De Alvarenga DAM, Culleton R, De Pina-Costa A, Rodrigues DF, Bianco C, Silva S, et al. An assay for the identification of Plasmodium simium infection for diagnosis of zoonotic malaria in the Brazilian Atlantic forest. Sci Rep (2018) 8(1):86. doi: 10.1038/s41598-017-18216-x
19. Alvarenga DAM, Pina-Costa A, Bianco C, Moreira SB, Brasil P, Pissinatti A, et al. New potential plasmodium brasilianum hosts: tamarin and marmoset monkeys (family callitrichidae). Malar J (2017) 16(1):71. doi: 10.1186/s12936-017-1724-0
20. De Alvarenga DAM, De Pina-Costa A, De Sousa TN, Pissinatti A, Zalis MG, Suaréz-Mutis MC, et al. Simian malaria in the Brazilian Atlantic Forest: first description of natural infection of capuchin monkeys (Cebinae subfamily) by Plasmodium simium. Malar J (2015) 14:81. doi: 10.1186/s12936-015-0606-6
21. Simonovic A, Trifunović-Momčilov M, Raspor M, Cingel A, Bogdanović M, Dragićević M, et al. Dimethyl sulfoxide improves sensitivity and specificity of RT-PCR and QRT-PCR amplification of low-expressed transgenes. Arch Biol Sci (2012) 64:865–76. doi: 10.2298/ABS1203865S
22. Haanshuus CG, Mørch K, Blomberg B, Strøm GEA, Langeland N, Hanevik K, et al. Assessment of malaria real-time PCR methods and application with focus on low-level parasitaemia. PloS One (2019) 14(7):e0218982. doi: 10.1371/journal.pone.0218982
23. Britton S, Cheng Q, McCarthy JS. Novel molecular diagnostic tools for malaria elimination: a review of options from the point of view of high-throughput and applicability in resource limited settings. Malar J (2016) 15:88. doi: 10.1186/s12936-016-1158-0
24. Cunha MG, Medina TS, Oliveira SG, Marinho AN, Póvoa MM, Ribeiro-dos-Santos AKC. Development of a polymerase chain reaction (PCR) method based on amplification of mitochondrial DNA to detect Plasmodium falciparum and Plasmodium vivax. Acta Trop (2009) 111(1):35–8. doi: 10.1016/j.actatropica.2009.02.003
25. Dos Santos EH, Yamamoto L, Domingues W, di Santi SM, Kanunfre KA, Okay TS. A new real time PCR with species-specific primers from Plasmodium malariae/P. brasilianum mitochondrial cytochrome b gene. Parasitol Int (2020) 76:102069. doi: 10.1016/j.parint.2020.102069
26. Gruenberg M, Moniz CA, Hofmann NE, Koepfli C, Robinson LJ, Nate E, et al. Utility of ultra-sensitive qPCR to detect Plasmodium falciparum and Plasmodium vivax infections under different transmission intensities. Malar J (2020) 19(1):319. doi: 10.1186/s12936-020-03374-7
27. Souza CRT, Carvalho TAA, Amaral RCG, Cunha LS, Cunha MG, Guerreiro JF. Prevalence of Plasmodium falciparum and P. vivax in an area of transmission located in pará state, Brazil, determined by amplification of mtDNA using a real-time PCR assay. Genet Mol Res (2012) 11(3):3409–13. doi: 10.4238/2012.September.25.9
28. Cécile F, Odile C, Françoise B, Christian B, Françoise F, Jean-Marc C, et al. Cytochrome b gene quantitative PCR for diagnosing Plasmodium falciparum infection in travelers. J Clin Microbiol (2011) 49(6):2191–5. doi: 10.1128/JCM.02156-10
29. Bustin SA, Benes V, Garson JA, Hellemans J, Huggett J, Kubista M, et al. The MIQE guidelines: minimum information for publication of quantitative real-time PCR experiments. Clin Chem (2009) 55(4):611–22. doi: 10.1373/clinchem.2008.112797
30. Krungkrai J. The multiple roles of the mitochondrion of the malarial parasite. Parasitology (2004) 129(Pt5):511–24. doi: 10.1017/S0031182004005888
31. Singh B, Bobogare A, Cox-Singh J, Snounou G, Abdullah MS, Rahman HA. A genus- and species-specific nested polymerase chain reaction malaria detection assay for epidemiologic studies. Am J Trop Med hygiene. (1999) 60(4):687–92. doi: 10.4269/ajtmh.1999.60.687
32. Haanshuus CG, Mohn SC, Morch K, Langeland N, Blomberg B, Hanevik K. A novel, single-amplification PCR targeting mitochondrial genome highly sensitive and specific in diagnosing malaria among returned travellers in Bergen, Norway. Malaria J (2013) 12:26. doi: 10.1186/1475-2875-12-26
33. Moreno-Pérez DA, Ruíz JA, Patarroyo MA. Reticulocytes: Plasmodium vivax target cells. Biol Cell (2013) 105(6):251–60. doi: 10.1111/boc.201200093
34. Demas A, Oberstaller J, DeBarry J, Lucchi NW, Srinivasamoorthy G, Sumari D, et al. Applied genomics: data mining reveals species-specific malaria diagnostic targets more sensitive than 18S rRNA. J Clin Microbiol (2011) 49(7):2411–8. doi: 10.1128/JCM.02603-10
35. Bouzayene A, Zaffaroullah R, Bailly J, Ciceron L, Sarrasin V, Cojean S, et al. Evaluation of two commercial kits and two laboratory-developed qPCR assays compared to LAMP for molecular diagnosis of malaria. Malar J (2022) 21:204. doi: 10.1186/s12936-022-04219-1
Keywords: malaria, Plasmodium, diagnosis, quantitative PCR, mitochondrial DNA
Citation: Costa GL, Alvarenga DAMd, Assis GMPd, Aguiar ACC, Louzada J, Pereira DB, Pina-Costa Ad, Hirano ZMB, Moreira SB, Pissinatti A, Brasil P, Daniel-Ribeiro CT, Sousa TNd and Alves de Brito CF (2023) Malaria mitochondrial diagnosis: challenges and pitfalls. Front. Trop. Dis 4:1204195. doi: 10.3389/fitd.2023.1204195
Received: 11 April 2023; Accepted: 26 June 2023;
Published: 25 July 2023.
Edited by:
Giselle Maria Rachid Viana, Evandro Chagas Institute, BrazilReviewed by:
Gisely Melo, Fundação de Medicina Tropical Doutor Heitor Vieira Dourado (FMT-HVD), BrazilCopyright © 2023 Costa, Alvarenga, Assis, Aguiar, Louzada, Pereira, Pina-Costa, Hirano, Moreira, Pissinatti, Brasil, Daniel-Ribeiro, Sousa and Alves de Brito. This is an open-access article distributed under the terms of the Creative Commons Attribution License (CC BY). The use, distribution or reproduction in other forums is permitted, provided the original author(s) and the copyright owner(s) are credited and that the original publication in this journal is cited, in accordance with accepted academic practice. No use, distribution or reproduction is permitted which does not comply with these terms.
*Correspondence: Cristiana Ferreira Alves de Brito, Y3Jpc3RpYW5hLmJyaXRvQGZpb2NydXouYnI=
†These authors have contributed equally to this work and share first authorship
Disclaimer: All claims expressed in this article are solely those of the authors and do not necessarily represent those of their affiliated organizations, or those of the publisher, the editors and the reviewers. Any product that may be evaluated in this article or claim that may be made by its manufacturer is not guaranteed or endorsed by the publisher.
Research integrity at Frontiers
Learn more about the work of our research integrity team to safeguard the quality of each article we publish.