 Charleine Kameni1†
 Cybelle Fodieu Mezajou1†
 Natacha Njike Ngongang1†
 Jubilate Afuoti Ngum1
 Ulrich Stephane Fotso Simo1
 Fabrice Junior Tatang1
 Sarah Ngate Nguengo1
 Annick Prisca Chakam Nouthio1
 Michelle Alma Wandji Pajiep1
 Michelle Hako Toumeni1
 Epiphanie Sorelle Takou Madjoumo1
 Maxwell Fofou Tchinda1
 Roland Jethro Ekwala Misse Ngangue1
 Francioli Koro Koro1Abel Wade2
 Mazarin Akami1
 Annie Rosalie Ngane Ngono1
 Ousman Tamgue1*
- 1Department of Biochemistry, Faculty of Science, University of Douala, Douala, Cameroon
- 2National Veterinary Laboratory, Douala, Cameroon
Gaps in early and accurate diagnosis, effective drug control, and treatment monitoring are hindering the global eradication effort of tuberculosis. This infectious disease has become the deadliest worldwide before the outbreak of Covid-19. The search for new molecular biomarkers of tuberculosis will help to reverse this trend. Long non-coding RNAs (lncRNAs) have emerged as important regulators of the host immune response to infection, hence their link with the etiology and diagnosis of tuberculosis has attracted some attention from the research community. However, very little is known about their potential for the monitoring of tuberculosis treatment. This study aimed at assessing the potential of two lncRNAs: p50-associated Cyclooxygenase-2 Extragenic RNA (PACER) and Long Non-coding RNA 13 (LNC13) in the monitoring of tuberculosis treatment. This was a cross-sectional study carried out in Douala, Cameroon from December 2020 to August 2021. A quantitative real-time polymerase chain reaction followed by Cq analysis using the Livak method were performed to measure the relative expression levels of PACER and LNC13 in whole blood of healthy controls, patients with active pulmonary tuberculosis at the initiation of treatment, after two, five, and six months into treatment. Receiver Operating Characteristic curves analysis was used to assess the ability of targeted lncRNAs to discriminate among those groups. The study showed that the lncRNAs PACER and LNC13 were significantly upregulated in patients with active pulmonary tuberculosis at the initiation of treatment than in healthy controls. The expression levels of the two lncRNAs were significantly downregulated in patients during the treatment as compared to the active pulmonary tuberculosis patients. However, the expression levels of the lncRNAs PACER and LNC13 in whole blood of patients after six months of treatment were similar to those in healthy controls. Similarly, lncRNAs PACER and LNC13 showed very good performance in distinguishing between active tuberculosis patients and healthy controls as well as in differentiating between newly diagnosed active tuberculosis patients and those under treatment. Interestingly, those lncRNAs could not discriminate healthy controls from patients after six months of treatment. The lncRNAs PACER and LNC13 are therefore potential biomarkers for the monitoring of tuberculosis treatment.
Introduction
Tuberculosis (TB) is an infectious disease caused by bacteria of the Mycobacterium tuberculosis complex (MTBC) (1, 2). Despite the development of modern antibiotics and vaccination, TB remains a public health burden. It is the deadliest infectious disease worldwide (3). In 2020, 1.5 million people died from TB globally (4). More than 500,000 Africans die from this disease every year (5). In 2020, 9,900 Cameroonians died because of TB (6). This global mortality rate is similar to the 1.4 million in 2015 (7). So, instead of the targeted 35% reduction in deaths due to tuberculosis in 2020 (8), we had a rise; proving that the END TB Strategy is delayed. This plan is mainly jeopardized by the emergence of multi-drug resistant (MDR) and extensively drug-resistant (XDR) Mycobacterium tuberculosis strains (9).
This emergence is due to mismanagement of TB treatment and person-to-person transmission (10). This horizontal transmission can be interrupted by accurate diagnosis and effective treatment (11). Concerning the management of TB treatment, it is assessed through sputum smear microscopy. This laboratory test is limited by its poor sensitivity (12). To obtain positive results, at least 5000 bacilli per mL of sputum are required (13). Due to the length of treatment that leads to failure in following the treatment plan on the path of the patients and further favors drug resistance and reoccurrence of TB, there is a need for better monitoring of TB treatment. Meanwhile, several studies have shown the involvement of non-coding RNAs in numerous biological processes and diseases.
Non-coding RNAs (ncRNAs) like microRNAs (miRNAs) and long non-coding RNAs (lncRNAs) are products of DNA transcription that are not translated into known proteins (14–16). In the case of inflammatory diseases in general and tuberculosis in particular, a variety of research has been carried out, and ncRNAs expression patterns have shown to vary and influence innate and adaptive immunity (17). Kumar et al. (18), Liu et al. (19), and Sinigaglia et al. (20) have presented many ncRNAs associated with the pathogenesis of tuberculosis. Some ncRNAs including miR-26a-5p (21), miR-29a-3p (22–25), and miR-423-5p (26) were found to be used as biomarkers for the diagnosis of tuberculosis. Tamgue et al. (27) reported some lncRNAs like NEAT 1 as therapeutic targets of tuberculosis. A few studies have investigated the involvement of ncRNAs in the monitoring of TB treatment. Hence, the current work aimed at exploring the potential of two lncRNAs, PACER and LNC13 in monitoring tuberculosis treatment.
P50-associated cyclooxygenase-2 extragenic RNA (PACER) is an antisense lncRNA located upstream of the promoter region of cyclooxygenase-2 (COX-2) which positively regulates the expression (28). Its gene is located on chromosome 1q31.1 (29). Changes in the expression profile of lncRNA PACER have been linked to the inflammatory response in the case of osteoarthritis (30). In addition, the lncRNA PACER promotes macrophage polarization into the pro-inflammatory M1 phenotype (31–34). It is well known that M1 macrophages are key elements in the host immune response against Mycobacterium tuberculosis (32, 35).
With regard to long Non-coding RNA 13 (LNC13), it is a 2.8 kb transcript whose gene is located on chromosome 2q12.1 (36). Variation in the expression levels of LNC13 has been associated with many diseases such as celiac disease (37), type 1 diabetes (38), and inflammatory bowel disease (39). It was reported that tissue- or disease-specific single nucleotide polymorphism (SNP) alters the expression of this lncRNA (38). Also, the expression of several inflammatory genes has been associated with the dysregulation of LNC13 (37). By acting as a link between hnRNPD, HDAC1, and chromatin, LNC 13 can carry out these regulatory functions (37).
Tuberculosis is a disease that is associated with inflammation as it progresses. Since PACER and LNC13 influence inflammatory genes and other yet-to-be-discovered targets expression, there is a reason to believe that these lncRNAs could be used as biomarkers for monitoring tuberculosis treatment.
Materials and methods
Study design
This was a cross-sectional study. Patients were recruited at the center of respiratory diseases at LAQUINTINIE hospital. Molecular analyses were done at the National Veterinary Laboratory of Douala. The study covered the period from December 2020 to August 2021.
The healthy control group (HC) included 19 non-smoker subjects with no history of TB who underwent a routine physical examination at LAQUINTINIE hospital, Douala, during the study period. They did not have contact with tuberculosis patients within the last two months and had negative results for Human Immunodeficiency Virus (HIV), and TB LAMP tests. The healthy controls did not have a chronic disease and were not receiving immunosuppressive therapy.
The active tuberculosis group (TBT0) comprised 21 HIV-negative patients with no history of tuberculosis, presenting sputum smear positive, chest X-rays consistent with proven pulmonary TB. They did not have a chronic disease and, not receive immunosuppressive therapy. The active tuberculosis participants were not yet on TB therapy and the bacteria was drug-susceptible (assessed by a GeneXpert test). The flow chart in Figure 1 summarizes the steps of the screening process.
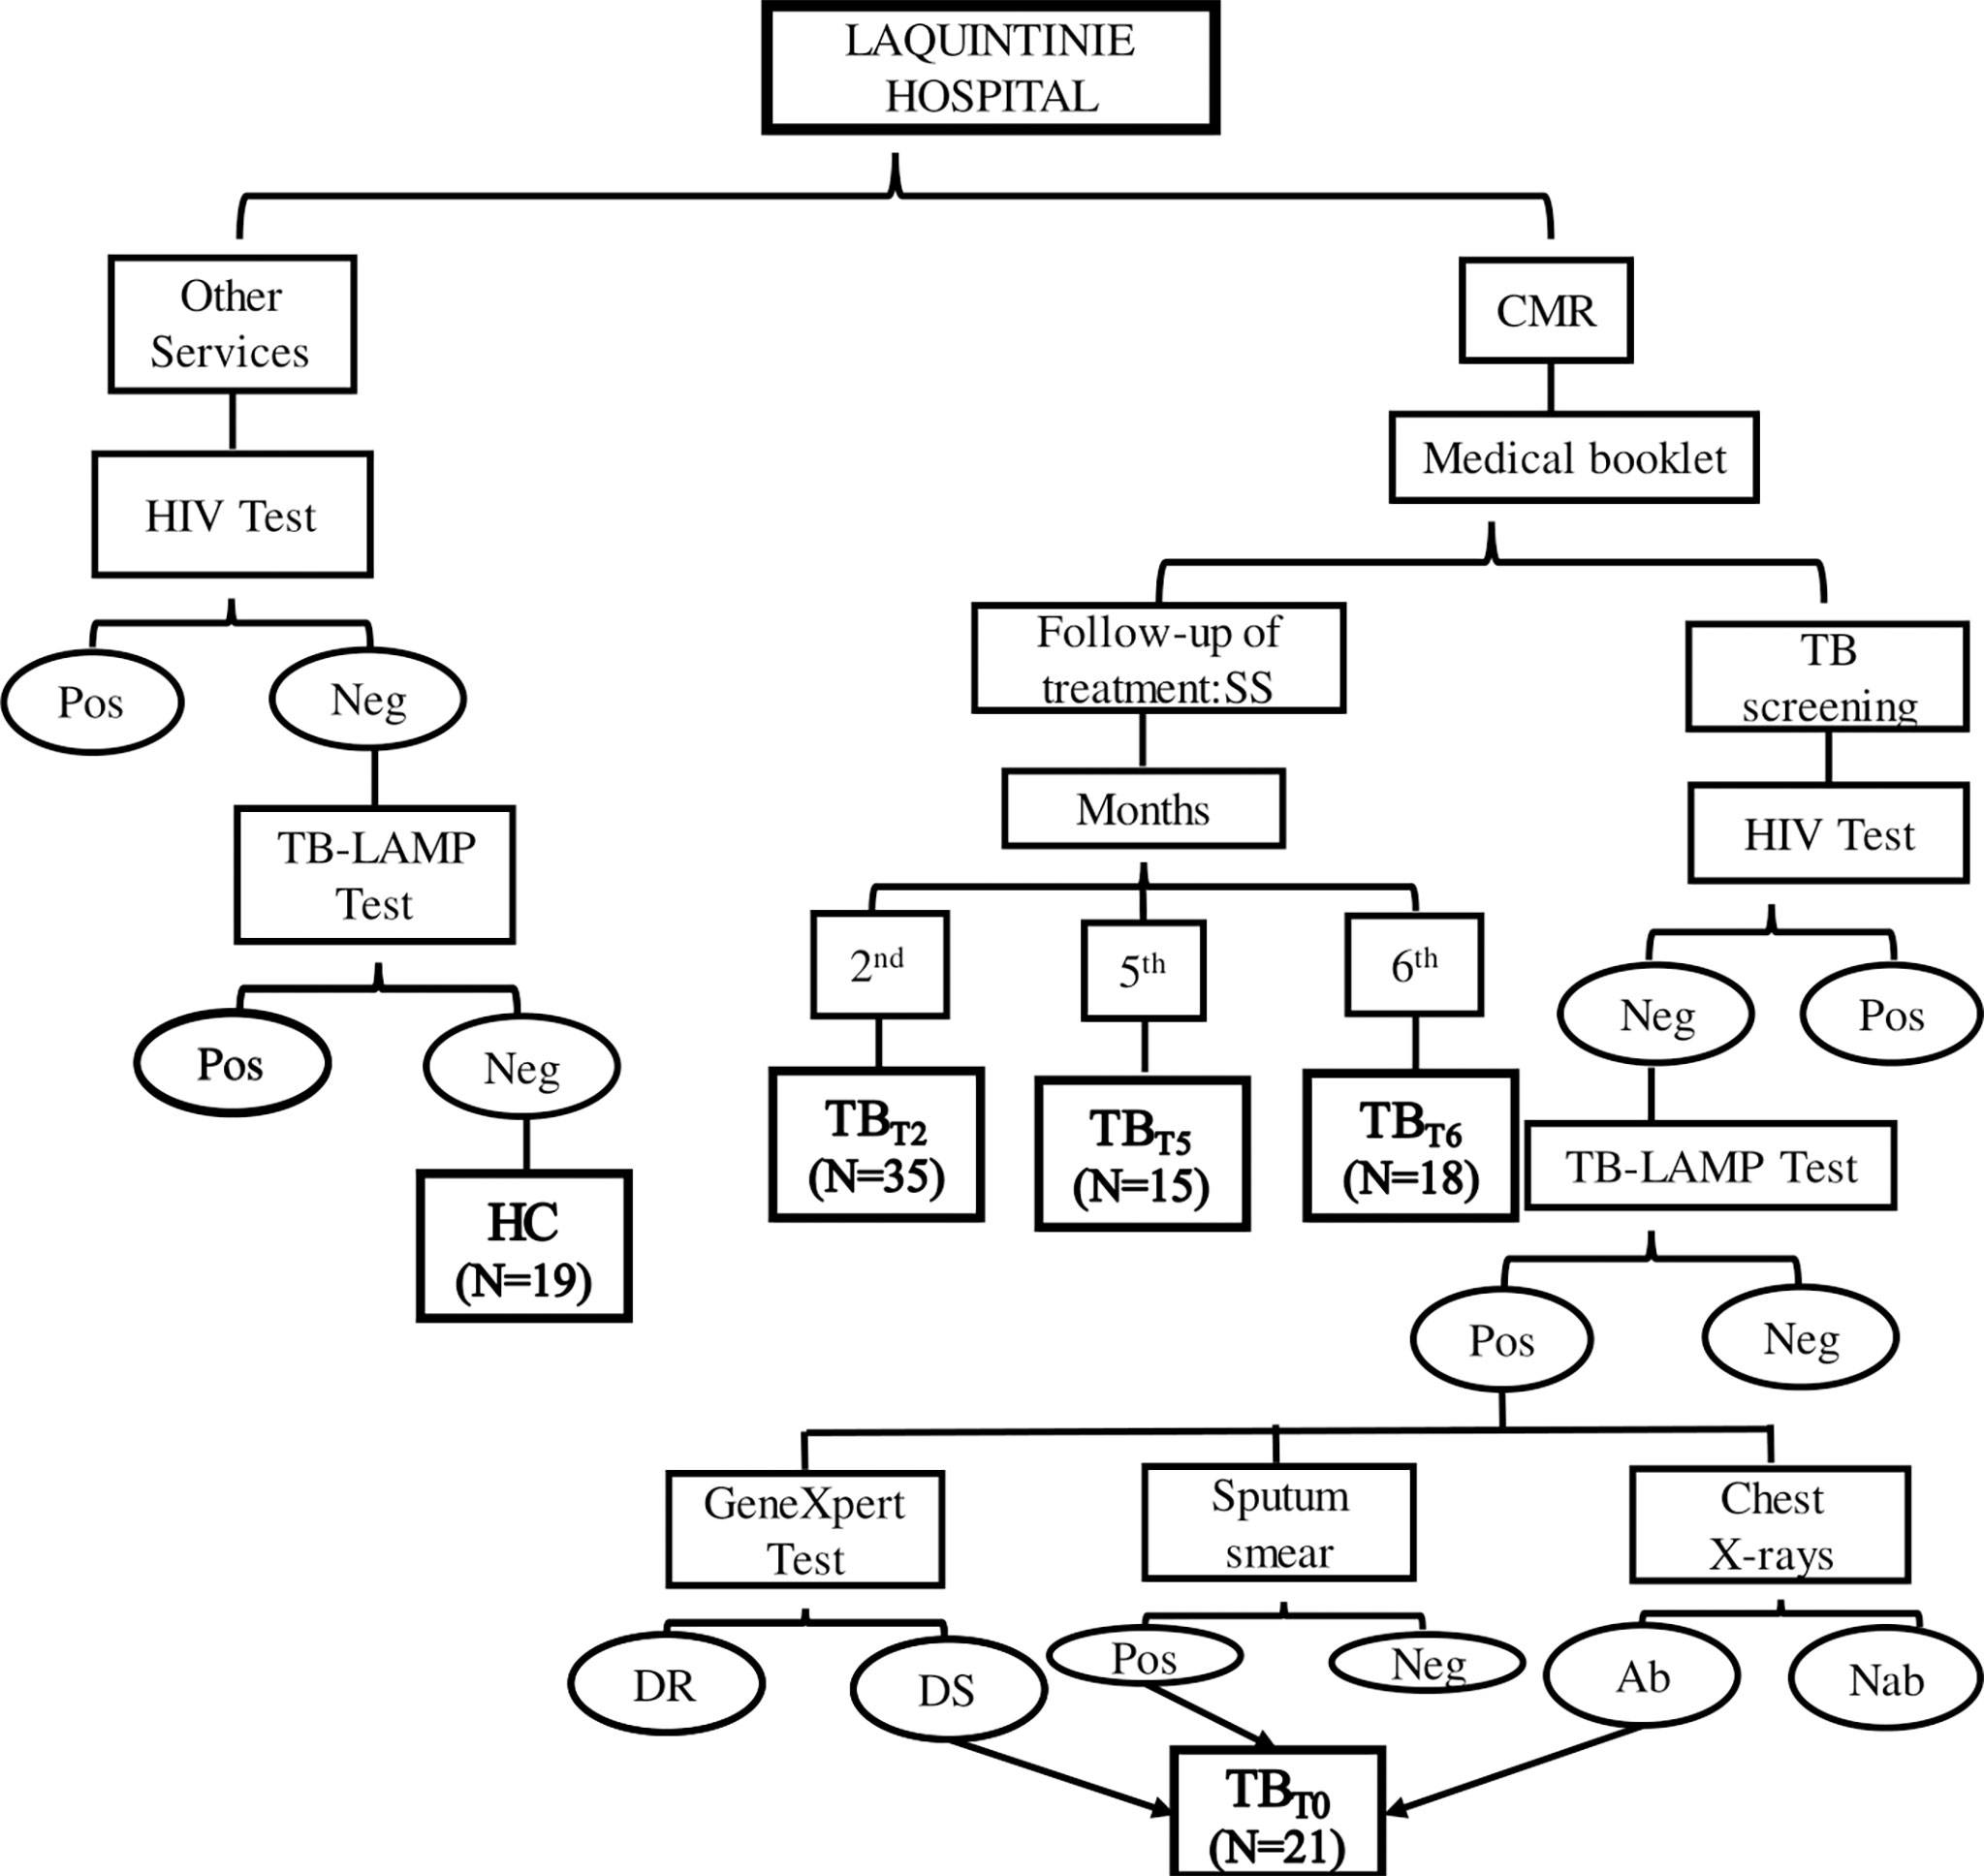
Figure 1 Study flow chart. This figure summarizes the enrolment steps of study participants at LAQUINTINIE hospital. Patients present at the center of respiratory diseases for a follow-up treatment Sputum Smear Microscopy (SS) test were included in the study according to their duration under treatment as TBT2 after two, TBT5 after five, and TBT6 after six months of TB treatment. When they showed up for TB screening test and showed negative (Neg) HIV test, positive (Pos) TB-LAMP test and Sputum Smear Microscopy, abnormal chest X-rays, and drug-susceptible bacteria, they were enrolled as newly diagnosed active tuberculosis patients (TBT0). Meanwhile, HIV and TB-LAMP negative participants recruited from the other hospital services (including healthy volunteers accompanying their relatives), constituted the Healthy Control group (HC). DR, Drug-Resistant; DS, Drug-Susceptible; Ab, Abnormalities; Nab, No abnormalities.
TB patients are put on standard anti-TB treatment immediately after confirmation of TB according to the treatment guidelines of the Cameroon National Tuberculosis Control Program. This therapy algorithm consisted of 2 months of daily rifampicin (R), isoniazid (H), pyrazinamide (Z), and ethambutol (E) (intensive phase), followed by 4 months of daily RH (2RHZE/4RH) (40). During the period of treatment, patients’ sputum is checked three times for the presence of bacilli, at the end of the intensive phase (2nd or 3rd month), after 5 and 6 months of treatment (40). Blood samples were collected from 35 tuberculosis patients after two (TBT2), 15 after five (TBT5), and 18 after six months (TBT6) into anti-TB drug treatment.
The Institutional Ethics Committee for Research on Human Health of the University of Douala (N°2433CEI/Udo/09/2020/M) approved this study. Confidentiality was ensured by the use of a unique Patient Identification Number (PIN). All participants or the participants’ legal guardian/next of kin provided their written informed consent and filled out a questionnaire before blood collection and processing.
Blood collection and processing
Venous blood was collected into five milliliters Ethylene Diamine Tetraacetic Acid (EDTA) -tubes. Blood tubes were then centrifuged at 3000 rpm for 10 minutes. The supernatant (plasma) was separated. 500 µL of the cellular fraction was aliquoted into a 1.5 mL labeled tube and 500 µL of Qiazol reagent (Qiagen, Germany) was added. The mixture was homogenized and stored at -20°C till total RNA extraction.
RNA extraction
Total RNA was isolated from the stored cellular lysate (500 µL cellular fraction + 500 µL Qiazol) using miRNeasy Mini Kit (Qiagen, Germany) according to the manufacturer’s instructions (41).
cDNA synthesis
Total RNA was reverse transcribed into cDNA using Transcriptor First Strand cDNA Synthesis Kit (Roche, Germany) according to the manufacturer’s instructions (42).
Quantitative real-time PCR
Quantitative real-time PCR (qPCR) was performed using LightCycler® 480 SYBR Green I Master (Roche, Germany) and gene-specific primers (IDT, CA, United States). Relative lncRNAs levels were calculated by the 2−ΔΔCq method (43) with glyceraldehyde-3-phosphate dehydrogenase (GAPDH) as the reference gene. The qPCR reaction conditions were as follows: one cycle of pre-denaturation at 95°C for 10 minutes, 50 cycles at 95°C for 10 seconds, 55°C for 15 seconds, 72°C for 10 seconds, and the data acquisition step. Melting curve analysis was performed at the end to confirm specific amplification. Agarose gel electrophoresis was also done to check the size of the specific amplicons. The sequences of qPCR primers sets used were as follows: hs-lncRNA-PACER: forward 5′-TGTAAATAGTTAATGTGAGCTCCACG-3′, reverse 5′- GCAAATTCTGGC CATCGC-3′; hs-linc13: forward 5′-AAGGATCATTGCAGGGTCTC-3′, reverse 5′-GTGGCCAAAAGAAGTCTGAGTC-3′; hs-GAPDH: forward 5′-GAAATCCCATCACCATCTTCCAGG-3′, reverse 5′-GAGCCCCAGCCTTCTCCATG -3′.
Statistical analysis
SPSS 20.0 software (Statsoft Inc, Carey, J, USA) and easyRoc (ver. 1.3.1) were used for statistical analyses. Data were represented as Mean ± Standard deviation. Means comparison was performed through the t-test. A p-value of <0.05 was considered to be statistically significant for a 95% confidence interval. Curves and graphs were drawn under Microsoft Excel 2013.
Receiver operating characteristics curves
To categorize these groups with the targeted lncRNA, ROC curves analysis was realized. The Area Under the ROC Curve (AUC) is a measure of the ability of a factor to distinguish two groups (44). AUC values range from 50% to 100%, with 50% being a bad classifier and 100% an excellent classifier (45). Values between 90-100% are generally considered excellent, 80-90% good, 70-80% fair, 60-70% poor, and 50-60% bad (or failed) (22). An AUC of less than 50% indicates that the random values do not distinguish the two groups (46).
Results
Sociodemographic and clinical characteristics of the study population
A total of 108 participants were enrolled during the period of the study. 63% (n=68) were male and 37% (n=40) were female. Twenty participants (19%) were aged between 18 to 24 years, 33 (31%) between 25 to 34 years, 17 (16%) between 35 to 44 years, 33 (31%) between 45 to 64 years, and 5 (5%) have at least 65 years. Table 1 shows details of the sociodemographic and clinical characteristics of the study population.
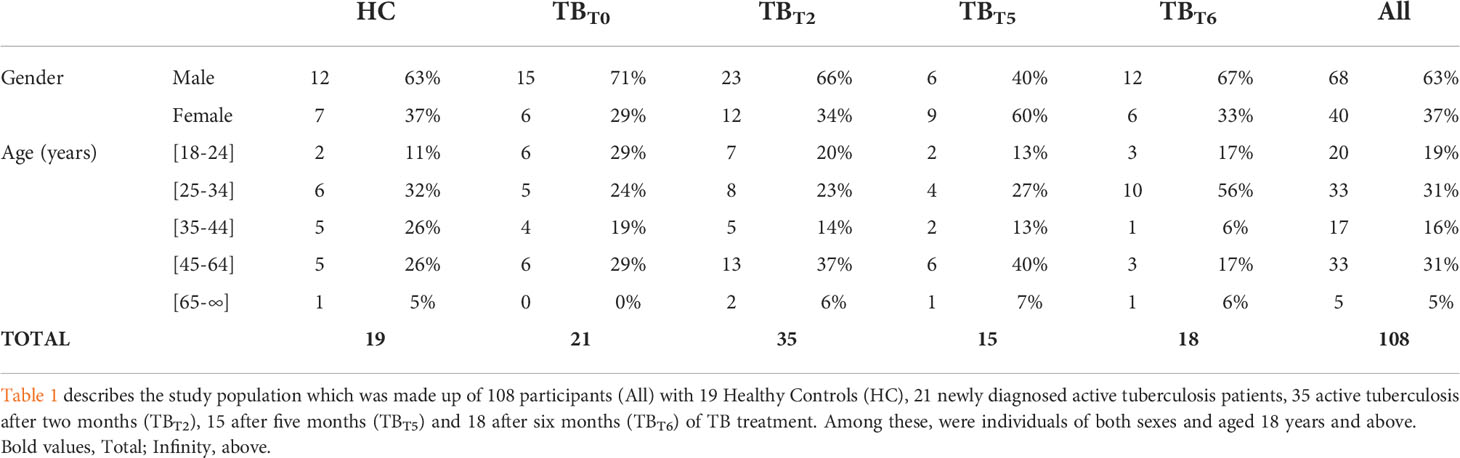
Table 1 Sociodemographic and clinical characteristics of the study population.
LncRNA PACER and LNC13 levels are increased in the whole blood of active tuberculosis patients and diminished to normal levels during anti-tuberculosis treatment
The lncRNA PACER and LNC13 of 21 newly diagnosed active tuberculosis patients (TBT0), 35 tuberculosis patients after two (TBT2), 15 after five months (TBT5), 18 after six months (TBT6), and 19 healthy controls (HC) were detected by RT-qPCR. Their relative expression was estimated by Cq analysis using the Livak method. The means of the relative expression of PACER and LNC13 in those groups were compared using t-test, as such: HC vs TBT0, TBT0 vs TBT2, TBT0 vs TBT5, TBT0 vs TBT6, and HC vs TBT6.
PACER showed a relative expression level of 3.04 ± 1.28, whereas it was 1.93 ± 0.36 times the normal for LNC13 among patients with active tuberculosis. As indicated in Figure 2, the expression of these two lncRNAs in patients with active TB was significantly higher (P < 0.05) than in healthy controls. So, PACER and LNC13 are more expressed by active tuberculosis patients than by healthy individuals.
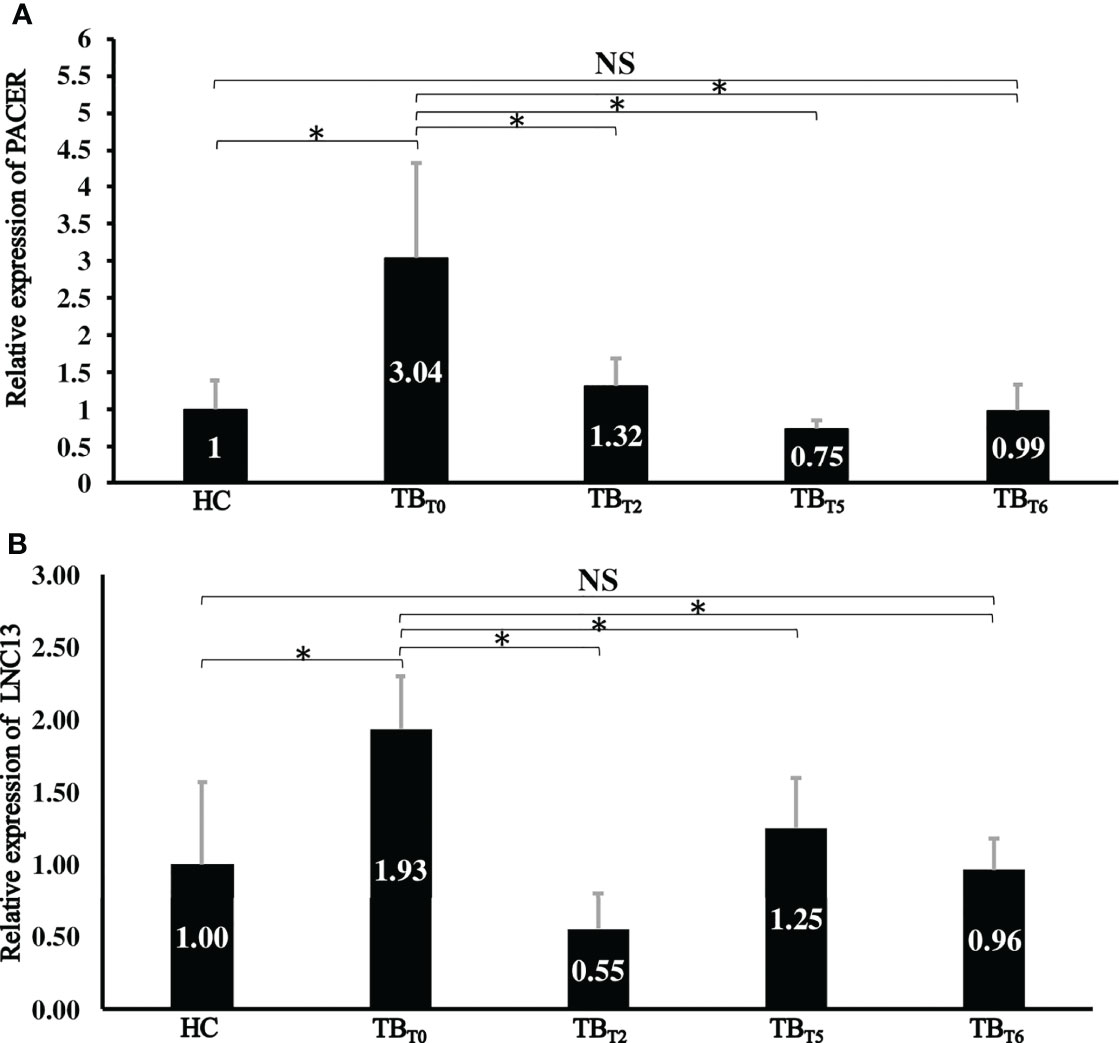
Figure 2 Relative expression of lncRNA PACER and LNC13 in whole blood samples from different groups. Total RNA was extracted. The lncRNA PACER (A) and LNC13 (B) expression levels were assessed by RT-qPCR. The 2−ΔΔCq method was used to calculate lncRNAs’ relative expression of the healthy controls (HC), newly diagnosed active tuberculosis patients (TBT0), tuberculosis patients after two (TBT2), five (TBT5), and six (TBT6) months after treatment. *: P < 0.05; NS: P ≥ 0.05. LncRNA PACER and LNC13 are upregulated in the whole blood of patients with active pulmonary tuberculosis at the initiation of treatment and decreased during the treatment to reach the level of healthy controls after six months of treatment.
However, at the 2nd, 5th, and 6th months of treatment, relative expression levels of PACER were respective 1.32 ± 0.37, 0.75 ± 0.11, and 0.99 ± 0.35. While 0.55 ± 0.25, 1.25 ± 0.35 and 0.96 ± 0.22 for LNC13. Thus, their expression decreased with the progression of the treatment duration (Figure 2). Patients receiving treatment had significantly lowered expression of lncRNA PACER and LNC13, two, five, and six months into treatment compared with the newly diagnosed active tuberculosis patients (P < 0.05). To sum up, PACER and LNC13 are less expressed by tuberculosis patients into treatment than by newly diagnosed active tuberculosis patients.
Meaningfully, the levels of PACER and LNC13 in the whole blood of tuberculosis patients after six months of treatment were respectively 0.99 ± 0.35 and 0.96 ± 0.22 times the normal. As displayed in Figure 2, this expression is similar to that of healthy controls (P ≥ 0.05). Hence, anti-tuberculosis drugs regulate PACER and LNC13 expression after six months.
LncRNA PACER and LNC13 levels distinguish active pulmonary tuberculosis patients from healthy controls
Receiver Operating Characteristics (ROC) (Figure 3) were set up to evaluate the diagnostic values of the differentially expressed lncRNA PACER and LNC13 among active pulmonary tuberculosis patients and healthy controls. The area under the curve (AUC) of lncRNA PACER was 100% and 91.8% for LNC13. This means that PACER and LNC 13 are excellent classifiers for newly diagnosed active TB patients and healthy individuals.

Figure 3 LncRNA PACER and LNC13 levels distinguish newly diagnosed active tuberculosis patients from healthy controls. Total RNA was extracted from the whole blood samples. The lncRNA PACER and LNC13 levels were measured by RT-qPCR. The 2-ΔΔCq method was used to calculate the lncRNAs’ relative expression. These data were uploaded to the software easyROC to create ROC curves and calculate the area under the curve (AUC) values for the lncRNA PACER (A) and LNC13 (B). PACER (AUC=100%) and LNC 13 (AUC=91.8%) are excellent in distinguishing newly diagnosed active TB patients from healthy individuals.
LncRNA PACER and LNC13 levels differentiate newly diagnosed active tuberculosis patients from those under treatment
To check the potential of PACER and LNC13 to discriminate between newly diagnosed active tuberculosis patients and those under treatment, ROC curves were built. Between untreated active tuberculosis patients and patients after two months into treatment, the lncRNA PACER displayed an AUC of 97.9%; and 100% after five and six months (Figure 4). While it was 100% after two months into treatment, 92.8% after five, and 100% after six months for LNC 13 (Figure 5). This indicated that lncRNA PACER and LNC13 are excellent differentiators of active tuberculosis patients from those under treatment. These data, therefore, show that PACER and LNC13 can be used in the monitoring of TB treatment.
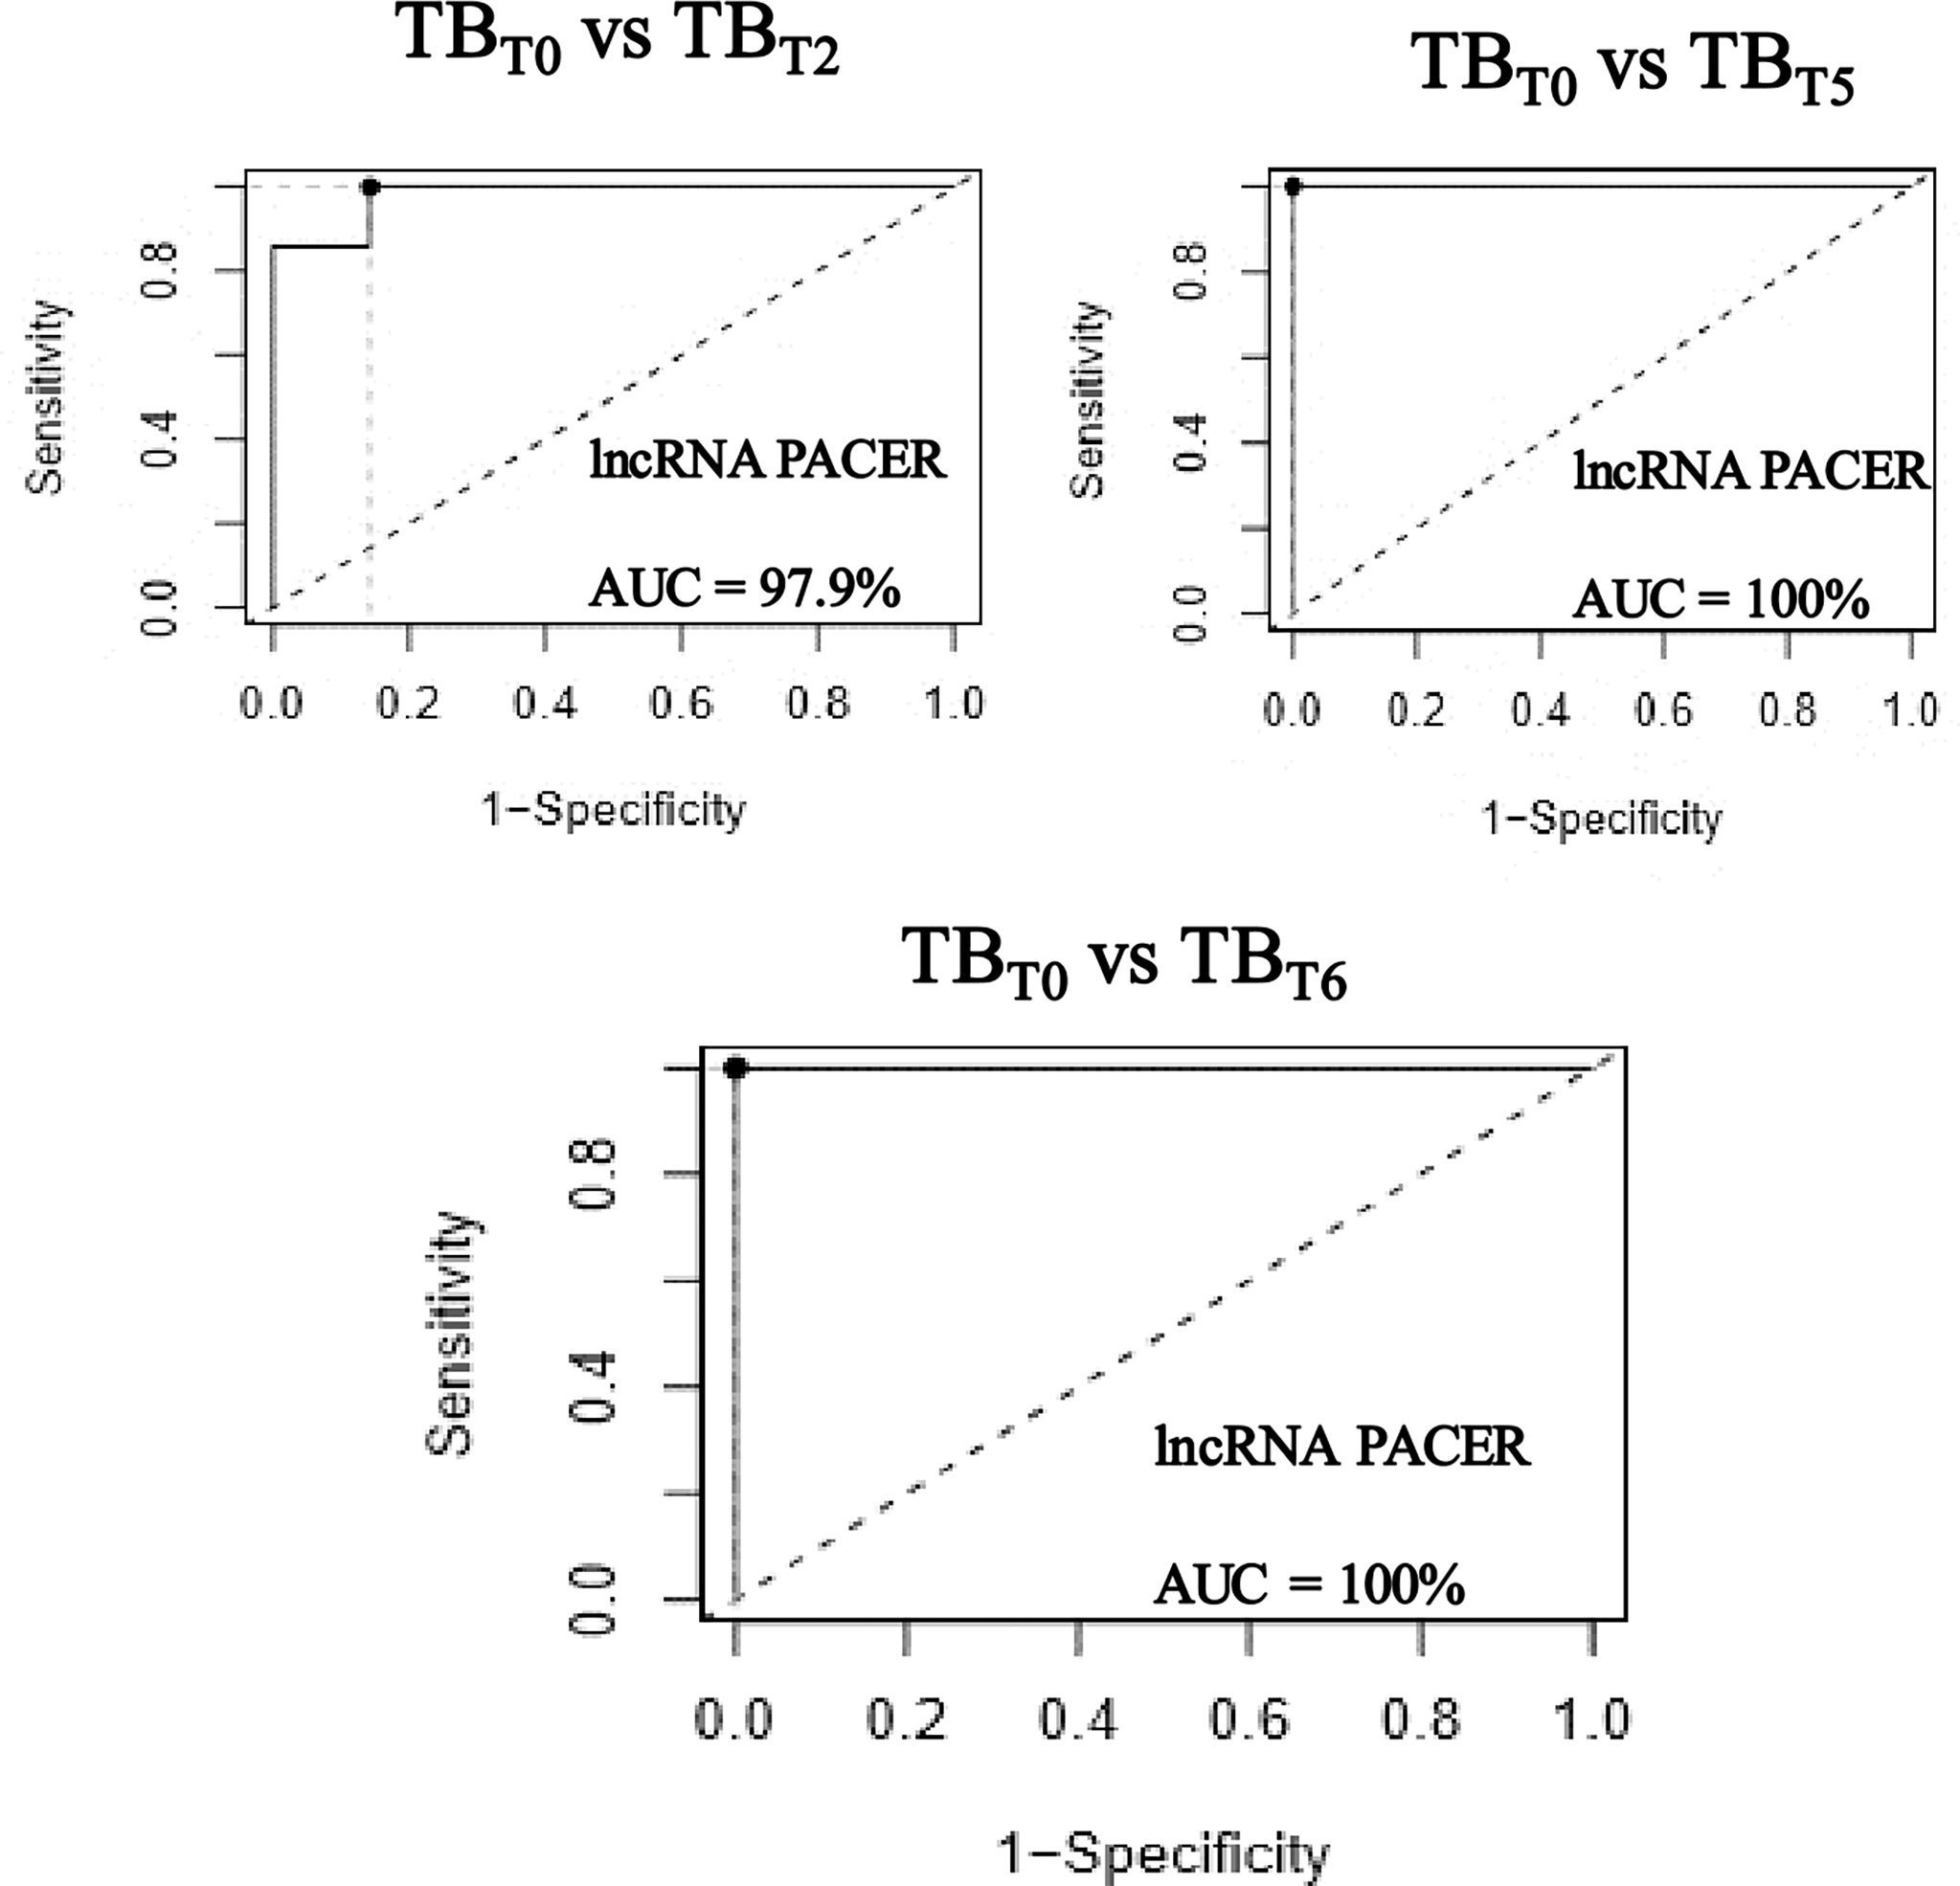
Figure 4 LncRNA PACER levels differentiate newly diagnosed active tuberculosis patients from those under treatment. Total RNA was extracted from the whole blood samples of newly diagnosed active tuberculosis patients (TBT0), tuberculosis patients after two (TBT2), five (TBT5), and six (TBT6) months of TB treatment. The lncRNA PACER relative expression was evaluated by RT-qPCR coupled to the 2-ΔΔCq method. The ROC curves were generated and area under the curve (AUC) values were calculated using the software easyROC. The lncRNA PACER is an excellent classifier of newly diagnosed active tuberculosis patients from those under treatment; displaying respective AUCs of 97.9% after two, and 100% after five and six months.

Figure 5 LNC13 level differentiates newly diagnosed active tuberculosis patients from those under treatment. Total RNA was extracted from the whole blood samples of newly diagnosed active tuberculosis patients (TBT0), tuberculosis patients after two (TBT2), five (TBT5), and six (TBT6) months of TB treatment. The LNC13 relative expression was evaluated by RT-qPCR coupled to the 2−ΔΔCq method. The ROC curves were generated and the area under the curve (AUC) values were calculated using the software easyROC. LNC13 has an excellent potential to discriminate between newly diagnosed active tuberculosis patients and those under treatment; with AUCs of 100% after two, 92.8% after five, and 100% after six months of treatment.
LncRNA PACER and LNC13 levels cannot discriminate between tuberculosis patients after six months of treatment and healthy controls
ROC curves (Figure 6) were constructed to assess the capacity of PACER and LNC13 to differentiate between TB patients after six months of anti-tuberculosis drugs and healthy controls. It was found that PACER and LNC13 exhibited respective AUCs of 42.8% and 45.7%. Consequently, these lncRNAs could not discriminate healthy people from tuberculosis patients after six months of treatment.
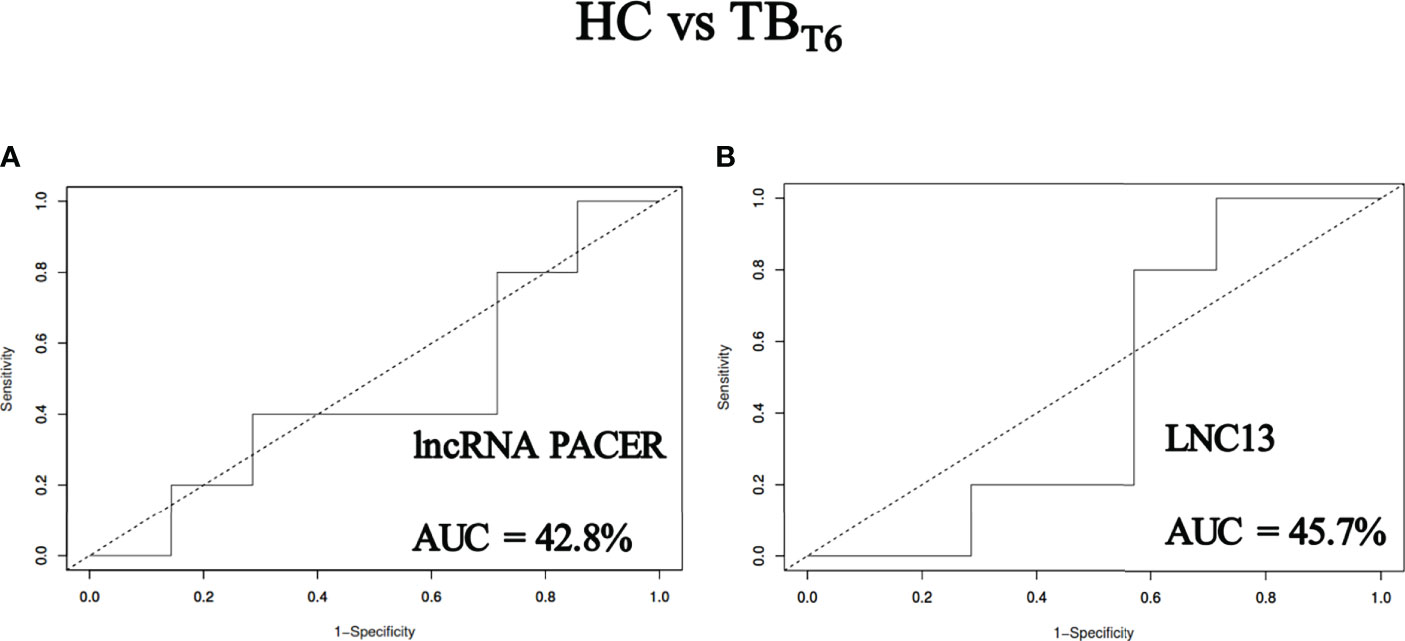
Figure 6 LncRNA PACER and LNC13 levels cannot discriminate tuberculosis patients after six months of treatment from healthy controls. Total RNA was extracted from the whole blood samples of healthy individuals (HC) and active tuberculosis patients after six (TBT6) months of TB treatment. The lncRNA PACER and LNC13 were detected by RT-qPCR coupled to the 2−ΔΔCq method. These data were uploaded to the software easyROC to generate ROC curves and calculate the area under the curve (AUC) values for the lncRNA PACER (A) and LNC13 (B). With respective AUCs of 42.8% and 45.7%, PACER and LNC13 cannot discriminate patients from healthy controls after six months of treatment.
Discussion
This study aimed to assess the potential of two long non-coding RNAs PACER and LNC13 in the monitoring of tuberculosis treatment. These pro-inflammatory lncRNAs have been associated with many diseases. Experimentally, PACER was found to be upregulated in cells infected by Mycoplasma pneumonia and its knockdown inhibited the production of inflammatory cytokines as well as the expression of its proximal target COX-2 (47). Similarly, LNC 13 was upregulated in Peripheral Blood Mononuclear Cells (PBMC) of Inflammatory Bowel Disease (IBD) patients compared to controls (39). In the same way, this investigation showed that lncRNA PACER and LNC13 are upregulated in the whole blood of patients with active pulmonary tuberculosis as compared to Healthy Controls.
It is known that antitubercular agents act by y reversibly inhibiting DNA-dependent RNA polymerase, which further stops bacterial protein synthesis and transcription, or constrains the enzyme arabinosyltransferases and thus preventing the biosynthesis of the mycobacterial cell wall. As a result, tuberculosis-causing bacteria growth will be inhibited and they will be killed very slowly (48). The gradual reduction of the bacteria will result in a decrease in the inflammatory response, which is part of the body’s defense mechanism. Consequently, all the pro-inflammatory effectors will follow the same trend. Similarly, it has been observed in this study that the pro-inflammatory lncRNA PACER and LNC13 are downregulated in patients during the treatment as compared to the newly diagnosed active tuberculosis patients. Huang et al. (2018) (49) also reported that Nuclear-Enriched Abundant Transcript 1 (NEAT1), which was significantly upregulated in PBMCs of TB patients gradually declined after treatment. This observation is similar to the result of Lv et al. (2016) (50) who found that sputum and serum miR-144 levels which were significantly upregulated in TB patients, decreased meaningfully after anti-TB treatment (30). In the same way, Wang et al. (2018) found a reduction in the expression levels of miR-21-5p, miR-92a-3p, and miR-148b-3p in the serum of cured TB patients as compared to the untreated TB patients (51).
After six months of treatment, tuberculosis patients and healthy controls expressed a similar level of PACER and LNC13. Wagh et al. (2017) also reported that miR-16 expression levels in sera of TB patients who received the standard anti-TB drug regimen for six months increased to reach the approximate level of healthy controls (52). Similarly, Kim et al. (2022) found that the levels of miR-199b-3p, miR-199a-3p, and miR-16-5p were restored to healthy controls levels after standard anti-tuberculosis therapy (53).
Many non-coding RNAs have been reported able to distinguish active pulmonary tuberculosis patients from healthy individuals. miR-769-5p, miR-320a, and miR-22-3p were found to distinguish TB patients from healthy controls with AUC ranging from 69.2% to 97.0% (54). miR-29a (23), miR-197 (55), miR-16, and miR-155 (52) were described as discriminators of TB patients from healthy controls with AUC respectively of 83.1%, 96.0%, 100%, and 96.7%. Similarly, this study indicated that lncRNA PACER and LNC13 were excellent in distinguishing active pulmonary tuberculosis patients from healthy controls with respective AUCs of 100% and 91%.
This study reported for the first time the ability of lncRNA PACER and LNC13 to monitor anti-tuberculosis treatment. The previous studies were focused on miRNAs, or were limited to the observation of changes in the expression levels of ncRNAs after TB treatment. PACER was found able to discriminate newly diagnosed active tuberculosis patients from those after two, five, and six months of treatment with AUC respectively of 97.9%, 100%, and 100%. Similarly, LNC13 was capable of separating active tuberculosis patients at the initiation of treatment from those after two, five, and six months of treatment with AUC respectively of 100%, 92.8%, and 100%.
According to the World Health Organization (4), active, drug-susceptible TB disease is treated with standard 6-month treatment. Cameroon also recommended the same treatment duration (56). The expression levels of the lncRNAs PACER and LNC13 in whole blood of patients after six months of treatment were similar to those in healthy controls. Also, these lncRNAs could not discriminate (AUC ≤ 45.7%) healthy controls from patients after six months of treatment. The expression of these lncRNAs was important in active patients, and gradually decreased in patients under treatment to reach, after six months, the same level as healthy volunteers. Therefore, this study confirmed that active and drug-susceptible tuberculosis could be treated with a standard six months antitubercular drugs regimen.
No reference test (57) is available for the diagnosis of latent tuberculosis. The ability of PACER and LNC13 to discriminate latent tuberculosis from the other groups remains unknown and could be a new avenue to investigate.
In conclusion, the present study reported that the lncRNA PACER and LNC13 were significantly upregulated in patients with active pulmonary tuberculosis at the initiation of the treatment than in healthy controls. The expression levels of the two lncRNAs were significantly downregulated in patients during treatment compared to the active ones. The expression levels of the lncRNAs PACER and LNC13 in whole blood of patients after six months of treatment were similar to those in healthy controls. PACER and LNC13 showed very good performance in distinguishing between active tuberculosis patients and healthy controls as well as in differentiating between newly diagnosed active tuberculosis patients and those under treatment. They could not discriminate healthy controls from patients after six months of treatment. The lncRNA PACER and LNC13 could constitute potential biomarkers for monitoring tuberculosis treatment.
Data availability statement
The raw data supporting the conclusions of this article will be made available by the authors, without undue reservation.
Ethics statement
The studies involving human participants were reviewed and approved by The Institutional Ethics Committee for Research on Human Health, University of Douala. Written informed consent to participate in this study was provided by the participants’ legal guardian/next of kin.
Author contributions
OT, CK , CFM and NNN designed the experimental approach and the writing plan. CK, NNN, JAN, USFS, and FJT recruited participants and performed laboratory analysis. CK, NNN, RNN, RJEMN, AM and OT did the statistical analysis. CK , CFM, NNN and RJEMN drew all the figures. CFM, CK , NNN, JAN, USFS, FJT, SNN, APCN, MAWP, MHT, ESTM and MFT wrote the draft. FKK, AW, AM, ARNN, and OT proofread the manuscript. All authors contributed to the article and approved the submitted version.
Funding
This work was supported by the Cameroon head of state's special research fund granted to OT.
Acknowledgments
Many thanks to all the people who voluntarily accepted to participate in the study, the personnel of the center of respiratory diseases of LAQUINTINIE hospital, and the National Veterinary Laboratory of Douala for their support throughout the realization of this work.
Conflict of interest
The authors declare that the research was conducted in the absence of any commercial or financial relationships that could be construed as a potential conflict of interest.
Publisher’s note
All claims expressed in this article are solely those of the authors and do not necessarily represent those of their affiliated organizations, or those of the publisher, the editors and the reviewers. Any product that may be evaluated in this article, or claim that may be made by its manufacturer, is not guaranteed or endorsed by the publisher.
Abbreviations
AUC, Area Under the Curve; BCG, Bacillus Calmette-Guérin; COX-2, Cyclooxygenase-2; Cq, Quantification Cycle; DR-TB, Drug-resistant tuberculosis; LNC13, Long Non-coding RNA 13; MDR-TB, Multidrug-resistant tuberculosis; MTBC, Mycobacterium tuberculosis complex; PACER,p50-associated Cyclooxygenase-2 Extragenic RNA; PBMC, Peripheral Blood Mononuclear Cells; ROC, Receiver Operating Characteristics; TB, Tuberculosis; XDR, Extensively drug-resistant.
References
1. Bajaj AO, Saraswat S, Knuuttila JEA, Freeke J, Stielow JB, Barker AP. Accurate identification of closely related mycobacterium tuberculosis complex species by high resolution tandem mass spectrometry. Front Cell Infect Microbiol (2021) 11:656880. doi: 10.3389/fcimb.2021.656880
2. Bayraktar B, Bulut E, Barış AB, Toksoy B, Dalgıc N, Celikkan C, et al. Species distribution of the mycobacterium tuberculosis complex in clinical isolates from 2007 to 2010 in Turkey: A prospective study. J Clin Microbiol (2011) 49:3837–41. doi: 10.1128/JCM.01172-11
4. World Health Organization [WHO]. Tuberculosis (TB) (2021). Available at: https://www.who.int/news-room/fact-sheets/detail/tuberculosis (Accessed February 24, 2022).
6. StopTB Partnership. Cameroon Tuberculosis situation in 2020 (2021). Available at: https://www.stoptb.org/static_pages/CMR_Dashboard.html (Accessed February 24, 2022).
7. World Health Organization [WHO]. Global tuberculosis report 2016 (2016). Geneva: World Health Organization. Available at: https://apps.who.int/iris/handle/10665/250441 (Accessed March 16, 2022).
8. World Health Organization [WHO]. THE END TB STRATEGY (2014). Available at: https://www.who.int/tb/strategy/End_TB_Strategy.pdf.
9. Mariandyshev A, Eliseev P. Drug-resistant tuberculosis threatens WHO’s end-TB strategy. Lancet Infect Dis (2017) 17:674–5. doi: 10.1016/S1473-3099(17)30246-3
10. World Health Organization [WHO]. Tuberculosis: Multidrug-resistant tuberculosis (MDR-TB) (2018). Available at: https://www.who.int/news-room/questions-and-answers/item/tuberculosis-multidrug-resistant-tuberculosis-(mdr-tb) (Accessed March 16, 2022).
11. Lyu M, Cheng Y, Zhou J, Chong W, Wang Y, Xu W, et al. Systematic evaluation, verification and comparison of tuberculosis-related non-coding RNA diagnostic panels. J Cell Mol Med (2021) 25:184–202. doi: 10.1111/jcmm.15903
12. Das PK, Ganguly SB, Mandal B. Sputum smear microscopy in tuberculosis: It is still relevant in the era of molecular diagnosis when seen from the public health perspective. BioMed Biotechnol Res J BBRJ (2019) 3:77. doi: 10.4103/bbrj.bbrj_54_19
13. Rasool G, Khan AM, Mohy-Ud-Din R, Riaz M. Detection of mycobacterium tuberculosis in AFB smear-negative sputum specimens through MTB culture and GeneXpert ® MTB/RIF assay. Int J Immunopathol Pharmacol (2019) 33:205873841982717. doi: 10.1177/2058738419827174
14. Ratti M, Lampis A, Ghidini M, Salati M, Mirchev MB, Valeri N, et al. MicroRNAs (miRNAs) and long non-coding RNAs (lncRNAs) as new tools for cancer therapy: First steps from bench to bedside. Target Oncol (2020) 15:261–78. doi: 10.1007/s11523-020-00717-x
15. Sun Y-M, Chen Y-Q. Principles and innovative technologies for decrypting noncoding RNAs: from discovery and functional prediction to clinical application. J Hematol Oncol J Hematol Oncol (2020) 13:109. doi: 10.1186/s13045-020-00945-8
16. Zhang P, Wu W, Chen Q, Chen M. Non-coding RNAs and their integrated networks. J Integr Bioinform (2019) 16:1–12. doi: 10.1515/jib-2019-0027
17. Kundu M, Basu J. The role of microRNAs and long non-coding RNAs in the regulation of the immune response to mycobacterium tuberculosis infection. Front Immunol (2021) 12:687962. doi: 10.3389/fimmu.2021.687962
18. Kumar R, Halder P, Sahu SK, Kumar M, Kumari M, Jana K, et al. Identification of a novel role of ESAT-6-dependent miR-155 induction during infection of macrophages with mycobacterium tuberculosis. Cell Microbiol (2012) 14:1620–31. doi: 10.1111/j.1462-5822.2012.01827.x
19. Liu F, Chen J, Wang P, Li H, Zhou Y, Liu H, et al. MicroRNA-27a controls the intracellular survival of mycobacterium tuberculosis by regulating calcium-associated autophagy. Nat Commun (2018) 9:4295. doi: 10.1038/s41467-018-06836-4
20. Sinigaglia A, Peta E, Riccetti S, Venkateswaran S, Manganelli R, Barzon L. Tuberculosis-associated MicroRNAs: From pathogenesis to disease biomarkers. Cells (2020) 9:1–23. doi: 10.3390/cells9102160
21. Hu X, Liao S, Bai H, Wu L, Wang M, Wu Q, et al. Integrating exosomal microRNAs and electronic health data improved tuberculosis diagnosis. EBioMedicine (2019) 40:564–73. doi: 10.1016/j.ebiom.2019.01.023
22. Ndzi EN, Nkenfou CN, Mekue LM, Zentilin L, Tamgue O, Pefura EWY, et al. MicroRNA hsa-miR-29a-3p is a plasma biomarker for the differential diagnosis and monitoring of tuberculosis. Tuberculosis (2019) 114:69–76. doi: 10.1016/j.tube.2018.12.001
23. Fu Y, Yi Z, Wu X, Li J, Xu F. Circulating MicroRNAs in patients with active pulmonary tuberculosis. J Clin Microbiol (2011) 49:4246–51. doi: 10.1128/JCM.05459-11
24. Zhou M, Yu G, Yang X, Zhu C, Zhang Z, Zhan X. Circulating microRNAs as biomarkers for the early diagnosis of childhood tuberculosis infection. Mol Med Rep (2016) 13:4620–6. doi: 10.3892/mmr.2016.5097
25. Barry SE, Ellis M, Yang Y, Guan G, Wang X, Britton WJ, et al. Identification of a plasma microRNA profile in untreated pulmonary tuberculosis patients that is modulated by anti-mycobacterial therapy. J Infect (2018) 77:341–8. doi: 10.1016/j.jinf.2018.03.006
26. Tu H, Yang S, Jiang T, Wei L, Shi L, Liu C, et al. Elevated pulmonary tuberculosis biomarker miR-423-5p plays critical role in the occurrence of active TB by inhibiting autophagosome-lysosome fusion. Emerg Microbes Infect (2019) 8:448–60. doi: 10.1080/22221751.2019.1590129
27. Tamgue O, Mezajou CF, Ngongang NN, Kameni C, Ngum JA, Simo USF, et al. Non-coding RNAs in the etiology and control of major and neglected human tropical diseases. Front Immunol (2021) 12:703936. doi: 10.3389/fimmu.2021.703936
28. Krawczyk M, Emerson BM. p50-associated COX-2 extragenic RNA (PACER) activates COX-2 gene expression by occluding repressive NF-κB complexes. eLife (2014) 3:e01776. doi: 10.7554/eLife.01776
29. Welch JA. Ptgs2 antisense Nfkb1 complex-mediated expression regulator rna, noncoding; pacerr (2017). Available at: https://www.omim.org/entry/617650?search=Lnc%20PACER&highlight=lnc%20pacer#1.
30. Pearson MJ, Philp AM, Heward JA, Roux BT, Walsh DA, Davis ET, et al. Long intergenic noncoding RNAs mediate the human chondrocyte inflammatory response and are differentially expressed in osteoarthritis cartilage. Arthritis Rheumatol (2016) 68:845–56. doi: 10.1002/art.39520
31. Ye Y, Xu Y, Lai Y, He W, Li Y, Wang R, et al. Long non-coding RNA cox-2 prevents immune evasion and metastasis of hepatocellular carcinoma by altering M1/M2 macrophage polarization. J Cell Biochem (2018) 119:2951–63. doi: 10.1002/jcb.26509
32. Tamgue O, Chia JE, Brombacher F. Triptolide modulates the expression of inflammation-associated lncRNA-PACER and lincRNA-p21 in mycobacterium tuberculosis–infected monocyte-derived macrophages. Front Pharmacol (2021) 12:618462. doi: 10.3389/fphar.2021.618462
33. Zhao Q, Pang G, Yang L, Chen S, Xu R, Shao W. Long noncoding RNAs regulate the inflammatory responses of macrophages. Cells (2021) 11:5. doi: 10.3390/cells11010005
34. Xie Y, Wang M, Tian J, Li X, Yang M, Zhang K, et al. Long non-coding RNA expressed in macrophage co-varies with the inflammatory phenotype during macrophage development and polarization. J Cell Mol Med (2019) 23:6530–42. doi: 10.1111/jcmm.14557
35. Khan A, Zhang K, Singh VK, Mishra A, Kachroo P, Bing T, et al. Human M1 macrophages express unique innate immune response genes after mycobacterial infection to defend against tuberculosis. Commun Biol (2022) 5:480. doi: 10.1038/s42003-022-03387-9
36. Hartz PA. LONG NONCODING RNA 13 (2016). Available at: https://www.omim.org/entry/617071#1.
37. Castellanos-Rubio A, Fernandez-Jimenez N, Kratchmarov R, Luo X, Bhagat G, Green PHR, et al. A long noncoding RNA associated with susceptibility to celiac disease. Science (2016) 352:91–5. doi: 10.1126/science.aad0467
38. Gonzalez-Moro I, Olazagoitia-Garmendia A, Colli ML, Cobo-Vuilleumier N, Postler TS, Marselli L, et al. The T1D-associated lncRNA Lnc13 modulates human pancreatic β cell inflammation by allele-specific stabilization of STAT1 mRNA. Proc Natl Acad Sci (2020) 117:9022–31. doi: 10.1073/pnas.1914353117
39. Zamiani N, Rostami Nejad M, Chaleshi V, Nourian M, Asri N, Tafvizi F, et al. Predictive value of NKILA and lnc13 lnc RNAs for distinguishing of celiac disease and IBD: A case-control study. Biointerface Res Appl Chem (2021) 12:5089–99. doi: 10.33263/BRIAC124.50895099
40. Cameroon National tuberculosis control program. In: National tuberculosis strategic plan 2010-2014. Cameroon: Ministry of Public Health. Available at: https://extranet.who.int/countryplanningcycles/sites/default/files/planning_cycle_repository/cameroon/nationaltuberculosisstrategicplan2010.pdf.
42. Roche. Transcriptor first strand cDNA synthesis kit (2017). Available at: https://www.n-genetics.com/products/1295/1023/13832.pdf. Ministry of Public Health.
43. Livak KJ, Schmittgen TD. Analysis of relative gene expression data using real-time quantitative PCR and the 2–ΔΔCT method. Methods (2001) 25:402–8. doi: 10.1006/meth.2001.1262
45. Kamal M. Re: What is the value of the area under the roc curve (AUC) to conclude that a classifier is excellent? (2018). Available at: https://www.researchgate.net/post/What-is-the-value-of-the-area-under-the-roc-curve-AUC-to-conclude-that-a-classifier-is-excellent/5aab2493f7b67e588f65e696/citation/download.
46. Folador E. Re: What is the value of the area under the roc curve (AUC) to conclude that a classifier is excellent? (2016). Available at: https://www.researchgate.net/post/What-is-the-value-of-the-area-under-the-roc-curve-AUC-to-conclude-that-a-classifier-is-excellent/57e7c1a8eeae39df96718d43/citation/download.
47. Xu C, Deng H, Liu F, Zhao D, Tang H, Gu H. Long non-coding RNA PACER regulates mycoplasma pneumoniae-induced inflammatory response through interaction with NF-κB. Ann Clin Lab Sci (2022) 52:21–6.
48. Memon N. Antitubercular agents: Drug class, uses, side effects, drug names(2021). Available at: https://www.rxlist.com/how_do_antitubercular_agents_work/drug-class.htm (Accessed March 29, 2022).
49. Huang S, Huang Z, Luo Q, Qing C. The expression of lncRNA NEAT1 in human tuberculosis and its antituberculosis effect. BioMed Res Int (2018) 2018:1–8. doi: 10.1155/2018/9529072
50. Lv Y, Guo S, Li X-G, Chi J-Y, Qu Y-Q, Zhong H-L. Sputum and serum microRNA-144 levels in patients with tuberculosis before and after treatment. Int J Infect Dis (2016) 43:68–73. doi: 10.1016/j.ijid.2015.12.014
51. Wang C, Yang S, Liu C-M, Jiang T-T, Chen Z-L, Tu H-H, et al. Screening and identification of four serum miRNAs as novel potential biomarkers for cured pulmonary tuberculosis. Tuberculosis (2018) 108:26–34. doi: 10.1016/j.tube.2017.08.010
52. Wagh V, Urhekar A, Modi D. Levels of microRNA miR-16 and miR-155 are altered in serum of patients with tuberculosis and associate with responses to therapy. Tuberculosis (2017) 102:24–30. doi: 10.1016/j.tube.2016.10.007
53. Kim J, Park H, Park S-B, Lee EJ, Je M-A, Ahn E, et al. Identification of MicroRNAs as potential blood-based biomarkers for diagnosis and therapeutic monitoring of active tuberculosis. Diagnostics (2022) 12:369. doi: 10.3390/diagnostics12020369
54. Cui J-Y, Liang H-W, Pan X-L, Li D, Jiao N, Liu Y-H, et al. Characterization of a novel panel of plasma microRNAs that discriminates between mycobacterium tuberculosis infection and healthy individuals. PloS One (2017) 12:e0184113. doi: 10.1371/journal.pone.0184113
55. Abd-El-Fattah AA, Sadik NAH, Shaker OG, Aboulftouh ML. Differential MicroRNAs expression in serum of patients with lung cancer, pulmonary tuberculosis, and pneumonia. Cell Biochem Biophys (2013) 67:875–84. doi: 10.1007/s12013-013-9575-y
56. Noubom M, Nembot FD, Donfack H, Kouomboua PS, Tchasse F. Caracterisitiques des patients tuberculeux à l’ouest cameroun: 2000-2009. Pan Afr Med J (2013) 16:1–6. doi: 10.11604/pamj.2013.16.39.2860
57. World Health Organization [WHO]. Executive summary (2018). World Health Organization. Available at: https://www.ncbi.nlm.nih.gov/books/NBK531240/ (Accessed April 4, 2022).
Keywords: PACER, LNC13, lncRNAs, biomarkers, monitoring, tuberculosis, treatment
Citation: Kameni C, Mezajou CF, Ngongang NN, Ngum JA, Simo USF, Tatang FJ, Nguengo SN, Nouthio APC, Pajiep MAW, Toumeni MH, Madjoumo EST, Tchinda MF, Ngangue RJEM, Koro Koro F, Wade A, Akami M, Ngono ARN and Tamgue O (2022) p50-associated Cyclooxygenase-2 Extragenic RNA (PACER) and Long Non-coding RNA 13 (LNC13) as potential biomarkers for monitoring tuberculosis treatment. Front. Trop. Dis 3:969347. doi: 10.3389/fitd.2022.969347
Received: 14 June 2022; Accepted: 12 August 2022;
Published: 15 September 2022.
Edited by:
Oluwatoyin Ajibola Asojo, Hampton University, United StatesReviewed by:
Veera Venkat Shivaji Rama Rao Edupuganti, National Cancer Institute (NIH), United StatesRabih Darwiche, Laronde Inc., United States
Copyright © 2022 Kameni, Mezajou, Ngongang, Ngum, Simo, Tatang, Nguengo, Nouthio, Pajiep, Toumeni, Madjoumo, Tchinda, Ngangue, Koro Koro, Wade, Akami, Ngono and Tamgue. This is an open-access article distributed under the terms of the Creative Commons Attribution License (CC BY). The use, distribution or reproduction in other forums is permitted, provided the original author(s) and the copyright owner(s) are credited and that the original publication in this journal is cited, in accordance with accepted academic practice. No use, distribution or reproduction is permitted which does not comply with these terms.
*Correspondence: Ousman Tamgue, b3VzdGhlbzIwMTRAZ21haWwuY29t
†These authors have contributed equally to this work