 Váleri N. Vásquez
 Michael R. Reddy3
 John M. Marshall
95% of researchers rate our articles as excellent or good
Learn more about the work of our research integrity team to safeguard the quality of each article we publish.
Find out more
BRIEF RESEARCH REPORT article
Front. Trop. Dis. , 17 August 2022
Sec. Neglected Tropical Diseases
Volume 3 - 2022 | https://doi.org/10.3389/fitd.2022.953212
This article is part of the Research Topic Latest Advances in the Biological Control of Vectors of Human Tropical Diseases View all 6 articles
As anthropogenic factors contribute to the introduction and expansion of new and established vector species, the geographic incidence of mosquito-borne disease is shifting. Computer simulations, informed by field data where possible, facilitate the cost-effective evaluation of available public health interventions and are a powerful tool for informing appropriate policy action. However, a variety of measurements are used in such assessments; this can complicate direct comparisons across both vector control technologies and the models used to simulate them. The expansion of biocontrol to include genetically engineered organisms is now prompting additional metrics with no analogy to traditional measurement approaches. We propose Standard Entomological Metrics (SEMs) to facilitate the model-based appraisal of both existing and novel intervention tools and define two examples: Suppression Efficacy Score and Time to Reduction Target. We formulate twelve synthetic case studies featuring two vector control technologies over three years of observed daily temperature in Cairns, Australia. After calculating Suppression Efficacy Score and Time to Reduction Target results, we apply these example outcomes to a discussion of health policy decision-making using SEMs. We submit that SEMs such as Suppression Efficacy Score and Time to Reduction Target facilitate the wholistic and environmentally appropriate simulation-based evaluation of intervention programs and invite the community to further discussion on this topic.
Global warming, urbanization, and land-use change are shifting the geographic incidence of mosquito-borne diseases, with multiple studies predicting the re-emergence and expansion of vector species (1–4). A broad array of prevention methods have been developed to counteract both transmission mechanisms and risk factors, the efficacy of which varies by resource availability as well as setting, intervention type, and study duration (5). Such heterogeneity can complicate evidence-based recommendations for local solutions, particularly given the time and expense of the field trials required to evaluate options empirically. Computer simulations are cost-effective instruments for assessing intervention potential under different scenarios; where available, field data can be used to fit models and enhance their realism.
Several modeling efforts have compared the potency of alternative vector control techniques, applied individually or as part of integrated vector management (IVM) strategies (6–8). Relative efficacy is appraised according to epidemiological (e.g., reducing the clinical incidence of a mosquito-borne disease by a target amount) or entomological (e.g., reducing the competent population of mosquitoes by a target amount) outcomes, or both. The metrics used in such assessments vary by study, intervention type, and vector of interest; however, they may include estimates of entomological inoculation rate (EIR), parasite prevalence, seroconversion rate, human biting rate, adult density, or larval density (9–12). This diversity of simulation-calculated outputs assists the design of prevention campaigns that are regionally tailored to include locally affordable, situationally appropriate, and community acceptable technologies.
Models have also been used to explore initial performance indicators of new genetic tools. Simulations can employ laboratory and cage trial data to extrapolate the expected effects of these novel techniques to the population level and predict impacts that can then be evaluated relative to longer-standing technologies (13). The analysis of genetic-based vector control often includes measurements unique to certain constructs, for example, the proportion of females in the population that are homozygous for the transgene of interest or carriers of refractory alleles. Such metrics, while important for understanding the possible dynamics and results of specific tools, are not analogous to simulation outputs for traditional control approaches.
Weighing alternatives for mosquito-borne disease prevention can thus be complex and cumbersome even when using model-based assessments, given discrepancies in units of measurement. There is a need for baseline criteria that enable and encourage direct comparisons across both technologies and models; this necessity is underscored by the scientific advances that are expanding biocontrol options to include genetically engineered organisms. The reality of climate change – which extrinsically affects mosquito thermal biology and stands to confound the epidemiological metrics unique to vector-borne parasitic species and viruses – presents an argument for metrics that are suitable in the presence of environmental variability. Therefore, we propose Standard Entomological Metrics (SEMs) to facilitate the model-based comparison of vector control tools.
Here, we put forward two possible SEMs that carry operational significance for tuning site-specific intervention logistics and policy significance for public health planning by gauging the potency, rate, and durability of vector control: (1) Suppression Efficacy Score and (2) Time to Reduction Target. After defining each metric, we demonstrate their application to the simulation-based evaluation of two disparate technologies. We then discuss the results of these synthetic case studies and analyze the implications for intervention design and decision-making.
The Suppression Efficacy Score and Time to Reduction Target metrics evaluate the ability of a given technique to reduce adult vector density. Both are calculated using the change in the disease-competent vector population that is achieved over the intervention period [τ0, τf] (14). When computed using models that account for details such as species-specific thermal sensitivity, these two measures can inform decisions that are responsive to local climatological and entomological realities. For a given intervention period that is being assessed using these metrics, there are a total of T timesteps equal to that period’s length, τf - τ0, divided by the discretization, δτ.
The Suppression Efficacy Score, Sg, is a single value that summarizes the success of an intervention in achieving the reduction of a vector population. It is indexed by g, denoting the specific genotype(s) within the population for which that reduction is sought. Sg is calculated by integrating the cumulative change in the vector population size over the duration of an intervention (grey shading under the solid purple line in Figure 1A, defined as in Equation 3) and subtracting that area from the outcome of an ideal intervention, Γg (dotted blue line in Figure 1A) for a given reduction goal γg ∈ [0, 1] per timestep t as a proportion of the original vector population size Fg,t=1. Γg is defined as the total count of vector reduction over the analysis period, T (i.e., Γg = γg Fg,1T).

Figure 1 Visual explanations of the Suppression Efficacy Score and Time to Reduction Target Metrics. (A) The Suppression Efficacy Score reflects the cumulative difference between the ideal and observed outcomes with respect to the percent reduction of the disease-competent vector population. (B) Time to Reduction Target measures the minimal time necessary for an intervention to reach specified suppression goals, expressed in percent reduction of the disease-competent vector population. The different trajectories and final outcomes between two interventions may be due to environmental variation, discrepancies in treatment schedule or size, or a combination of these factors.
Thus, Sg represents the relative distance between the outcome of the intervention that is being evaluated and the ideal Γg, wherein the entire vector population is reduced to zero immediately and maintained there for the remainder of the time horizon. Sg is formalized as follows:
Where is the cumulative change in the vector population the occurs in a discrete period δτ, and the difference between the ideal Γg and the reduction that is actually achieved is normalized by Γg. , the area under the curve of the observed intervention trajectory, is defined mathematically as:
Indexing the score Sg and vector population change according to genotype(s) of interest g allows the metric to be tailored to the particularities of novel CRISPR-based engineering approaches. Some genetic modifications trigger the development of resistant alleles; the female carriers of these alleles may also serve as disease vectors (mosquito vectors are strictly female). To calculate the efficacy of such technologies, the g index in Sg and should be considered a set inclusive of all disease-competent genotypes (i.e. both wild and resistant genotypes).
By establishing a discrimination threshold that is unique to operational design (e.g., hypothetical study area Y begins treatment on day five while hypothetical study area Z begins treatment on day seven) yet remains standard across tools (benchmarked against the first day of treatment regardless of what that treatment is), Sg provides an objective metric for comparing the simulated outcomes of all intervention technologies that are designed to reduce the disease-competent vector population. This applies to traditional approaches such as insecticides as well as new genetic technologies, including those that replace rather than simply suppress standing vector populations.
The Time to Reduction, Target [illustrated in (Figure 1B)] yields the trajectory of a given intervention in objective-oriented terms that that can be compared across tools as well as deployment plans: e.g., hypothetical intervention Y requires 43 days to achieve 20% reduction of the vector population, while hypothetical intervention Z requires only 31. In Equation 4, is formalized as the first timestep at which the vector population level meets or falls below the defined threshold γg.
As elaborated in Equation 5, the Time to Reduction Target measure X is the sum of discrete time periods δt from t = 1 through where is the first day the reduction goal γgis met. This yields the minimally necessary time for the intervention being evaluated to reach γg. The entomological objective γg may be selected for its epidemiological impact.
An ordinary differential equation model of mosquito population dynamics was parameterized with biological data pertinent to Aedes aegypti, a peri-domestic species which is a primary vector for yellow fever, dengue fever, chikungunya, and Zika viruses. The model served as a testbed for computing illustrative Suppression Efficacy Score and Time to Reduction Target values. The Supplementary Information (SI) provides links to the data and code used to generate these examples.
Two interventions – selected for their distinctness from each other, their recent and ongoing field trials, and their utility in approximating the dynamics of genetic techniques not yet tested outside the laboratory – were simulated: the release of Wolbachia-infected Ae. aegypti mosquitoes for replacement and the release of OX513A-modified Ae. aegypti male mosquitoes for suppression.
Wolbachia is natural symbiont that has been identified in approximately 60% of arthropods (15). Laboratory and field studies have demonstrated that introduction of Wolbachia into Ae. aegypti successfully disrupts the transmission of dengue virus. Following transfection of the symbiont it is maternally inherited by subsequent generations until the standing population of vector competent mosquitoes is substituted by Wolbachia carriers. OX513A-modified Ae. aegypti are an implementation of the suppression technology known as Release of Insects with Dominant Lethal (RIDL). This genetic-based tool causes the progeny of engineered males to die prematurely in the absence of tetracycline, reducing the vector population with each release.
The synthetic case studies were explored under environmental scenarios characterized by the historical daily mean temperatures observed over three consecutive years in Cairns, Queensland, Australia, where Ae. aegypti are endemic and have been subject to numerous vector control efforts including Wolbachia-based replacement (see SI).
Neither set of synthetic case studies in this work was optimized to achieve maximum success from a public health perspective. Rather, release sizes for each strategy were selected to illustrate the utility of the Suppression Efficacy Score and Time to Reduction Target metrics in summarizing decision-relevant information across both suppression and replacement technologies.
Panel A in Figure 2 depicts the percent daily decline in the disease-competent vector population (wildtype females) induced by each simulated set of releases. In the 2018 run with a release size of 50 Wolbachia-infected Ae. aegypti per deployment, after modest replacement success the vector population recovers to nearly 14% of its initial levels (13·63%, on day 158) before the intervention ultimately achieves full replacement. This results in the lowest Suppression Efficacy Score among the six Wolbachia scenarios (53·73). Panel B of Figure 2 features all Suppression Efficacy Scores for the Wolbachia-infected interventions. The high score achieved (71·96), occurred in 2016 and is outlined in green. This score was realized using the maximum release size of 100 Wolbachia-infected mosquitoes.
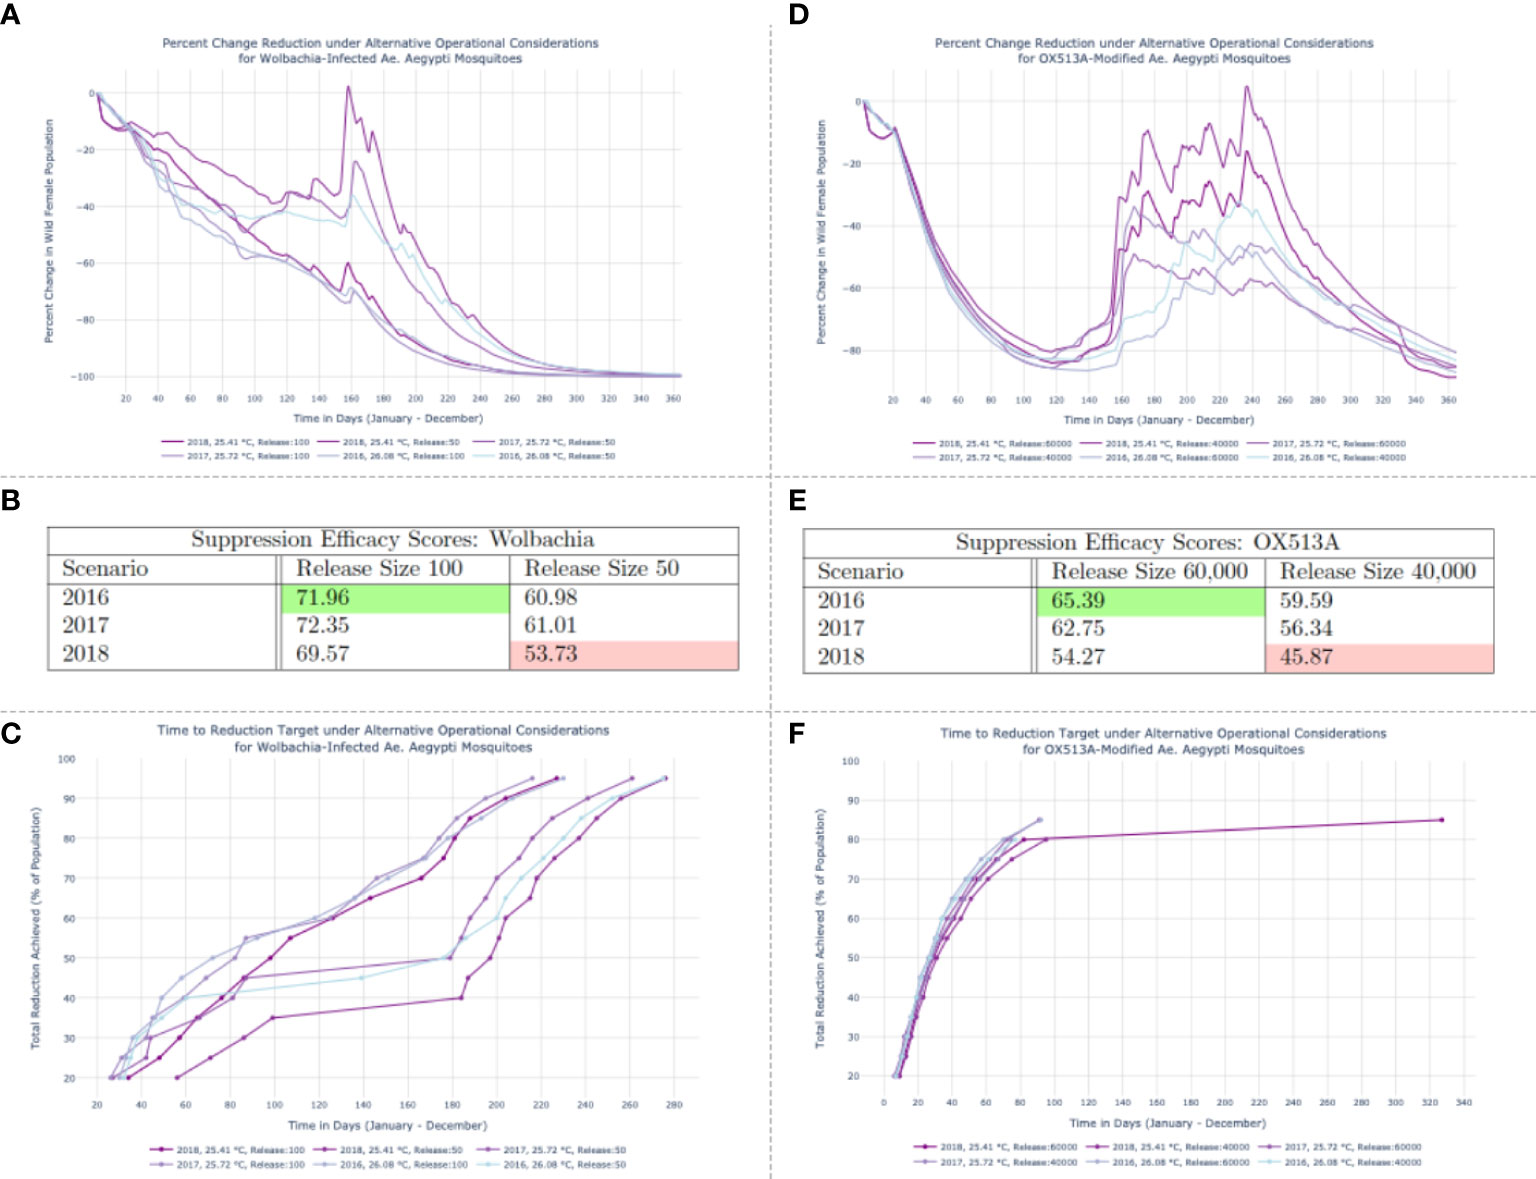
Figure 2 Results of Wolbachia-infected population replacement (A–C) and OX513A-modifed population suppression (D–F) under varied release schedules and temperature regimes.(A, D) Percentage reduction of the disease-competent vector population (wildtype females) with respect to the initial population size. (B, E) Suppression Efficacy Scores. (C) Time to reduction target trajectories for simulated Wolbachia interventions. Targets (y-axis) range from a 20% to a 95% reduction of the wildtype female population. The days required to achieve those thresholds are on the x-axis. (F) Time to reduction target trajectories for simulated OX513A interventions. The 2018 run conducted under the smaller release schedule features a 245-day lag between the penultimate (80%) and final (85%) thresholds achieved, suggesting the resurgence of the wild female population visible in (D) that prohibits achieving higher thresholds of suppression before the end of the study period.
The Time to Reduction Target metric conveys the time at which a given intervention achieves specific levels of suppression. Panel C in Figure 2 reflects a series of desired targets for the Wolbachia intervention – ranging from a 20% to a 95% reduction of the wildtype female population – on the y-axis. The days required to achieve those thresholds are on the x-axis. Ultimately all objectives in the array of defined thresholds are met, and the underlying correspondence between the Suppression Efficacy Score and Time to Reduction Target metrics is observable in that Wolbachia interventions with the lowest Suppression Efficacy Scores require comparatively longer time periods to achieve each consecutive target.
Panel D in Figure 2 reveals the dynamics that lead to the OX513A intervention Suppression Efficacy Scores, confirming that a large resurgence under the smaller 2018 release schedule is the cause of the lowest score (45·87) and that a rapid, consistently maintained suppression using the largest release schedule yields the highest score (65·39) in 2016.
The OX513A Time to Reduction Target measurements in Figure 2F reflect the fluctuating suppression levels observable in the percent daily changes shown of Figure 2A. One Time to Reduction Target simulation suggests a potential resurgence of the wild female population: the 2018 run conducted under the smaller release schedule features a 245-day lag between the penultimate (80%) and final (85%) thresholds achieved. The remaining five simulations have curtailed trajectories. This signals a bounce-back of the vector population, visible in Panel D of Figure 2, that prohibits achieving higher thresholds of suppression before the end of the study period.
Vector control is subject to technological, environmental, economic, and policy considerations. Field studies can furnish an understanding of how efficacious available options may be under local contexts and lend insight to the spatiotemporal specifics of deployment. But such trials are costly and time consuming, or – in the case of some genetic-based technologies – impossible to conduct. Modeling can guide decision-making even in the absence of field trials by enabling the exploration of myriad intervention scenarios; where available, empirical data can enhance these efforts. However, comparison across simulation studies would be facilitated by the development of metrics common across tools and vector targets.
This work proposes SEMs to establish standard units of model-based assessment that are agnostic to intervention type or health endpoint. Suppression Efficacy Score and Time to Reduction Target are put forward as two example SEMs. Suppression Efficacy Score aggregates the comprehensive performance of an intervention into a single number, while Time to Reduction Target evaluates the time required for an intervention to attain specified entomological thresholds. Both metrics account for the dynamics of differing ecological conditions when they are calculated using models that incorporate, e.g., ambient environmental temperature. Neither metric is limited to a specific type of simulation model; however, output values will be informed by model individual structure and parameterization choices.
Because the Suppression Efficacy Score reflects the integral under the curve of percent change for the wildtype female population, any resurgence of that population prior to τf – whether during or after the period of active deployment – is embedded in the result. While the Time to Reduction Target measure obscures any indication of resurgence that may occur over the designated study period provided that the threshold of interest is achieved prior to τf, it does put a finer point on Suppression Efficacy Score outcomes by defining the difference between interventions in public health-relevant terms: the number of days required to reduce the danger to human health by a specified percentage. Thus, the two metrics are complementary. By setting the Time to Reduction Target outcomes according to reduction goal γg – which is expressed in terms of a percent change from the initial population – and evaluating the Suppression Efficacy Score with respect to the ideal intervention effect Γg, varied release sizes and schedules can be directly compared.
The SEMs calculated here describe intervention outcomes with sufficient detail for a decision-maker to conclude that, if public health planning prioritizes efficient resource expenditure, then given the comparatively greater release sizes and more prolonged release schedule required for the OX513A interventions to achieve Suppression Efficacy Scores that are equivalent to or lower than the Wolbachia interventions in the synthetic case studies simulated, the available replacement technique is preferable to suppression. If, however, public health planning prioritizes the rapidity with which an intervention approach can be consistently expected to achieve a 60% reduction in wildtype females under characteristic temperature regimes (defined according to recent historical precedent), then OX513A would be the tool of choice.
Additional simulations can be conducted to determine whether larger or more frequent deployments, or alternative environmental assumptions, would alter Suppression Efficacy Score and Time to Reduction Target values sufficiently to change the cost-benefit of this decision. Stakeholder consultation is an important component of the model-based evaluation process, as well: when assessing simulation results, researchers and local decisionmakers should account for the preferences of the community where interventions will occur. Public engagement, including efforts to inform and involve local stakeholders about technological options (e.g., bacteria-based Wolbachia replacement versus self-limiting OX513A suppression) for vector control in their area, can help decisionmakers to understand how to apply Suppression Efficacy Score and Time to Reduction Target outcomes (16). For example, if a given tool performs according to these metrics but is not trusted or well understood by community members, then the latter is the primary concern.
Novel genetic tools have instigated an international process to define attributes that can be held up as general standards, called target product profiles (TPPs) (17). Unlike TPPs previously developed in the vector control space, this undertaking has focused on delineating quantifiable preferred outcomes and tradeoffs for a diverse suite of technologies in parallel, rather than for a single product at a time (18, 19). This affords the opportunity to develop a subset of metrics against which all mosquitoes control options can be appraised using mathematical models. Further, genetic-based technologies are likely to be used as one component of IVM plans, necessitating SEMs that can be applied toward the wholistic evaluation of multi-pronged future intervention programs. The Suppression Efficacy Score and Time to Reduction Target metrics are two suggestions toward this end.
The original contributions presented in the study are included in the article/Supplementary Material. Further inquiries can be directed to the corresponding author/s.
Conceived and designed the paper: VV, MR, JM. Collected the data, performed the analysis, wrote the first draft: VV. Verified the data and analysis: VV, JM. Revised and approved the final draft: VV, MR, JM.
VV was funded by a Microsoft Research PhD Fellowship. The funder had no involvement in the study design, collection, analysis, interpretation of data, the writing of this article or the decision to submit it for publication.
MR is employed by Microsoft Research.
The remaining authors declare that the research was conducted in the absence of any commercial or financial relationships that could be construed as a potential conflict of interest.
All claims expressed in this article are solely those of the authors and do not necessarily represent those of their affiliated organizations, or those of the publisher, the editors and the reviewers. Any product that may be evaluated in this article, or claim that may be made by its manufacturer, is not guaranteed or endorsed by the publisher.
The Supplementary Material for this article can be found online at: https://www.frontiersin.org/articles/10.3389/fitd.2022.953212/full#supplementary-material
1. Colón-González FJ, Sewe MO, Tompkins AM, Sjödin H, Casallas A, Rocklöv J. Projecting the risk of mosquito-borne diseases in a warmer and more populated world: a multi-model, multi-scenario intercomparison modelling study. Lancet Planet Health (2021) 5:e404–14. doi: 10.1016/S2542-5196(21)00132-7
2. Wang GH, Gamez S, Raban RR, Marshall JM, Alphey L, Li M, et al. Combating mosquito-borne diseases using genetic control technologies. Nat Commun (2021) 12(1):1–12. doi: 10.1038/s41467-021-24654-z
3. Ryan SJ, Carlson CJ, Mordecai EA, Johnson LR. Global expansion and redistribution of aedes-borne virus transmission risk with climate change. PloS Negl Trop Dis (2019) 13(3):e0007213. doi: 10.1371/journal.pntd.0007213
4. Mordecai EA, Ryan SJ, Caldwell JM, Shah MM, LaBeaud AD. Climate change could shift disease burden from malaria to arboviruses in Africa. Lancet Planet Health (2020) 4(9):e416–23. doi: 10.1016/S2542-5196(20)30178-9
5. Bouzid M, Brainard J, Hooper L, Hunter PR. Public health interventions for aedes control in the time of zikavirus–a meta-review on effectiveness of vector control strategies. PloS Negl Trop Dis (2016) 10(12):e0005176. doi: 10.1371/journal.pntd.0005176
6. Chitnis N, Schapira A, Smith T, Steketee R. Comparing the effectiveness of malaria vector-control interventions through a mathematical model. Am J Trop Med Hyg (2010) 83(2):230. doi: 10.4269/ajtmh.2010.09-0179
7. Eckhoff PA, Wenger EA, Godfray HCJ, Burt A. Impact of mosquito gene drive on malaria elimination in a computational model with explicit spatial and temporal dynamics. Proc Natl Acad Sci (2017) 114(2):E255–64. doi: 10.1073/pnas.1611064114
8. Li M, Yang T, Bui M, Gamez S, Wise T, Kandul NP, et al. Suppressing mosquito populations with precision guided sterile males. Nat Commun (2021) 12(1):1–10. doi: 10.1038/s41467-021-25421-w
9. Griffin JT, Hollingsworth TD, Okell LC, Churcher TS, White M, Hinsley W, et al. Reducing plasmodium falciparum malaria transmission in Africa: a model-based evaluation of intervention strategies. PloS Med (2010) 7(8):e1000324. doi: 10.1371/journal.pmed.1000324
10. White MT, Griffin JT, Churcher TS, Ferguson NM, Basáñez MG, Ghani AC. Modelling the impact of vector control interventions on anopheles gambiae population dynamics. Parasit Vectors (2011) 4(1):1–14. doi: 10.1186/1756-3305-4-153
11. Schwab SR, Stone CM, Fonseca DM, Fefferman NH. The importance of being urgent: the impact of surveillance target and scale on mosquito-borne disease control. Epidemics (2018) 23:55–63. doi: 10.1016/j.epidem.2017.12.004
12. Smith DL, Dushoff J, McKenzie FE, Dobson AP. The risk of a mosquito-borne infection in a heterogeneous environment. PloS Biol (2004) 2(11):e368. doi: 10.1371/journal.pbio.0020368
13. Marshall JM, North A. Modeling priorities as gene drive mosquito projects transition from lab to field. In: Carballar-Lejarazú R, editor. Mosquito gene drives and the malaria eradication agenda. Stanford: Jenny Stanford Publishing (2022).
14. Garcia KK, Versiani HS, Araújo TO, Conceicao J, Obara MT, Ramalho WM, et al. Measuring mosquito control: adult-mosquito catches vs egg-trap data as endpoints of a cluster-randomized controlled trial of mosquito-disseminated pyriproxyfen. Parasit Vectors (2020) 13(1):1–15. doi: 10.1186/s13071-020-04221-z
15. Hilgenboecker K, Hammerstein P, Schlattmann P, Telschow A, Werren JH. How many species are infected with wolbachia?–a statistical analysis of current data. FEMS Microbiol Lett (2008) 281(2):215–20. doi: 10.1111/j.1574-6968.2008.01110.x
16. Schairer CE, Taitingfong R, Akbari OS, Bloss CS. A typology of community and stakeholder engagement based on documented examples in the field of novel vector control. PloS Negl Trop Dis (2019) 13(11):e0007863. doi: 10.1371/journal.pntd.0007863
17. James SL, Marshall JM, Christophides GK, Okumu FO, Nolan T. Toward the definition of efficacy and safety criteria for advancing gene drive-modified mosquitoes to field testing. Vector Borne Zoonotic Dis (2020) 20(4):237–51. doi: 10.1089/vbz.2019.2606
18. Killeen GF, Chitnis N, Moore SJ, Okumu FO. Target product profile choices for intra-domiciliary malaria vector control pesticide products: repel or kill? Malar J (2011) 10(1):1–22. doi: 10.1186/1475-2875-10-207
Keywords: public health intervention, disease vector, mosquito, mathematical modeling and simulation, Wolbachia, RIDL, metrics, environmental variation
Citation: Vásquez VN, Reddy MR and Marshall JM (2022) Environmentally appropriate vector control is facilitated by standard metrics for simulation-based evaluation. Front. Trop. Dis 3:953212. doi: 10.3389/fitd.2022.953212
Received: 25 May 2022; Accepted: 05 July 2022;
Published: 17 August 2022.
Edited by:
Son H. Nghiem, Griffith University, AustraliaReviewed by:
Juan Pablo Escalera-Antezana, Secretaria Municipal de Salud, BoliviaCopyright © 2022 Vásquez, Reddy and Marshall. This is an open-access article distributed under the terms of the Creative Commons Attribution License (CC BY). The use, distribution or reproduction in other forums is permitted, provided the original author(s) and the copyright owner(s) are credited and that the original publication in this journal is cited, in accordance with accepted academic practice. No use, distribution or reproduction is permitted which does not comply with these terms.
*Correspondence: Váleri N. Vásquez, dm52YXNxdWV6QGJlcmtlbGV5LmVkdQ==
Disclaimer: All claims expressed in this article are solely those of the authors and do not necessarily represent those of their affiliated organizations, or those of the publisher, the editors and the reviewers. Any product that may be evaluated in this article or claim that may be made by its manufacturer is not guaranteed or endorsed by the publisher.
Research integrity at Frontiers
Learn more about the work of our research integrity team to safeguard the quality of each article we publish.