 Hafidh Hamim1
 Raphael Z. Sangeda1*
 Maganga Bundala2
 Sonia Mkumbwa2
 Adonis Bitegeko2
 Hiiti B. Sillo3
 Adam M. Fimbo2
 Mhina Chambuso4
 Erasto V. Mbugi5
- 1Department of Pharmaceutical Microbiology, School of Pharmacy, Muhimbili University of Health and Allied Sciences, Dar es Salaam, Tanzania
- 2Tanzania Medicines and Medical Devices Authority, Dar es Salaam, Tanzania
- 3Regulatory Systems Strengthening Team, Regulation and Safety Unit, World Health Organization, Geneva, Switzerland
- 4Department of Pharmacy, Kampala International University in Tanzania, Dar es Salaam, Tanzania
- 5Department of Biochemistry, School of Medicine, Muhimbili University of Health and Allied Sciences, Dar es Salaam, Tanzania
Introduction: The increase in antimicrobial consumption contributes to the emergence of antimicrobial resistance (AMR). Many studies have investigated the patterns of antibacterial consumption and antibacterial resistance. However, there is a paucity of data on the utilization of antivirals and antifungals in low and middle-income countries to serve as a baseline for monitoring and surveillance of AMR. Therefore, this study determined Tanzania’s systemic antifungal and antiviral utilization trends from 2010 to 2017, based on the Tanzania Medicines and Medical Devices Authority (TMDA) medicine importation archives.
Methodology: An analytical, longitudinal retrospective survey covering 2010 to 2017 was conducted. The study utilized the Anatomical Therapeutic and Chemical (ATC) classification and Defined Daily Dose (DDD) developed by the World Health Organization (WHO) Collaborating Centre for Drug Statistics and the WHO Collaboration Centre for International Drug Consumption Monitoring. Human medicine importation data were collected from TMDA headquarters and used to assess the systemic antiviral and antifungal consumption trends. The importation data included the date, generic name, strength, brand name, currency, quantity, ATC classification, supplier country, port of entry and product supplier. The data were cleaned, reorganized and analyzed. Reference was made to the latest revised DDD list to assign antifungals and antivirals to their respective ATC/DDDs and then adjusted to the population estimates from the National Bureau of Statistics of Tanzania.
Results: There was a high proportion of systemic antivirals and antifungals utilization with 367.1 and 10.8 DDD per 1000 inhabitants per day (DID) respectively over eight years. In regression model, there was a significant increase in both antiviral (p-value = 0.043) and antifungal (p-value = 0.015) agents’ utilization trends in Tanzania in the study period. Fluconazole had the highest proportion of utilization for antifungals, followed by ketoconazole, itraconazole, miconazole and amphotericin B. For systemic antivirals, a high proportion was attributed to antiretrovirals used for HIV infections.
Conclusion: Findings from this study suggest an increase in the utilization of systemic antiviral and antifungal agents. These findings may be used to further benchmark utilization and AMR studies in Tanzania.
Introduction
Antimicrobial agents in their physical or chemical form can kill or inhibit the growth of microorganisms such as viruses, bacteria, fungi and parasites, helping as an essential tool to fight the spread and harm of these infections. Nevertheless, their practical use is currently limited due to the emergence and spread of resistant strains of microorganisms (1). Antimicrobials resistance (AMR) is a severe threat to public health (1) because it reduces the effectiveness of treatment of many infectious diseases, including HIV, tuberculosis, malaria, gonorrhoea, and hospital-acquired infections (HAIs) such as pneumonia, urinary tract infection (UTI) (2) and septicemia. AMR has disseminated much in hospitals and other healthcare settings and affected the community. AMR causes illness prolongation and a more extended period of infectivity due to failure to respond to standard therapy, increases financial burden that necessitates to switch to more expensive medicines and extending hospitalization of patients. In addition, AMR increases morbidity and mortality rates due to treatment failure (3). Globally, the use and overuse of antimicrobial agents are blamed for exacerbating the extent of AMR (1). However, studies examining how antivirals and antifungals’ consumption affects drug resistance among patients treated with these agents are scarce. Similarly, studies correlating the trend of consumption and increase of drug resistance are scanty. The available literature on antimicrobial utilization bears testimony on concerns about the appropriate use of these agents (1, 4–6).
Many antiviral agents are currently available for clinicians to target the therapeutic response than was previously possible. These agents are used in the treatment of diseases caused by herpes simplex virus (HSV), hepatitis C virus (HCV), hepatitis B virus (HBV), varicella-zoster virus (VZV), cytomegalovirus (CMV), influenza virus, and human immunodeficiency virus-1 (HIV-1) among others. However, the increasing utilization of antivirals has led to antiviral resistance, particularly in immune-compromised persons taking antiviral medicines for prolonged periods (7). Antiviral drug pressure can select for the emergence of resistant viral isolates by conferring a survival advantage to those subpopulations relatively less susceptible to the antiviral agent. Alternatively, spontaneous mutations occur in the course of treatment (7). Antiviral resistance is less common than antibiotic resistance but does occur, especially in viruses such as HIV and influenza viruses prone to rapid mutations (1). In viruses, acquired drug resistance results from drug selection pressure, while transmitted resistance is passed from person to person. Viral drug resistance is due to the development of non-polymorphic mutations, which are rarely seen in patients who are naïve to treatment (8). The ongoing emergence and re-emergence of new viral infections have increased the demand for new antiviral agents (9, 10). For HIV, the current use of combined antiretroviral therapy (cART) was essential to block viral replication and transmission and improved the quality of life in people living with HIV (PLHIV).
Nevertheless, cART introduced a new problem of HIV drug resistance (HIVDR). The countries in sub-Saharan Africa (SSA) that benefitted from the recent roll-out of cART are currently facing more levels of HIVDR than other regions of the World (11, 12). Levels of HIVDR resistance are reportedly decreasing in Europe (13), but on the contrary, in SSA, the levels are increasing and raising significant concerns (11).
In addition to cART, HIV patients also use antimycotics for prophylaxis (14) and antifungal resistance is also likely to develop in these individuals (15). Resistance to antifungals is worrisome, particularly to immunocompromised people who are more vulnerable to fungal infections (16). In addition, the availability of most fungistatic antifungals in clinical use often led to the development of antifungal resistance due to the emergence of multidrug resistance (MDR) variants with higher tolerance to medicines.
The increase in the consumption of antiviral and antifungal agents creates a conducive environment to the increased selection of resistant viral and fungal strains that can persist in the population (17–19). The extent of the emergence of resistance is attributed to antimicrobial consumption volumes (17). Therefore it is crucial to assess antimicrobials utilization to understand the epidemiology of resistance (20, 21). Antimicrobial stewardship (AMS) to monitor and direct the appropriate use of antimicrobial agents to achieve the best clinical outcomes and minimize selective pressure and adverse events is already in place in some countries (22). The Tanzania National Action plan for AMR and AMS was launched in 2017 (23, 24).
Studies from high-income countries show the trend of antivirals (4, 5) and antifungals (4, 25–27) at varying rates. These studies investigated the utilization of antivirals and antifungals to evaluate the correlation between their usage and the emergence and spread of resistance within an individual country or region (28). However, similar studies tracking the trends antimicrobial consumption lack in low-middle income countries (LMIC). Nevertheless, there is an increasing scale-up of cART and antifungals in LMICs. For instance, in 2015, the Tanzania national guideline for the management of HIV and AIDS reported that 21%-30% of PLHIV in Tanzania have registered in care and treatment clinics (CTC) and 69% of eligible adults were receiving antiretroviral (ARVs) (29). Therefore, utilization studies are required in LMICs to guide AMS programs and curb the AMR problem.
To conduct medicine utilization studies, both a classification system and a universal unit of measurement are needed. To overcome the use of traditional measurement units as a comparative unit, a technical measurement called the Defined Daily Dose (DDD) had gained popularity in medicine utilization studies (30–32). In 1996, the World Health Organization (WHO) recognized the need to develop the Anatomical Therapeutic Chemical (ATC) classification system and the DDD system to allow international standardization in utilization studies. Such a system allowed close integration of international medicine utilization studies and WHO’s initiatives to accomplish rational use and universal access to essential medicines, particularly in LMICs. The ATC/DD system helps audit utilization trends, recognize problems, learn, and monitor intercessions (32). The ATC system aggregate medicine by the organ or system it acts on and per its therapeutic, pharmacological and chemical properties (33). The DDD unit is normally linked to the ATC code. The DDD is the presumed average maintenance dose per day for a medicine’s main indication in adults. The DDD is thus a technical unit of use and not referred to as the recommended dose.
The WHO ATC/DDD methodology enables the uniform comparison of antimicrobials utilization statistics at international, national and regional categories without regard to the nomenclature of medicines’ brand and generic name, pack size, price, quantity and dosage form (34).
This study’s objective was to assess the consumption trend of antifungals and antivirals in Tanzania using the WHO methodology based on human medicine importation data from 2010 to 2017. Understanding the rate of consumption and distribution of antivirals and antifungals per person helps identify areas with a high threat of emergence and spread of AMR. Furthermore, the results from this study help to bring awareness of variation of antivirals and antifungals consumption, which serves as a baseline in the AMS program. In addition, it will be used in the surveillance and monitoring of systemic antivirals and antifungals resistance in Tanzania by comparing the consumption trends with the reported levels of antivirals and antifungals resistance trends in Tanzania and abroad.
Materials and Methods
Study Design
A retrospective, longitudinal analytical study was conducted, which involved assessing consumption trends of standard DDD of antivirals and antifungals from the importation data on human medicine imported from 1st January 2010 to 31st December 2017 in Tanzania mainland.
Study Setting
This study survey was carried in The United Republic of Tanzania, which is found within latitude 6.3690° S and longitude is 34.8888° E. Eight countries border the country except in the eastern part, which is bordered by a water body, the Indian Ocean. The country is bordered by Uganda in the north, with Malawi and Mozambique occupying the southern border. Zambia borders Tanzania on the southwest border and Kenya in the northeastern part. The country is bordered by The Democratic Republic of Congo, Rwanda, and Burundi on the western border. Apart from sea harbors and airports, imported medicines enter the country through any or a combination of these borders as key entry points depending on the source of particular imported medicine. Dar es Salaam (6.7924° S, 39.2083° E) airports and sea harbor remain the major ports of entry of imported medicines to Tanzania. Other key entry points include Kilimanjaro airport (3.4245° S, 37.0651° E) border checkpoints at Sirari (1.2512° S, 34.4763° E), Horohoro (6.369° S, 34.8888° E), Namanga (Kenya border), Tunduma (9.3096° S, 32.7689° E) in the Zambia border and Mutukula (1.0007° S, 31.4156° E) on the Uganda border (35).
Data Sources
Tanzania Medicines and Medical Devices Authority (TMDA) is a regulatory authority responsible for importing all medicines and medical devices and medicines, including antivirals and antifungals, imported for human use into Tanzania’s mainland. The survey, therefore, used the data from TMDA importation records collected and captured from different entry ports, covering the Tanzania airports, border checkpoints at Sirari, Horohoro, Namanga, Tunduma, Mutukula and the seaport in Dar es Salaam.
Antivirals and Antifungals Studied
Only imported antivirals and antifungals from data points with complete records during the study period were included in the study. The study excluded all data points whose records were not complete during the study period.
Exclusion Criteria
Records were excluded from the analysis if the dosage form was lotions, cream, ointment and shampoos. The study aimed to assess utilization trends of systemic antifungals and antivirals.
Records without permit numbers, reference numbers, or permit issue dates were also excluded because, for these, the importation year could be derived to be included in the analysis.
Data Collection
TMDA, a medical products regulatory authority regulating and approving the importation of medicines into the Tanzania mainland market, permitted data extraction from the importation database. This data can help control importation and self-monitoring and evaluation of trends in medicine utilization. The importation procedure set up by TMDA compels importers to apply for an importation permit at TMDA. The reliability of the data is based on the fact that all importations are done only when successful applications receive import permits and then recorded in the TMDA’s Management Information System (MIS).
The importation data collected included the date, generic and brand name of medicine, strength, category human, quantity, ATC class, company (suppliers or importer), price, currency, product manufacturer and country of origin.
Data were adjusted to the WHO Anatomical Therapeutic Classification (ATC) system and expressed as many Defined Daily Dose (DDD) measurement units. Utilization was expressed in DDD per 1000 inhabitants per day (DID). Antiviral and antifungal substances were grouped according to their main indication. In ATC/DDD system, medicines are classified at five different levels. Level 1 indicates the leading anatomical group and consists of one letter, while level 2 denotes the pharmacological or therapeutic subgroups. For instance, J02 is antibacterial for systemic use, J02 antimycotics and J05 antivirals for systemic use. Level 3 denotes the chemical/pharmacological subgroups. For example, the code J05A is direct-acting antivirals, while level 4 denotes the pharmacological subgroup. For instance, J05AE is for protease inhibitors. At the top, level 5 denotes the chemical substance or active ingredient of the medicine. For example, J05AE01 is saquinavir and J05AE02 is indinavir (33, 36). WHO has assigned ATC codes and mapped them to their respective DDD values for antivirals and antifungals (32). For instance, the ATC code at level 5 for nevirapine is J05AG01 and its DDD is 0.4g (Supplementary Table 1).
The total grams of the medicines utilized were quantified by grouping the total amounts of active ingredients across the various formulations, accounting for the different strengths, dosage forms, and pack sizes.
We calculated the DDD of each antiviral or antifungal using the formula (33, 37), where the total amount consumed in grams is divided by the DDD of antimicrobial in grams. Reference was made to the DDD list available at www.whocc.no. The amounts in defined daily doses/1000 inhabitants-day were determined for each drug, and the overall amount was determined using the equation,
Reference was made to population estimates from the Tanzania Bureau of Statistics (TBS) to adjust the antivirals and antifungals consumption trends in relation to the country population (Supplementary Table 2).
Data Cleaning and Analysis
Years were imputed from dates or inferred from the reference provided with the proforma number where the date was missing. Data cleaning was done, and data were checked for accuracy, completeness and reliability before analysis. Data files for each antimicrobial were combined in one file. Microsoft Excel 2013 (Microsoft Corporation, Redmond, Washington, USA) was used for data storage, pivoting and aggregating the combined data. First, the strength, pack size and the quantity of the antimicrobial product in mg, g and kg were re-calculated from the product description. Then, generic names were harmonized to match the names in the ATC classification map file. We assigned each product an equivalent ATC code by corresponding it with the imported product’s generic name. Doing this allowed the matching of the ATC category and the pharmaceutical category. The amount in mg and DDD of an antimicrobial agent’s active ingredient was calculated and aggregated for each class collected. Tables and graphs were plotted to depict the trends in antimicrobial utilization. Annual utilization data, aggregated per overall and ATC class consumption, were entered into the Statistical Package for the Social Sciences (SPSS) version 20 (IBM Corp., Armonk, NY, USA). Time series and regression analyses were performed to establish the annual trend of antimicrobial utilization. An autoregressive integrated moving average (ARIMA) model was established to forecast the trends of antimicrobials. A p-value of less than 0.05 was considered statistically significant.
Ethical Considerations
The Muhimbili University of Health and Allied Sciences Research Ethics Committee issued ethical clearance for this study with reference number DA.25/111/05/03/2018. Permission to access the data was sought at the TMDA. The names and identifiers of the importer were not analyzed to maintain anonymity.
Results
There were 4,605 records of antivirals and antifungals importation from 2010 to 2017, where only 1,369 antifungals and 1,905 and antivirals were analyzed, making a total of 3,274 records. One thousand three hundred thirty-one records were excluded from the analysis because they were not for systemic use or had no valid permit number and issue dates.
The annual distribution of systemic antivirals in Tanzania between 2010 and 2017 with their total amount in kg and the yearly distribution of utilized systemic antivirals and antifungals in a defined daily dose per 1000 inhabitant per day (DID) in (Table 1) show an increasing trend over the years.

Table 1 Total amount of systemic antivirals and antifungals utilized over eight years from 2010 to 2017 in Tanzania.
Based on the administration route, there was a large consumption of oral antivirals (99.99% of antivirals’ DIDs) compared to parenteral antivirals (0.001%). Oral antifungals constituted 50.862% of antifungals compared to parenteral antifungals (49.138%) (Figure 1). Tablets contributed the most utilized dosage form for antivirals and antifungals, accounting for 367.06 and 4.35 DIDs. Injections, capsules, pessaries, syrup solutions contributed to a lesser extent of antivirals and antifungals for systemic use (Table 2).
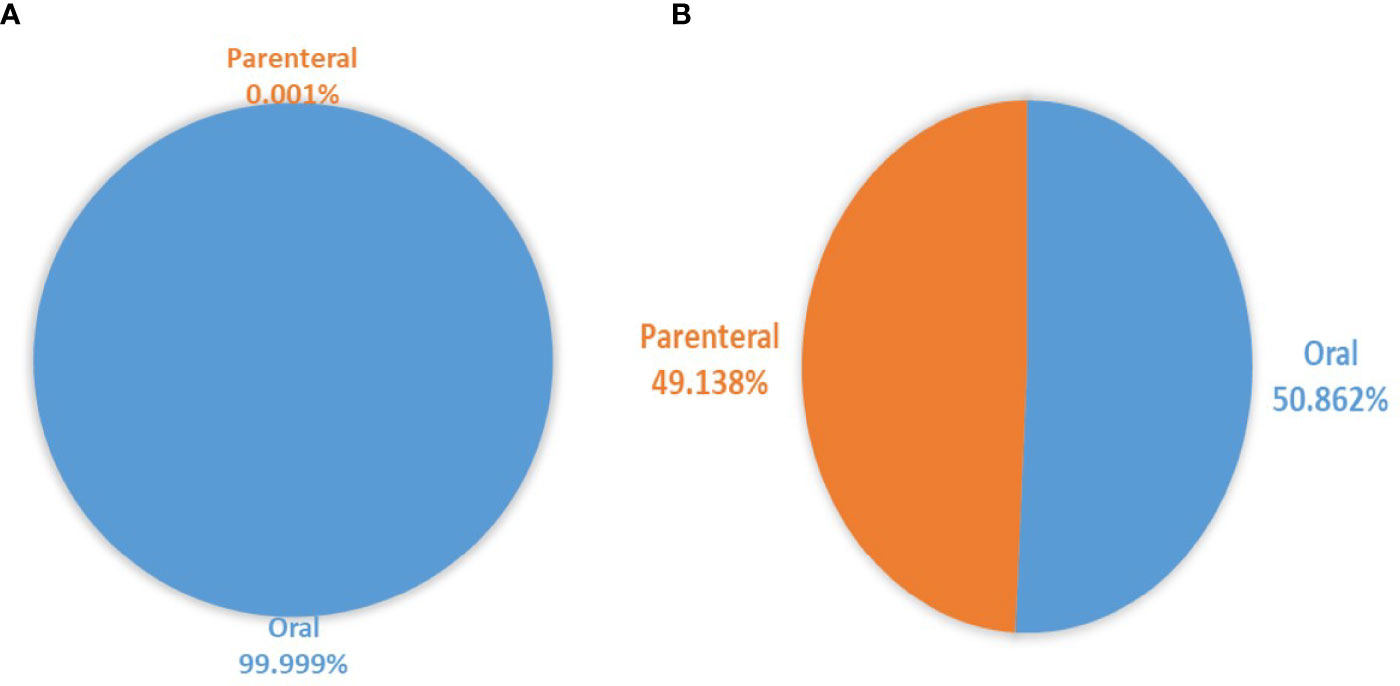
Figure 1 Proportion of parenteral and oral dosage forms for (A) systemic antivirals and (B) systemic antifungals utilized over eight years.

Table 2 Total amount of systemic antivirals and antifungals per dosage form utilized over eight years from 2010 to 2017 in Tanzania.
Considering level 4 ATC classification, the antivirals for treatment of HIV infections, combinations (J05AR) were highly utilized, followed by non-nucleoside reverse transcriptase inhibitors (J05AG), reverse transcriptase inhibitors (J05AF), protease inhibitors (J05AE), other antivirals (J05AX) and lastly, neuraminidase inhibitors (J05AH). Antivirals contributed a total of 352.2 DIDs (95.9%) to treat HIV infection (Table 3).
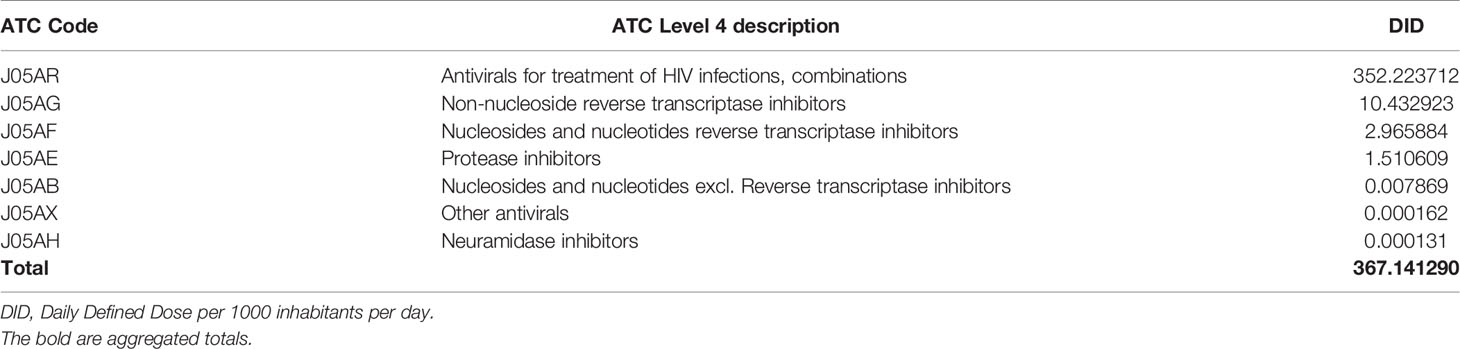
Table 3 ATC level 4 of systemic antivirals distribution in DID.
On analyzing the utilization of systemic antifungals according to ATC level 4 classification, the triazole derivatives (J02AC) were found to have greater utilization followed by far margins by imidazole derivatives (J02AB) and small amounts of antibiotics (J02AA) (Table 4).
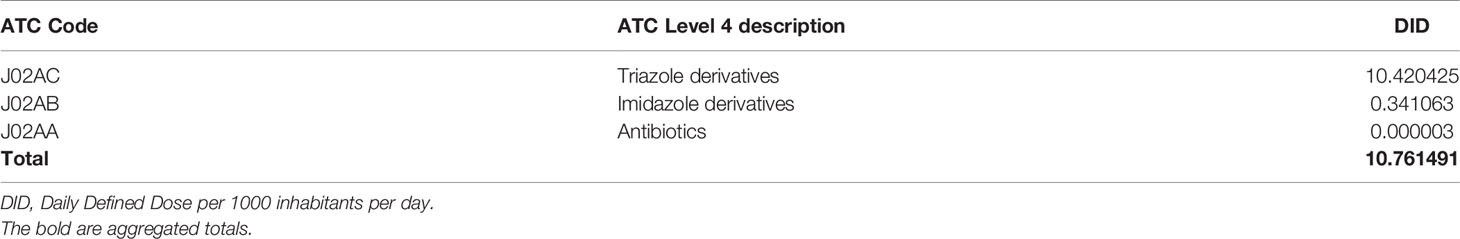
Table 4 ATC level 4 distribution of systemic antifungals distribution in DID.
Further analysis of the utilization of the major groups of systemic antivirals for the treatment of HIV infections, the combinations group (J05AR) at the chemical level (level 5 ATC classification) showed a significant increase of utilization over time compared with the remaining groups. Other groups showed very minimal variations over time (Figure 2). The most utilized antiretroviral in the study period was the combination of lamivudine, tenofovir and efavirenz (J05AR11), for which 154.0 DIDs, mostly 88.3 DIDs in 2017 were consumed (Figure 2 and Supplementary Table 3. Three other ARV combinations noted with the most regular consumption trends were J05AR12 (lamivudine and tenofovir disoproxil), which decreased consumption patterns from 2014 to 2017. J05AR05 (zidovudine, lamivudine and nevirapine) and J05AR01 (zidovudine and lamivudine) displayed a similar consumption trend, as they both showed the increased consumption pattern from 2010 to 2014, decreased in 2015 and 2016 then increased in 2017.

Figure 2 Variation of amounts of antivirals utilized for treatment of HIV infections, combinations (class J05AR) from 2010-2017. (A) shows the top six utilized antivirals and (B) the bottom five utilized antivirals in the pharmacological group J05AR.
There was an increase in utilizing the major systemic antifungals belonging to the triazole derivatives group (J02AC). In contrast, the imidazole derivatives and antibiotics did not follow such a trend as the utilization decreased over time (Figure 3). For the triazole derivatives, fluconazole was observed to have an increased utilization pattern from 2010 to 2012, decreased in 2013, then increased again from 2014 to 2017. On the other hand, itraconazole showed irregular patterns of utilization (Figure 3 and Supplementary Table 3).

Figure 3 Variation of amount of triazole derivatives; fluconazole (J02AC01) (A) and itraconazole (J02AC02) and imidazole derivatives; miconazole (J02AB01) and ketoconazole (J02AB02) (B).
The ARIMA model could significantly predict the increase in utilization and forecast the trends of antivirals and antifungals up to the period 2022. For antivirals (Figure 4), the model estimated that by 2022, the total antimicrobials consumed would reach 231.7 DIDs (Supplementary Table 4). This increase corresponds to about a 1500-fold increase compared to the year 2010.

Figure 4 Trends of total consumed antivirals from 2010 to 2017. Periods one to eight correspond to the year 2010 - 2017. The linear curve estimation for (A) overall consumption of antivirals shows an increasing trend, (B) The autoregressive integrated moving average (ARIMA, 0,1,0) model forecasted the utilization to the year 2022.
For antifungals (Figure 5), the model estimated that by 2022, the total antimicrobials consumed would reach 3.6 DIDs (Supplementary Table 5). This increase corresponds to about a thirteen-fold increase compared to the year 2010.

Figure 5 Trends of total consumed antifungals from 2010 to 2017. Periods one to eight correspond to years 2010 - 2017. The linear curve estimation for (A) overall consumption of antifungals shows an increasing trend, (B) The autoregressive integrated moving average (ARIMA, 0,1,0) model forecasted the utilization to the year 2022.
India supplied most antivirals and antifungals in Tanzania, which contributed 373.4 DIDs (98.8%). The Netherlands and Kenya contributed about 1.0% and other remaining countries 0.2% of all antivirals and antifungals in Tanzania from 2010 to 2017 (Table 5).
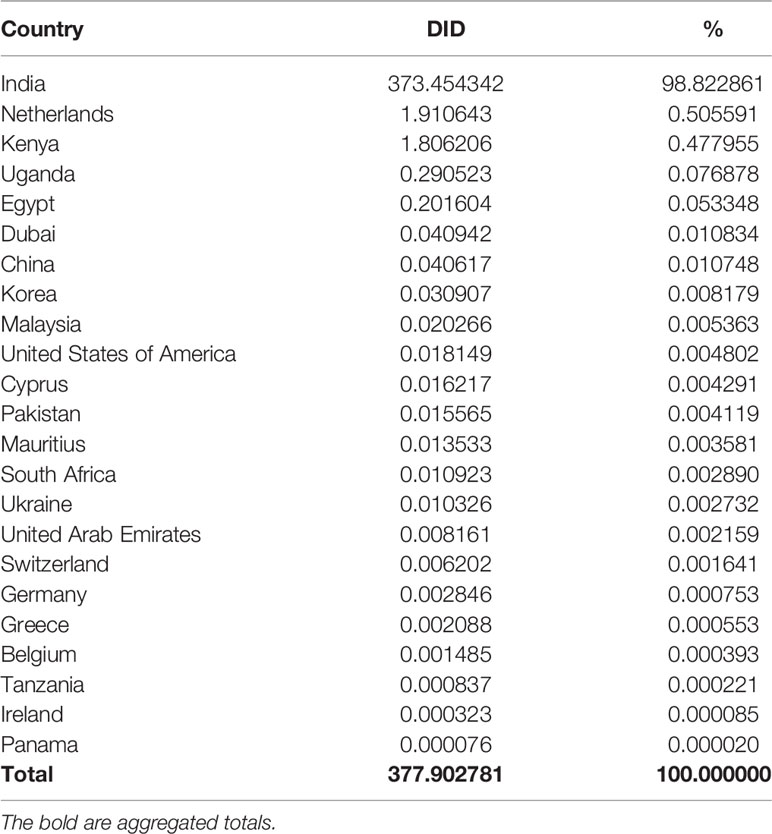
Table 5 Contribution of countries supply to the utilization of antivirals and antifungals from 2010 t0 2017.
Discussion
To the best of our knowledge, this is the first study that seeks to assess the trends in utilizing systemic antiviral and antifungal agents in Tanzania. This study’s findings highlight an increase in the utilization of systemic antiviral and antifungal agents.
The amount of antivirals utilization varied dramatically between years. Our study demonstrates a wide variation of total systemic antiviral utilization with a total of 377.9 DDD/1000 inhabitants per day (DID) over eight years. Higher volumes of utilization were contributed mainly by the combinations of antivirals to treat HIV infections, class J05AR of systemic antivirals with an average consumption of 44.0 DIDs per year. Higher consumption might seem appropriate because the class includes the drug combinations, which are the first-line, cART regimens for the treatment of HIV.
The increase of J05AR11 (lamivudine + tenofovir disproxil + efavirenz) and J05AR12 (lamivudine + tenofovir disproxil) was observed from 2014 suggests the peak of the switch to triple therapy due to failure of a monotherapy ARV-regimen in treating HIV. Thus, to overcome HIVDR, several drugs were combined to treat HIV-infected patients. This switch from mono to triple therapy was justified because the viral populations are less likely to develop mutations to all three drugs (38, 39).
Comparative studies for antivirals were done elsewhere in Europe to assess the total systemic antiviral use and reveal the trending antivirals in use. In that study, 12 countries provided inpatient and outpatient data from Belgium, Croatia, Estonia, Finland, France, Denmark, Hungary, Italy, Luxembourg, Russia, Slovenia, and Sweden. Austria, the Netherlands, Portugal and Norway provided outpatient data only. In that study, the total systemic antiviral utilization was highest in France with the highest DID (3.53) and the lowest in Croatia with the lowest DID (0.32) utilization. CART represented more than half of the total antivirals use utilized in these countries. Similar to the European investigation, our study also indicated that the variation was mainly determined by antivirals used in cART (5). The average rates of DIDs in Tanzania are much higher (44.0) than those observed in the European countries due to the high number of HIV-infected patients in Tanzania and other sub-Saharan countries.
Systemic antifungal agents represent a tiny proportion of antimicrobial agents in our study. The average amount of systemic antifungals consumption was 1.3 DID per year. The trend showed more significant variation among groups with the triazole derivatives (J02AC), leading to an average of 1.3 DID. In our study, fluconazole showed a large proportion of the average amount of 95.1% of consumption, itraconazole with 1.7%, ketoconazole with 1.6% and miconazole (1.5%) with a minimal amount of amphotericin B. This high predominance of fluconazole consumption amount is a potential quality indicator due to its potency. Fluconazole use reportedly persists unchanged even after new antifungal agents are released on the market. Its wide use may have therefore created a considerable variation observed in our study (40). Higher utilization of fluconazole has been noted in Spain and Germany (41, 42). In a study in Belgium, one of the biggest antifungal consumers in Europe, antifungal consumption was dominated by prescriptions of fluconazole and itraconazole in ambulatory care. However, in Belgium, the use of itraconazole decreased over time (43).
Our results alone may not allow us to conclusively conclude that the increase in consumption of some antiviral and antifungal agents was accounted for by inappropriate prescription. This is because this study is rather quantitative and not a qualitative study. Nevertheless, the increasing magnitude of consumption may raise questions over the appropriateness of use. Both quantitative and qualitative records of antiviral and antifungal agent use are essential to evaluate the impact of antimicrobial policy and determine possible correlations between certain groups of antimicrobial agents and the emergence of resistance. Our study uncovered a higher proportion of systemic antivirals and antifungals consumption that may increase the selection pressure of antiviral and antifungal agents. In addition, some studies noted an increased level of resistance with systemic administration of antimicrobials (44). Therefore, antimicrobial surveillance and stewardship must be taken into consideration in situations like this.
The increasing trend of fluconazole as antifungal and the increase in the combination of lamivudine, tenofovir disoproxil and efavirenz, and zidovudine, lamivudine, and nevirapine for HIV treatment coincides with the scaling of combination antiretroviral therapy that happened in the decade within most SSA countries, including Tanzania.
In 2012, a similar study was conducted in 25 European countries reporting data on the utilization of antifungals for systemic use in the community. The utilization in Europe varied by country, ranging from 0.46 DDD per 1000 inhabitants per day in Malta to 3.32 DDD per 1000 inhabitants and per day in Belgium. In the 2012 study (4), terbinafine, ketoconazole, fluconazole and itraconazole contributed up 98% of the total utilization of antifungals. In that study, the total population-weighted mean consumption of antivirals was 2.1 DDD per 1 000 inhabitants per day. The utilization ranged from 0.14 DDD per 1000 inhabitants per day in Malta to 4.65 DDD per 1000 inhabitants per day in Portugal (4, 6). The population-weighted mean consumption was the highest for antivirals treating HIV infections, combinations at 0.74 DDD per 1 000 inhabitants per day. The population-weighted mean consumption of antiretrovirals accounted for 66% of antivirals’ total consumption for systemic use in these countries (4). In 2012, the antifungal utilization in Tanzania was 1.3, comparable to some countries in Europe, during the same study period (4).
In a multicenter prevalence study from Korea, there were significant correlations between fluconazole-resistant candida strains and the utilization of fluconazole and total antifungal agents (25). In Italy, resistance to fluconazole was also found in association with increased use (26). In Brazil, there was an increase in the consumption of liposomal amphotericin B, micafungin and voriconazole (27). However, these antifungal agents used in Brazil were not recorded in Tanzania.
Another study similar to the current was done in Europe in the European Surveillance of Antimicrobial Consumption project to investigate the systemic antifungals utilization using the Anatomical Therapeutic Chemical (ATC) classification in 2009 (6). Data constituted 12 antimycotics and two antifungals for systemic use aggregated at the level of the active substance from 24 countries. The study reported results in DDD per 1000 inhabitants per day (DID) and packages per 1000 inhabitants per day (PID). The DID ranges from 0.38 in Romania to 3.24 in Belgium for outpatient antimycotic and antifungal use. For countries reporting using PID, the range was 0.08 in Sweden. Terbinafine was the most used substance in the majority of countries, followed by fluconazole. In our study, the most utilized antifungal was fluconazole.
Further, 18 European countries reported antifungal consumption for systemic use in the hospital sector, with a population-weighted mean consumption of 0.14 DDD per 1000 inhabitants per day. Utilization ranged from 0.03 to 0.2 DDD per 1000 inhabitants per day in Lithuania and Denmark. Amphotericin B and fluconazole contributed 71% of the total utilization of antifungals for systemic use in the hospitals in these countries. As a proportion of the total, fluconazole consumption varied from 22% in France to 74% in Latvia. Fluconazole made up more than 50% of the total consumption in 11 (61%) countries studied (4). In our study, fluconazole contributed to 95.1% of all antifungals utilized in 8 years.
The current study assumed that almost all of the medicines imported were utilized in Tanzania. The assumption was anchored on the fact that the Medical Stores Department (MSD) contributes at least 80% of all imported antiviral and antifungal agents (45). MSD is an autonomous department of the Ministry of Health, Community Development, Gender, Elderly and Children (MoHCDGEC) established by the Tanzania Act of Parliament of 1994. The department oversees procurement, storage and distribution of medicines and supplies to all public health facilities in Tanzania. Usually, the health facilities order items from MSD, the medicines are utilized in the destination facilities. The facilities record their average consumption estimates before the next cycle of medicines orders to ensure minimal stock-outs. This is the reason for the need for a proper inventory control mechanism in hospitals. In the same thinking, the community medicine outlets should also ensure minimal expiry of stocked medicines.
It is worth noting that although increased antimicrobial consumption causes antimicrobial resistance, other factors may also need to be taken into account. Some of these factors include pressure on general practitioners to prescribe antimicrobials, even when they are not needed, patient failure to adhere and complete their entire course of treatment, heavy use of antimicrobials in hospitals and over-the-counter access antimicrobials in many countries (7, 38).
In 2012 a study involving 30 European countries in the European Antimicrobial Resistance Surveillance Network (EARS-Net) assessed the utilization trend of antimicrobials. It investigated a relationship with the increase in antimicrobial resistance (4). Twenty-four countries reported data to ESAC-Net on antivirals for systemic use (ATC group J05). Austria, the Czech Republic, Germany, Hungary and the Netherlands only reported data on antivirals’ consumption for systemic use (ATC group J05) in the community. Our study used data from one country, paving the way for similar studies across sub-Saharan Africa, where such studies are scanty.
For an accurate recording of medicine utilization, there is a need to develop a population-based pharmaceutical prescription database where all prescription information for all prescriptions will be stored. Such databases will capture the drug dispensed in the healthcare facilities and the community medicine outlets. This will facilitate accurate medicine utilization studies and aid the antimicrobial stewardship and surveillance programs (23).
Limitations
The assumptions for using this data are that all imported medicines are used and that all medicines are imported through the normal legal pathway regulated by TMDA (36). Also, it assumes that proper inventory control measures are taken to ensure no expiry and losses at the warehouse or pharmacy, implying that almost all imported antimicrobials are utilized.
The standard method for estimating and evaluating antimicrobial consumption data would be from the community outlets and hospital pharmacies’ prescription records. However, these outlets are ubiquitous and cannot be readily accessed electronically. The lack of sales data of all outlets in the country limits Tanzania’s antimicrobial utilization assessment.
Conclusion
There has been an increase in the utilization of systemic antiviral and antifungal agents, as reflected by the trends from 2010 to 2017, which may correspond to the scaling of the combination antiretroviral therapy in the decade.
However, this study should be considered a baseline for further studies, including the local manufacturers’ records and export reports, as some imported medicines may be exported to other countries. We recommend the development of a population-based prescription database for antimicrobials utilized in the country. This will facilitate the easy gathering of information and accurate utilization of antiviral and antifungal agents.
Data Availability Statement
The raw data supporting the conclusions of this article will be made available by the authors, without undue reservation.
Ethics Statement
Ethical clearance for this study was issued by the Muhimbili University of Health and Allied Sciences Research Ethics Committee with reference number DA.25/111/05/03/2018. Permission to access the antifungal and antiviral utilization Tanzania data was sought at the TMDA. The names and identifiers of the importer were not analyzed to maintain anonymity.
Author Contributions
All authors listed have made a substantial, direct, and intellectual contribution to the work and approved it for publication.
Conflict of Interest
The authors declare that the research was conducted in the absence of any commercial or financial relationships that could be construed as a potential conflict of interest.
Publisher’s Note
All claims expressed in this article are solely those of the authors and do not necessarily represent those of their affiliated organizations, or those of the publisher, the editors and the reviewers. Any product that may be evaluated in this article, or claim that may be made by its manufacturer, is not guaranteed or endorsed by the publisher.
Acknowledgments
We thank the Tanzania Medicines and Medical Devices Authority staff for their assistance in retrieving the antivirals and antifungals importation data.
Supplementary Material
The Supplementary Material for this article can be found online at: https://www.frontiersin.org/articles/10.3389/fitd.2021.723991/full#supplementary-material
References
1. Austin DJ, Kristinsson KG, Anderson RM. The Relationship Between the Volume of Antimicrobial Consumption in Human Communities and the Frequency of Resistance. Proc Natl Acad Sci USA (1999) 96:1152–6. doi: 10.1073/pnas.96.3.1152
2. Sangeda RZ, Paul F, Mtweve DM. Prevalence of Urinary Tract Infections and Antibiogram of Uropathogens Isolated From Children Under Five Attending Bagamoyo District Hospital in Tanzania: A Cross-Sectional Study. F1000Research (2021) 10:449. doi: 10.12688/f1000research.52652.1
3. Poyongo BP, Sangeda RZ. Pharmacists’ Knowledge, Attitude and Practice Regarding the Dispensing of Antibiotics Without Prescription in Tanzania: An Explorative Cross-Sectional Study. Pharmacy (2020) 8:238. doi: 10.3390/pharmacy8040238
4. ECDC. Surveillance of Antimicrobial Consumption in Europe 2012. Stockholm: ECDC (2014). doi: 10.2900/32937
5. Adriaenssens N, Coenen S, Kroes ACM, Versporten A, Vankerckhoven V, Muller A, et al. European Surveillance of Antimicrobial Consumption (ESAC): Systemic Antiviral Use in Europe. J Antimicrob Chemother (2011) 66:1897–905. doi: 10.1093/jac/dkr190
6. Adriaenssens N, Coenen S, Versporten A, Goossens H. Outpatient Systemic Antimycotic and Antifungal Use in Europe: New Outcome Measure Provides New Insight. Int J Antimicrob Agents (2013) 42:466–70. doi: 10.1016/j.ijantimicag.2013.07.004
7. Kimberlin D, Whitley R. Antiviral Resistance: Mechanisms, Clinical Significance, and Future Implications. J Antimicrob Chemother (1996) 37:403–21. doi: 10.1093/jac/37.3.403
8. Tang MW, Shafer RW. HIV-1 Antiretroviral Resistance: Scientific Principles and Clinical Applications. Drugs (2012) 72:e1–25. doi: 10.2165/11633630-000000000-00000
9. Lou Z, Sun Y, Rao Z. Current Progress in Antiviral Strategies. Trends Pharmacol Sci (2014) 35:86–102. doi: 10.1016/j.tips.2013.11.006
10. Bean B. Antiviral Therapy: Current Concepts and Practices. Clin Microbiol Rev (1992) 5:146–82. doi: 10.1128/CMR.5.2.146
11. Boerma RS, Sigaloff KCE, Akanmu AS, Inzaule S, Boele van Hensbroek M, Rinke de Wit TF, et al. Alarming Increase in Pretreatment HIV Drug Resistance in Children Living in Sub-Saharan Africa: A Systematic Review and Meta-Analysis. J Antimicrob Chemother (2017) 72:365–71. doi: 10.1093/jac/dkw463
12. World Health Organization. HIV Drug Resistance Report 2019 (2019). Who. Available at: https://www.who.int/publications/i/item/WHO-CDS-HIV-19.21 (Accessed August 19, 2021).
13. Vercauteren J, Deforche K, Theys K, Debruyne M, Duque LM, Peres S, et al. The Incidence of Multidrug and Full Class Resistance in HIV-1 Infected Patients Is Decreasing Over Time (2001-2006) in Portugal. Retrovirology (2008) 5:12. doi: 10.1186/1742-4690-5-12
14. Bozzette SA. Fluconazole Prophylaxis in HIV Disease, Revisited. Clin Infect Dis (2005) 41:1481–2. doi: 10.1086/497380
15. Bongomin F, Oladele RO, Gago S, Moore CB, Richardson MD. A Systematic Review of Fluconazole Resistance in Clinical Isolates of Cryptococcus Species. Mycoses (2018) 61:290–7. doi: 10.1111/myc.12747
16. Ghannoum MA, Rice LB. Antifungal Agents: Mode of Action, Mechanisms of Resistance, and Correlation of These Mechanisms With Bacterial Resistance. Clin Microbiol Rev (1999) 12:501–17. doi: 10.1128/CMR.12.4.501
17. Rezasoltani S, Yadegar A, Hatami B, Asadzadeh Aghdaei H, Zali MR. Antimicrobial Resistance as a Hidden Menace Lurking Behind the COVID-19 Outbreak: The Global Impacts of Too Much Hygiene on AMR. Front Microbiol (2020) 11:590683. doi: 10.3389/fmicb.2020.590683
18. Van Boeckel TP, Gandra S, Ashok A, Caudron Q, Grenfell BT, Levin SA, et al. Global Antibiotic Consumption 2000 to 2010: An Analysis of National Pharmaceutical Sales Data. Lancet Infect Dis (2014) 14:742–50. doi: 10.1016/S1473-3099(14)70780-7
19. Enne VI. Reducing Antimicrobial Resistance in the Community by Restricting Prescribing: Can it be Done? J Antimicrob Chemother (2009) 65:179–82. doi: 10.1093/jac/dkp443
20. Lee HS, Loh YX, Lee JJ, Liu CS, Chu C. Antimicrobial Consumption and Resistance in Five Gram-Negative Bacterial Species in a Hospital From 2003 to 2011. J Microbiol Immunol Infect (2015) 48:647–54. doi: 10.1016/j.jmii.2014.04.009
21. Ahmad M, Khan AU. Global Economic Impact of Antibiotic Resistance: A Review. J Glob Antimicrob Resist (2019) 19:313–6. doi: 10.1016/j.jgar.2019.05.024
22. Hamdy RF, Zaoutis TE, Seo SK. Antifungal Stewardship Considerations for Adults and Pediatrics. Virulence (2017) 8:658–72. doi: 10.1080/21505594.2016.1226721
23. Sangeda RZ, Kibona J, Munishi C, Arabi F, Manyanga VP, Mwambete KD, et al. Assessment of Implementation of Antimicrobial Resistance Surveillance and Antimicrobial Stewardship Programs in Tanzanian Health Facilities a Year After Launch of the National Action Plan. Front Public Heal (2020) 8:454. doi: 10.3389/fpubh.2020.00454
24. Frumence G, Mboera LEG, Sindato C, Katale BZ, Kimera S, Metta E, et al. The Governance and Implementation of the National Action Plan on Antimicrobial Resistance in Tanzania: A Qualitative Study. Antibiotics (2021) 10:273. doi: 10.3390/antibiotics10030273
25. Kim SH, Shin JH, Kim E-C, Lee K, Kim M-N, Lee WG, et al. The Relationship Between Antifungal Usage and Antifungal Susceptibility in Clinical Isolates of Candida: A Multicenter Korean Study. Med Mycol (2009) 47:296–304. doi: 10.1080/13693780802291445
26. Mencarini J, Mantengoli E, Tofani L, Riccobono E, Fornaini R, Bartalesi F, et al. Evaluation of Candidemia and Antifungal Consumption in a Large Tertiary Care Italian Hospital Over a 12-Year Period. Infection (2018) 46:469–76. doi: 10.1007/s15010-018-1139-z
27. Marins TA, Marra AR, Edmond MB, Martino MDV, Yokota PKO, Mafra ACCN, et al. Evaluation of Candida Bloodstream Infection and Antifungal Utilization in a Tertiary Care Hospital. BMC Infect Dis (2018) 18:187. doi: 10.1186/s12879-018-3094-9
28. Kahlmeter G, Menday P, Cars O. Non-Hospital Antimicrobial Usage and Resistance in Community-Acquired Escherichia Coli Urinary Tract Infection. J Antimicrob Chemother (2003) 52:1005–10. doi: 10.1093/jac/dkg488
29. United Republic of Tanzania. National Guidelines for the management of HIV and AIDS in Tanzania. (2019). Available at: http://www.nacp.go.tz/download/national-guidelines-for-the-management-of-hiv-and-aids/ [Accessed September 28, 2021].
30. Atc. Guidelines for and DDD Assignment. 16th ed. Oslo: WHO Collaborating Centre for Drug Statistics Methodology Norwegian Institute of Public Health (2010).
31. Sataloff RT, Johns MM, Kost KM, Methodology WCC for DS. Guidelines for ATC Classification and DDD Assignment 2021. Available at: https://www.whocc.no/filearchive/publications/2021_guidelines_web.pdf (Accessed January 16, 2021).
32. World Health Organization. Guidelines for ATC Classification and DDD Assignment. (2021) Available at: https://www.whocc.no/filearchive/publications/2021_guidelines_web.pdf [Accessed January 16, 2021].
33. World Health Organization. WHO Regional Office for Europe Antimicrobial Medicines Consumption (AMC) Network (2020). Available at: https://www.euro.who.int/en/publications/abstracts/who-regional-office-for-europe-antimicrobial-medicines-consumption-amc-network.-amc-data-20112017-2020 (Accessed July 19, 2021).
34. Dukes MN. Drug Utilization Studies: Methods and Uses. (1993) Available at: https://apps.who.int/iris/bitstream/handle/10665/260517/9789289013086-eng.pdf?sequence=3&isAllowed=y [Accessed September 28, 2021].
35. Sangeda RZ, Baha A, Erick A, Mkumbwa S, Bitegeko A, Sillo HB, et al. Consumption Trends of Antibiotic for Veterinary Use in Tanzania: A Longitudinal Retrospective Survey From 2010-2017. Front Trop Dis (2021) 2:694082. doi: 10.3389/fitd.2021.694082
36. World Health Organization. Introduction to Drug Utilization Research. (2003). Available at: https://www.who.int/publications/i/item/8280820396 [Accessed July 12, 2021].
37. Kuster SP, Ruef C, Ledergerber B, Hintermann A, Deplazes C, Neuber L, et al. Quantitative Antibiotic Use in Hospitals: Comparison of Measurements, Literature Review, and Recommendations for a Standard of Reporting. Infection (2008) 36:549–59. doi: 10.1007/s15010-008-7462-z
38. Katusiime C, Ocama P. HIV Antiretroviral Drug Resistance. J AIDS Clin Res (2013) 1:2–5. doi: 10.4172/2155-6113.S5-002
39. Katusiime C, Ocama P, Kambugu A. Basis of Selection of First and Second Line Highly Active Antiretroviral Therapy for HIV/AIDS on Genetic Barrier to Resistance: a Literature Review. Afr Health Sci (2014) 14:679. doi: 10.4314/ahs.v14i3.25
40. Zarb P, Amadeo B, Muller A, Drapier N, Vankerckhoven V, Davey P, et al. Antifungal Therapy in European Hospitals: Data From the ESAC Point-Prevalence Surveys 2008 and 2009. Clin Microbiol Infect (2012) 18:E389–95. doi: 10.1111/j.1469-0691.2012.03973.x
41. Fondevilla E, Grau S, Mojal S, Palomar M, Matas L, Gudiol F. Consumption of Systemic Antifungal Agents Among Acute Care Hospitals in Catalonia (Spain), 2008–2013. Expert Rev Anti Infect Ther (2016) 14:137–44. doi: 10.1586/14787210.2016.1096776
42. Gross BN, Steib-Bauert M, Kern WV, Knoth H, Borde JP, Krebs S, et al. Hospital Use of Systemic Antifungal Drugs: A Multi-Center Surveillance Update From Germany. Infection (2015) 43:423–9. doi: 10.1007/s15010-015-0742-5
43. Goemaere B, Lagrou K, Spriet I, Hendrickx M, Vandael E, Becker P, et al. Systemic Antifungal Drug Use in Belgium—One of the Biggest Antifungal Consumers in Europe. Mycoses (2019) 62:542–50. doi: 10.1111/myc.12912
44. Zhang L, Huang Y, Zhou Y, Buckley T, Wang HH. Antibiotic Administration Routes Significantly Influence the Levels of Antibiotic Resistance in Gut Microbiota. Antimicrob Agents Chemother (2013) 57:3659–66. doi: 10.1128/AAC.00670-13
Keywords: antimicrobial, drug resistance, antiviral consumption, Tanzania, defined daily doses, antifungal, anatomical therapeutic and chemical classification, medicine utilization
Citation: Hamim H, Sangeda RZ, Bundala M, Mkumbwa S, Bitegeko A, Sillo HB, Fimbo AM, Chambuso M and Mbugi EV (2021) Utilization Trends of Antiviral and Antifungal Agents for Human Systemic Use in Tanzania From 2010 to 2017 Using the World Health Organization Collaborating Centre for Drug Statistics Methodology. Front. Trop. Dis 2:723991. doi: 10.3389/fitd.2021.723991
Received: 11 June 2021; Accepted: 17 September 2021;
Published: 07 October 2021.
Edited by:
Eric Sampane-Donkor, University of Ghana, GhanaReviewed by:
Daniel Kwame Afriyie, Ghana Police Hospital, GhanaAyo Ajayi, Federal University Ekiti, Nigeria
Copyright © 2021 Hamim, Sangeda, Bundala, Mkumbwa, Bitegeko, Sillo, Fimbo, Chambuso and Mbugi. This is an open-access article distributed under the terms of the Creative Commons Attribution License (CC BY). The use, distribution or reproduction in other forums is permitted, provided the original author(s) and the copyright owner(s) are credited and that the original publication in this journal is cited, in accordance with accepted academic practice. No use, distribution or reproduction is permitted which does not comply with these terms.
*Correspondence: Raphael Z. Sangeda, c2FuZ2VkYUBnbWFpbC5jb20=