 Xavier Badia-Rius1
 Samuel Wanji
 Mark J. Taylor
 Louise A. Kelly-Hope
- 1Centre for Neglected Tropical Diseases, Department of Tropical Disease Biology, Liverpool School of Tropical Medicine, Liverpool, United Kingdom
- 2Department of Microbiology and Parasitology, University of Buea, Buea, Cameroon
Loiasis (African Eye Worm) is a filarial infection caused by Loa loa and transmitted by Chrysops vectors, which are confined to the tropical rainforests of Central and West Africa. Loiasis is a major impediment to control and elimination programmes that use the drug ivermectin due to the risk of serious adverse events. There is an urgent need to better refine and map high-risk communities. This study aimed to quantify and predict environmental factors associated with loiasis across five bioecological zones in Cameroon. The L. loa microfilaria (mf) prevalence (%) and intensity (mf number/ml) data from 42 villages within an Equatorial Rainforest and Savannah region were examined in relation to climate, topographic and forest-related data derived from satellite remote sensing sources. Differences between zones and regions were examined using nonparametric tests, and the relationship between L. loa mf prevalence, mf intensity, and the environmental factors using polynomial regression models. Overall, the L. loa mf prevalence was 11.6%, L. loa intensity 927.4 mf/ml, mean annual temperature 23.7°C, annual precipitation 2143.2 mm, elevation 790 m, tree canopy cover 46.7%, and canopy height 19.3m. Significant differences between the Equatorial Rainforest and Savannah region were found. Within the Equatorial Rainforest region, no significant differences were found. However, within the Savannah region, significant differences between the three bioecological zones were found, and the regression models indicated that tree canopy cover and elevation were significant predictors, explaining 85.1% of the L. loa mf prevalence (adjusted R2 = 0.851; p<0.001) and tree cover alone was significant, explaining 58.1% of the mf intensity (adjusted R2 = 0.581; p<0.001). The study highlights that environmental analysis can help delineate risk at different geographical scales, which may be practical for developing larger scale operational plans for mapping and implementing safe effective interventions.
Introduction
Loiasis is a filarial nematode infection caused by the parasite Loa loa and transmitted by tabanid flies of the genus Chrysops (1–3). It is largely confined to the tropical rainforests of Central and West Africa, where an estimated 30 million people live in moderate to high risk areas, predominately in Cameroon, Democratic Republic of Congo, Gabon and Nigeria. Currently, loiasis is of public health importance due to the risk of serious adverse events (SAEs) associated with ivermectin-based treatment for onchocerciasis and lymphatic filariasis elimination programmes (2, 4) and may become important for malaria control if the use of ivermectin is scaled up in co-endemic areas (5).
The highest risk of SAEs occurs in high loiasis prevalence communities, specifically in individuals with a high number of L. loa microfilaria (mf) i.e. mf intensity, in their peripheral blood. Positive correlations between community mf prevalence and intensity has been reported i.e. community mf prevalence of 20%, 30% and 40% corresponds approximately to 5%, 9% and 16% of adults with mf intensity >8000 mf/ml respectively, or 1%, 3% and 5-6% of adults with mf intensity >30,000 mf/ml respectively, which are considered to be important SAE risk thresholds (6, 7).
There is a need to better refine and map high-risk loiasis communities to enable the deployment of new diagnostics, alternative intervention and heightened care strategies (8, 9). This is critical as loiasis covers a vast geographical area and many high-risk communities are in remote hard-to-reach areas (2). There is a need for more innovative cost-effective approaches, and the availability of satellite remote sensing technology provides an opportunity to use large-scale maps and modelled data to examine factors associated with transmission (10). Environmental factors are particularly important for vector-borne diseases and understanding key drivers may help to define their specific niche (11).
The rainforest is a key environmental driver of loiasis as it is the Chrysops main habitat, with larvae found in leafy undergrowth and adults in tree canopies ~8-28 m in height, where there is patchy shaded light and cooler temperatures (12, 13). A recent study defined environmental parameters of the main vectors Chrysops silacea and C. dimidiata, including mean temperatures (24-25°C), precipitation (1849-1869mm), elevation (369-401m), tree canopy cover (61-67%) and canopy height (22-25m). MaxEnt models identified tree canopy cover as a significant predictor of both species (14).
Several studies have stratified loiasis risk by ecological or vegetative zones (15–17). In Nigeria, higher prevalences rates were found in rainforest zones compared to mangrove and savannah zones (18). In Gabon, higher L. loa mf prevalence and intensities were found in forest ecosystem compared to Savannah and Lakeland ecosystems (19). In Cameroon, higher L. loa mf prevalence and intensities were unexpectedly found in forested savannah bioecological zone compared with other savannah or rainforest zones (20). All studies also found great variations in risk within each zone.
To better understand the environmental factors driving transmission differences between and within ecological zones, we used the georeferenced data available from the Cameroon study to examine the relationship between L. loa mf prevalence and intensity, and remote sensed satellite-derived data on land cover, climatic, topographical and forest-related factors.
Methods
Study Site
The study sites were based on the Wanji et al. (20) study conducted in the South-West and North-West Provinces of Cameroon between February to July 2001 (data available in Supplementary File 1). Two main regions with five contrasting bioecological zones were differentiated by their vegetation cover, hydrology, topography and human settlements. The Equatorial Rainforest region in South-West Province consisted of the deciduous equatorial rainforest (DERF) and dense-humid equatorial rainforest (DHERF) zones. The Savannah region in North-West Province consisted of the grassland savannah (GS), mosaic forest savannah (MF) and forested savannah (FS) zones.
In total, 42 villages were included across the two regions with 7-10 villages in each bioecological zone. The geographical location of each village was defined in latitude and longitude degrees and minutes. An error of 1.84 km was calculated according to the value of a minute in the same latitude and longitude, which resulted in a lack of precision and two villages in the DHERF zone and two in the GS zone having the same coordinates. It was not possible to retrospectively georeference these villages accurately due to the lack of available information.
Loa loa Data
The 42 villages in the Equatorial Rainforest (n=16) and Savannah (n=26) regions were selected as they had not received mass ivermectin treatment for filarial diseases (20). In each village, households were selected randomly from a central location, and consenting residents aged ≥ 15 years old, who had lived in the village for at least 5 years and had not taken filarial drugs were invited to participate in the survey. Loa loa parasitological assessment included the use of a standard thick film of 50µL finger-prick blood collected between 10:00 - 16:00 and read under a microscope to identify and count L. loa mf. In total, 4532 individuals were included in Wanji et al. (20) study, and all individual data were included in the prevalence and intensity calculations. For each village, the mean L. loa mf prevalence (sum of individuals with mf divided by number of individuals tested) and L. loa mf intensity (arithmetic; sum of the mf per millilitre (ml) of blood divided by number of individuals tested) of infection were quantified and analysed in this current study.
Environmental Data
First, land cover data obtained from the GlobCover Project, which provides global composite land cover maps including 22 numerical classes corresponding to specific land cover types at 300 metres (m) spatial resolution generated in 2005-2006 (©ESA/ESA Globcover Project, led by MEDIAS-France/POSTEL; http://due.esrin.esa.int/page_globcover.php) (21). The maps were used to examine the L. loa prevalence distributions in relation to land cover and determine the predominant land cover type in each bioecological zone.
Second, climate, topographic and forest-related data derived from satellite remote sensing sources were used to examine the association with L. loa mf prevalence and intensity.
- Climate data included the annual mean temperature in degrees Celsius (°C) and annual precipitation in millimetres (mm) data obtained from WorldClim 1.4 - Global Climate Data (http://www.worldclim.org) at 1 km resolution, which uses interpolations of observed data between 1960 and 1990 (22).
- Topographical data included elevation in metres (m) at 1km resolution obtained from the Global Land One-kilometer Base Elevation (GLOBE) data set, published in 1999, available from the National Centers for Environmental Information – National Oceanic and Atmospheric Administration (NOAA: https://www.ngdc.noaa.gov/mgg/topo/globe.html) (23).
- Forest-related data included tree canopy cover and tree canopy height. Tree canopy cover included data on the percentage (%) of canopy closure for all vegetation taller than 5m in height at 30m resolution, obtained from Global Forest Change 2000–2016, version 1.4 (http://earthenginepartners.appspot.com/science-2013-global-forest) (24). Tree canopy height (m) included Global 1 km Forest Canopy Height modelled data, produced in 2005 and obtained from ORNL DAAC (https://webmap.ornl.gov/ogc/dataset.jsp?ds_id=10023) (25).
Analysis and Maps
All georeferenced villages and environmental data were imported to QGIS 2.14.20 mapping software (https://qgis.org/). First, all villages were mapped using the available latitude and longitude coordinates, and L. loa mf prevalence data examined in relation to the land cover distribution. A 3km buffer around each village was created using the QGIS geoprocessing spatial tool, and land cover numerical class data within each buffer extracted using the Zonal Statistics Raster Analysis tool. From the numerical data, the main type of land cover was determined for each village and bioecological zone.
Second, the mean annual temperature, annual precipitation, elevation, tree canopy cover and tree canopy height data within each village 3km buffer were extracted using the Zonal Statistics Raster Analysis tool and exported for descriptive and statistical analysis in Excel™ and IBM Statistical Package for the Social Sciences (SPSS) (version 24) (SPSS Inc., Chicago, IL, USA). The mean L. loa mf prevalence, L. loa mf intensity (including all individual and village data) and environmental factors were compared between and within the two regions using the Mann-Whitney non-parametric test (p ≤ 0.05 significance).
Finally, polynomial regression models including each bioecological zone and environmental variables were used to determine the most important environmental predictor of L. loa mf prevalence and L. loa mf intensity overall, and within each region. Polynomials to the 4th power were calculated for continuous independent variables. Models were built using the R statistical software package using the ln function.
Results
Land Cover Analysis
The L. loa mf prevalence distribution in relation to the land cover type in each bioecological zone is shown in Figures 1A, B. In Equatorial Rainforest region, the main land cover type in the DERF and DHERF zones was closed to open (>15%) broadleaved evergreen or semi-deciduous forest (>5m) Figure 1C. In the Savannah region, the main land cover type in MF and FS zones was open (15- 40%) broadleaved deciduous forest/woodland (>5m) and in the GS zone closed to open (>15%) broadleaved or needle leaved, evergreen or deciduous shrubland (<5m) Figure 1D.
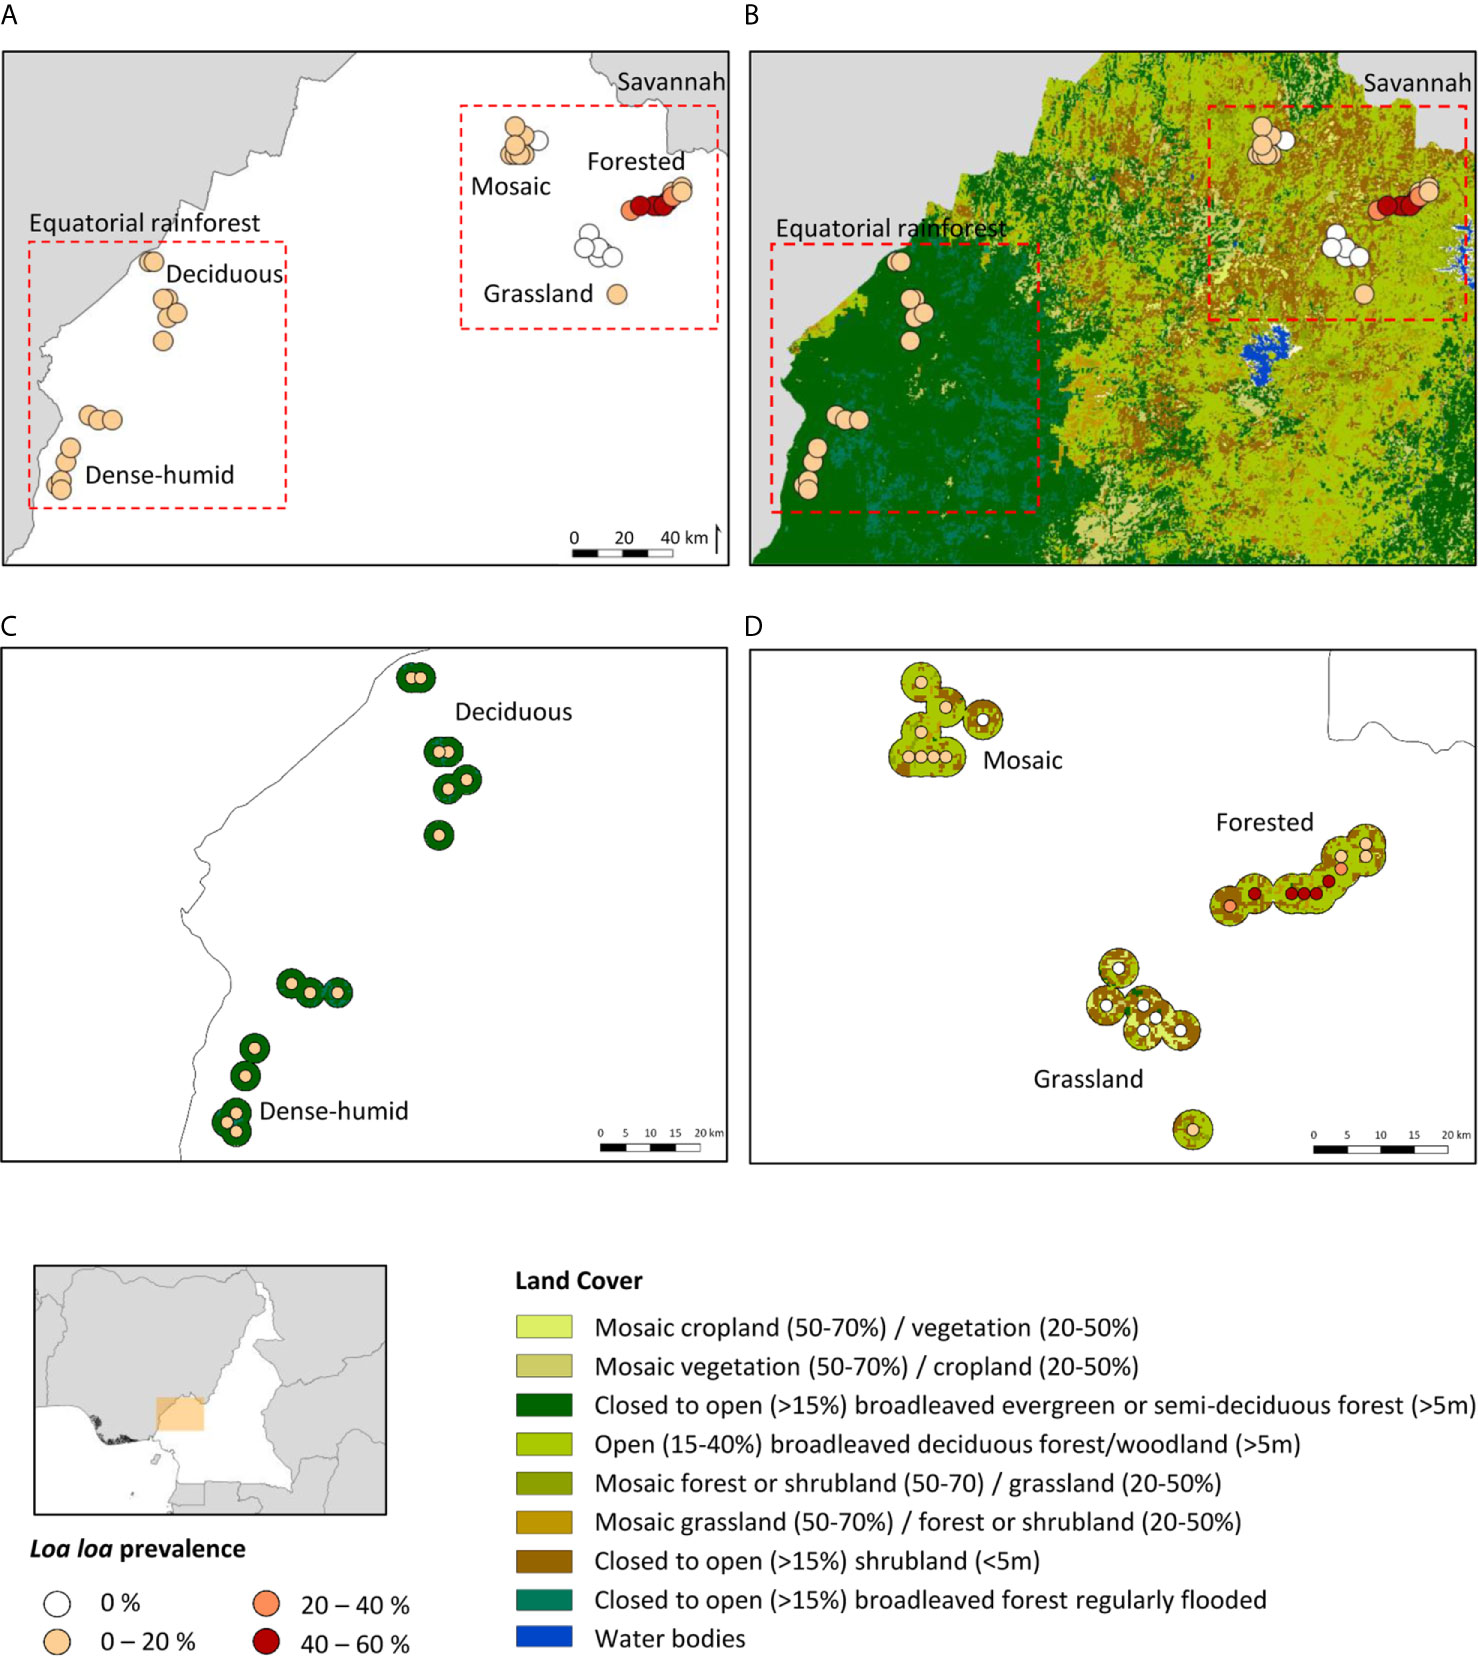
Figure 1 Loa loa mf prevalence distribution in relation to land cover. (A) L. loa prevalance distribution by bioecological zone (B) L. loa prevalance in relation to land cover (C) Equatorial rainforest sites land cover 3km buffer (D) Savannah sites land cover 3km buffer. DERF, Deciduous equatorial rainforest; DHERF, Dense-humid equatorial rainforest; GS, Grassland savannah; MF, Mosaic forest savannah; FS, Forested savannah.
Climate, Topographic and Forest-Related Analysis
The L. loa mf prevalence distribution in relation to the environmental factors is shown in Figures 2A–E. Overall (n=42 villages), the mean L. loa mf prevalence was 11.6%, and L. loa mf intensity 927.4 mf/ml, annual temperature 23.7°C, annual precipitation 2143.2 mm, elevation 790 m, tree canopy cover 46.7%, and canopy height 19.3m (Table 1). Comparison of means in the Equatorial Rainforest and Savannah regions, found no significant differences between L. loa mf prevalence and intensity, however the Equatorial Rainforest region recorded a significantly higher annual temperature (3.7°C difference; 1.2 times higher), annual precipitation (792.9mm; 1.4), tree canopy cover (46%, 2.6), tree canopy height (22m; 3.1) and lower elevation (939m difference; 5.5 times lower) than the Savannah region (p<0.000) (Table 1).
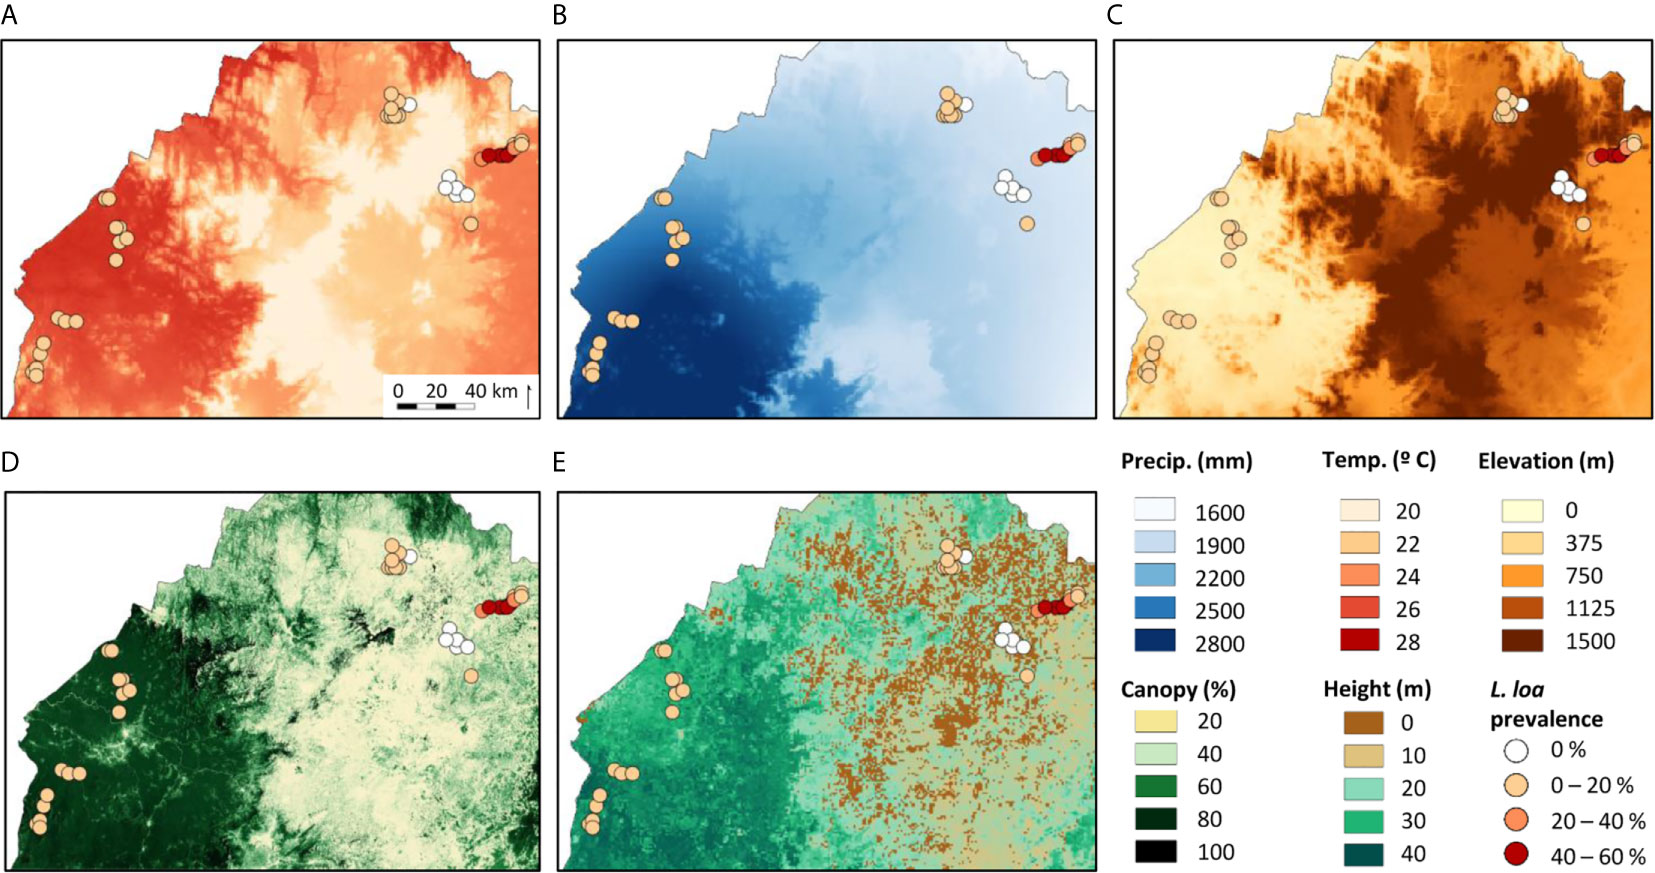
Figure 2 Maps of the environmental variables examined with all study locations and their Loa loa mf prevalence. (A) Annual mean temperature (B) Annual precipitation (C) Elevation (D) Tree canopy cover (E) Canopy height.
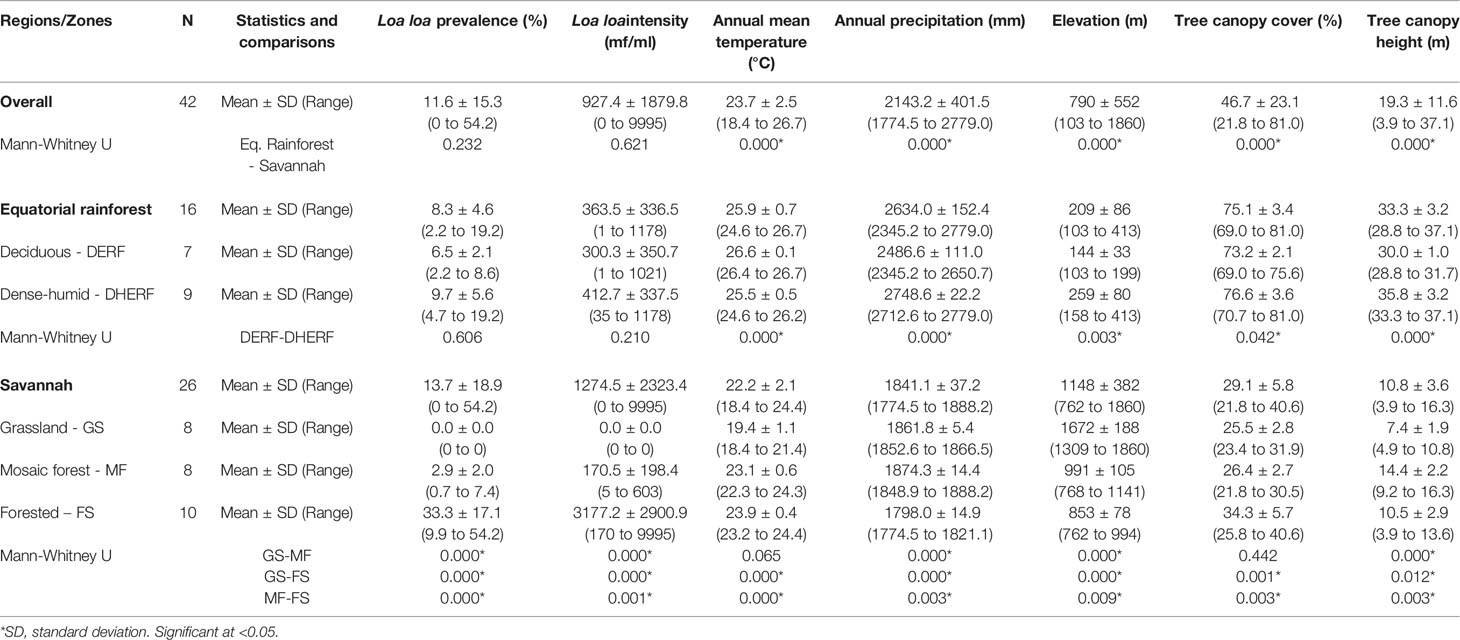
Table 1 Descriptive statistics of the Loa loa prevalence, intensity and environmental variables by ecological zone.
In the Equatorial Rainforest region (n=16 villages) the mean L. loa mf prevalence was 8.3%, L. loa intensity 363.5 mf/ml, annual temperature 25.9°C, annual precipitation 2634 mm, elevation 209m, tree canopy cover 75.1%, and canopy height 35.7m (Table 1). Comparison of means between the DERF and DHERF zones, found no significant differences with L. loa mf prevalence and intensity, however the DERF zone recorded a significantly higher temperature (1.1°C difference; 1.04 times higher), and lower precipitation (262mm difference; 1.1 times lower), elevation (115m; 1.8), tree canopy cover (3.0%; 1.05) and tree canopy height (2.7m; 1.08) than DHERF (Table 1). Maps of the environmental variables in the Equatorial Rainforest region and 3km buffer extractions are shown in Supplementary File 2.
In the Savannah region (n=26 villages), the mean L. loa mf prevalence was 13.7%, L. loa mf intensity 1274.5 mf/ml, annual mean temperature 22.2°C, annual precipitation 1841.1mm, elevation 1148m, tree canopy cover 29.1%, and canopy height 10.8m (Table 1). Comparison of means between the GS, MF, FS zones found significant differences with L. loa mf prevalence, L. loa mf intensity and between all environmental variables (Table 1). The FS zone recorded the highest L. loa prevalence (33.3%) and L. loa intensity (3177.2 mf/ml) and recorded a significantly higher temperature (0.8-4.5°C difference; 1.0-1.2 times higher), and tree canopy cover (7.8-8.8%; 1.3) (p<0.003 - 0.000), and lower precipitation, elevation (138-819m difference; 1.2-2.0 times lower) (p< 0.009 – 0.000) than the other zones (Table 1). Maps of the environmental variables in the Savannah region and 3km buffer extractions are shown in Supplementary File 2.
Model Analysis
The polynomial regression models including the environmental predictors of L. loa mf prevalence and L. loa mf intensity are summarised in Tables 2, 3, respectively (more detailed information on each model including residual plots is available in Supplementary File 3).
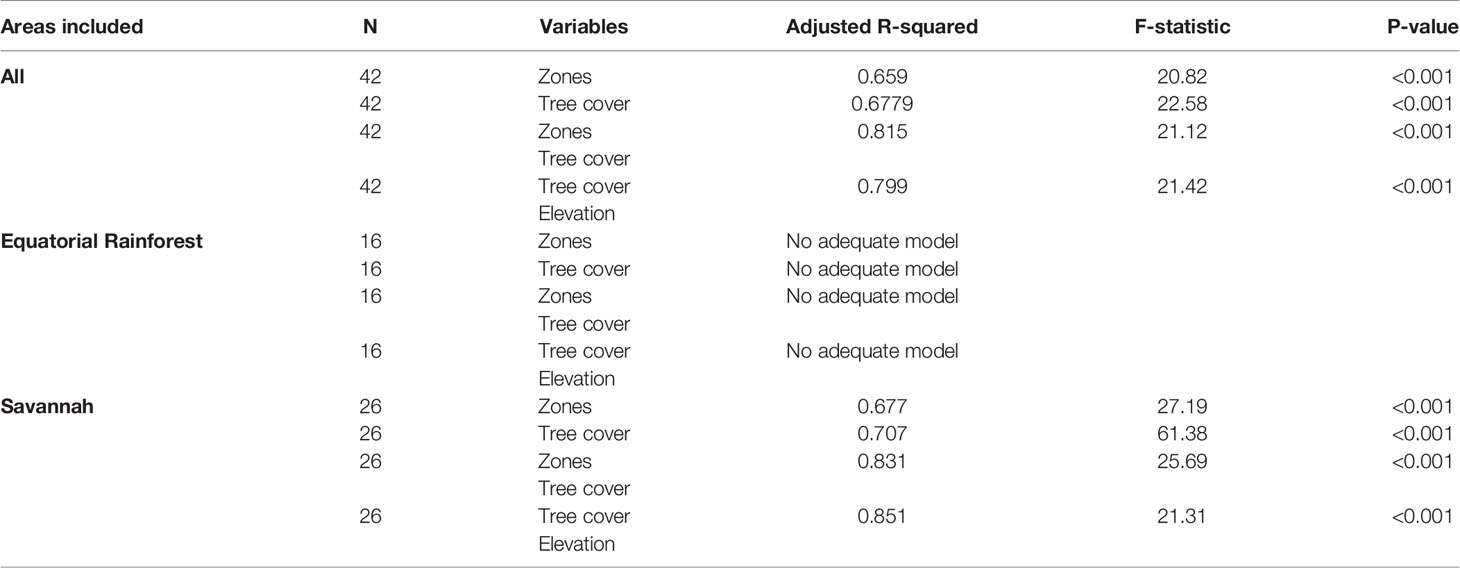
Table 2 Summary of the polynomial models predicting the Loa loa mf prevalence.
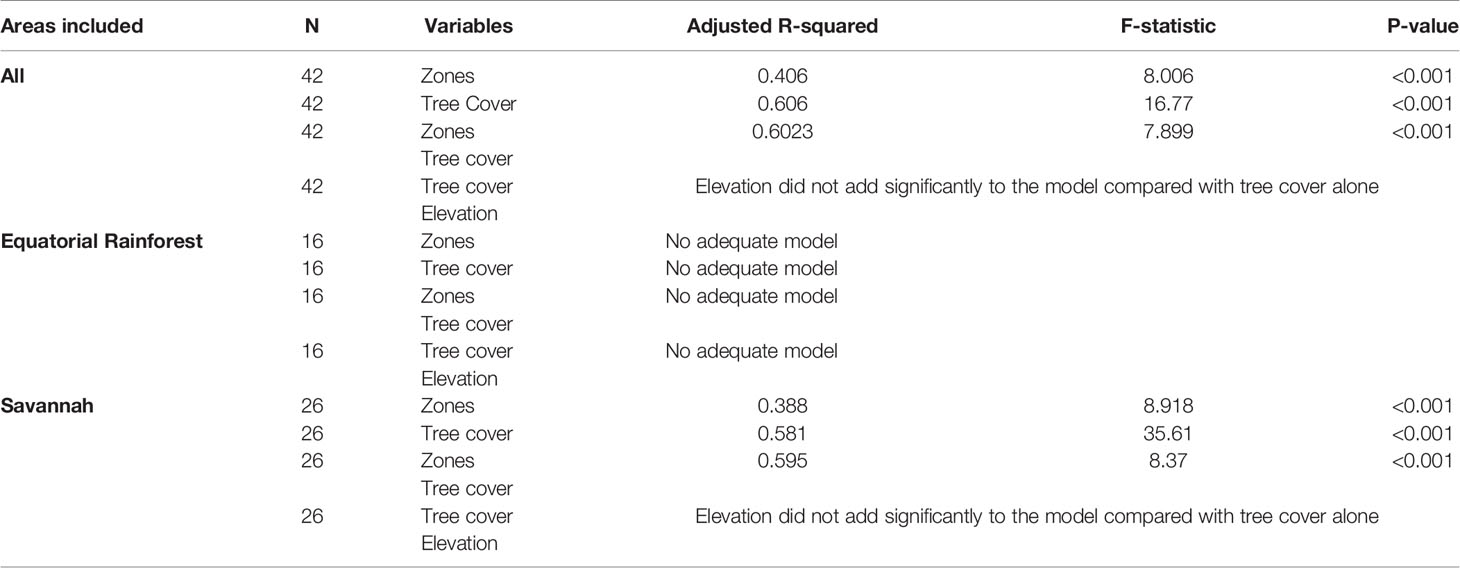
Table 3 Summary of the polynomial models predicting the Loa loa mf intensity.
Overall, bioecological zone alone was found to be a significant predictor, explaining 65.9% of L loa mf prevalence (adjusted R2 = 0.659; p < 0.001) and 40.6% of L loa mf intensity (adjusted R2 = 0.406; p<0.001). However, the residual q-q plots showed that residuals were not normally distributed, with fat tails consisting primarily of points within the FS bioecological zone. Given the wide range of L. loa mf prevalence and intensity within FS bioecological zone (Table 1) it was unsurprising that bioecological zone alone was insufficient to explain the mf variances. Both L. loa mf prevalence and intensity showed a positive relationship with tree canopy cover within the FS zone (Figures 3A, C). The addition of tree canopy cover improved the models, explaining 81.5% of L. loa mf prevalence (adjusted R2 = 0.815; p<0.001) and 60.6% of L. loa mf intensity (adjusted R2 = 0.606; p<0.001), with an improved distribution of residuals. The analysis of environmental variables, found that tree canopy cover alone was significant predicator of both prevalence (adjusted R2 = 0.679; p<0.001), and intensity (adjusted R2 = 0.606; p<0.001), and that the combination of tree canopy cover and elevation, explained 79.9% of L loa prevalence (adjusted R2 = 0.799; p<0.001) and 62.1% of L loa intensity (adjusted R2 = 0.621; p<0.001) but that the addition of elevation did not contribute significantly to the model of intensity. The relationship between Loa loa mf prevalence and mf intensity and elevation, and between tree canopy cover and elevation by bioecological zone is shown in Figures 3B, D, E.
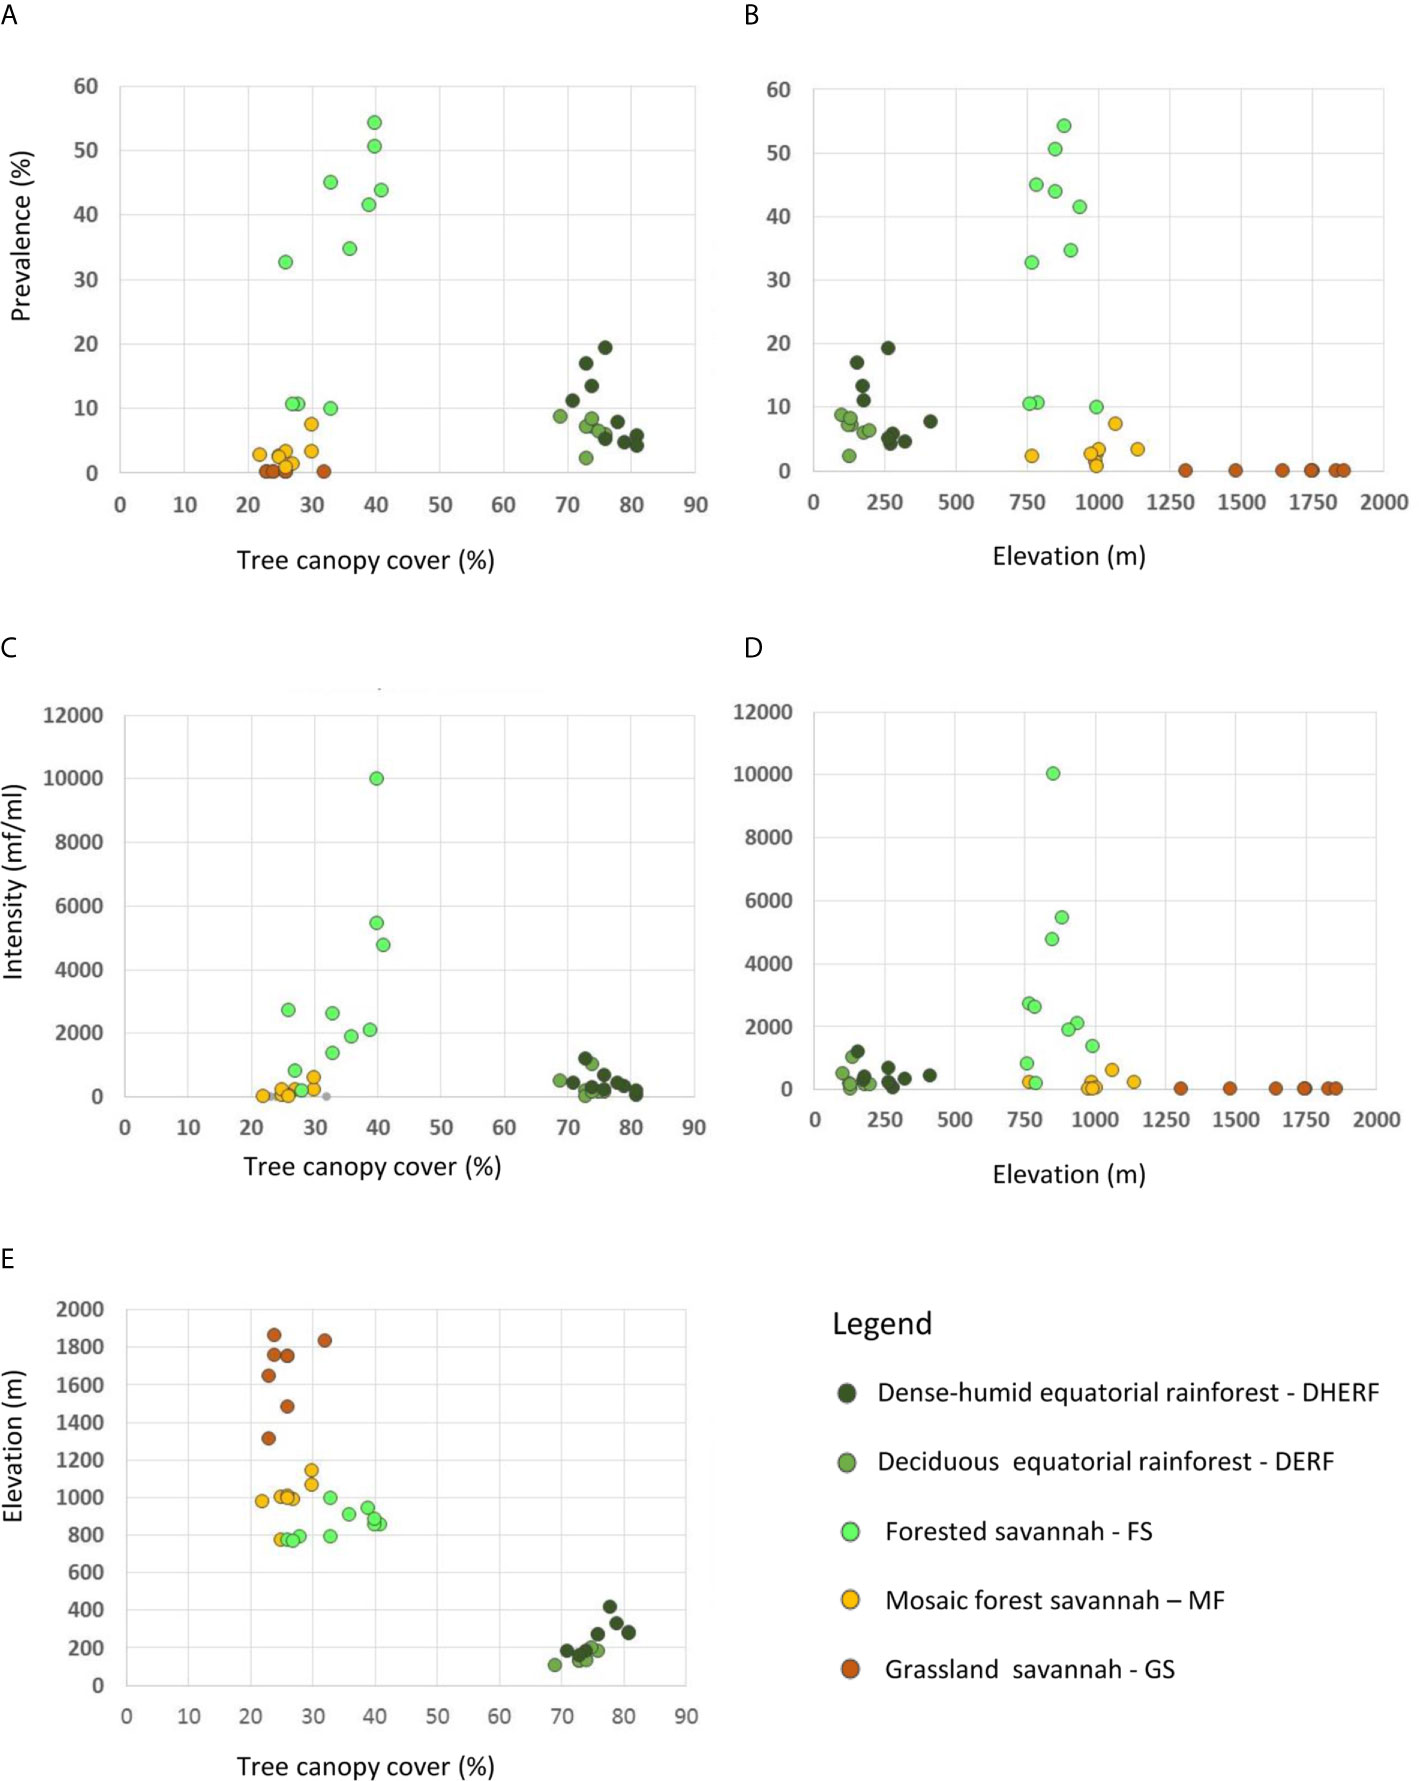
Figure 3 Relationship between Loa loa mf prevalence, mf intensity, tree canopy cover and elevation by bioecological zone. (A) Loa loa prevalance and tree canopy cover (B) Loa loa prevalance and elevation (C) Loa loa intensity and tree canopy cover (D) Loa loa intensity and elevation (E) Elevation and tree canopy cover.
The same models run in the Equatorial Rainforest region found no significant environmental predictors (Tables 2, 3). However, in the Savannah region, the bioecological zones alone were found to be a significant predictor, explaining 67.7% of L loa mf prevalence (adjusted R2 = 0.677; p<0.001) and 38.8% of L loa intensity (adjusted R2 = 0.388; p<0.001). Tree canopy cover alone was also found to be a significant predictor, explaining 70.7% of L loa mf prevalence (adjusted R2 = 0.707; p<0.001) and 58.1% of L loa intensity (adjusted R2 = 0.581; p<0.001). In this region, the combination of bioecological zone and tree canopy cover were also significant predictors, explaining 83.0% of L. loa mf prevalence (adjusted R2 = 0.831; p<0.001) and 59.6% of L. loa mf intensity (adjusted R2 = 0.596; p<0.001). The analysis of environmental variables, also found that the combination of tree canopy cover and elevation were significant predictors, explaining 85.1% of L loa mf prevalence (adjusted R2 = 0.851; p<0.001). However, the addition of elevation did not improve on the model containing tree canopy cover alone.
Discussion
This study highlights the value of using readily available satellite data to identify environmental factors associated with high prevalence and intensity of L. loa microfilaremia, and the potential risk of SAEs. Global land cover maps helped to visualise broad-scale differences between the Equatorial Rainforest and Savannah regions, and comparisons of climate, topographic and forest-related characteristics between bioecological zones helped to define their ecological parameters. The use of regression models identified key environmental predictors, which could be used further to refine risk in unmapped remote areas and help national control programmes direct safe, targeted interventions (26, 27).
Interestingly, the pre-determined bioecological zone was the most valuable explanatory predictor overall. This suggests that ecological stratification of districts and/or implementations units, may be a useful first step in delineating risk within countries (28). Models using tree canopy cover and elevation were also good predictors and explained more variation than bioecological zone alone but were slightly less effective than models combining bioecological zone and tree canopy cover. However, as elevation is easily accessible information, it may be a useful alternative to bioecological zone for predictions of prevalence. Tree canopy cover and elevation together could be used to define mf prevalence risk areas, especially in areas with ~30-70% tree canopy cover, which allow the patchy shaded light through for the Chrysops vectors (14).
Bioecological zone was also the most valuable predictor for L. loa mf intensity with tree canopy cover adding to the significance of the model. Overall, models using elevation in place of bioecological zone did not add to the value of models using tree cover only. Interestingly, environmental variables do not seem as predictive for mf intensity, which suggests that other factors influence this risk such as human susceptibility, behaviour, village characteristics, and vector species. Studies based on eye worm history have found an increased risk in people who visited forested areas more frequently, usually for work including farming and hunting (29, 30). Villages with more open clearings have shown to have less transmission, especially if C. dimidiata is the main vector (31–33). The close proximity of houses and villages to the vector breeding sites where people can be bitten and infected, also increases risk at a micro-level (3, 34).
The overall models were better at describing the variation in L. loa mf prevalence than within the Equatorial Rainforest region, where no adequate models could be found. This may be because the land cover and environmental parameters were relatively homogeneous in this region. Unexpectedly, this extensive dense forested region did not have the highest L. loa mf prevalence or mf intensity measures. This suggests that the environment may not be optimal for the local Chrysops species (14, 34) as the higher temperatures may have slowed larvae development in the vector (35), higher precipitation flooded larvae breeding sites (36), higher tree cover blocked the light (37) and the higher canopy heights too high for adult Chrysops to rest (38). It may also be that the biting rate and density of Chrysops is more intense in the Equatorial Rainforest region, which could induce some partial protective immunity to the population that limit the mf prevalence and mf intensity compared to the forested area of the Savannah where biting rates may not be sufficient to induce enough protective immune responses (20).
In contrast, when considering the Savannah region alone, the bioecological zone provided an R2 value of 0.677, which increased to 0.815 when tree canopy cover was added as a secondary variable. The large differences in the model outputs between the two regions and within the Savannah region alone may be related to the great variation in land cover and environmental parameters. The maps and models were able to show that the highest L loa mf prevalence and intensity measures were geographically confined to a unique forested zone. This highlights the value of defining high risk areas though environmental delineation, and other studies have found variation within a defined ecological region (18, 19, 28). In this forested zone, the temperature, precipitation, elevation, tree canopy cover and height parameters were in line with those that favour Chrysops vectors and likely to have supported the high transmission (34–38).
The main limitations of this study were related to the use of historical data collected from a cross-sectional survey focusing on five pre-determined zones, and the climate and forest-related data derived from broad-scale models. This may not reflect current conditions, and highlights that there is a need for up-to-date nationwide mapping, using standardised parasitological methods, representative sampling at community-level, and ecological stratification to identify high risk ‘hotspot’ areas. Further, the data used in this study do not allow for temporal or seasonal analysis, and it is possible that the use of more specific and higher resolution data such as the normalised-difference vegetation index (NDVI) (16), may have increased the significance of the results. Notwithstanding, these limitations, we used readily accessible data and reproducible methods so that similar or larger scale studies can be conducted and compared to increase our understanding of loiasis transmission drivers. Importantly, the study highlights that environmental analysis can help delineate risk at different geographical scales, which may be practical for developing larger scale operational plans for mapping and implementing safe effective interventions.
Data Availability Statement
The original contributions presented in the study are included in the article/Supplementary Material. Further inquiries can be directed to the corresponding author.
Author Contributions
LK-H conceived the idea of the study, designed the methodology and co-wrote the first draft of the manuscript. XB-R extracted, analysed and interpretated the data, created the maps and co-wrote the first draft of the manuscript. HB developed the regression models. SW, DM, and MT interpretated the data analysis. All authors contributed to the article and approved the submitted version.
Conflict of Interest
The authors declare that the research was conducted in the absence of any commercial or financial relationships that could be construed as a potential conflict of interest.
Supplementary Material
The Supplementary Material for this article can be found online at: https://www.frontiersin.org/articles/10.3389/fitd.2021.668641/full#supplementary-material
References
1. Boussinesq M. Loiasis. Ann Trop Med Parasitol (2006) 100(8):715–31. doi: 10.1179/136485906X112194
2. Zouré HGM, Wanji S, Noma M, Amazigo UV, Diggle PJ, Tekle AH, et al. The Geographic Distribution of Loa loa in Africa: Results of Large-Scale Implementation of the Rapid Assessment Procedure for Loiasis (Raploa). PloS Negl Trop Dis (2011) 5(6):e1210. doi: 10.1371/journal.pntd.0001210
3. Whittaker C, Walker M, Pion SDS, Chesnais CB, Boussinesq M, Basanez M-G. The Population Biology and Transmission Dynamics of Loa loa. Trends Parasitol (2018) Apr34(4):335–50. doi: 10.1016/j.pt.2017.12.003
4. Gardon J, Gardon-Wendel N, Demanga-Ngangue, Kamgno J, Chippaux JP, Boussinesq M. Serious Reactions After Mass Treatment of Onchocerciasis With Ivermectin in an Area Endemic for Loa loa Infection. Lancet (1997) 350(9070):18–22. doi: 10.1016/S0140-6736(96)11094-1
5. Alout H, Foy BD. Ivermectin: A Complimentary Weapon Against the Spread of Malaria? Expert Rev Anti Infect Ther (2017) 15(3):231–40. doi: 10.1080/14787210.2017.1271713
6. Takougang I, Meremikwu M, Wandji S, Yenshu EV, Aripko B, Lamlenn SB, et al. Rapid Assessment Method for Prevalence and Intensity of Loa loa Infection. Bull World Health Organ (2002) 80:852–8.
7. Wanji S, Akotshi DO, Mutro MN, Tepage F, Ukety TO, Diggle PJ, et al. Validation of the Rapid Assessment Procedure for Loiasis (RAPLOA) in the Democratic Republic of Congo. Parasit Vectors (2012) 5(1):25. doi: 10.1186/1756-3305-5-25
8. Kamgno J, Pion SD, Chesnais CB, Bakalar MH, D’Ambrosio MV, Mackenzie CD, et al. A Test-and-Not-Treat Strategy for Onchocerciasis in Loa loa-Endemic Areas. N Engl J Med (2017) 377(21):2044–52. doi: 10.1056/NEJMoa1705026
9. Pedram B, Pasquetto V, Drame PM, Ji Y, Gonzalez-Moa MJ, Baldwin RK, et al. A Novel Rapid Test for Detecting Antibody Responses to Loa loa Infections. PloS Negl Trop Dis (2017) 11(7):1–14. doi: 10.1371/journal.pntd.0005741
10. Ceccato P, Ramirez B, Manyangadze T, Gwakisa P, Thomson MC. Data and Tools to Integrate Climate and Environmental Information Into Public Health. Infect Dis Poverty (2018) 7:126. doi: 10.1186/s40249-018-0501-9
11. Kelly-Hope L, Thomson MC. Climate and Infectious Diseases. In: Thomson MC, Garcia-Herrera R, Beniston M, editors. Seasonal Forecasts, Climatic Change and Human Health: Health and Climate, Dordrecht: Springer Netherlands (2008). p. 31–70. Available at: http://citeseerx.ist.psu.edu/viewdoc/download?doi=10.1.1.424.2946&rep=rep1&type=pdf.
12. Kelly-Hope L, Paulo R, Thomas B, Brito M, Unnasch TR, Molyneux D. Loa loa Vectors Chrysops Spp.: Perspectives on Research, Distribution, Bionomics, and Implications for Elimination of Lymphatic Filariasis and Onchocerciasis. Parasit Vectors (2017) 10(1):172. doi: 10.1186/s13071-017-2103-y
14. Badia-Rius X, Betts H, Molyneux DH, Kelly-Hope LA. Environmental Factors Associated With the Distribution of Loa loa Vectors Chrysops Spp . in Central and West Africa: Seeing the Forest for the Trees. Parasit Vectors (2019) 12(1):72. doi: 10.1186/s13071-019-3327-9
15. Thomson MC, Obsomer V, Dunne M, Connor SJ, Molyneux DH. Satellite Mapping of Loa loa Prevalence in Relation to Ivermectin Use in West and Central Africa. Lancet (2000) 356:1077–8. doi: 10.1016/S0140-6736(00)02733-1
16. Diggle PJ, Thomson MC, Christensen OF, Rowlingson B, Obsomer V, Gardon J, et al. Spatial Modelling and the Prediction of Loa loa Risk: Decision Making Under Uncertainty. Ann Trop Med Parasitol (2007) 101:499–509. doi: 10.1179/136485913X13789813917463
17. Thomson MC, Obsomer V, Kamgno J, Gardon J, Wanji S, Takougang I, et al. Mapping the Distribution of Loa loa in Cameroon in Support of the African Programme for Onchocerciasis Control. Filaria J (2004) 3(1):7. doi: 10.1186/1475-2883-3-7
18. Ogunba EO. Ecology of Human Loiasis in Nigeria. Trans R Soc Trop Med Hyg (1972) 66(5):743–8. doi: 10.1016/0035-9203(72)90088-0
19. Akue JP, Nkoghe D, Padilla C, Moussavou G, Moukana H, Mbou RA, et al. Epidemiology of Concomitant Infection Due to Loa loa and Mansonella Perstans in Gabon. PloS Negl Trop Dis (2011) 5(10):e1329. doi: 10.1371/journal.pntd.0001329
20. Wanji S, Tendongfor N, Esum M, Atanga SN, Enyong P. Heterogeneity in the Prevalence and Intensity of Loiasis in Five Contrasting Bioecological Zones in Cameroon. Trans R Soc Trop Med Hyg (2003) 97(2):182–7. doi: 10.1016/S0035-9203(03)90114-3
21. Bicheron P, Defourny P, Brockmann C, Schouten L, Vancutsem C, Huc M, et al. Globcover Products Description and Validation Report (2008). Available at: http://due.esrin.esa.int/files/GLOBCOVER_Products_Description_Validation_Report_I2.1.1.pdf.
22. Hijmans RJ, Cameron SE, Parra JL, Jones PG, Jarvis A. Very High Resolution Interpolated Climate Surfaces for Global Land Areas. Int J Climatol (2005) 25(15):1965–78. doi: 10.1002/joc.1276
23. National Geophysical Data Center. Global Land One-Kilometer Base Elevation (GLOBE) V.1. Hastings D, Dunbar PK, editors. United States of America: National Geophysical Data Center, NOAA (1999). doi: 10.7289/V52R3PMS
24. Hansen MC, Potapov PV, Moore R, Hancher M, Turubanova SA, Tyukavina A, et al. High-Resolution Global Maps of 21st-Century Forest Cover Change. Sci (80- ) (2013) 342(6160):850–3. doi: 10.1126/science.1244693
25. Simard M, Pinto N, Fisher JB, Baccini A. Mapping Forest Canopy Height Globally With Spaceborne Lidar. J Geophys Res Biogeosciences (2011) 116(November):1–12. doi: 10.1029/2011JG001708
26. Krefis AC, Schwarz NG, Nkrumah B, Acquah S, Loag W, Oldeland J, et al. Spatial Analysis of Land Cover Determinants of Malaria Incidence in the Ashanti Region, Ghana. PloS One (2011) 6(3):e17905. doi: 10.1371/journal.pone.0017905
27. Molyneux DH, Hopkins A, Bradley MH, Kelly-Hope LA. Multidimensional Complexities of Filariasis Control in an Era of Large-Scale Mass Drug Administration Programmes: A can of Worms. Parasit Vectors (2014) 7(1):363. doi: 10.1186/1756-3305-7-363
28. Kelly-Hope LA, Unnasch TR, Stanton MC, Molyneux DH. Hypo-Endemic Onchocerciasis Hotspots: Defining Areas of High Risk Through Micro-Mapping and Environmental Delineation. Infect Dis Poverty (2015) 4:36. doi: 10.1186/s40249-015-0069-6
29. Brant TA, Okorie PN, Ogunmola O, Ojeyode NB, Fatunade SB, Davies E, et al. Integrated Risk Mapping and Landscape Characterisation of Lymphatic Filariasis and Loiasis in South West Nigeria. Parasite Epidemiol Control (2018) 3(1):21–35. doi: 10.1016/j.parepi.2017.12.001
30. Mischlinger J, Veletzky L, Tazemda-Kuitsouc GB, Pitzinger P, Matsegui PB, Gmeiner M, et al. Behavioural and Clinical Predictors for Loiasis. J Glob Health (2018) 8(1):10413. doi: 10.7189/jogh.08.010413
31. Beesley WN, Williams P. Studies on the Control of the Vectors of Loiasis in West Africa. II. The Effect of Clearing Vegetation From Tabanid Breeding-Places. Ann Trop Med Parasitol (1962) 56:289–91. doi: 10.1080/00034983.1962.11686122
32. Noireau F, Nzoulani A, Sinda D, Caubère P. Chrysops Silacea and C.dimidiata Seasonality and Loiasis Prevalence in the Chaillu Mountains, Congo. Med Vet Entomol (1991) 5:413–9. doi: 10.1111/j.1365-2915.1991.tb00569.x
33. Noireau F, Nzoulani A, Sinda D, Itoua A. Transmission Indices of Loa loa in the Chaillu Mountains, Congo. Am J Trop Med Hyg (1990) 43(3):282–8. doi: 10.4269/ajtmh.1990.43.282
34. Kelly-Hope LA, Paulo R, Thomas B, Brito M, Unnasch TR, Molyneux D. Loa loa Vectors Chrysops Spp.: Perspectives on Research, Distribution, Bionomics, and Implications for Elimination of Lymphatic Filariasis and Onchocerciasis. Parasit Vectors (2017) 10(1):172. doi: 10.1186/s13071-017-2103-y
35. Crewe W. The Rate of Development of Larvae of Loa loa in Chrysops Silacea At Kumba, and the Effect of Temperature Upon it. Ann Trop Med Parasitol (1961) 55:211–6. doi: 10.1080/00034983.1961.11686039
36. Gordon RM, Chwatt LJ, Jones CM. The Results of a Preliminary Entomological Survey of Loiasis At Kumba, British Cameroons, Together With a Description of the Breeding-places of the Vector and Suggestions for Future Research and Possible Methods of Control. Ann Trop Med Parasit (1948) 42(3–4):364–76. doi: 10.1080/00034983.1948.11685384
37. Kettle DS. The Effect of Light on the Biting Activity of Chrysops silacea (Diptera tabanidae). Ann Trop Med Parasitol (1953) 47(4):335–9. doi: 10.1080/00034983.1953.11685577
Keywords: loiasis, Loa loa, neglected tropical diseases, NTDs, Cameroon, environment, Africa
Citation: Badia-Rius X, Betts H, Wanji S, Molyneux D, Taylor MJ and Kelly-Hope LA (2021) Environmental Factors Associated With Loa loa Microfilaria Prevalence and Intensity in Diverse Bioecological Zones of Cameroon. Front. Trop. Dis 2:668641. doi: 10.3389/fitd.2021.668641
Received: 16 February 2021; Accepted: 19 April 2021;
Published: 12 May 2021.
Edited by:
Francesca Tamarozzi, Sacro Cuore Don Calabria Hospital, ItalyReviewed by:
Alexander Kwarteng, Kwame Nkrumah University of Science and Technology, GhanaSébastien Pion, INSERM U1175 Recherche Translationnelle sur le VIH et les Maladies Infectieuses (TransVIHMI), France
Copyright © 2021 Badia-Rius, Betts, Wanji, Molyneux, Taylor and Kelly-Hope. This is an open-access article distributed under the terms of the Creative Commons Attribution License (CC BY). The use, distribution or reproduction in other forums is permitted, provided the original author(s) and the copyright owner(s) are credited and that the original publication in this journal is cited, in accordance with accepted academic practice. No use, distribution or reproduction is permitted which does not comply with these terms.
*Correspondence: Louise A. Kelly-Hope, TG91aXNlLktlbGx5LUhvcGVAbHN0bWVkLmFjLnVr