 Marjory Moreau1*
 Liam Simms2
 Melvin E. Andersen1
 Edgar Trelles Sticken3
 Roman Wieczorek3
 Sarah Jean Pour3
 Fiona Chapman2Karin Roewer3Sandra Otte3
 Jeffrey Fisher1
 Matthew Stevenson2
- 1Scitovation LLC, Durham, NC, United States
- 2Imperial Brands PLC, Bristol, United Kingdom
- 3Reemtsma Cigarettenfabriken GmbH, An Imperial Brands PLC Company, Hamburg, Germany
With the use of in vitro new approach methodologies (NAMs) for the assessment of non-combustible next-generation nicotine delivery products, new extrapolation methods will also be required to interpret and contextualize the physiological relevance of these results. Quantitative in vitro to in vivo extrapolation (QIVIVE) can translate in vitro concentrations into in-life exposures with physiologically-based pharmacokinetic (PBPK) modelling and provide estimates of the likelihood of harmful effects from expected exposures. A major challenge for evaluating inhalation toxicology is an accurate assessment of the delivered dose to the surface of the cells and the internalized dose. To estimate this, we ran the multiple-path particle dosimetry (MPPD) model to characterize particle deposition in the respiratory tract and developed a PBPK model for nicotine that was validated with human clinical trial data for cigarettes. Finally, we estimated a Human Equivalent Concentration (HEC) and predicted plasma concentrations based on the minimum effective concentration (MEC) derived after acute exposure of BEAS-2B cells to cigarette smoke (1R6F), or heated tobacco product (HTP) aerosol at the air liquid interface (ALI). The MPPD-PBPK model predicted the in vivo data from clinical studies within a factor of two, indicating good agreement as noted by WHO International Programme on Chemical Safety (2010) guidance. We then used QIVIVE to derive the exposure concentration (HEC) that matched the estimated in vitro deposition point of departure (POD) (MEC cigarette = 0.38 puffs or 11.6 µg nicotine, HTP = 22.9 puffs or 125.6 µg nicotine) and subsequently derived the equivalent human plasma concentrations. Results indicate that for the 1R6F cigarette, inhaling 1/6th of a stick would be required to induce the same effects observed in vitro, in vivo. Whereas, for HTP it would be necessary to consume 3 sticks simultaneously to induce in vivo the effects observed in vitro. This data further demonstrates the reduced physiological potency potential of HTP aerosol compared to cigarette smoke. The QIVIVE approach demonstrates great promise in assisting human health risk assessments, however, further optimization and standardization are required for the substantiation of a meaningful contribution to tobacco harm reduction by alternative nicotine delivery products.
1 Introduction
Heated tobacco products (HTPs) offer an alternative to consuming nicotine without the need to burn tobacco or produce smoke. A portion of refined tobacco is heated in a controlled manner, never burnt, producing an inhalable aerosol which contains nicotine and flavor aromas from the tobacco. As HTPs eliminate the need to burn tobacco, and do not produce smoke, the aerosols they produce contain fewer and lower levels of harmful chemicals compared to cigarette smoke (Chapman et al., 2023). As such, heated tobacco products have the potential to provide a meaningful contribution to tobacco harm reduction (COT, 2017).
Traditionally, inhalation toxicity testing has been performed using animal models to identify various physiological outcomes, including the lethal concentration of airborne materials or maximum tolerable concentration. In vitro studies in which a solution of the aerosol ingredients is directly applied to cells in culture are not representative of an in vivo inhalation exposure due to a lack of gas phase exposure (Mulhopt et al., 2020). Additionally, these submerged in vitro conditions neither reflect realistic cell-cell communication within organ systems, cell-particle interactions and particle deposition characteristics as occurs with in vivo inhalation exposures. Another limitation would be reduced delivery of short-lived reactive compounds to the cells. In the case of aerosols, all constituents might not be delivered to the cell if compounds have poor solubility in the aqueous media. More recently, novel in vitro methods have been developed that allow the direct exposure of airborne material to cultured human target cells on permeable porous membranes at the air liquid interface (ALI), with apical surface of the cell exposed directly to smoke/aerosol and the dorsal surface of the cells bathed with cell media (Wieczorek et al., 2023). The effects of HTP and cigarette aerosols on respiratory cells cultured at the ALI can be used to study potential cell injury or activation and the release of bioactive mediators.
With these new testing approaches, new extrapolation methods will be required to interpret and contextualize the in vitro assay results. In silico simulation is a promising approach to linking in vitro inhalation exposure back to in vivo exposure (Moreau et al., 2022). Key considerations to enable interpretation and extrapolation of the data to in-life exposure include aerosol particle size distribution, fluid mechanics impacting local deposition rates, and in vivo lung morphometries (Tsuda et al., 2013).
The chemical concentration applied in vitro that elicits biological activity may be different from the blood or tissue concentration required to elicit a comparable in vivo response due to chemical bioavailability, clearance, and other pharmacokinetic (PK) considerations. Quantitative in vitro to in vivo extrapolation (QIVIVE) can provide an estimate of the likelihood of harmful effects from expected environmental exposures by effectively combining in silico and in vitro approaches including physiologically based pharmacokinetic (PBPK) modelling, and information on metabolism, transport, binding, and other model parameters from cell- and/or cell derived material-based assays.
PBPK models permit estimation of concentration-time profiles of a compound in various tissues or organs. A whole-body PBPK model contains an explicit representation of the organs that are most relevant to the absorption, distribution, excretion, and metabolism of the test articles due to their physiological/pharmacological function or their volume. The tissues are linked by the arterial and venous blood compartments, and each one of them is characterized by an associated blood-flow rate, volume, tissue-partition coefficient, and permeability. A major advantage of PBPK modeling is the creation of a comprehensive structural representation of the physiology of an organism. The various parameters in the model are either obtained from prior knowledge or calculated from specific and carefully validated formulas (Kuepfer et al., 2016). Inhalation PBPK models coupled to computational dosimetry approaches like the Multiple-Path Particle Dosimetry [MPPD, Applied Research Associates 4300 San Mateo Blvd Albuquerque; (Anjilvel and Asgharian, 1995; Asgharian et al., 1995)] are recommended for development of inhalation exposures and are probably the most effective, practical, and accurate approach (Kolli et al., 2020). The MPPD model predicts the deposition of particles in the entire respiratory tract or in a region of the respiratory tract, in adult and other age groups. These estimates of local dosimetry are usually used to characterize dose-response relationship, extrapolate between species or from in vitro assays or predict the distribution of a compound in the body when coupled to PBPK modeling.
In the present study we combined a PBPK model for nicotine with a lung deposition model (MPPD) to better understand the in vitro assay results in terms of in vivo exposure in humans of nicotine which is used as the biomarker of exposure to cigarette smoke and HTP aerosol.
2 Materials and methods
2.1 In vitro assays
2.1.1 Cell culture
BEAS-2B cells were maintained at 37°C in an atmosphere of 5% CO2 in Airway Epithelial Cell Growth Medium (AEGM), that consisted of AEGM (Promocell, C-21060) complemented with SupplementMix (Promocell, C-39165) containing Bovine Pituitary Extract 0.004 mL/mL, epidermal growth factor (10 ng/mL), insulin (5 μg/mL), Hydrocortisone (0.5 μg/mL), Epinephrine (0.5 μg/mL), Triiodo-L-thyronine (6.7 ng/mL); holo-Transferrin (10 μg/mL), Retinoic acid (0.1 ng/mL). Sub-cultivation was performed twice a week in T175 cell culture flasks with a cell seeding density of 8.7E5 and 5E5 cells per flask when cultivated over 3 and 4 days respectively.
2.1.2 Cell seeding and treatment
Cells were seeded on cell culture inserts designed to be used with microscopic analysis technologies (Millicell Cell culture inserts: Millipore PICM01250). In brief: Cells were seeded using 400 µL of a cell suspension with 3.5E5 cells/mL per cell culture insert. The loaded cell culture inserts were placed into 24-well plates filled with 250 µL AEGM medium. Cells were incubated overnight (appr. 18 h) at 37°C and 5% CO2 to allow adherence and growth on the cell culture insert membrane. On the next day just before exposure, the medium from the apical compartment of the inserts was removed and the inserts were transferred into new 24-well plates with 250 µL HEPES buffered Dulbecco’s minimal essential medium per well. A 24-well plate with the inserts was placed into one of the exposure chambers of the Smoke Aerosol Exposure In Vitro System [SAEIVS, (Wieczorek et al., 2023)]. Smoke/aerosol exposure was executed as described in Table 1. Following exposure, the plate with the inserts was removed from the SAEIVS.
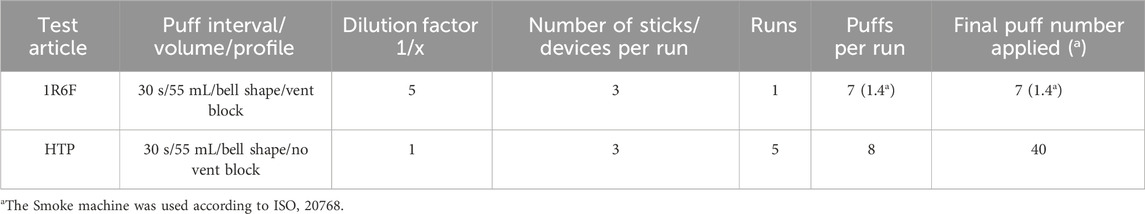
Table 1. Smoke/aerosolization and sample conditions used with the SAEIVS for the high content screening experiments for the ALI exposure of BEAS-2B cell to derive a MEC.
Cell culture inserts with the treated cells were transferred into new 24-well plates filled with 250 µL AEGM medium. Pre-warmed AEGM medium (400 µL) was added to the cells in the apical compartment of the inserts. Cells were allowed to recover and kept in the incubator for 24 h at 37°C and 5% CO2. Medium was removed from both compartments and 200 µL 4% formaldehyde in PBS was added to the apical part of the insert for a 15-min fixation step at room temperature.
To compare the effective concentrations of each product type, a study was designed to assess both the number of puffs delivered to the cells (BEAS-2B) and the amount of nicotine delivered at the cell surface. Separate experiments were adopted using glass plates of the same surface areas as the Millipore inserts (and therefore the cell layer surface) and the same puffing parameters and diluted/undiluted smoke/aerosol from the same product variants. For cell exposure, cigarette smoke (1R6F) was diluted 1:5 (smoke: fresh humidified filtered air) and 1:1 (aerosol: fresh humidified filtered air) for the HTP. The aim of this experiment was to determine the number of puffs required for each product to cause a minimum effective concentration (MEC) for the c-jun cellular marker, measured using high-content screening (HCS) and to determine the number of puffs required to deliver nicotine to the cell surface (using glass plates to collect the deposited material). The marker c-jun was chosen as this was the most sensitive of a panel of selected cellular stress markers used with the HCS technique in-house. The aim was to be as conservative as possible, by using the most sensitive cellular marker using our experience with HCS. The MEC is defined as the lowest effective concentration outside of the background negative control range. The MEC had to exceed the calculated background [=3x median absolute deviation (mad)], that was determined by linear or non-linear regression (decided by the best curve fit). For comparative MEC calculation, the average 3x mad of all treatments for c-jun was used as target value. The Phosphorylation of c-jun (p-c-jun) defines a cellular stress marker which is involved in several signal pathways including proliferation, apoptosis, survival, tumorigenesis, and tissue morphogenesis (Schmeck et al., 2006; Dreij et al., 2010).
2.1.3 Cell surface for nicotine deposition
Previous work has assessed the effect of adding cells (V79 Chinese Hamster lung fibroblast cells and BEAS-2B) to the surface of the glass and compared to the cell-free glass surface. The deposition of nicotine on both surfaces was comparable and so clean glass slides were subsequently used (Wieczorek et al., 2023).
2.1.4 Nicotine evaluation from glass plates and cell medium
Nicotine was quantified using LC-MS/MS method (Internal Standard: Nicotine-d4). Nicotine trapped in cell media and PBS was measured directly without any further sample preparation. Whereas the nicotine trapped on the surface of the glass disc was eluted with isopropanol prior to final measurement.
Nicotine quantification of isopropanol extracts from exposed glass discs and basal medium was conducted using LC-MS/MS (AB Sciex API 6500 QTRAP (SCIEX, Darmstadt, Germany)). For analysis, medium samples were diluted 1:100 with MilliQ water/MeOH (1:1) and 1:1 in the autosampler with the internal standard solution in methanol. A Gemini NX-C18 column (110 Å, 100 × 2.0 mm, 3 µm) (Phenomenex, Aschaffenburg, Germany) was used for the liquid chromatography (oven temperature, 55°C), sample injection volume was 5 µL and the autosampler temperature was 5°C. The eluent gradient was applied according to the following: 0min: 2% B (methanol)/98% A (0.05% acetic acid in water) (flow rate: 400 μL/min); 1.2 min: 65% B/35% A (400 µ/min); 1.5 min: 95% B/5% A (400 µ/min); 2.5 min: 98% B/2% A (400 µ/min); 3.0 min: 98% B/2% A (400 µ/min). The following conditions were used for the mass spectrometry: Ion spray voltage: 4500V, Ion source temperature: 500°C, MRM: 163/132 quantification; 163/106 qualifier. The isopropanol samples were diluted 1:100 with MilliQ water/MeOH (1:1) and without autosampler dilution because internal standards were present in samples extraction and calibration solution. All other measurement parameters were the same as above.
To trigger the p-c-jun response in BEAS-2B cells, the cells were exposed to fresh smoke/aerosol from 1R6F/Pulze used with iD sticks (HTP). For details of the Pulze device and the iD sticks please see Chapman et al. (2023). The BEAS-2B cells were pre-grown on microporous membranes of dedicated cell culture inserts and supplied with medium apically and basally. For exposure to fresh smoke from the Reference Cigarette 1R6F and aerosol from Pulze and iD the cells were switched to ALI conditions (i.e., apical medium was aspirated) where nutrification of the cells is achieved from the lower compartment below the insert-containing well only. The use of the ALI exposure is key. In vitro exposure systems that deliver aerosols to the surface of human cells cultured at ALI are of particular importance being the most physiologically relevant exposure route, and highly preferable to using submerged cell lines (Upadhyay and Palmberg, 2018). Upadhyay and Palmberg (2018) identified several factors influencing the successful development of ALI-models including the choice of cell line (preferably human), the source of any primary cells, and the use of co-culture systems consisting of multiple cell types (Clippinger et al., 2016). The use of an ALI system is also considered to be a feasible alternative approach and can be used to implement the “3 Rs principle” replacement, reduction, and refinement of animal usage—in conducting pulmonary toxicity studies (Upadhyay and Palmberg, 2018). The apical surface of the inserts with the cells were exposed directly to fresh aerosol and smoke in the in-house Smoke and Aerosol Exposure In vitro System (SAEIVS). This is an in-house built system to enable the delivery of whole aerosols directly to cells at the ALI, being able to deliver different dilutions of aerosol/smoke to two separate cell exposure chambers in under 10 s of generation [for more details and characterization of the system see Figure 1; Wieczorek et al. (2023)]. Following exposure to the aerosol/smoke the cells were covered with recovery medium and were incubated for 24 h before fixation and subsequent antibody staining for p-c-jun.
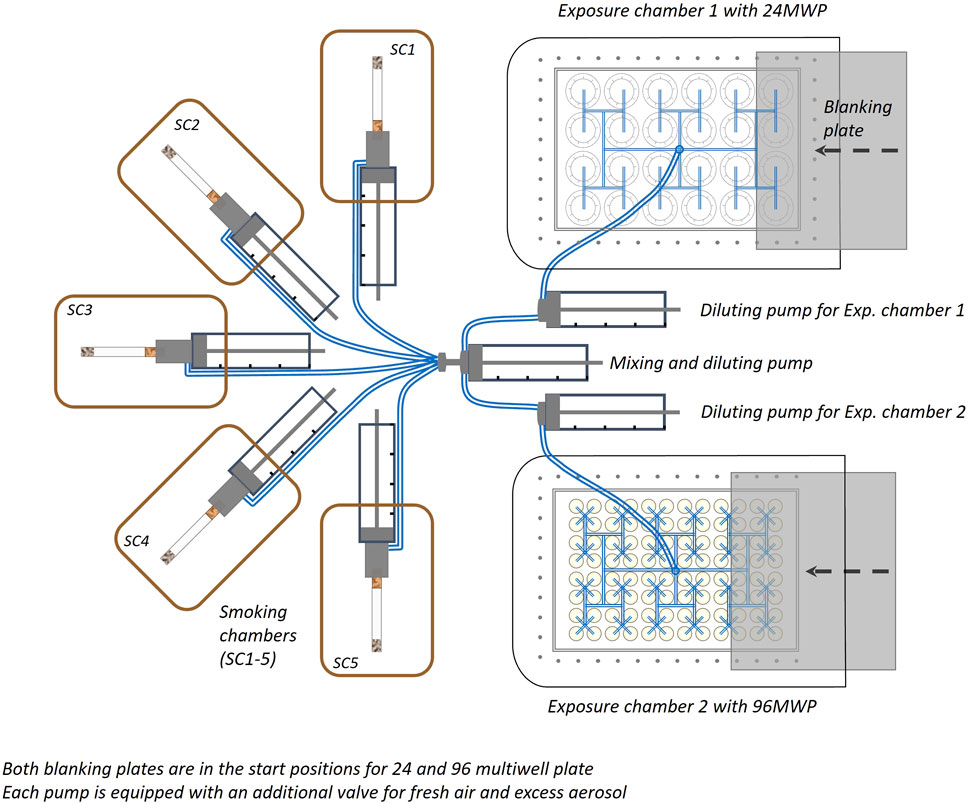
Figure 1. Diagram of the Aerial view of the smoke/aerosol exposure in vitro system (SAEIVS). The system consists of five smoking chambers (SCs), which can accommodate cigarettes, electronic nicotine delivery systems and heated tobacco products (in respective runs). The smoke/aerosol generated is then drawn through tubing to a mixing and diluting pump (with charcoal filtered, humidified air). Each exposure chamber also has a further individual diluting pump to allow cells to be exposed different concentrations if required. The exposure chambers can accommodate either 24 or 96 well plates, and smoke/aerosol is delivered to individual wells via ports situated above each individual well. Between the exposure ports and the cell culture plate, a blanking plate can be moved (robotically) to prevent exposure to rows. As the blanking plate moves across the row of wells exposed, preventing subsequent exposure, an increasing dose can be delivered to uncovered rows.
The study was composed of two parts.
1 - The quantification of phosphorylated c-jun protein in nuclei of BEAS-2B cells after direct exposure to diluted fresh smoke of 1R6F Reference cigarette and to undiluted fresh aerosol of Pulze and iD sticks at the ALI using the SAEIVS. The aim of this part of the study was to determine the p-c-jun MEC for both test articles on a puff basis by means of HCS technology.
2 - A dosimetry approach to determine the amount of nicotine delivered in the SAEIVS per well equipped with inserts corresponding to those used in part 1 of the study. Glass plates were loaded on top of the membranes to mimic the cell surface for smoke/aerosol deposition, with nicotine as the key dosimetry marker. Following exposure of those glass plates, they were extracted with isopropanol and the amount of nicotine trapped per glass plate was measured.
2.1.5 Combination of HCS and nicotine data
Following the determination of MEC and finalization of nicotine dosimetry, the data were combined to determine the MEC on a nicotine basis. To this end the MECpuff from the HCS approach was used to determine the MECnic by using the MECpuff in the equation of the nicotine dosimetry.
2.2 MPPD modeling
Respiratory tract deposition models consider the anatomic structure of the respiratory tract, the air flow patterns and the aerodynamic characteristics of the particles to predict the deposited dose in each region. Lung deposition was calculated using the MPPD model (MPPD version 3.04) available from the Applied Research Associates webpage (https://www.ara.com/mppd/).
The MPPD model includes both human and rat respiratory tract models of the deposition and clearance of spherical particles. It predicts the deposition and clearance of monodisperse and polydisperse aerosols in the respiratory tracts for particles ranging in size from ultrafine (1 nm) to coarse (100 µm). Several factors can influence deposition including the concentration of the chemical/particles in the air, the aerodynamic characteristics of particles, the frequency and duration of exposure, the physiological inhalation parameters such as the anatomical structure of the respiratory tract, breathing patterns, and interaction with other airborne particles (Rozman and Klaassen, 2001).
In the simulations presented here, the stochastic model was parameterized to have upright body positioning and oral breathing at constant exposure conditions. Different scenarios of exposure were tested and deep breathing at resting, with a short breath hold chosen for the simulations. This corresponds to a breathing rate of 12 breaths per min, a tidal volume of 1.3 L, an inspiration fraction of 0.5, a pause fraction of 0.1 and finally inhalation and exhalation times of 2.5 and 2 s, respectively. This scenario was chosen as the best one based on smoking habits (McEwan et al., 2019). In his review, Bernstein (2004) describes a specific pattern of smoking with 2 phases: The initial puff is first taken into the mouth and after a pause of 1–4 s, the smoke is then inhaled into the lungs.
We used the stochastic lung model as it represents asymmetric structures of the tracheobronchial region of a human lung. This model describes the randomness and asymmetry of the airway branching system. This lung model is based on distributions of morphometric parameters such as length, diameter, branching angle, cross-sectional area of the daughter tubes, gravity angle, and correlations between these parameters as a function of airway generation (Asgharian et al., 2001). This provides more realistic lung geometry than the symmetric lung models in MPPD (Yeh-Schum Single path, Yeh-Schum 5-Lobes, PNNL symmetric model or Weibel symmetric model). There are 10 models within the stochastic lung model ordered in size (total number of airways) from the smallest to the largest and the approximate size percentile of each lung. The 60th percentile human stochastic lung model was used for our simulation.
Concerning the particle size diameter for IVIVE, the mass median aerodynamic diameter (MMAD) was set to 0.8 µm with a geometric standard deviation (GSD) of 1.3 for 1R6F and 0.7 µm with a GSD of 1.5 for HTP based on Schaller et al. (2016). GSD represents the geometric standard deviation, and the larger the GSD value, the greater the spread of the aerosol diameter of the particles.
We also chose to incorporate an inhalability adjustment to the simulations. This is an adjustment for particle size larger than 8 µm. The probability that these are inhaled is less than 1 and decreases with increasing particle size. This correction is used to account for expected inertial deposition of the larger particles (Asgharian et al., 1995).
2.3 PBPK modeling
2.3.1 Model development and structure
The absorption, distribution, metabolism, and excretion (ADME) properties of nicotine have been previously studied in different species (Benowitz et al., 2009a; Benowitz et al., 2009b). Nicotine is metabolized quickly in the liver, primarily by cytochrome P450s (CYP2B6 and CYP2E1) and has relatively low plasma protein binding (Benowitz et al., 2009a; Benowitz et al., 2009b). Large venous blood nicotine concentrations are produced within minutes after nicotine inhalation as the lungs offer a large surface area for absorption and a favorable dissolution pH of 7.4. Several PBPK models have been developed for nicotine (Plowchalk et al., 1992; Robinson et al., 1992; Teeguarden et al., 2013; Haghnegahdar et al., 2018).
The PBPK model developed here has perfusion-limited compartments for liver and lung and lumped compartment for the remaining tissues (rest of the body). Inhalation of aerosols is a complex process, and PBPK models with regional lung compartments are more descriptive. Here, we use a multicompartment respiratory tract model. Based on anatomical location and function, the respiratory tract is divided into three regions: upper respiratory tract (URT), trachea-bronchial region (TB) and alveolar region. There is also a pulmonary compartment which represents the gas exchange region of the lung. To include processes that transport the absorbed nicotine across the anterior respiratory tract compartments, these regions are further divided into a two-layered substructure: an epithelial cell layer with mucus, and a submucosal tissue layer. The submucosal tissue layer has blood perfusion and clears the absorbed nicotine from the airway compartments. Consistent with common practice, the tissue compartments are well-mixed reservoirs. Exposure is characterized in each lung (inhalation) compartment based on calculated deposition rates. Elimination occurred from both the liver and the blood compartment and was represented by hepatic and renal clearance, respectively. The model structure is shown schematically in Figure 2.
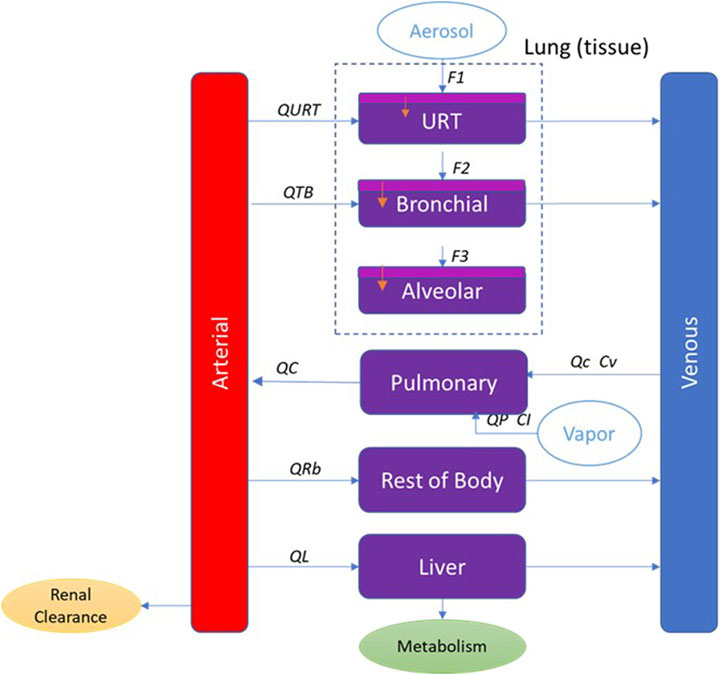
Figure 2. PBPK model schematic for nicotine showing the representation of the main organs considered with various sub-compartments in the lung for inhalation exposure. QL, QRb, QC, QTB, and QURT refer to blood flow to each tissue compartment. QP refers to the alveolar ventilation rate. Cv refers to the venous concentration and CI to the inhaled vapor concentration. F1, F2, and F3 refer to the fraction deposited in each region of the respiratory tract. In the respiratory tract (URT, bronchial and alveolar), the light purple represents the mucus and epithelium, and the dark purple represents the submucosa region where blood perfusion occurs.
The physiologically-based biokinetic (PBBK) model was developed in Berkeley Madonna software (version 10.1.3; University of California, Berkeley, CA; www.berkeleymadonna.com). Model equations are in Supplemental 1.
2.3.2 Model parameters
Parameters used in the current model are summarized in Table 2. Tissue blood flows are from our ScitoVation database for an adult male (internal database not shown), except for the blood flow to the upper respiratory tract (URT) that was set according to Campbell et al. (2015) and the blood flow to the alveolar region that was set according to Butler (1992). The ScitoVation database includes age-specific physiological parameters for body weight (BW), cardiac output, tissue weights (volumes), and tissue blood flows, and are adapted from published life-stage models (Wu et al., 2015; Song et al., 2016; Ruark et al., 2017).
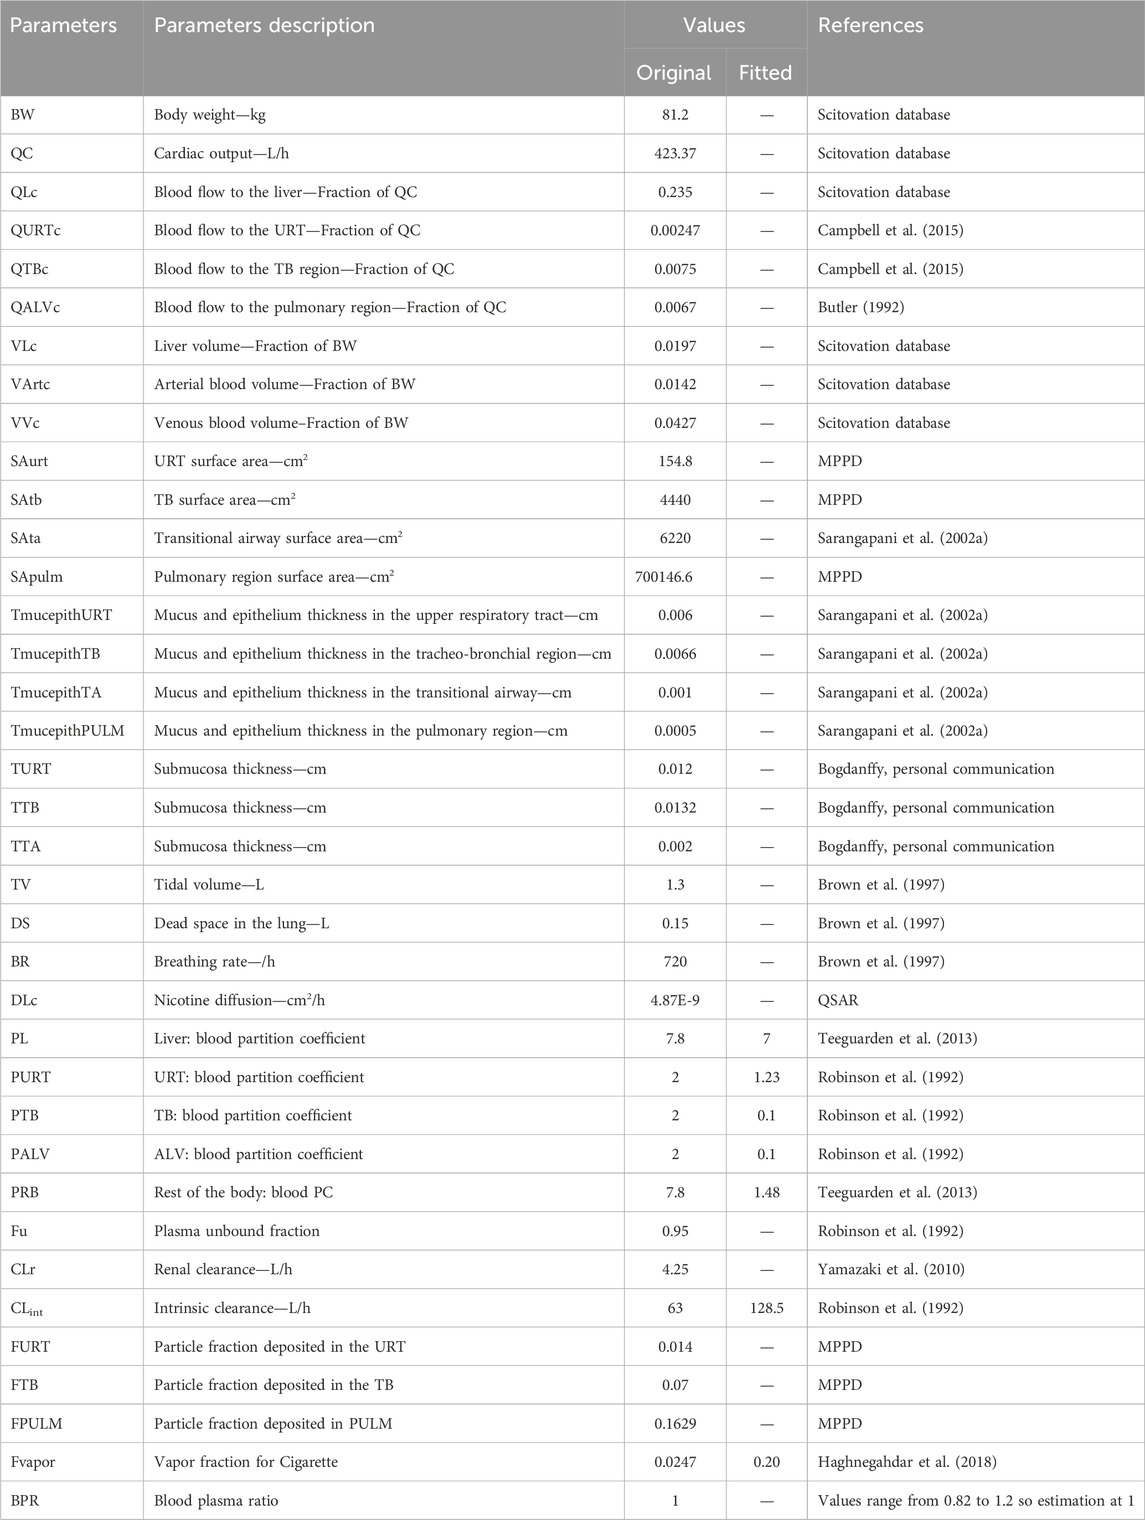
Table 2. Physiological and biochemical parameters used for the nicotine PBPK model.
Volumes were set to values from the ScitoVation database except for the lung volume. Tissue volumes for the three respiratory-tract compartments were estimated by multiplying the appropriate surface area with the tissue thickness. The surface area of the three lung regions was estimated using a standard lung model (MPPD) that quantifies airway length and diameter on a generation-by-generation basis. Epithelial thickness was obtained from Sarangapani et al. (2002b). The submucosal thickness was assumed to be approximately twice the epithelium thickness, based on histological sectioning (Matthew Bogdanffy, personal communication).
Chemical-specific parameters such as hepatic intrinsic clearance and renal clearance were obtained from previously published PBPK model from Robinson et al. (1992) and Yamazaki et al. (2010). Robinson et al. (1992) estimated a hepatic clearance of 1.09 L/min, using a PBPK model calibrated with in vivo human data.
Tissue: blood partition coefficients (PC) are defined as the ratio of the concentration of a test chemical in two media (i.e., tissue and plasma), once equilibrium is reached. PCs are important determinants of the disposition of chemicals in different tissues. Liver PC was from Teeguarden et al. (2013). The other PCs (the rest of the body and lung compartments) were fitted to the in vivo human data. Plasma protein binding of approximately 5% has been reported by Robinson et al. (1992).
Nicotine permeability was taken from literature. There was some variability in reported values: 1.0E-4 cm/s from Gowadia and Dunn-Rankin (2010), 1.28E-4 cm/s from Waddell and Marlowe (1976), 2.5E-5 cm/s and 1.14E-5 cm/s from a QSAR model used by Symcyp. We opted to use the QSAR value as it was giving a better fit with the in vivo PK data. The nicotine permeability was multiplied by the tissue thickness in the experiment to derive a diffusion coefficient in cm2/s.
The fraction of particles deposited in each of the lung compartments was estimated using the MPPD model. To validate the model, we simulated individuals with deep breathing at rest with a short breath hold. Most of the studies used to validate the model did not provide direct information about the scenario of exposure. In most of the studies, volunteers were at rest, i.e., reading quietly, working, or engaging with social media. Based on smoking behavior found in different publications (Pichelstorfer et al., 2016; McEwan et al., 2019), a deep breath at resting and a short breath hold seemed to be the more appropriate scenario to reflect the human in vivo data used to validate the model.
The fraction of vapor inhaled for cigarettes was fitted to the data. Here the particle size diameter, the count median diameter (CMD) was set to 163 nm with a geometric standard deviation (GSD) of 1.44 for cigarettes based on Fuoco et al. (2014) and Sosnowski and Kramek-Romanowska (2016). These values were used for the calibration and validation of the model.
2.3.3 Model calibration and validation
The performance of the model was first evaluated using the in vivo pharmacokinetic (PK) data (plasma concentrations between 0–4 h post exposure) from McEwan et al. (2019) where 48 healthy subjects smoked a single assigned test cigarette and had blood drawn on the morning of each visit. In the afternoon, the smoking behavior assessment was carried out with a single use of the same test product.
The model was also validated using 2 other in vivo PK datasets from Picavet et al. (2016), and Digard et al. (2013).
Picavet et al. (2016) assessed the PK of nicotine after a single use of cigarette in 28 healthy smokers. The cigarettes assessed in this study were non-menthol, manufactured, commercially available cigarettes, with a maximum ISO yield of 1 mg nicotine per cigarette. The pharmacokinetics of nicotine were measured on the days of single use. The first blood sample was collected within 15 min before a single use of the allocated product in the morning, and then at 2, 4, 6, 8, 10, 15, 30, 45, and 60 min, and at 3, 4, 6, 9, 12 and 24 h.
Digard et al. (2013) conducted a study with 20 healthy cigarette users. A cigarette was smoked, and blood samples taken at intervals over 120 min. The subjects were instructed to smoke the cigarette naturally according to their usual smoking behavior for 5 min or until the cigarette had been smoked to 30 mm from the mouth end (if this occurred in less than 5 min), at which point the cigarette was extinguished.
All the puffing scenario and dose (1 mg nicotine) used in each of these studies were the same with a puff duration of 2.3 s, puff interval of 30 s, puff volume of 69.5 mL and number of puffs per cigarettes of 14. Puff duration, number of puffs and puff volume for cigarette were based on McEwan et al. (2019). The puff interval was assumed to be 30 s (Bernstein, 2004).
The dose of nicotine in one cigarette was assumed to be 1 mg (the amount varies between brands but is usually between 0.7 and 1 mg) (EU, 2014).
2.3.4 Normalized sensitivity analysis
To evaluate the relative impact of each of the model parameters on nicotine plasma maximal concentration (Cmax) and area under the curve (AUC), a sensitivity analysis was performed. The sensitivity coefficient (SC) was calculated according to the equation below (Teeguarden et al., 2005).
Each parameter was individually increased by 1% of its original value, with the other parameters held constant. The larger the absolute value of the sensitivity coefficient, the more important the parameter. A normalized sensitivity coefficient of 1 represents a 1:1 relationship between the change in the parameter and the internal dose metric of choice. A negative SC indicates the given parameter influences the dose metric in an inverse direction. The SCs are grouped into one of three categories: namely, high (absolute SC values greater than or equal to 0.5), medium (absolute SC values greater than or equal to 0.2 but less than 0.5), or low (absolute SC values greater than or equal to 0.1 but less than 0.2), according to the IPCS guideline (WHO, 2010).
2.4 In vitro to in vivo extrapolation
The goal was to estimate the Human Equivalent Concentration (HEC) from in vitro assays and nicotine plasma concentration. Three steps were followed to derive a tracheobronchial epithelium concentration equivalent to an MEC from an in vitro assay (Figure 3).
- Estimate the fraction deposited for a scenario type with MPPD.
- Use the fraction deposited from MPPD in the PBPK model and by reverse dosimetry derive the exposure concentration that matches the estimated in vitro deposition POD. BEAS2B cells were used so we used the amount deposited in the tracheobronchial region to perform reverse dosimetry (AT2 in the model code).
- Simulate plasma concentration using the PBPK model.
Figure 3. In vitro to in vivo extrapolation. Physiological parameters as well as parameters describing ADME processes of the chemical through the system were used to develop a PBPK model that can be used to predict the population distribution of lung concentration from any given daily dose. Reverse dosimetry predicts administered doses equivalent to in vitro active concentration, which can be compared to the in vivo measurements [Adapted from Bell et al. (2018)].
3 Results
3.1 In vitro assays
1R6F exposure of BEAS2B to air-diluted smoke (1:5) with a subsequent recovery of 24 h was performed. Figure 4 shows the calculation of the minimum effective concentration (MEC), and Figure 5 is the calculation of nicotine mass corresponding to the MEC threshold captured on glass plates.
Figure 4. Number of puffs of 1R6F to reach the MEC for p-c-jun using high content screening.
Figure 5. Graph comparing the nicotine mass deposited by 1R6F on to glass slides at the corresponding number of puffs required to the reach the MEC using High Content Screening.
The same experiments were also conducted for HTP and Figures 6, 7 below shows the p-c-jun HTP results, with the MEC and number of puffs required to reach the MEC.
Figure 6. Number of puffs of HTP required to reach the MEC for p-c-jun using High Content Screening.
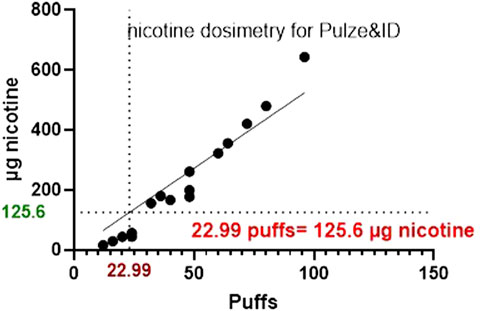
Figure 7. A graph comparing the nicotine mass deposited by HTP on to glass slides at the corresponding number of puffs required to the reach the MEC using HCS.
3.2 MPPD modeling
Cigarette deposition fractions in the respiratory tract used to calibrate and validate the PBPK model can be found in Table 2. With a CMD of 0.163 µm and GSD of 1.44 and according to the scenario of exposure described in the method section, the deposition fractions in the head, the trachea-bronchial region and the pulmonary region were 0.0147, 0.0673 and 0.1629, respectively. The total deposition fraction equaled 0.2449.
3.3 PBPK modeling
3.3.1 Model calibration and evaluation
Figure 8 shows the results of the performance of the model when evaluated using the in vivo PK data for nicotine from McEwan et al. (2019). A qualitative evaluation of the agreement between experimental plasma concentration and simulations was conducted through visual inspection of the time-course, where good agreement is generally defined as simulations falling within a factor of two of the data (EPA, 2006). In addition, IPCS (2010) guidance on “Principles of Characterizing and Applying PBPK Models in Risk Assessment” states that “In PBPK modeling, predictions that are, on average, within a factor of 2 of the experimental data have frequently been considered adequate”.
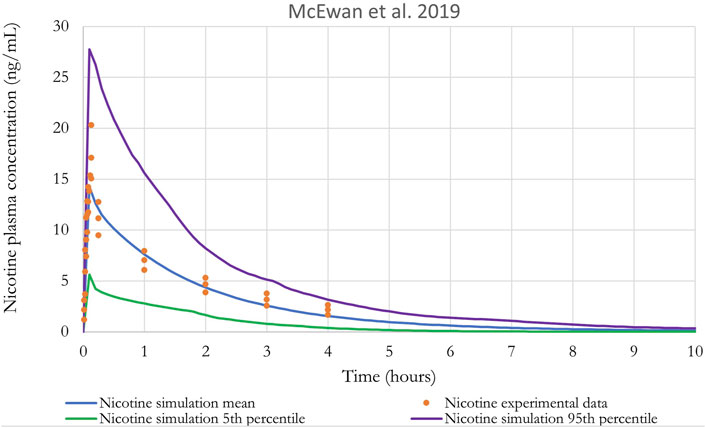
Figure 8. Nicotine plasma concentration in adult humans following inhalation exposure (1 mg). The solid line is the simulated venous concentration in ng/mL and the red circles are the PK data from McEwan et al. (2019) in ng/mL (mean ± SEM).
Monte Carlo (MC) analysis was also conducted to investigate the population variability. Only the sensitive parameters from the sensitivity analysis were varied. Partition coefficients, body weight, breathing rates, and metabolic constants were simulated as log normally distributed; and cardiac output, blood flows, tissue volumes and parameters related to puffing scenario (puff volume, puff duration, puff interval) were simulated as normally distributed. The coefficients of variation (CV) for partition coefficients were 30%, a CV of 22% and 16% were used for the body weight and for the blood flow to the liver, respectively (Price et al., 2003), while a CV of 30% was assumed for the remaining model parameters. The distributions were truncated at 2 Standard deviations (Clewell and Clewell, 2008) to ensure physiological plausibility. Parameters distribution can be found in Supplementary Table S1. Monte-Carlo simulations were performed with 100 iterations to perform population-level simulations. Mean or median plasma concentration as well as the 5th and 95th percentiles are graphically represented in Figures 8–10. For IVIVE, Monte-Carlo simulations were performed with 1,000 iterations to perform population-level simulations.
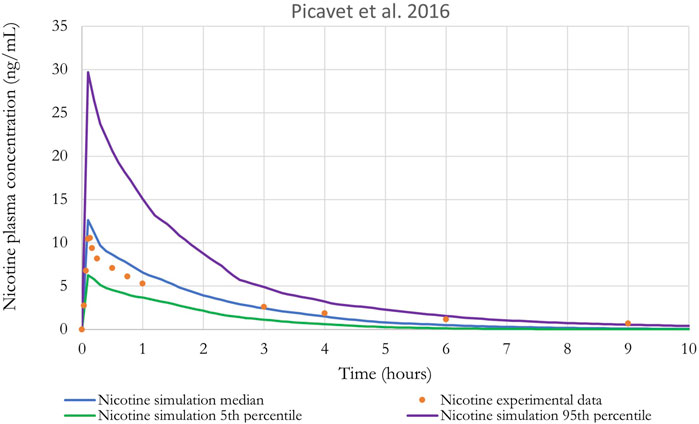
Figure 9. Nicotine plasma concentration in adult humans following inhalation exposure (1 mg). The solid line is the simulated venous concentration in ng/mL and the red circles are the PK data from Picavet et al. (2016) in ng/mL.
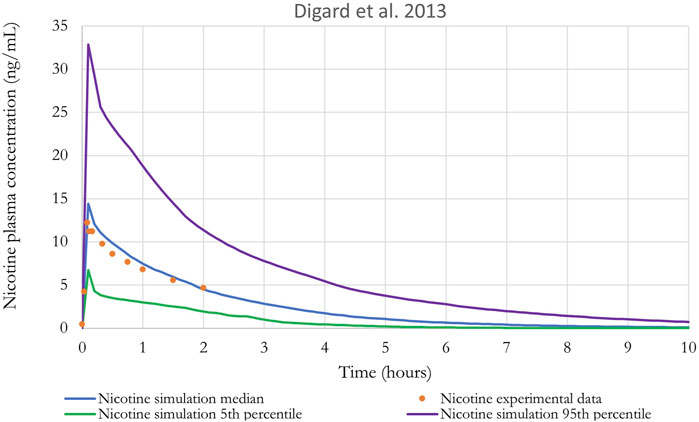
Figure 10. Nicotine plasma concentration in adult humans following inhalation exposure (1 mg). The solid line is the simulated venous concentration in ng/mL and the green circles are the PK data from Digard et al. (2013) in ng/mL.
The performance of the model was also evaluated using in vivo nicotine PK studies with cigarettes (Digard et al., 2013; Picavet et al., 2016). Simulations results can be found in Figures 9, 10. The PBPK model predictions were consistent with the nicotine concentrations in plasma in adult humans.
3.3.2 Sensitivity analysis
The sensitivity of model parameters was calculated with the human PBPK model for the plasma maximum concentration (Cmax) and area under the curve (AUC) after low and high inhalation doses of nicotine (1.2 and 12 mg). Results from the normalized sensitivity analysis are in Supplementary Figure S1. The most sensitive parameters are the ones related to inhaled dose: puff duration, puff interval, breathing rate, tidal volume, puff volume and fraction of vapor. The analysis showed that physiological parameters, including body weight, cardiac output and blood flow to the liver are medium to highly sensitive. The parameter for particle deposition in the pulmonary region is also a medium-sensitivity parameter. Note that hepatic metabolism parameters showed no sensitivity for plasma Cmax but medium sensitivity for the plasma AUC. This does not mean that metabolism is not influential in plasma Cmax, but indicates that metabolism is so efficient, i.e., CLint_in vivo very much exceeds liver plasma flow and a 1% increase in the parameter value would not make a difference, as it is largely limited by liver plasma flow, which is one of the most sensitive parameters.
The uncertainty of a model reflects the level of confidence in model predictions. The structure of the model is based on previously published models (Plowchalk et al., 1992; Robinson et al., 1992) where we included a more complex description of the lung to be able to link a dosimetry model (MPPD). The vapor fraction for cigarette was fitted to the data. For vapor absorption, we assumed that vapor would be completely absorbed in the deep lung. A more complex description of vapor absorption along the respiratory tract may provide simulations more similar to the observed data.
3.4 In vitro to in vivo extrapolation
The mass median aerodynamic diameter (MMAD) was set to 0.8 µm with a geometric standard deviation (GSD) of 1.3 for 1R6F and 0.7 µm with a GSD of 1.5 for HTP based on Schaller et al. (2016). For the PBPK model, we used values from McEwan et al. (2019) and O'Connell et al. (2019) with a puff duration of 2.3 s, a puff interval of 30 s, a puff volume of 69.5 mL and a number of puffs per cigarettes of 10. Results from MPPD modeling are presented in table 3.

Table 3. Nicotine fraction deposited for 1R6F and HTP in MPPD.
We used the PBPK model and predicted the dose of nicotine per cigarette necessary to reach the MEC for both 1R6F and HTP. Monte Carlo simulations were used to estimate median, 5th and 95th percentiles for the amount of nicotine in the epithelium of the tracheobronchial region (AT2) for individuals exposed to the same, fixed dose (1 mg). Since the upper 95th percentile individuals have higher amounts for the same exposure, they are an example of a sensitive population. Then, reverse dosimetry predicted administered doses equivalent to the active concentrations from the in vitro assays (MEC of 0.072 and 0.77 µmol for 1R6F and HTP, respectively). The exposure concentration necessary to reach the MEC are in Table 4, and equivalent plasma concentrations are shown in Table 5.
Table 4. Human equivalent exposure concentrations predictions using MPPD-PBPK modeling and the MEC values reported in Figures 4–6 and typical cigarettes and HTP nicotine content for comparison.
Table 5. Plasma concentrations of nicotine are predicted using MPPD-PBPK modeling, and the HEC values reported in Table 4 and blood concentrations predicted after exposure to the classic nicotine content.
To derive the plasma concentration, we used two scenarios, one where only one cigarette is consumed (at the HEC for both cigarettes and HTP stick and at 1.03 mg nicotine for comparison with nicotine content in cigarettes or 1.85 mg nicotine for HTP stick) and a second scenario where 10 cigarettes are consumed over time (at the HEC × 10 for the total dose of nicotine over the 10 sessions and at 10.3 mg or 18.5 mg nicotine which means 1.03 mg nicotine per cigarette or 1.85 mg nicotine per HTP stick × 10 sessions). For each session, the parameters used were that a cigarette was smoked entirely after 10 puffs, a single puff every 30 s (5 min) and a single cigarette was smoked every hour.
Table 4 shows the margin of exposure (MOE), which is the ratio between the nicotine content necessary to reach the MEC and the classic nicotine content of each cigarette. Results mean that after smoking the equivalent of 1/6th of a 1R6F cigarette, the MEC is already reached. However, for HTP, puffing almost 3 HTP sticks at the same time would be required to reach the MEC.
Plasma concentrations predicted after exposure to the classic nicotine content (1.85 and 1.03 for 1R6F and HTP, respectively) and after exposure to the nicotine content at the MEC are in Table 5. Concentrations in plasma are reported after exposure to a single cigarette/stick and after 10 cigarettes/sticks to approximate a plasma steady state for nicotine. Table 5 shows that nicotine plasma concentrations range from 4 to 28 ng/mL after exposure to 1 stick of 1R6F at the MEC and at a nicotine concentration of a classic cigarette, respectively. For HTP, nicotine plasma concentrations range from 15.5 to 46.5 ng/mL after exposure to 1 stick at a nicotine concentration of a classic HTP and at the MEC, respectively.
When a steady state is reached after 10 cigarettes or 10 HTP sticks (1R6F and HTP), simulations suggest that plasma concentrations have doubled. The plasma concentration of nicotine is not higher because between each stick, nicotine is rapidly eliminated.
4 Discussion
To better understand the applicability of in vitro assay results in terms of in vivo exposure in humans, it is necessary to develop computational tools to describe the PK of nicotine, a key biomarker of exposure to cigarettes and HTPs. In this study, we have combined a PBPK model for nicotine with a lung deposition model (MPPD) to better predict nicotine deposition and to model the pharmacokinetics of nicotine with use of either a HTP or cigarette. We have parameterized and exercised the MPPD model to characterize particle deposition in the respiratory tract and developed a PBPK model for nicotine that was validated by comparisons with human data from in vivo clinical studies. Finally, we estimated Human Equivalent Concentration (HEC) and plasma concentrations based on minimum effective concentration (MEC). This was derived by exposing BEAS-2B cells to 1R6F or HTP diluted smoke/aerosol and detecting c-jun activation using high content screening to then calculate the MEC as the point of departure.
Regarding the health consequences associated with tobacco use, several biomarkers of exposure for smoking have been reported (Benowitz et al., 2009b; Chang et al., 2017). In this study, we chose to measure nicotine as it has been studied extensively and is routinely measured in human clinical studies investigating exposure to nicotine-containing products and because of its relative stability for measurement (Crooks et al., 2013). Overall, the MPPD-PBPK model adequately recapitulated the in vivo kinetic data of nicotine from human studies with cigarettes. Good agreement with model predictions, generally within a factor of two of the data, was obtained. IPCS (2010) guidance on “Principles of Characterizing and Applying PBPK Models in Risk Assessment” states that “In PBPK modelling, predictions that are, on average, within a factor of 2 of the experimental data have frequently been considered adequate”.
One advantage of PBPK models is their potential to account for population variability. Interindividual variations in metabolism is usually well-documented in humans (Tyndale and Sellers, 2002; Hukkanen et al., 2005). Other causes of variability include the absorption of nicotine (different scenario of exposure depending on product uses) or differences in products used for nicotine delivery (e.g., cigarettes vs. HTP) and the physico-chemical characteristics of particles. The impact of changes in particle size through MPPD modelling or in scenarios of exposure (smoking habits) can be studied with a PBPK model. Supplementary Figure S2 in supplemental, for example, shows the regional deposition fractions of inhaled aerosol particles as a function of different breathing scenarios (Supplementary Material S1, Supplementary Table S2). MPPD calculations of deposition in the head and tracheobronchial regions were very similar for many breathing patterns. However, deposition in the pulmonary region is highly dependent on breathing pattern and increases with longer breath hold and deeper, slower breath. In all cases, the total deposition is less than 40%. Concerning smoking habits, Jones et al. (2020) reported that the puffing data also provides evidence suggesting that consumers are, on average, more likely to take larger puff volumes when using a HTP compared to a classic cigarette. This observation is consistent with studies showing that HTPs lead to lower nicotine exposure (Bekki et al., 2017; Uchiyama et al., 2018; Vukas et al., 2023). Lower nicotine delivery could lead to compensatory puffing when product use does not sufficiently satisfy cravings (Vukas et al., 2023). Consumer use-behaviour and consumption data help ensure that modelling is reflective of real-world consumers. In this study, we assumed the same use-behaviour for cigarettes and HTPs users as the difference in nicotine levels between cigarettes and HTPs were not clear in all studies (Mallock et al., 2018; Salman et al., 2019; Rabenstein et al., 2023). Nicotine delivery and consumer satisfaction has also been shown to remain comparable between cigarette smoking and HTP use (Ogden et al., 2015; Picavet et al., 2016; Brossard et al., 2017; Roulet et al., 2019).
Public health experts worldwide have concluded that it is the toxicants in cigarette smoke generated by burning tobacco, and not the nicotine, which is the cause of smoking-related diseases. Therefore, whilst nicotine is a reliable biomarker for exposure to tobacco products, it does not provide any indication of health risks associated with smoking or the use of nicotine-containing products (Royal College of Physicians, 2016; FDA, 2022). Other biomarkers and health assessments are often used in conjunction to provide a more comprehensive understanding of the health impact of tobacco use. Both traditional cigarettes and HTP contain tobacco, but methods of consumption and associated health risk for these products differ. Cigarettes burn tobacco, producing smoke which contains numerous harmful chemicals with the number of smoke constituents being around 7,000 chemicals (Rodgman et al., 2000). Around 100 of these chemicals are classified by public health experts as causes or potential causes of smoking related disease (FDA, 2012). HTPs do not operate at temperatures high enough to burn tobacco. Since HTPs do not burn tobacco, they produce significantly fewer and lower levels of harmful chemicals compared to smoke from cigarettes (Schaller et al., 2016; Mallock et al., 2018; Salman et al., 2019; Vukas et al., 2023). Salman et al. (2019) for example, showed that reactive oxygen species (ROS) and carbonyl compound emissions were lower in HTP aerosol compared to cigarettes. Oxidative stress has been suggested as important part of several smoking-related diseases (Luettich et al., 2021).
In vitro experiments are essential to better understand differences in the potential effects of tobacco products. Several studies have demonstrated that measured reductions in toxicants in HTP aerosols compared to cigarette smoke can translate into reductions in in vitro toxicological effects (Schaller et al., 2016; Jaunky et al., 2018; Hattori et al., 2020; Dusautoir et al., 2021; Wang et al., 2021). Here, we investigated the effects of HTPs and the 1R6F Reference Cigarette, on the Phosphorylation of AP-1 transcription factor component, c-jun, which is a process involved in regulation of cellular stress responses such as cell cycling control and apoptosis (Dreij et al., 2010). Studies suggest that exposure to both HTP aerosol and cigarette smoke can lead to the activation of c-jun (Kogel et al., 2015; Chapman et al., 2023). However, the specific effects and the extent of c-jun activation may vary between these two forms of tobacco use. The elevated levels of c-jun observed in response to tobacco products’ exposure, make it a potentially useful biomarker for assessing tobacco-related effects on cellular processes.
In this work, to compare the effective concentrations of each product type, a study was designed to look at both the number of puffs delivered to cells (BEAS-2B) and the amount of nicotine delivered at the cell surface. The aim of this experiment was to determine the number of puffs required for the products to cause a minimum effective concentration for the c-jun cellular marker, measured using high content screening (HCS) and to relate the number of puffs with the delivery of nicotine to the cell surface. IVIVE was used to derive the exposure concentration (HEC) that matches the estimated in vitro effect (MEC) and then derive the equivalent plasma concentrations. Results show that it would be necessary to consume 3 HTP sticks at the same time to produce in vivo the effects seen in vitro under the conditions of this test. However, for the 1R6F cigarette, smoking only 1/6th of a stick would lead to the in vivo effect seen in vitro under the conditions of the test. Nicotine plasma concentrations ranged from 4 to 28 ng/mL after exposure to 1 stick of 1R6F at the MEC and at a nicotine concentration of a classic cigarette, respectively. For HTP, nicotine plasma concentrations range from 15.5 to 46.5 ng/mL after exposure to 1 stick of HTP at a nicotine concentration of a classic HTP stick and to 1 stick of HTP at the MEC, respectively. In comparison, plasma concentrations in clinical PK studies were between 14 and 20 ng/mL (Digard et al., 2013; Picavet et al., 2016; McEwan et al., 2019). At steady state, concentrations are higher, which is explained by the half-life of nicotine (1–3 h in blood). In the simulations with repeated use, sticks (1R6F and HTP) are consumed every hour for 10 h and therefore we can see an accumulation of nicotine in plasma over time until a steady state is achieved.
One of the modeling challenges in this study was that the in vitro testing was conducted with cigarettes and HTP smoke/aerosol which are complex mixtures including nicotine, organic acids, and carrier chemicals (propylene glycol and vegetable glycerol). The in vitro assays assessed the toxicity of the whole mixture, whereas the PBPK model and its parameterization was carried out for a specific compound, nicotine. Because of the various PK and pharmacodynamic properties of individual compounds in a mixture as well as the potential interactions between those chemicals, mixtures present a special challenge for conducting IVIVE (Hernandez and Tsatsakis, 2017). While important, these factors were not taken into consideration as the goal was to compare the potency of HTPs versus cigarettes. However, as a range of nicotine delivery products such as e-vapor products are gaining popularity among adult smokers, IVIVE modeling for mixtures must be considered (Zhang et al., 2021). Qualitatively, differences in irritant properties of the inhaled mixtures may be the primary cause of the c-jun responses being greater with cigarettes compared to the HTP. C-jun is an important marker as it plays a key role in cell cycle progression, that is achieved via the transcriptional repression of cell cycle inhibitors and the transcriptional activation of cell cycle progression machinery (Lukey et al., 2016).
Rodrigo et al. (2021) have suggested that the use of HTP may be associated with potentially reduced cancer and non-cancer endpoints based on their reduced harmful and potentially harmful constituent yields measured in aerosol when compared to cigarette smoke. Kusonic et al. (2023) stated that whilst HTP products have shown a reduced risk to human health when compared to the cigarettes, they still, however, contain compounds in the aerosol that can be detrimental to human health. The authors went on to state that there was not enough data obtained from independent studies indicating that the reduced amounts of toxic chemicals in the aerosol of HTP do not induce any harmful effects.
In conclusion, the results of this study demonstrate that for the 1R6F cigarette, consuming 1/6th of a stick would be required to induce the c-jun activation effects observed in vitro. Whereas, for HTP it would be necessary to consume 3 sticks simultaneously to produce in vivo the effects observed in vitro. This data further demonstrates the reduced potency of the HTP aerosol compared to cigarette smoke thereby adding to the weight of evidence that non-combustible next-generation products have the potential for reduced harm when compared to cigarettes. The QIVIVE approach demonstrates great promise in assisting human health risk assessments; however, further optimization and standardization is required to gain regulatory acceptance. Furthermore, biomarkers and health assessments other than nicotine and the measure of cellular stress also need to be studied to provide a more comprehensive understanding of the impact of tobacco use on an individual’s health.
Data availability statement
The raw data supporting the conclusion of this article will be made available by the authors, without undue reservation.
Ethics statement
Ethical approval was not required for the studies on animals in accordance with the local legislation and institutional requirements because only commercially available established cell lines were used.
Author contributions
MM: Formal Analysis, Investigation, Methodology, Software, Visualization, Writing–original draft, Writing–review and editing. LS: Conceptualization, Methodology, Project administration, Writing–review and editing. MA: Writing–review and editing, Methodology. ES: Data curation, Formal Analysis, Writing–review and editing. RW: Methodology, Validation, Writing–review and editing, Formal Analysis. SP: Methodology, Validation, Writing–review and editing, Formal Analysis. FC: Conceptualization, Writing–review and editing. KR: Writing–review and editing, Formal Analysis. SO: Writing–review and editing, Formal Analysis. JF: Writing–review and editing, Methodology. MS: Conceptualization, Funding acquisition, Supervision, Writing–review and editing.
Funding
The author(s) declare that financial support was received for the research, authorship, and/or publication of this article. Funding was provided by Imperial Brands PLC.
Conflict of interest
Authors LS, FC, and MS are employed by Imperial Brands PLC. Authors ES, RW, SP, KR, and SO are employed by Reemtsma Cigarettenfabriken GmbH, An Imperial Brands PLC company. Authors MM, MA, and JF are employed by ScitoVation LLC.
Publisher’s note
All claims expressed in this article are solely those of the authors and do not necessarily represent those of their affiliated organizations, or those of the publisher, the editors and the reviewers. Any product that may be evaluated in this article, or claim that may be made by its manufacturer, is not guaranteed or endorsed by the publisher.
Supplementary material
The Supplementary Material for this article can be found online at: https://www.frontiersin.org/articles/10.3389/ftox.2024.1373325/full#supplementary-material
References
Anjilvel, S., and Asgharian, B. (1995). A multiple-path model of particle deposition in the rat lung. Fundam. Appl. Toxicol. 28, 41–50. doi:10.1006/faat.1995.1144
Asgharian, B., Hofmann, W., and Bergmann, R. (2001). Particle deposition in a multiple-path model of the human lung. Aerosol Sci. Technol. 34, 332–339. doi:10.1080/02786820119122
Asgharian, B., Wood, R., and Schlesinger, R. B. (1995). 'Empirical modeling of particle deposition in the alveolar region of the lungs: a basis for interspecies extrapolation. Fundam. Appl. Toxicol. 27, 232–238. doi:10.1006/faat.1995.1128
Bekki, K., Inaba, Y., Uchiyama, S., and Kunugita, N. (2017). 'Comparison of chemicals in mainstream smoke in heat-not-burn tobacco and combustion cigarettes. J. UOEH 39, 201–207. doi:10.7888/juoeh.39.201
Bell, S. M., Chang, X., Wambaugh, J. F., Allen, D. G., Bartels, M., Brouwer, K. L. R., et al. (2018). 'in vitro to in vivo extrapolation for high throughput prioritization and decision making. Toxicol Vitro 47, 213–227. doi:10.1016/j.tiv.2017.11.016
Benowitz, N. L., Dains, K. M., Dempsey, D., Herrera, B., Yu, L., and Jacob, P. (2009a). Urine nicotine metabolite concentrations in relation to plasma cotinine during low-level nicotine exposure. Nicotine Tob. Res. 11, 954–960. doi:10.1093/ntr/ntp092
Benowitz, N. L., Hukkanen, J., and Jacob, P. (2009b). 'Nicotine chemistry, metabolism, kinetics and biomarkers. Handb. Exp. Pharmacol., 29–60. doi:10.1007/978-3-540-69248-5_2
Bernstein, D. (2004). A review of the influence of particle size, puff volume, and inhalation pattern on the deposition of cigarette smoke particles in the respiratory tract. Inhal. Toxicol. 16, 675–689. doi:10.1080/08958370490476587
Brossard, P., Weitkunat, R., Poux, V., Lama, N., Haziza, C., Picavet, P., et al. (2017). Nicotine pharmacokinetic profiles of the Tobacco Heating System 2.2, cigarettes and nicotine gum in Japanese smokers. Regul. Toxicol. Pharmacol. 89, 193–199. doi:10.1016/j.yrtph.2017.07.032
Brown, R. P., Delp, M. D., Lindstedt, S. L., Rhomberg, L. R., and Beliles, R. P. (1997). Physiological parameter values for physiologically based pharmacokinetic models. Toxicol. Ind. Health 13, 407–484. doi:10.1177/074823379701300401
Butler, J. (1992). “The bronchial circulation,” in Lung biology in health and disease. Editor C. Lenfant (New York: Marcel Dekker Inc.).
Campbell, J., Van Landingham, C., Crowell, S., Gentry, R., Kaden, D., Fiebelkorn, S., et al. (2015). A preliminary regional PBPK model of lung metabolism for improving species dependent descriptions of 1,3-butadiene and its metabolites. Chem. Biol. Interact. 238, 102–110. doi:10.1016/j.cbi.2015.05.025
Chang, C. M., Edwards, S. H., Arab, A., Del Valle-Pinero, A. Y., Yang, L., and Hatsukami, D. K. (2017). 'Biomarkers of tobacco exposure: summary of an FDA-sponsored public workshop. Cancer Epidemiol. Biomarkers Prev. 26, 291–302. doi:10.1158/1055-9965.EPI-16-0675
Chapman, F., Sticken, E. T., Wieczorek, R., Pour, S. J., Dethloff, O., Budde, J., et al. (2023). 'Multiple endpoint in vitro toxicity assessment of a prototype heated tobacco product indicates substantially reduced effects compared to those of combustible cigarette. Toxicol Vitro 86, 105510. doi:10.1016/j.tiv.2022.105510
Clewell, R. A., and Clewell, H. J. (2008). Development and specification of physiologically based pharmacokinetic models for use in risk assessment. Regul. Toxicol. Pharmacol. 50, 129–143. doi:10.1016/j.yrtph.2007.10.012
Clippinger, A. J., Ahluwalia, A., Allen, D., Bonner, J. C., Casey, W., Castranova, V., et al. (2016). Expert consensus on an in vitro approach to assess pulmonary fibrogenic potential of aerosolized nanomaterials. Arch. Toxicol. 90, 1769–1783. doi:10.1007/s00204-016-1717-8
COT (2017). “Annual report,” in Committee on toxicity of chemicals in food, consumer products and the environment.
Crooks, I., Dillon, D. M., Scott, J. K., Ballantyne, M., and Meredith, C. (2013). The effect of long term storage on tobacco smoke particulate matter in in vitro genotoxicity and cytotoxicity assays. Regul. Toxicol. Pharmacol. 65, 196–200. doi:10.1016/j.yrtph.2012.11.012
Digard, H., Proctor, C., Kulasekaran, A., Malmqvist, U., and Richter, A. (2013). Determination of nicotine absorption from multiple tobacco products and nicotine gum. Nicotine Tob. Res. 15, 255–261. doi:10.1093/ntr/nts123
Dreij, K., Rhrissorrakrai, K., Gunsalus, K. C., Geacintov, N. E., and Scicchitano, D. A. (2010). 'Benzo[a]pyrene diol epoxide stimulates an inflammatory response in normal human lung fibroblasts through a p53 and JNK mediated pathway. Carcinogenesis 31, 1149–1157. doi:10.1093/carcin/bgq073
Dusautoir, R., Zarcone, G., Verriele, M., Garcon, G., Fronval, I., Beauval, N., et al. (2021). Comparison of the chemical composition of aerosols from heated tobacco products, electronic cigarettes and tobacco cigarettes and their toxic impacts on the human bronchial epithelial BEAS-2B cells. J. Hazard Mater 401, 123417. doi:10.1016/j.jhazmat.2020.123417
EPA (2006). “Approaches for the application of physiologically based pharmacokinetic (pbpk) models and supporting data in risk assessment,” in edited by Office of Research and Development National Center for Environmental Assessment. (Washington, D.C: U.S. Environmental Protection Agency).
EU (2014). Tighter rules on tobacco. European Union. Available at: https://eur-lex.europa.eu/EN/legal-content/summary/tighter-eu-rules-on-tobacco.html.
FDA (2012). Harmful and potentially harmful constituents in tobacco products and tobacco smoke. Established List, 20034–20037.
FDA (2022). Nicotine is why tobacco products are addictive. Available at: https://www.fda.gov/tobacco-products/health-effects-tobacco-use/nicotine-why-tobacco-products-are-addictive.
Fuoco, F. C., Buonanno, G., Stabile, L., and Vigo, P. (2014). Influential parameters on particle concentration and size distribution in the mainstream of e-cigarettes. Environ. Pollut. 184, 523–529. doi:10.1016/j.envpol.2013.10.010
Gowadia, N., and Dunn-Rankin, D. (2010). A transport model for nicotine in the tracheobronchial and pulmonary region of the lung. Inhal. Toxicol. 22, 42–48. doi:10.3109/08958370902862442
Haghnegahdar, A., Feng, Y., Chen, X., and Lin, J. (2018). Computational analysis of deposition and translocation of inhaled nicotine and acrolein in the human body with E-cigarette puffing topographies. Aerosol Sci. Technol. 52, 483–493. doi:10.1080/02786826.2018.1447644
Hattori, N., Nakagawa, T., Yoneda, M., Nakagawa, K., Hayashida, H., and Ito, T. (2020). Cigarette smoke, but not novel tobacco vapor products, causes epigenetic disruption and cell apoptosis. Biochem. Biophys. Rep. 24, 100865. doi:10.1016/j.bbrep.2020.100865
Hernandez, A. F., and Tsatsakis, A. M. (2017). Human exposure to chemical mixtures: challenges for the integration of toxicology with epidemiology data in risk assessment. Food Chem. Toxicol. 103, 188–193. doi:10.1016/j.fct.2017.03.012
Hukkanen, J., Jacob, P., and Benowitz, N. L. (2005). 'Metabolism and disposition kinetics of nicotine. Pharmacol. Rev. 57, 79–115. doi:10.1124/pr.57.1.3
International Programme on Chemical Safety (IPCS) (2010). Characterization and application of physiologically based pharmacokinetic models in risk assessment, World Health Organization. Geneva, Switzerland: International Programme on Chemical Safety.
Jaunky, T., Adamson, J., Santopietro, S., Terry, A., Thorne, D., Breheny, D., et al. (2018). 'Assessment of tobacco heating product THP1.0. Part 5: in vitro dosimetric and cytotoxic assessment. Regul. Toxicol. Pharmacol. 93, 52–61. doi:10.1016/j.yrtph.2017.09.016
Jones, J., Slayford, S., Gray, A., Brick, K., Prasad, K., and Proctor, C. (2020). A cross-category puffing topography, mouth level exposure and consumption study among Italian users of tobacco and nicotine products. Sci. Rep. 10, 12. doi:10.1038/s41598-019-55410-5
Kogel, U., Gonzalez Suarez, I., Xiang, Y., Dossin, E., Guy, P. A., Mathis, C., et al. (2015). 'Biological impact of cigarette smoke compared to an aerosol produced from a prototypic modified risk tobacco product on normal human bronchial epithelial cells. Toxicol Vitro 29, 2102–2115. doi:10.1016/j.tiv.2015.08.004
Kolli, A. R., Kuczaj, A. K., Martin, F., Hayes, A. W., Peitsch, M. C., and Hoeng, J. (2020). Bridging inhaled aerosol dosimetry to physiologically based pharmacokinetic modeling for toxicological assessment: nicotine delivery systems and beyond. Crit. Rev. Toxicol. 1-17. doi:10.1080/10408444.2019.1692780
Kuepfer, L., Niederalt, C., Wendl, T., Schlender, J. F., Willmann, S., Lippert, J., et al. (2016). Applied concepts in PBPK modeling: how to build a PBPK/PD model. CPT Pharmacometrics Syst. Pharmacol. 5, 516–531. doi:10.1002/psp4.12134
Kusonic, D., Bijelic, K., Kladar, N., Bozin, B., Torovic, L., and Srdenovic Conic, B. (2023). Comparative health risk assessment of heated tobacco products versus conventional cigarettes. Subst. Use Misuse 58, 346–353. doi:10.1080/10826084.2022.2161315
Luettich, K., Sharma, M., Yepiskoposyan, H., Breheny, D., and Lowe, F. J. (2021). An adverse outcome pathway for decreased lung function focusing on mechanisms of impaired mucociliary clearance following inhalation exposure. Front. Toxicol. 3, 750254. doi:10.3389/ftox.2021.750254
Lukey, M. J., Greene, K. S., Erickson, J. W., Wilson, K. F., and Cerione, R. A. (2016). The oncogenic transcription factor c-Jun regulates glutaminase expression and sensitizes cells to glutaminase-targeted therapy. Nat. Commun. 7, 11321. doi:10.1038/ncomms11321
Mallock, N., Boss, L., Burk, R., Danziger, M., Welsch, T., Hahn, H., et al. (2018). Levels of selected analytes in the emissions of "heat not burn" tobacco products that are relevant to assess human health risks. Arch. Toxicol. 92, 2145–2149. doi:10.1007/s00204-018-2215-y
McEwan, M., Coburn, S., Ghosh, D., Simms, L., Giles, L., Yuki, D., et al. (2019). 'Assessment of priority tobacco additives per the requirements of the EU Tobacco Products Directive (2014/40/EU): Part 3, Smoking behavior and plasma nicotine pharmacokinetics. Regul. Toxicol. Pharmacol. 104, 29–38. doi:10.1016/j.yrtph.2019.02.012
Moreau, M., Fisher, J., Andersen, M. E., Barnwell, A., Corzine, S., Ranade, A., et al. (2022). 'NAM-based prediction of point-of-contact toxicity in the lung: a case example with 1,3-dichloropropene. Toxicology 481, 153340. doi:10.1016/j.tox.2022.153340
Mulhopt, S., Schlager, C., Berger, M., Murugadoss, S., Hoet, P. H., Krebs, T., et al. (2020). A novel TEM grid sampler for airborne particles to measure the cell culture surface dose. Sci. Rep. 10, 8401. doi:10.1038/s41598-020-65427-w
O'Connell, G., Pritchard, J. D., Prue, C., Thompson, J., Verron, T., Graff, D., et al. (2019). A randomised, open-label, cross-over clinical study to evaluate the pharmacokinetic profiles of cigarettes and e-cigarettes with nicotine salt formulations in US adult smokers. Intern Emerg. Med. 14, 853–861. doi:10.1007/s11739-019-02025-3
Ogden, M. W., Marano, K. M., Jones, B. A., and Stiles, M. F. (2015). Switching from usual brand cigarettes to a tobacco-heating cigarette or snus: Part 1. Study design and methodology. Biomarkers 20, 382–390. doi:10.3109/1354750X.2015.1094133
Picavet, P., Haziza, C., Lama, N., Weitkunat, R., and Ludicke, F. (2016). Comparison of the pharmacokinetics of nicotine following single and ad libitum use of a tobacco heating system or combustible cigarettes. Nicotine Tob. Res. 18, 557–563. doi:10.1093/ntr/ntv220
Pichelstorfer, L., Hoffman, W., Winkler-Heil, R., Yurteri, C. U., and McAughey, J. (2016). Simulation of aerosol dynamics and deposition of combustible and electronic cigarette aerosols in the human respiratory tract. J. Aerosol Sci. 99, 125–132. doi:10.1016/j.jaerosci.2016.01.017
Plowchalk, D. R., Andersen, M. E., and deBethizy, J. D. (1992). A physiologically based pharmacokinetic model for nicotine disposition in the Sprague-Dawley rat. Toxicol. Appl. Pharmacol. 116, 177–188. doi:10.1016/0041-008x(92)90297-6
Price, P. S., Conolly, R. B., Chaisson, C. F., Gross, E. A., Young, J. S., Mathis, E. T., et al. (2003). 'Modeling interindividual variation in physiological factors used in PBPK models of humans. Crit. Rev. Toxicol. 33, 469–503. doi:10.1080/713608360
Rabenstein, A., Rahofer, A., Vukas, J., Rieder, B., Storzenhofecker, K., Stoll, Y., et al. (2023). Usage pattern and nicotine delivery during ad libitum consumption of pod E-cigarettes and heated tobacco products. Toxics 11, 434. doi:10.3390/toxics11050434
Robinson, D. E., Balter, N. J., and Schwartz, S. L. (1992). A physiologically based pharmacokinetic model for nicotine and cotinine in man. J. Pharmacokinet. Biopharm. 20, 591–609. doi:10.1007/BF01064421
Rodgman, A., Smith, C. J., and Perfetti, T. A. (2000). The composition of cigarette smoke: a retrospective, with emphasis on polycyclic components. Hum. Exp. Toxicol. 19, 573–595. doi:10.1191/096032700701546514
Rodrigo, G., Jaccard, G., Tafin Djoko, D., Korneliou, A., Esposito, M., and Belushkin, M. (2021). 'Cancer potencies and margin of exposure used for comparative risk assessment of heated tobacco products and electronic cigarettes aerosols with cigarette smoke. Arch. Toxicol. 95, 283–298. doi:10.1007/s00204-020-02924-x
Roulet, S., Chrea, C., Kanitscheider, C., Kallischnigg, G., Magnani, P., and Weitkunat, R. (2019). Potential predictors of adoption of the Tobacco Heating System by U.S. adult smokers: an actual use study. F1000Res 8, 214. doi:10.12688/f1000research.17606.1
Royal College of Physicians (2016). Nicotine without smoke. Available at: https://www.rcplondon.ac.uk/projects/outputs/nicotine-without-smoke-tobacco-harm-reduction.
Rozman, K. K., and Klaassen, C. D. (2001). “Absorption, distribution and excretion of toxicants,” in Casarett and doull’s toxicology: the basic science of poisons. Editor C. D. Klaassen (New York: McGraw-Hill).
Ruark, C. D., Song, G., Yoon, M., Verner, M. A., Andersen, M. E., Clewell, H. J., et al. (2017). Quantitative bias analysis for epidemiological associations of perfluoroalkyl substance serum concentrations and early onset of menopause. Environ. Int. 99, 245–254. doi:10.1016/j.envint.2016.11.030
Salman, R., Talih, S., El-Hage, R., Haddad, C., Karaoghlanian, N., El-Hellani, A., et al. (2019). Free-base and total nicotine, reactive oxygen species, and carbonyl emissions from IQOS, a heated tobacco product. Nicotine Tob. Res. 21, 1285–1288. doi:10.1093/ntr/nty235
Sarangapani, R., Clewell, H. J., Cruzan, G., and Andersen, M. E. (2002a). Comparing respiratory-tract and hepatic exposure-dose relationships for metabolized inhaled vapors: a pharmacokinetic analysis. Inhal. Toxicol. 14, 835–854. doi:10.1080/08958370290084656
Sarangapani, R., Teeguarden, J. G., Cruzan, G., Clewell, H. J., and Andersen, M. E. (2002b). Physiologically based pharmacokinetic modeling of styrene and styrene oxide respiratory-tract dosimetry in rodents and humans. Inhal. Toxicol. 14, 789–834. doi:10.1080/08958370290084647
Schaller, J. P., Keller, D., Poget, L., Pratte, P., Kaelin, E., McHugh, D., et al. (2016). 'Evaluation of the Tobacco Heating System 2.2. Part 2: chemical composition, genotoxicity, cytotoxicity, and physical properties of the aerosol. Regul. Toxicol. Pharmacol. 81 (Suppl. 2), S27–S47. doi:10.1016/j.yrtph.2016.10.001
Schmeck, B., Moog, K., Zahlten, J., van Laak, V., N'Guessan, P. D., Opitz, B., et al. (2006). Streptococcus pneumoniae induced c-Jun-N-terminal kinase- and AP-1 -dependent IL-8 release by lung epithelial BEAS-2B cells. Respir. Res. 7, 98. doi:10.1186/1465-9921-7-98
Song, G., Peeples, C. R., Yoon, M., Wu, H., Verner, M. A., Andersen, M. E., et al. (2016). Pharmacokinetic bias analysis of the epidemiological associations between serum polybrominated diphenyl ether (BDE-47) and timing of menarche. Environ. Res. 150, 541–548. doi:10.1016/j.envres.2016.07.004
Sosnowski, T. R., and Kramek-Romanowska, K. (2016). Predicted deposition of E-cigarette aerosol in the human lungs. J. Aerosol Med. Pulm. Drug Deliv. 29, 299–309. doi:10.1089/jamp.2015.1268
Teeguarden, J. G., Deisinger, P. J., Poet, T. S., English, J. C., Faber, W. D., Barton, H. A., et al. (2005). Derivation of a human equivalent concentration for n-butanol using a physiologically based pharmacokinetic model for n-butyl acetate and metabolites n-butanol and n-butyric acid. Toxicol. Sci. 85, 429–446. doi:10.1093/toxsci/kfi103
Teeguarden, J. G., Housand, C. J., Smith, J. N., Hinderliter, P. M., Gunawan, R., and Timchalk, C. A. (2013). A multi-route model of nicotine-cotinine pharmacokinetics, pharmacodynamics and brain nicotinic acetylcholine receptor binding in humans. Regul. Toxicol. Pharmacol. 65, 12–28. doi:10.1016/j.yrtph.2012.10.007
Tsuda, A., Henry, F. S., and Butler, J. P. (2013). Particle transport and deposition: basic physics of particle kinetics. Compr. Physiol. 3, 1437–1471. doi:10.1002/cphy.c100085
Tyndale, R. F., and Sellers, E. M. (2002). 'Genetic variation in CYP2A6-mediated nicotine metabolism alters smoking behavior. Ther. Drug Monit. 24, 163–171. doi:10.1097/00007691-200202000-00026
Uchiyama, S., Noguchi, M., Takagi, N., Hayashida, H., Inaba, Y., Ogura, H., et al. (2018). Simple determination of gaseous and particulate compounds generated from heated tobacco products. Chem. Res. Toxicol. 31, 585–593. doi:10.1021/acs.chemrestox.8b00024
Upadhyay, S., and Palmberg, L. (2018). Air-liquid interface: relevant in vitro models for investigating air pollutant-induced pulmonary toxicity. Toxicol. Sci. 164, 21–30. doi:10.1093/toxsci/kfy053
Vukas, J., Mallock-Ohnesorg, N., Ruther, T., Pieper, E., Romano-Brandt, L., Stoll, Y., et al. (2023). Two different heated tobacco products vs. Cigarettes: comparison of nicotine delivery and subjective effects in experienced users Toxics 11, 525. doi:10.3390/toxics11060525
Waddell, W. J., and Marlowe, C. (1976). 'Localization of nicotine-14C, cotinine-14C, and nicotine-1'-N-oxide-14C in tissues of the mouse. Drug Metab. Dispos. 4, 530–539.
Wang, H., Chen, H., Huang, L., Li, X., Wang, L., Li, S., et al. (2021). In vitro toxicological evaluation of a tobacco heating product THP COO and 3R4F research reference cigarette on human lung cancer cells. Toxicol Vitro 74, 105173. doi:10.1016/j.tiv.2021.105173
WHO (2010). Characterization and application of physiologically based pharmacokinetic models in risk assessment. Geneva, Switzerland: World Health Organization.
Wieczorek, R., Trelles Sticken, E., Pour, S. J., Chapman, F., Rower, K., Otte, S., et al. (2023). Characterisation of a smoke/aerosol exposure in vitro system (SAEIVS) for delivery of complex mixtures directly to cells at the air-liquid interface. J. Appl. Toxicol. 43, 1050–1063. doi:10.1002/jat.4442
Wu, H., Yoon, M., Verner, M. A., Xue, J., Luo, M., Andersen, M. E., et al. (2015). Can the observed association between serum perfluoroalkyl substances and delayed menarche be explained on the basis of puberty-related changes in physiology and pharmacokinetics? Environ. Int. 82, 61–68. doi:10.1016/j.envint.2015.05.006
Yamazaki, H., Horiuchi, K., Takano, R., Nagano, T., Shimizu, M., Kitajima, M., et al. (2010). Human blood concentrations of cotinine, a biomonitoring marker for tobacco smoke, extrapolated from nicotine metabolism in rats and humans and physiologically based pharmacokinetic modeling. Int. J. Environ. Res. Public Health 7, 3406–3421. doi:10.3390/ijerph7093406
Keywords: physiologically based pharmacokinetic (PBPK) modelling, respiratory toxicity, in vitro, aerosol, heated tobacco product (HTP), cigarette, multiple-path particle dosimetry
Citation: Moreau M, Simms L, Andersen ME, Trelles Sticken E, Wieczorek R, Pour SJ, Chapman F, Roewer K, Otte S, Fisher J and Stevenson M (2024) Use of quantitative in vitro to in vivo extrapolation (QIVIVE) for the assessment of non-combustible next-generation product aerosols. Front. Toxicol. 6:1373325. doi: 10.3389/ftox.2024.1373325
Received: 19 January 2024; Accepted: 28 March 2024;
Published: 11 April 2024.
Edited by:
Mary Catherine McElroy, Charles River Laboratories, United KingdomReviewed by:
Madhuri Singal, AeroTox Consulting Services, LLC, United StatesPrathyusha Bagam, National Center for Toxicological Research (FDA), United States
Copyright © 2024 Moreau, Simms, Andersen, Trelles Sticken, Wieczorek, Pour, Chapman, Roewer, Otte, Fisher and Stevenson. This is an open-access article distributed under the terms of the Creative Commons Attribution License (CC BY). The use, distribution or reproduction in other forums is permitted, provided the original author(s) and the copyright owner(s) are credited and that the original publication in this journal is cited, in accordance with accepted academic practice. No use, distribution or reproduction is permitted which does not comply with these terms.
*Correspondence: Marjory Moreau, bW1vcmVhdUBzY2l0b3ZhdGlvbi5jb20=