 Lindsay B. Wilson
 Ryan S. McClure
 Katrina M. Waters
 Michael T. Simonich1
 Robyn L. Tanguay
- 1Department of Environmental and Molecular Toxicology, Sinnhuber Aquatic Research Laboratory, Oregon State University, Corvallis, OR, United States
- 2Biological Sciences Division, Pacific Northwest National Laboratory, Richland, WA, United States
Polycyclic aromatic hydrocarbons (PAHs) are ubiquitous environmental contaminants and are associated with human disease. Canonically, many PAHs induce toxicity via activation of the aryl hydrocarbon receptor (AHR) pathway. While the interaction between PAHs and the AHR is well-established, understanding which AHR-regulated transcriptional effects directly result in observable phenotypes and which are adaptive or benign is important to better understand PAH toxicity. Retene is a frequently detected PAH in environmental sampling and has been associated with AHR2-dependent developmental toxicity in zebrafish, though its mechanism of toxicity has not been fully elucidated. To interrogate transcriptional changes causally associated with retene toxicity, we conducted whole-animal RNA sequencing at 48 h post-fertilization after exposure to eight retene concentrations. We aimed to identify the most sensitive transcriptomic responses and to determine whether this approach could uncover gene sets uniquely differentially expressed at concentrations which induce a phenotype. We identified a concentration-response relationship for differential gene expression in both number of differentially expressed genes (DEGs) and magnitude of expression change. Elevated expression of cyp1a at retene concentrations below the threshold for teratogenicity suggested that while cyp1a expression is a sensitive biomarker of AHR activation, it may be too sensitive to serve as a biomarker of teratogenicity. Genes differentially expressed at only non-teratogenic concentrations were enriched for transforming growth factor-β (TGF-β) signaling pathway disruption while DEGs identified at only teratogenic concentrations were significantly enriched for response to xenobiotic stimulus and reduction-oxidation reaction activity. DEGs which spanned both non-teratogenic and teratogenic concentrations showed similar disrupted biological processes to those unique to teratogenic concentrations, indicating these processes were disrupted at low exposure concentrations. Gene co-expression network analysis identified several gene modules, including those associated with PAHs and AHR2 activation. One, Module 7, was strongly enriched for AHR2-associated genes and contained the strongest responses to retene. Benchmark concentration (BMC) of Module seven genes identified a median BMC of 7.5 µM, nearly the highest retene concentration with no associated teratogenicity, supporting the hypothesis that Module seven genes are largely responsible for retene toxicity.
1 Introduction
High-throughput screening (HTS) of chemicals and elucidation of molecular mechanisms of toxicity often rely on in vitro methods (Tice et al., 2013). In vitro models, while efficient and useful for tissue-specific effects, cannot holistically assess chemical interactions to the degree in vivo models can, with complex metabolism and fully integrated tissues. The early life-stage zebrafish (Danio rerio) is a popular model for HTS of chemicals to detect those which have biological impacts. Zebrafish develop externally and rapidly with transparent tissues, allowing for visual observation of teratogenic effects by 5 days post-fertilization (Kimmel et al., 1995). Additionally, zebrafish share high genetic homology with mammals and possess many of the same organ systems, making it an excellent model for transcriptomic assessment of chemical effects translatable to human health (Howe et al., 2013).
Zebrafish have been utilized to identify complex chemical-transcriptome interactions and identify differentially expressed genes (DEGs) important to overall toxicity response (Huang et al., 2014; Huang et al., 2015; Souza et al., 2015; Shankar et al., 2019). One major approach is through RNA sequencing, which provides an unbiased snapshot of all gene expression changes at a given timepoint during development in response to chemical insult (Heijne et al., 2005). Many transcriptomic studies have revealed important gene expression changes in response to polycyclic aromatic hydrocarbons (PAHs) across model systems (Song et al., 2012; Jayasundara et al., 2015; Brinkmann et al., 2016; Shankar et al., 2019). PAHs are ubiquitous environmental contaminants produced both naturally and anthropogenically through sources like wildfires, crude oil, and cigarette smoke. PAHs have been associated with neurobehavioral and teratogenic effects in laboratory studies and increased risk of cancers in humans (Boffetta et al., 1997; Billiard et al., 1999; Bostrom et al., 2002; Armstrong et al., 2004; Knecht et al., 2013; Knecht et al., 2017; Geier et al., 2018a; Geier et al., 2018b). Mechanistically, many PAHs initiate toxic responses through activation of the aryl hydrocarbon receptor (AHR) pathway. The expression of one of the genes in its regulon, cyp1a, is the primary biomarker of AHR activation and exposure to PAHs. However, while elevated cyp1a often indicates AHR activation, it does not automatically mean a chemically-induced phenotype will develop in vivo (Hu et al., 2007).
Teratogenic phenotypes resulting from PAH exposure are fundamentally based on changes in gene expression patterns. RNA sequencing is an efficient method with which to uncover those pattern changes and begin to identify the mechanisms of toxicity. With a sufficient amount of data, a gene expression network can be inferred to reveal dysregulated pathways related to individual chemicals or chemical classes, can highlight which processes may be linked within a biological system, can identify genes that may respond in a more subtle manner and can incorporate centrality measures to identify which genes might be central to a system based on co-expression values with other genes (Mcdermott et al., 2009; Pohl et al., 2021; Shankar et al., 2021). A 2021 study from our research group compiled phenotypically-anchored RNA sequencing data from 48 h post-fertilization (hpf) zebrafish developmentally exposed to 10 flame retardant chemicals, 22 PAHs, and 2,3,7,8-Tetrachlorodibenzodioxin (TCDD), a strong AHR agonist commonly used to investigate AHR-regulated effects (Shankar et al., 2021). We inferred a gene co-expression network and identified chemical-specific gene modules, including one, Module 13, which contained highly-connected genes definitively belonging to the AHR2 signaling pathway. AHR2 is the zebrafish ortholog most functionally similar to the human AHR.
In zebrafish, gene expression changes at 48 hpf have been linked to observed toxicity at 5 days post-fertilization with chemical exposure at non-teratogenic concentrations producing few dysregulated genes (Rericha et al., 2022). Whether toxic concentrations of AHR activators produce different DEGs compared to non-toxic concentrations or similar DEGs but to a different degree is not well understood. While we have a good understanding of what gene expression changes are induced by AHR activation, which of these transcriptional changes are directly associated with toxicity and which are adaptive or benign is not possible to deduce from assessment using one exposure concentration. Retene, a frequently detected PAH in environmental sampling, induces elevated cyp1a expression in developing zebrafish in an AHR2-dependent manner and produces malformations similar to those induced by TCDD (Geier et al., 2018b; Shankar et al., 2019). In this study, we leveraged an established developmental zebrafish screening assay and whole-animal transcriptomic analysis to identify concentration-dependent gene expression changes associated with retene teratogenicity. We aimed to identify the most sensitive transcriptomic responses and to determine whether this approach could uncover gene sets uniquely differentially expressed at concentrations which induce a phenotype.
2 Materials and methods
2.1 Zebrafish methods
2.1.1 Husbandry and exposures
Specific pathogen-free wild type 5D zebrafish (Danio rerio) and an AHR2 mutant fish line (ahr2hu3335) (Goodale et al., 2012) were reared at the Sinnhuber Aquatic Research Laboratory (SARL) in accordance with Institutional Animal Care and Use Committee protocols at Oregon State University (IACUC-2021-0166 and 2021-0227) (Kent et al., 2011). Fish were housed on a recirculating water system kept at 28° ± 1 C under a 14 h light: 10 h dark cycle in 50- or 100-gallon brood stock tanks. Water was supplemented with Instant Ocean salts (Spectrum Brands, Blacksburg, VA, United States ) and sodium bicarbonate to maintain pH 7.4. Fish were fed with Gemma Micro twice daily (Skretting, Inc., Fontaine Les Vervins, France) (Barton et al., 2016).
Embryos were collected from adult fish using an internal embryo collection apparatus on the day of exposure, sorted by developmental stage, and kept in E2 embryo medium (EM) consisting of 15 mM NaCl, 0.5 mM KCl, 1 mM CaCl2, 1 mM MgSO4, 0.15 mM KH2PO4, 0.05 mM Na2HPO4, and 0.7 mM NaHCO3 buffered with 1 M NaOH to pH 7.2 in a temperature-controlled incubator at 28 ± 1°C until dechorionation (Westerfield, 2000). At 4 h post-fertilization (hpf), embryos were enzymatically dechorionated using a custom-made apparatus previously described (Mandrell et al., 2012). Following dechorionation, embryos were screened for enzymatic or mechanical damage under a dissecting microscope and robotically loaded into 96-well plates prefilled with 100 μL EM.
Retene (CAS 483-65-8, Santa Cruz Biotechnology, 97% purity) and 100% dry dimethyl sulfoxide (DMSO) were dispensed into 96-well plates pre-loaded with six hpf embryos and 100 μL EM using an HP D300 or D300e Digital Dispenser then immediately sealed using an Eppendorf 5390 heat sealer with pressure-sensitive silicone adhesive backed polyolefin plastic PCR film (Thermaseal RTS). Plates were incubated overnight at 28° ± 1°C on an orbital shaker at 235 RPM under dark conditions. Embryos were exposed to initial range-finding nominal water concentrations of 0, 1, 2.54, 6.45, 16.4, 35, 74.8, and 100 µM retene (1% DMSO by volume) beginning at six hpf (1 test plate, n = 12 for each concentration). Definitive testing concentrations were then selected to capture 0%–100% teratogenicity and to assess AHR2-dependence: 0, 1, 5, 20, 35, 50, 65, and 100 µM. For definitive testing, n = 36 fish per concentration across three replicate plates for wild type fish and n = 24 fish per concentration across two replicate plates for ahr2hu3335 fish due to fecundity limitations. All retene exposures were administered exactly as above.
2.1.2 Toxicity screening
To assess developmental toxicity, zebrafish were visually screened for a total of 13 morphological endpoints at 24 and 120 hpf. Table 1 lists morphological endpoints assessed at each timepoint. The percent incidence of abnormalities for each endpoint was calculated across replicate plates. The percent incidence of any observed morphological effect including mortality was calculated and reported here as “any effect”. Images of all measured endpoints can be found at https://github.com/Tanguay-Lab/Bioinformatic_and_Toxicological_Resources/tree/main/Files/Zebrafish_Phenotype_Atlas (accessed 21 March 2022). See Supplementary Table S1 for supporting information regarding binning of morphological endpoints. Figures were generated using R and GraphPad Prism.
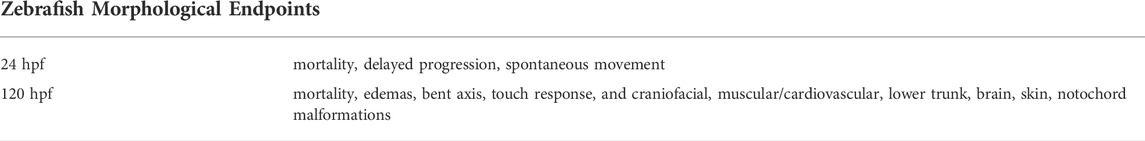
TABLE 1. All zebrafish morphological endpoints, including mortality, measured at 24 and 120 h post-fertilization (hpf).
2.2 Transcriptomics
2.2.1 Concentration selection
Following initial developmental toxicity screening, concentrations for RNA-sequencing were selected to cover the range of observed effects with a top concentration of 50 μM at which 100% of animals exhibited malformations or mortality at 120 hpf. Concentrations were then scaled down by a factor of 0.4 for a concentration list of: 0, 0.205, 0.512, 1.28, 3.2, 8, 20, and 50 μM, with a skew toward low concentrations which do not induce teratogenicity.
2.2.2 RNA-seq
At 48 hpf, fish were briefly screened for malformations to ensure only morphologically normal fish were used for transcriptomics. No significant teratogenicity was observed across concentrations. Fish were collected in four pools of nine fish each for RNA sequencing. Pooled fish were briefly anesthetized on ice and excess water was removed. Tissue was immediately homogenized in 1.5 ml Safe-Lock microcentrifuge tubes (Eppendorf, CT, United States ) with 200 µL RNAzol RT (Molecular Research Center) and 0.5 mm zirconium oxide beads in a Bullet Blender tissue homogenizer (Next Advance, NY, United States ) for 3 min, speed 8. An additional 300 µL RNAzol RT was added to each tube and the homogenate was vortexed and kept at -80°C until RNA isolation. Total RNA was isolated using a Direct-zol RNA MiniPrep Kit (Zymo Research, CA, United States ). RNA samples were sent to the Beijing Genomics Institute (BGI) for library preparation and sequencing. RNA integrity was assessed (RIN score > 8.5) using an Agilent Technologies 2100 Bioanalyzer. Briefly, mRNA was purified using oligo (dT)-attached magnetic beads and fragmented. cDNA was synthesized using random hexamer-primed reverse transcription, end-repaired and 3′ adenylated. Adapters were ligated to 3′ adenylated ends and cDNA was PCR amplified and purified. The resulting library was validated using an Agilent Technologies 2100 Bioanalyzer. 100 bp paired-end mRNA sequencing was conducted using BGI’s DNBseq™ platform (DNBSEQ-G400).
2.2.3 Differential gene expression analysis
All fastq files were aligned to the Z11 zebrafish genome (GCF_000002035.6_GRCz11_genomic.fna) using the Star Aligner (Dobin et al., 2013). Resulting SAM files were then used to count reads aligning to genes using HTSeq (Anders et al., 2015) along with the gff file for the Z11 reference genome (GCF_000002035.6_GRCz11_genomic.gff) with default settings and an alignment value cutoff of a10. This led to a file of 39701 genes with raw counts assigned to them. From this file any gene that had a count of ‘0’ in at least 8/32 (25%) conditions was removed from further analysis. This was done so that resulting networks would be of smaller size and easier to work with and because such genes were of very low abundance. This led to a dataset of 22,686 genes across 32 conditions. Raw counts were normalized with DESeq2 for downstream analyses (Love et al., 2014). DESeq2 was also used to identify differentially expressed genes (DEGs) defined as genes with an adjusted p-value less than 0.05. ZFIN ids in the gff file were then replaced with gene names using g:Profiler (Raudvere et al., 2019). If the gene had no gene name then the GeneID was retained as a unique identifier. In a few cases (94/22,686 genes), the gene names were identical except for capitalization. These gene were aggregated and the expression values were averaged.
2.2.4 Benchmark concentration modeling
Concentration-response modeling of genes and gene sets was performed and visualized using BMDExpress2 (Yang et al., 2007). Briefly, a two-sided Williams Trend test was performed for each gene across concentrations to identify genes with significant (p < 0.05) monotonic response in expression, regardless of directionality. Individual genes which met this criterion were fit to 10 continuous parametric models and the model with the lowest Akaike information criterion (AIC) was selected for benchmark concentration modeling. Benchmark concentrations for gene and gene set-level responses were calculated based on EPA guidance for continuous data with a benchmark response (BMR) factor of 1.349, equivalent to a 10% change from control. Additional parameters included assumed constant variance, 250 maximum iterations and confidence level 0.95. The Hill model was flagged if the model k parameter was below one-third the lowest positive dose. In cases where the Hill model was the best fit, but was flagged for this reason, the next best model with a goodness of fit p > 0.05 was selected. Genes with a BMC greater than the highest concentration tested were removed from the analysis. For gene set analysis, the median BMC was used.
2.2.5 Gene co-expression analysis
Gene co-expression networks were inferred using fold change values for genes. Fold change values were calculated for each replicate individually including replicates of the control conditions by calculating an average for each set of control replicates and using that as a basis for determining fold changes. In addition, to reduce overall sizes of the network for ease of analysis, the top 8,000 genes were used based on coefficient of variation (CV). Selecting genes for network inference with a high CV value ensured that genes that had strong changes in expression across samples, those that could be linked to other genes based on expression similarity, would be included in the network inference. To infer networks the random forest algorithm GENIE3 was used (Huynh-Thu et al., 2010). Any co-expression value between gene pairs with an edge weight above 0.0086 was included as an edge in the network. This cutoff led to a network of 4,678 edges (top 0.007% of possible edges) so only the most strongly connected genes were included in the analyzed network. Networks were viewed and modified with colors/node sizes, etc. in Cytoscape (Shannon et al., 2003). The network analyzer app in Cytoscape was also used to identify centrality values of degree and betweenness. To identify modules the fastgreedy algorithm in the R package igraph was used (Csardi and Nepusz, 2006).
An analysis of how edge weights shifted as a function of loss of data specific to each concentration was performed for one module, Module 7. All possible edge weights (those above and below our 0.0086 cutoff for the full network) between two Module seven genes were assessed for a total of 31,506 edges. For each edge, the ratio of the edge weight in the network inferred from the complete dataset was compared to a network inferred after removing data from a single concentration of retene. This process was iteratively performed, removing one concentration from the network at a time and calculating all edge weight ratios compared to the full data network. A ratio of greater than one indicates the edge weight was higher in the control network than a network with the specific concentration dataset removed (i.e. that the co-expression between these two genes was negatively affected by loss of data representing that retene concentration).
3 Results
3.1 Retene bioactivity screening
Wild type and AHR2 mutant (ahr2hu3335) fish were exposed to a range of retene concentrations from 0 to 100 µM for initial bioactivity screening and to assess phenotype dependency on AHR2. Initial exposure to retene induced significant craniofacial defects, edemas, bent body axis, and mortality in wild type fish (Figure 1A). Based on the incidence of ‘any effect’ (incidence at any teratogenic endpoint), the concentration resulting in malformations in 50% of wild type animals (EC50) was 16.5 µM with 100% of animals exhibiting mortality or teratogenicity at 50 µM (Figure 1B). AHR2 mutant fish showed significantly reduced retene teratogenicity, indicating that the retene toxicity mechanism is AHR2-dependent (Figure 1A–C).
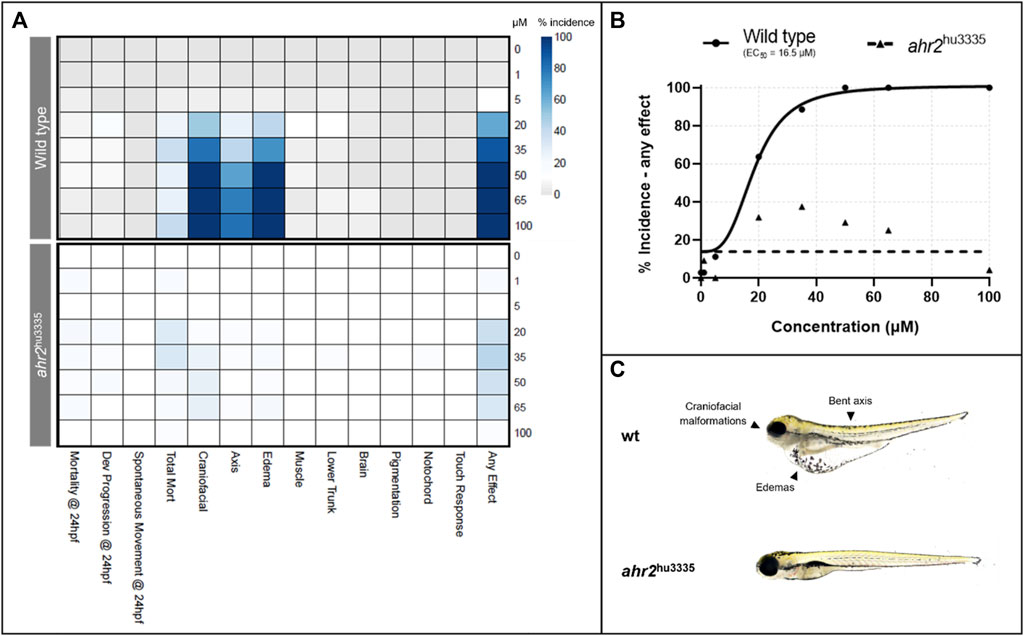
FIGURE 1. Effects of retene exposure on zebrafish development at 24 and 120 hpf in wild type and AHR2 mutant fish. (A) heatmap of endpoint incidence. Depth of color indicates percent incidence (x-axis) at given concentration (y-axis); (B) concentration-response curves for percent incidence of teratogenicity at 24 or 120 hpf; (C) 120 hpf larvae resulting from exposure to 50 µM retene beginning at six hpf, with and without functional AHR2.
From the initial screening, concentrations were identified which induced 0–100% teratogenicity. Eight concentrations, with a skew toward non-teratogenicity-inducing concentrations, were selected for mRNA sequencing. These concentrations recapitulated the lack of teratogenicity below 20 µM (Figure 2). Percent incidence of developmental toxicity endpoints are found in Supplementary Table S2.
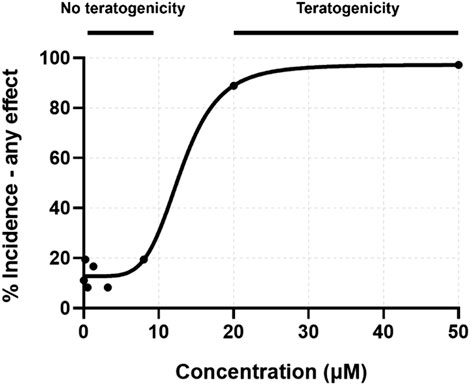
FIGURE 2. Concentration-response curve for percent incidence of any teratogenic effect observed at 24 or 120 hpf. Exposure concentrations for toxicity screening were matched to those for transcriptomic assessment.
3.2 Retene-induced transcriptomic changes
Global gene expression was assessed in 48 hpf zebrafish larvae in response to eight retene concentrations anchored to teratogenicity screening results. Differential expression analysis and benchmark concentration modeling were used to assess concentration-response relationships of individual retene-responsive genes and identify thresholds at which expression of these genes was altered. A gene co-expression network was inferred for genes across all conditions to identify sets of genes most responsive to retene.
3.2.1 Differential gene expression
Differentially expressed genes across each concentration were identified (no fold change cut off) with an adjusted p-value ≤ 0.05. The number of DEGs generally increased with increasing concentration, with no DEGs identified at 0.205 µM and 8, 356, 164, 382, 416, and 1121 DEGs at 0.512, 1.28, 3.2, 8, 20, and 50 μM, respectively (Figure 3A). Most DEGs had low (<1) log2FC values.
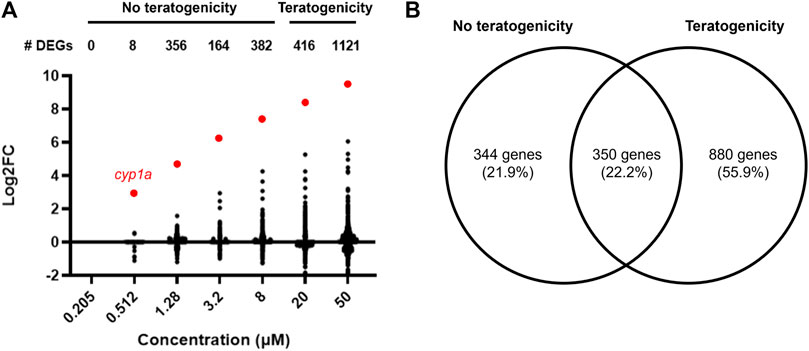
FIGURE 3. (A) Number of differentially expressed genes and their corresponding Log2 fold change values at each retene concentration (adj. p < 0.05). Cyp1a is highlighted red. (B) Venn diagram of DEGs at concentrations with and without teratogenicity at 120 hpf. Overlapping region represents genes which were differentially expressed in at least one non-teratogenic and one teratogenic concentration.
DEG lists were compiled for concentrations which did not induce teratogenicity (0.205–8 µM) versus those which did (20–50 µM) (Figure 3B). 880 DEGs were identified at only teratogenic concentrations indicating these may play an important role in the emergence of teratogenicity. Functional enrichment analysis of these genes using Gene Ontology (GO) terms identified significant (p < 0.05) GO terms related to response to toxic substance and reduction and oxidation reactions. Figure 4 displays disrupted GO term and Reactome pathway enrichment for genes identified as differentially expressed at non-teratogenic concentrations, teratogenic concentrations, and those which overlapped both concentration ranges.
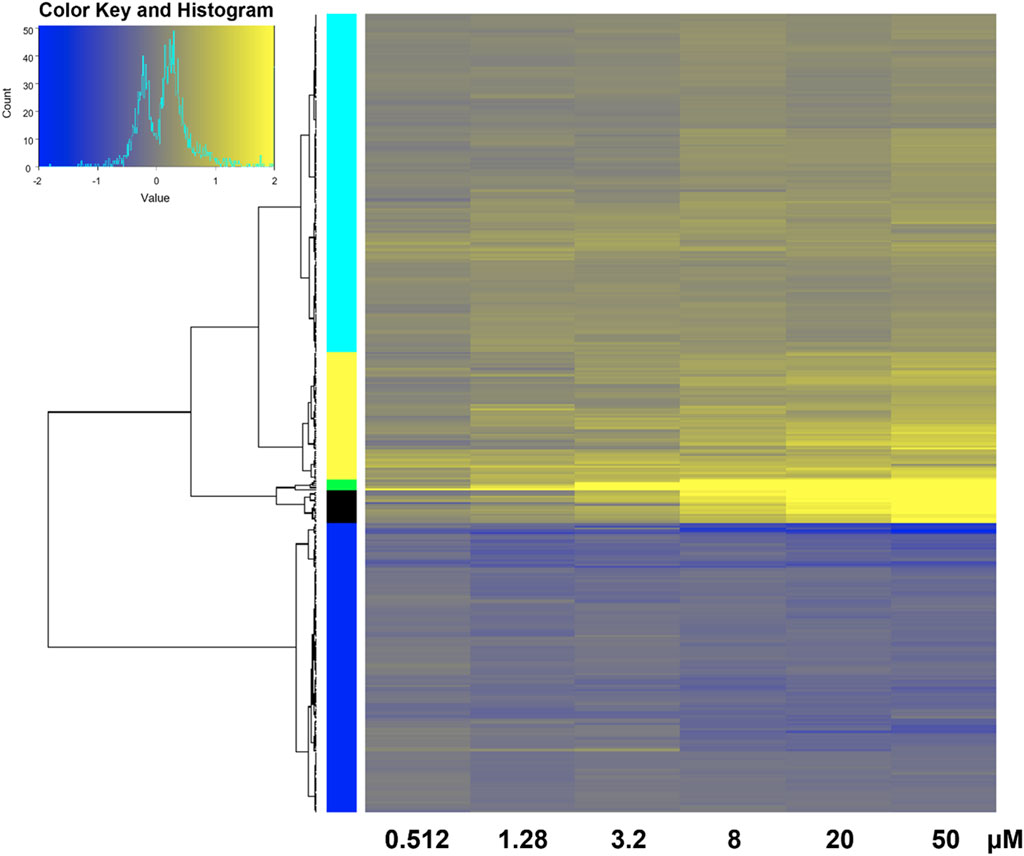
FIGURE 4. Heatmap of transcriptomic response at each retene concentration for genes common to both non-teratogenic and teratogenic concentrations. Average Log2FC values for each gene at each treatment are displayed with yellow indicating higher expression and blue indicating lower expression compared to DMSO vehicle control. Genes are grouped by ward clustering with gene clusters on the left.
350 genes were differentially expressed in at least one non-teratogenic and one teratogenic concentration (Figure 3B), allowing for analysis of expression of individual transcripts across concentrations. Figure 5 displays Log2FC values in response to increasing retene concentrations for these 350 genes. Genes were clustered using Ward clustering and several genes showed a strong concentration-response relationship with 19 genes (black and green clusters) showing the greatest increase in expression in response to increased retene concentration. Table 2 shows Log2FC across concentrations for black and green cluster genes from Figure 5.
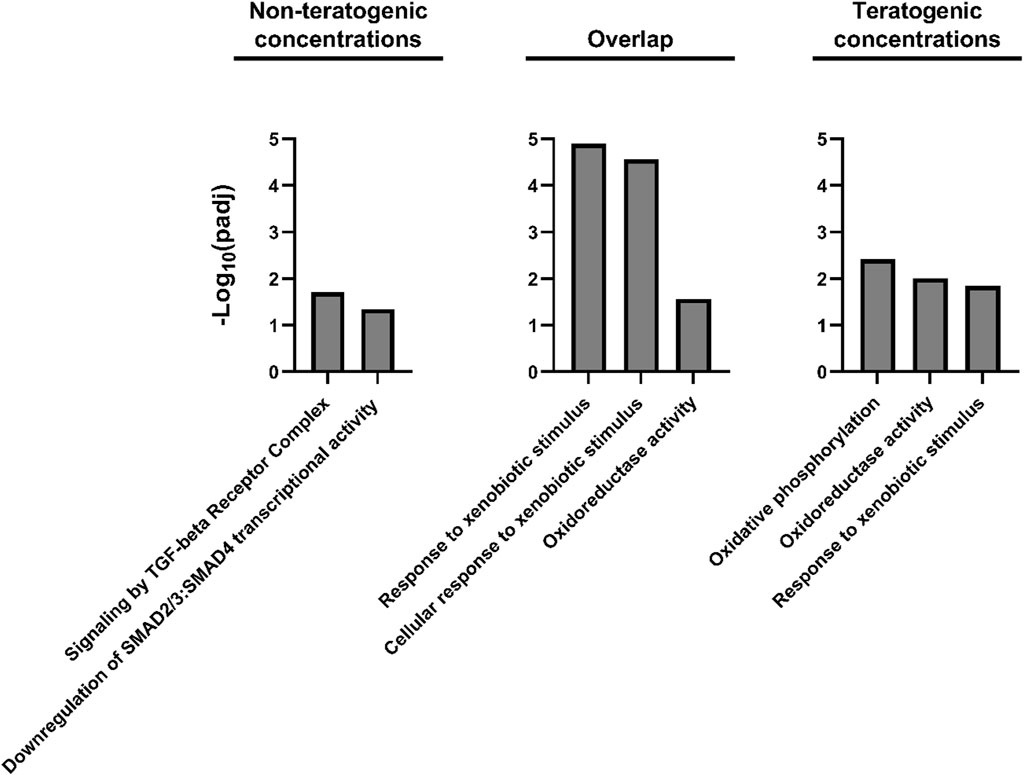
FIGURE 5. Gene Ontology and Reactome pathway enrichment for DEGs unique to non-teratogenic concentrations, DEGs overlapping at least one non-teratogenic and one teratogenic concentration, and DEGs unique to teratogenic concentrations.
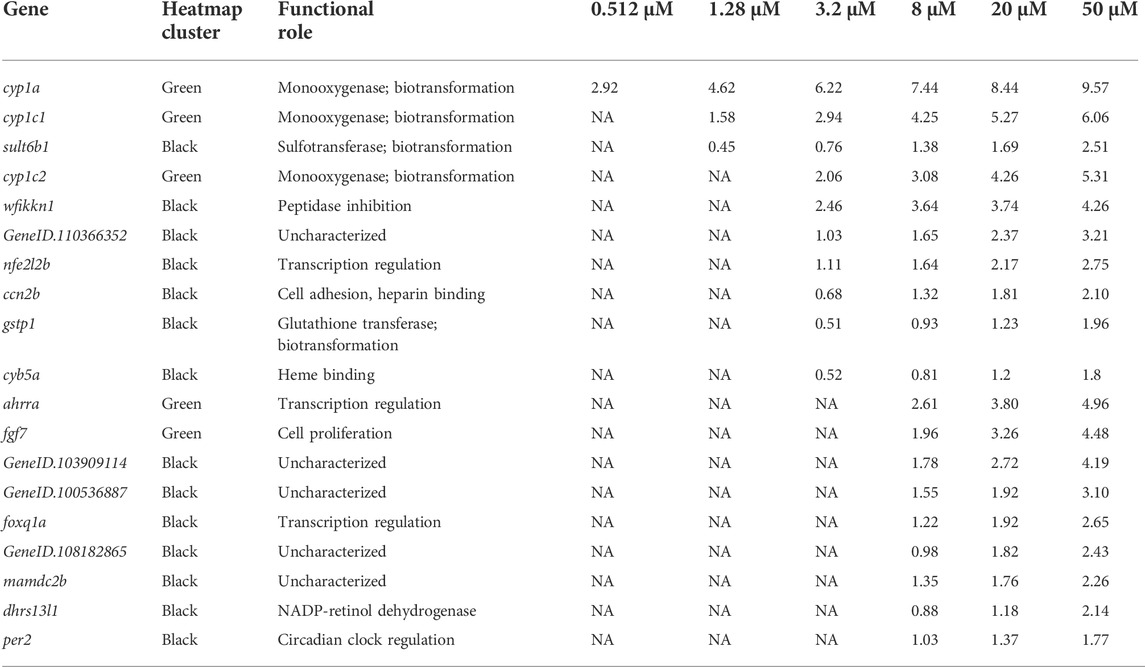
TABLE 2. Black and green heatmap cluster genes which showed the strongest change in expression in response to increasing retene concentration. Log2 fold change values are shown for any gene with an adjusted p value <0.05. NA = adjusted p-value exceeded cutoff. Genes are ordered by the number of concentrations at which they showed significant differential expression. Functional roles were identified using AmiGO 2 (Ashburner et al., 2000; Carbon et al., 2009; Gene Ontology, 2021).
BMDExpress2 was used to model concentration-dependent transcriptional changes for individual genes with significant concentration-response relationships. All genes which exhibited a response to increasing concentration were modeled and benchmark concentrations were identified. Concentration-response modeling revealed BMC values below 1 µM for several genes (Figure 6.) Each of these genes has been previously associated with AHR activators (Garcia et al., 2018; Shankar et al., 2021).
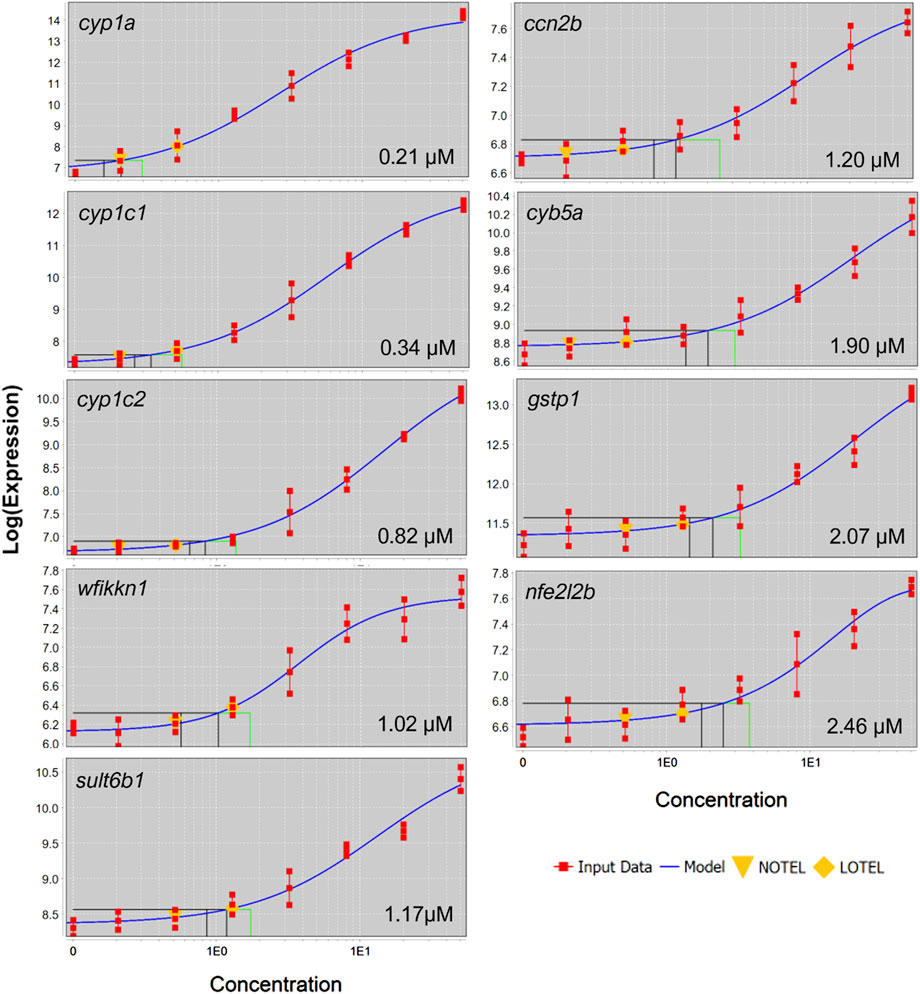
FIGURE 6. Concentration-response curves for black and green cluster genes which were differentially expressed in at four concentrations. Gene symbol and BMC are displayed in each panel.
3.2.2 Gene co-expression network
A gene co-expression network was inferred by combining expression data from all 32 datasets using GENIE3 and were grouped into 30 separate modules ranging from 12 to 325 genes. Figure 7 displays the full retene network with the top 13 modules identified by node color. Overall, transcriptional responses to higher retene concentrations had an outsized effect on network structure (Supplementary Figure S1).
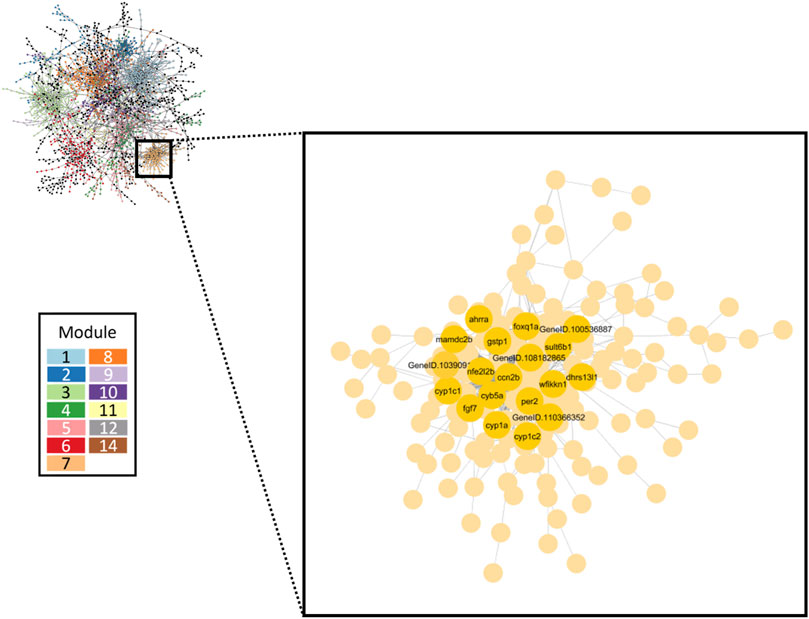
FIGURE 7. Gene co-expression network inferred from all retene concentrations. The largest 13 modules are differentiated by color. The inset box highlights Module seven which contained the greatest number of high responding genes. Black and green cluster genes which showed the strongest change in expression in response to increasing retene concentration are denoted.
We conducted functional enrichment analysis on the largest 13 modules using g:Profiler. Eight modules were significantly enriched for at least one or more Gene Ontology (GO) terms (p < 0.05). Table 3 lists the top five modules of interest with their module size and GO term enrichment. Table 4 displays the top 20 genes with the highest degree (number of edges directly connected to a gene) and with the highest betweenness centrality (proxy for importance to network structure) from the full retene network. Many of the genes which showed the greatest response to retene had the highest degree in the network and were contained within Module 7.
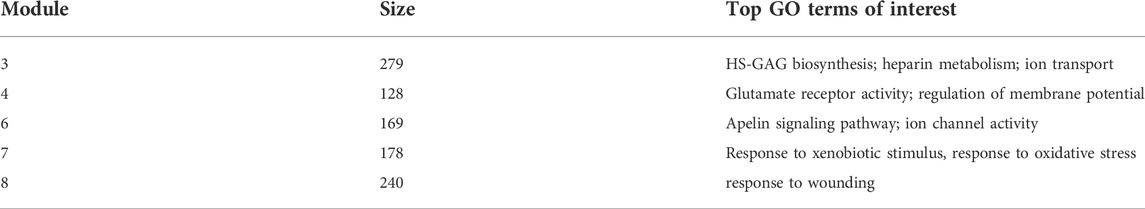
TABLE 3. Gene network module ID, number of genes, and top GO terms of interest for significantly enriched modules (p < 0.05). Modules were selected based on size and significant functional enrichment.
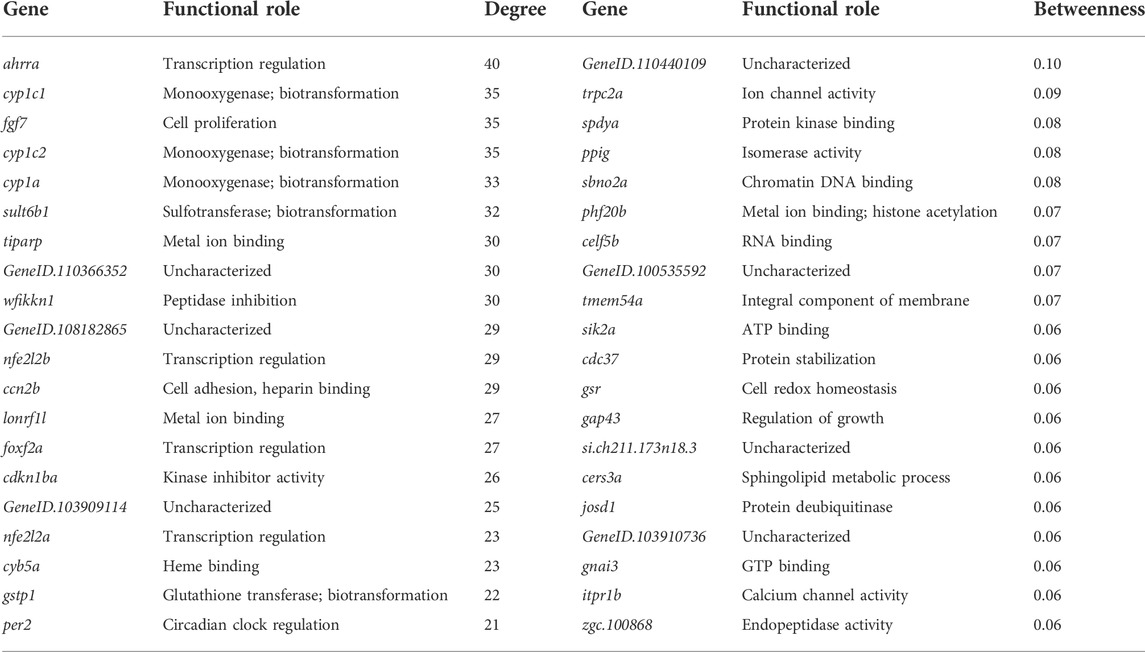
TABLE 4. Top 20 genes with highest degree and betweenness in the full retene network. Functional roles were identified using AmiGO 2 (Ashburner et al., 2000; Carbon et al., 2009; Gene Ontology, 2021).
The network approach grouped genes based on similarity in expression and function and showed that Module seven was strongly linked to retene response (Figure 7) with all 19 of the black and green heatmap cluster genes central to this module. Module seven contained many known AHR-regulated genes and had 20.9% overlap with the AHR responsive module of the FRC/AHR network in Shankar, et al., 2021 (Shankar et al., 2021) (Supplementary Table S4). Functional enrichment analysis of Module seven revealed the most significant GO term was response to xenobiotic stimulus (Table 3), similar to the AHR responsive model from our previous publication. The remaining Module seven genes which were not common to the AHR responsive module from the previous study may be unique to the response to retene or may be additional AHR-responders that were uncovered through this study approach.
We next assessed the concentration-response relationship of Module seven gene expression with benchmark concentration modeling and network edge-weight analysis. First, we compiled BMC modeling data for all genes which comprise Module 7. The median BMC for Module seven genes was 5.23 µM (BMDL 2.67 µM; BMDU 9.59 µM), concordant with the BMC for teratogenicity of 5.5 µM. Next, edge weights were analyzed for all 24,758 possible edges that comprised Module 7. To assess which of these responded to increasing retene concentration, a ratio of edge weights was calculated for each Module seven edge in the original network compared to a network lacking each concentration. If the edge weight in the original network was greater than in the network lacking that concentration, we considered the edge responsive to that concentration. This was iteratively performed for each retene concentration for a total of seven ratios per edge. 1,152 edges had consistently higher weights in the original network and of these, 15 showed greater losses in edge weight as data from each higher retene concentration was removed, i.e., edge weight between the gene pairs comprising these edges became weaker as data from higher retene concentrations were removed. These genes were primarily low fold change genes (Log2FC < 1), though this suggested that co-expression of these particular gene pairs was strongly affected by retene (Supplementary Table S3).
4 Discussion
4.1 Observed phenotype is specific to early development
Exposure to retene during early development induced significant teratogenicity at concentrations 20 µM and above at 120 hpf. Teratogenicity was largely eliminated in AHR2-null fish, indicating the observed effects are dependent on AHR2. Previous studies have identified AHR2-mediated retene cardiotoxicity and cyp1a-induction patterns in early life-stage zebrafish (Scott et al., 2011; Shankar et al., 2019). This result and analysis of transcriptional response to retene support an AHR2-mediated toxicity pathway.
Preliminary data from our group, using the same exposure and screening paradigm presented here, showed that retene exposure beginning after 48 hpf did not induce developmental toxicity. These results indicate that the disrupted pathways which result in teratogenicity at 5 days post fertilization are disrupted prior to 48 hpf and gene expression changes observed at 48 hpf are likely representative of this disruption. Transcriptomic analysis at 48 hpf is an ideal timepoint in zebrafish as it precedes the onset of phenotype and the observed disrupted gene expression is likely to drive effects observed at 120 hpf (Haggard et al., 2018; Shankar et al., 2019; Dasgupta et al., 2021). In this study, zebrafish were developmentally exposed to retene and screened for early development-specific endpoints. We acknowledge that gene expression changes observed may be associated with non-developmental endpoints later in life such as disrupted reproduction, cognitive impairment and abnormal social behavior.
4.2 Concentration-response relationship of retene-induced transcriptional changes
4.2.1 Differentially expressed genes increase with increasing concentration
At 5 days post fertilization, 20 and 50 µM retene exposures consistently induced teratogenicity not yet evident at 48 hpf, when transcriptomic analyses were performed. To assess the most sensitive phenotypically-anchored transcriptional events, we selected six concentrations with no observed toxicity and two concentrations with strong teratogenic effects at five to determine a concentration threshold at which phenotype-anchored DEGs were detectable. At the lowest concentration (0.205 µM), no DEGs were identified. At the next highest concentration, 0.512 µM, and above, DEGs generally increased with increasing retene concentration in both number and magnitude of expression. One concentration, 1.28 µM, did not follow this trend producing more DEGs than the next highest concentration. These were largely low fold-change genes (Log2FC < 1), though their altered expression may play a significant role in the cascade of transcriptional effects which lead to toxicity at higher concentrations.
At each retene concentration with a significant transcriptomic response, unique genes were observed. Across concentrations, patterns emerged of sets of genes differentially expressed at multiple concentrations with increasing or decreasing degree of change corresponding to increasing teratogenicity. Several individual genes showed a concentration-dependent increase in degree of differential expression. Black and green cluster genes from Figure 5 had a BMC ranging from 0.247 to 1.783 µM, indicating the concentration threshold which induced expression was well below that at which toxicity was observed. At the network level, the average BMC for all Module seven genes was 5.24 µM, similar to that of teratogenicity, 5.5 µM. Module seven consisted of many genes in the AHR2 pathway, meaning the threshold for significant induction of AHR2-associated genes was similar to the threshold for retene teratogenicity.
4.2.2 Cyp1a is a biomarker of Aryl hydrocarbon receptor2 activation but not teratogenic outcome
Cytochrome P450s are a superfamily of enzymes which catalyze oxidation reactions in phase one biotransformation of xenobiotics (Hakkola et al., 1994; Carpenter et al., 1996; Lewis, 1996; Shimada et al., 1996). Increased expression of cytochrome p450 1a (CYP1A in zebrafish, or CYP1A1 in mammals) is a well-established biomarker of exposure to chemicals which activate the aryl hydrocarbon receptor pathway (Hu et al., 2007). In this study, elevated cyp1a was not associated with teratogenicity at very low concentrations, meaning that while its expression is considered a biomarker of AHR2 activation, it was too sensitive a response to serve as a biomarker of zebrafish teratogenicity later in development. The concentration-response transcriptional approach we have presented is useful for identifying transcriptomic biomarkers that are predictive of teratogenicity, though more work is needed to identify the DEGs which consistently and uniquely correlate with teratogenicity of PAHs. It is also possible that not only the elevated expression of a gene could serve as a predictive biomarker of teratogenicity, but a given magnitude of expression of specific genes could serve the same purpose, e.g. while elevated cyp1a does not predict teratogenicity, elevated cyp1a above a specific Log2FC may. By combining transcriptomic assessment across concentrations and network analyses for a larger number of PAHs, future studies could build upon this work to identify gene biomarkers or expression thresholds causally related to teratogenicity.
4.2.3 Altered transforming growth factor-β signaling and oxidative stress may be responsible for retene teratogenicity
344 DEGs were unique to low, non-teratogenic, concentrations of retene. When assessed for functional enrichment, these genes were significantly enriched for Reactome pathway terms related to TGF-β signaling. TGF-β plays a fundamental role in growth and development and can inhibit expression and activity of CYP450 enzymes (Abdel-Razzak et al., 1994; Massague et al., 2000; Patterson and Padgett, 2000; Kubiczkova et al., 2012). Disruption of TGF-β signaling and increased TGF-β have been implicated in PAH-associated cardiac and respiratory toxicity (Curfs et al., 2005; Qin et al., 2018; Wang et al., 2021; Ma et al., 2022). AHR is critical for disruption of TGF-β in response to some PAHs, further supporting the AHR-dependence of transcriptional responses to retene, even when teratogenicity is not observed (Wang et al., 2021). In an adverse outcome pathway framework, altered TGF-β signaling may be an early key event in the retene toxicity pathway. Further investigation of the role of TGF-β in PAH-induced teratogenicity is warranted.
DEGs identified at higher, teratogenic concentrations, and those which spanned both non-teratogenic and teratogenic concentrations were significantly enriched for response to xenobiotic stimulus and ontology terms related to redox reactions and oxidative stress. Oxidative stress has been associated with teratogenicity and can play a role in PAH-induced toxicity (Ornoy, 2007; Lin et al., 2020). At higher retene concentrations associated with teratogenicity, disruption of redox balance appears to play a key role in toxicity response. This is consistent with previous studies implicating oxidative stress in retene-induced toxicity (Peixoto et al., 2019; Jiang et al., 2020). Whether effects of oxidative stress are responsible for retene-induced teratogenicity is still unclear, though the findings of this study support this hypothesis.
4.2.4 Aryl hydrocarbon receptor-associated genes likely drive retene teratogenicity
While there is strong evidentiary support in the literature for which genes are induced by AHR activation, it is not clear if teratogenicity at high exposure concentrations of AHR activators is caused by 1) increased/decreased expression of direct AHR-regulated genes or 2) other cascading transcriptional responses which are only induced at concentrations at which teratogenicity is observed. The AHR battery contains a large number of genes, some of which have been studied significantly, while others have been only recently been identified and investigated (Timme-Laragy et al., 2007; Timme-Laragy et al., 2008; Planchart and Mattingly, 2010; Shankar et al., 2022). AHR activators can also induce a variety of toxic effects, not all of which involve the same AHR-regulated genes, highlighting the need to better understand which transcriptional changes can be causally associated with specific toxicity endpoints (Walisser et al., 2005; Watabe et al., 2010; Yoshioka et al., 2011; Wang et al., 2015; Zhang et al., 2016; Wright et al., 2017). One question this study looked to address was whether retene-induced teratogenicity likely resulted from the DEGs unique to teratogenic concentrations or from increased magnitude of expression of the more sensitive genes (identified at low concentrations). There were 880 DEGs uniquely associated with teratogenic concentrations (Figure 3B). When these genes were assessed for functional enrichment, the observed enriched GO and Reactome pathway terms were very similar to the terms enriched by DEGs which spanned both non-teratogenic and teratogenic concentrations, meaning that while many new DEGs arose when teratogenicity was observed, these DEGs were not related to novel functions. Additionally, the concentration thresholds for differential expression of Module seven genes and observed teratogenicity were highly correlated. Module seven contained mainly AHR-associated genes and genes which were differentially expressed at low, non-teratogenic retene concentrations. This high threshold correlation and lack of novel disrupted pathways associated with teratogenic concentrations support the hypothesis that DEGs identified at low, non-teratogenic, concentrations were responsible for retene teratogenicity, though their effects were only observed when their magnitude of change reached a certain threshold.
Results of this study suggest that early transcriptional response to retene is largely adaptive, with genes related to xenobiotic biotransformation (e.g. CYP450s) dominating the response. At teratogenic concentrations, many additional DEGs were induced, though they were related to the same molecular functions and pathways as their more sensitive counterparts. It is plausible that at low retene concentrations, the adaptive response was enough to withstand toxicity, but at higher concentrations, retene overwhelmed the adaptive response, leading to oxidative stress and, ultimately, teratogenicity at 5 days post-fertilization.
5 Conclusions and future directions
In this study, we definitively present a concentration-response relationship between increasing retene concentration and number of differentially expressed genes. Co-expression network analysis revealed one gene module significantly enriched for high retene-responders whose threshold for transcriptional response was similar to that for teratogenicity. DEGs were significantly enriched for TGF-β signaling at non-teratogenic concentrations and gene ontologies related to xenobiotic stimulus and redox balance at teratogenic concentrations, indicating altered TGF-β signaling may be an early response to retene and oxidative stress may play a key role in retene-induced teratogenicity at higher concentrations. We propose that at low retene concentrations, the pathway to teratogenicity was hindered by adaptive responses, including CYP450 metabolism, but at high concentrations, this adaptive response was overwhelmed and the pathway to teratogenicity proceeded. Finally, gene expression changes are often used as biomarkers of chemical toxicity, though, as we have displayed in this study, dysregulated gene expression does not always correlate with observed developmental toxicity in early life-stage zebrafish. Additional research using a larger number of diverse PAHs can deduce which gene expression changes are causally linked to teratogenicity in vivo and may uncover useful biomarkers of PAH-induced toxicity.
Data availability statement
The datasets presented in this study can be found in online repositories. The names of the repository/repositories and accession number(s) can be found below: https://www.ncbi.nlm.nih.gov/geo/, GSE203258.
Ethics statement
The animal study was reviewed and approved by Institutional Animal Care and Use Committee, Oregon State Univ. IACUC-2021-0166 and 2021-0227.
Author contributions
Study conception and design: LW, RT, and KW; data collection: LW; data analysis and visualization: LW and RM; manuscript preparation LW, RM, and MS; manuscript editing: LW, RM, RT, MS, and KW.
Funding
The research reported in this publication was supported by the National Institute of Environmental Health Sciences of the National Institutes of Health under Award Numbers P42 ES016465, P30 ES030287, and T32 ES07060.
Acknowledgments
Pacific Northwest National Laboratory is a multi-program laboratory operated by Battelle for the United States Department of Energy under Contract DE-AC05-76RL01830.
Conflict of interest
The authors declare that the research was conducted in the absence of any commercial or financial relationships that could be construed as a potential conflict of interest.
Publisher’s note
All claims expressed in this article are solely those of the authors and do not necessarily represent those of their affiliated organizations, or those of the publisher, the editors and the reviewers. Any product that may be evaluated in this article, or claim that may be made by its manufacturer, is not guaranteed or endorsed by the publisher.
Supplementary material
The Supplementary Material for this article can be found online at: https://www.frontiersin.org/articles/10.3389/ftox.2022.950503/full#supplementary-material
Supplementary Table S1 | Description of morphological endpoint binning.
Supplementary Table S2 | All morphology data.
Supplementary Table S3 | Edge weight shifts across retene concentration for Module 7 genes.
Supplementary Table S4 | List of genes in Module 7 and the AHR-associated module from FRC/AHR network in Shankar, et al, 2021.
References
Abdel-Razzak, Z., Corcos, L., Fautrel, A., Campion, J. P., and Guillouzo, A. (1994). Transforming growth factor-beta 1 down-regulates basal and polycyclic aromatic hydrocarbon-induced cytochromes P-450 1A1 and 1A2 in adult human hepatocytes in primary culture. Mol. Pharmacol. 46, 1100–1110.
Anders, S., Pyl, P. T., and Huber, W. (2015). HTSeq--a Python framework to work with high-throughput sequencing data. Bioinformatics 31, 166–169. doi:10.1093/bioinformatics/btu638
Armstrong, B., Hutchinson, E., Unwin, J., and Fletcher, T. (2004). Lung cancer risk after exposure to polycyclic aromatic hydrocarbons: a review and meta-analysis. Environ. Health Perspect. 112, 970–978. doi:10.1289/ehp.6895
Ashburner, M., Ball, C. A., Blake, J. A., Botstein, D., Butler, H., Cherry, J. M., et al. (2000). Gene ontology: tool for the unification of biology. The gene ontology consortium. Nat. Genet. 25, 25–29. doi:10.1038/75556
Barton, C. L., Johnson, E. W., and Tanguay, R. L. (2016). Facility design and health management program at the sinnhuber aquatic research laboratory. Zebrafish 13, S39–S43. doi:10.1089/zeb.2015.1232
Billiard, S. M., Querbach, K., and Hodson, P. V. (1999). Toxicity of retene to early life stages of two freshwater fish species. Environ. Toxicol. Chem. 18, 2070–2077. doi:10.1002/etc.5620180927
Boffetta, P., Jourenkova, N., and Gustavsson, P. (1997). Cancer risk from occupational and environmental exposure to polycyclic aromatic hydrocarbons. Cancer Causes Control 8, 444–472. doi:10.1023/a:1018465507029
Bostrom, C. E., Gerde, P., Hanberg, A., Jernstrom, B., Johansson, C., Kyrklund, T., et al. (2002). Cancer risk assessment, indicators, and guidelines for polycyclic aromatic hydrocarbons in the ambient air. Environ. Health Perspect. 110, 451–488. doi:10.1289/ehp.110-1241197
Brinkmann, M., Koglin, S., Eisner, B., Wiseman, S., Hecker, M., Eichbaum, K., et al. (2016). Characterisation of transcriptional responses to dioxins and dioxin-like contaminants in roach (Rutilus rutilus) using whole transcriptome analysis. Sci. Total Environ. 541, 412–423. doi:10.1016/j.scitotenv.2015.09.087
Carbon, S., Ireland, A., Mungall, C. J., Shu, S., Marshall, B., Lewis, S., et al. (2009). AmiGO: online access to ontology and annotation data. Bioinformatics 25, 288–289. doi:10.1093/bioinformatics/btn615
Carpenter, S. P., Lasker, J. M., and Raucy, J. L. (1996). Expression, induction, and catalytic activity of the ethanol-inducible cytochrome P450 (CYP2E1) in human fetal liver and hepatocytes. Mol. Pharmacol. 49, 260–268.
Csardi, G., and Nepusz, T. (2006). The igraph software package for complex network research. InterJournal, complex Syst. 1695, 1–9.
Curfs, D. M., Knaapen, A. M., Pachen, D. M., Gijbels, M. J., Lutgens, E., Smook, M. L., et al. (2005). Polycyclic aromatic hydrocarbons induce an inflammatory atherosclerotic plaque phenotype irrespective of their DNA binding properties. FASEB J. 19, 1290–1292. doi:10.1096/fj.04-2269fje
Dasgupta, S., Dunham, C. L., Truong, L., Simonich, M. T., Sullivan, C. M., and Tanguay, R. L. (2021). Phenotypically anchored mRNA and miRNA expression profiling in zebrafish reveals flame retardant chemical toxicity networks. Front. Cell Dev. Biol. 9, 663032. doi:10.3389/fcell.2021.663032
Dobin, A., Davis, C. A., Schlesinger, F., Drenkow, J., Zaleski, C., Jha, S., et al. (2013). Star: ultrafast universal RNA-seq aligner. Bioinformatics 29, 15–21. doi:10.1093/bioinformatics/bts635
Garcia, G. R., Shankar, P., Dunham, C. L., Garcia, A., La Du, J. K., Truong, L., et al. (2018). Signaling events downstream of AHR activation that contribute to toxic responses: the functional role of an AHR-dependent long noncoding RNA (slincR) using the zebrafish model. Environ. Health Perspect. 126, 117002. doi:10.1289/EHP3281
Geier, M. C., Chlebowski, A. C., Truong, L., Massey Simonich, S. L., Anderson, K. A., and Tanguay, R. L. (2018a). Comparative developmental toxicity of a comprehensive suite of polycyclic aromatic hydrocarbons. Arch. Toxicol. 92, 571–586. doi:10.1007/s00204-017-2068-9
Geier, M. C., James Minick, D., Truong, L., Tilton, S., Pande, P., Anderson, K. A., et al. (2018b). Systematic developmental neurotoxicity assessment of a representative PAH Superfund mixture using zebrafish. Toxicol. Appl. Pharmacol. 354, 115–125. doi:10.1016/j.taap.2018.03.029
Gene Ontology, C. (2021). The gene ontology resource: enriching a GOld mine. Nucleic Acids Res. 49, D325–D334. doi:10.1093/nar/gkaa1113
Goodale, B. C., La Du, J. K., Bisson, W. H., Janszen, D. B., Waters, K. M., and Tanguay, R. L. (2012). AHR2 mutant reveals functional diversity of aryl hydrocarbon receptors in zebrafish. PLoS One 7, e29346. doi:10.1371/journal.pone.0029346
Haggard, D. E., Noyes, P. D., Waters, K. M., and Tanguay, R. L. (2018). Transcriptomic and phenotypic profiling in developing zebrafish exposed to thyroid hormone receptor agonists. Reprod. Toxicol. 77, 80–93. doi:10.1016/j.reprotox.2018.02.006
Hakkola, J., Pasanen, M., Purkunen, R., Saarikoski, S., Pelkonen, O., Maenpaa, J., et al. (1994). Expression of xenobiotic-metabolizing cytochrome P450 forms in human adult and fetal liver. Biochem. Pharmacol. 48, 59–64. doi:10.1016/0006-2952(94)90223-2
Heijne, W. H. M., Kienhuis, A. S., Van Ommen, B., Stierum, R. H., and Groten, J. P. (2005). Systems toxicology: applications of toxicogenomics, transcriptomics, proteomics and metabolomics in toxicology. Expert Rev. Proteomics 2, 767–780. doi:10.1586/14789450.2.5.767
Howe, K., Clark, M. D., Torroja, C. F., Torrance, J., Berthelot, C., Muffato, M., et al. (2013). The zebrafish reference genome sequence and its relationship to the human genome. Nature 496, 498–503. doi:10.1038/nature12111
Hu, W., Sorrentino, C., Denison, M. S., Kolaja, K., and Fielden, M. R. (2007). Induction of cyp1a1 is a nonspecific biomarker of aryl hydrocarbon receptor activation: results of large scale screening of pharmaceuticals and toxicants in vivo and in vitro. Mol. Pharmacol. 71, 1475–1486. doi:10.1124/mol.106.032748
Huang, L., Zuo, Z., Zhang, Y., and Wang, C. (2015). Toxicogenomic analysis in the combined effect of tributyltin and benzo[a]pyrene on the development of zebrafish embryos. Aquat. Toxicol. 158, 157–164. doi:10.1016/j.aquatox.2014.10.024
Huang, L., Zuo, Z., Zhang, Y., Wu, M., Lin, J. J., and Wang, C. (2014). Use of toxicogenomics to predict the potential toxic effect of benzo(a)pyrene on zebrafish embryos: ocular developmental toxicity. Chemosphere 108, 55–61. doi:10.1016/j.chemosphere.2014.02.078
Huynh-Thu, V. A., Irrthum, A., Wehenkel, L., and Geurts, P. (2010). Inferring regulatory networks from expression data using tree-based methods. Plos One 5, e12776. doi:10.1371/journal.pone.0012776
Jayasundara, N., Van Tiem Garner, L., Meyer, J. N., Erwin, K. N., and Di Giulio, R. T. (2015). AHR2-Mediated transcriptomic responses underlying the synergistic cardiac developmental toxicity of PAHs. Toxicol. Sci. 143, 469–481. doi:10.1093/toxsci/kfu245
Jiang, S., Yang, J., and Fang, D. A. (2020). Histological, oxidative and immune changes in response to 9, 10-phenanthrenequione, retene and phenanthrene in Takifugu obscurus liver. J. Environ. Sci. Health. A Tox. Hazard. Subst. Environ. Eng. 55, 827–836. doi:10.1080/10934529.2020.1744998
Kent, M. L., Buchner, C., Watral, V. G., Sanders, J. L., Ladu, J., Peterson, T. S., et al. (2011). Development and maintenance of a specific pathogen-free (SPF) zebrafish research facility for Pseudoloma neurophilia. Dis. Aquat. Organ. 95, 73–79. doi:10.3354/dao02333
Kimmel, C. B., Ballard, W. W., Kimmel, S. R., Ullmann, B., and Schilling, T. F. (1995). Stages of embryonic development of the zebrafish. Dev. Dyn. 203, 253–310. doi:10.1002/aja.1002030302
Knecht, A. L., Goodale, B. C., Truong, L., Simonich, M. T., Swanson, A. J., Matzke, M. M., et al. (2013). Comparative developmental toxicity of environmentally relevant oxygenated PAHs. Toxicol. Appl. Pharmacol. 271, 266–275. doi:10.1016/j.taap.2013.05.006
Knecht, A. L., Truong, L., Simonich, M. T., and Tanguay, R. L. (2017). Developmental benzo[a]pyrene (B[a]P) exposure impacts larval behavior and impairs adult learning in zebrafish. Neurotoxicol. Teratol. 59, 27–34. doi:10.1016/j.ntt.2016.10.006
Kubiczkova, L., Sedlarikova, L., Hajek, R., and Sevcikova, S. (2012). TGF-beta - an excellent servant but a bad master. J. Transl. Med. 10, 183. doi:10.1186/1479-5876-10-183
Lewis, D. F. V. (1996). “Chapter 14: molecular modeling of mammalian cytochromes P450,” in Cytochromes P450 metabolic and toxicological aspects. Editor C. Ioannides (New York: CRC Press LLC).
Lin, Y. C., Wu, C. Y., Hu, C. H., Pai, T. W., Chen, Y. R., and Wang, W. D. (2020). Integrated hypoxia signaling and oxidative stress in developmental neurotoxicity of benzo[a]Pyrene in zebrafish embryos. Antioxidants (Basel) 9, 731. doi:10.3390/antiox9080731
Love, M. I., Huber, W., and Anders, S. (2014). Moderated estimation of fold change and dispersion for RNA-seq data with DESeq2. Genome Biol. 15, 550. doi:10.1186/s13059-014-0550-8
Ma, J., Tan, Q., Nie, X., Zhou, M., Wang, B., Wang, X., et al. (2022). Longitudinal relationships between polycyclic aromatic hydrocarbons exposure and heart rate variability: exploring the role of transforming growth factor-beta in a general Chinese population. J. Hazard. Mat. 425, 127770. doi:10.1016/j.jhazmat.2021.127770
Mandrell, D., Truong, L., Jephson, C., Sarker, M. R., Moore, A., Lang, C., et al. (2012). Automated zebrafish chorion removal and single embryo placement: optimizing throughput of zebrafish developmental toxicity screens. J. Lab. Autom. 17, 66–74. doi:10.1177/2211068211432197
Massague, J., Blain, S. W., and Lo, R. S. (2000). TGFbeta signaling in growth control, cancer, and heritable disorders. Cell 103, 295–309. doi:10.1016/s0092-8674(00)00121-5
Mcdermott, J. E., Taylor, R. C., Yoon, H., and Heffron, F. (2009). Bottlenecks and hubs in inferred networks are important for virulence in Salmonella typhimurium. J. Comput. Biol. 16, 169–180. doi:10.1089/cmb.2008.04TT
Ornoy, A. (2007). Embryonic oxidative stress as a mechanism of teratogenesis with special emphasis on diabetic embryopathy. Reprod. Toxicol. 24, 31–41. doi:10.1016/j.reprotox.2007.04.004
Patterson, G. I., and Padgett, R. W. (2000). TGF beta-related pathways. Roles in Caenorhabditis elegans development. Trends Genet. 16, 27–33. doi:10.1016/s0168-9525(99)01916-2
Peixoto, M. S., Da Silva Junior, F. C., De Oliveira Galvao, M. F., Roubicek, D. A., De Oliveira Alves, N., and Batistuzzo De Medeiros, S. R. (2019). Oxidative stress, mutagenic effects, and cell death induced by retene. Chemosphere 231, 518–527. doi:10.1016/j.chemosphere.2019.05.123
Planchart, A., and Mattingly, C. J. (2010). 2, 3, 7, 8-Tetrachlorodibenzo-p-dioxin upregulates FoxQ1b in zebrafish jaw primordium. Chem. Res. Toxicol. 23, 480–487. doi:10.1021/tx9003165
Pohl, J., Golovko, O., Carlsson, G., Orn, S., Schmitz, M., and Ahi, E. P. (2021). Gene co-expression network analysis reveals mechanisms underlying ozone-induced carbamazepine toxicity in zebrafish (Danio rerio) embryos. Chemosphere 276, 130282. doi:10.1016/j.chemosphere.2021.130282
Qin, G., Xia, J., Zhang, Y., Guo, L., Chen, R., and Sang, N. (2018). Ambient fine particulate matter exposure induces reversible cardiac dysfunction and fibrosis in juvenile and older female mice. Part. Fibre Toxicol. 15, 27. doi:10.1186/s12989-018-0264-2
Raudvere, U., Kolberg, L., Kuzmin, I., Arak, T., Adler, P., Peterson, H., et al. (2019). g:Profiler: a web server for functional enrichment analysis and conversions of gene lists (2019 update). Nucleic Acids Res. 47, W191–W198. doi:10.1093/nar/gkz369
Rericha, Y., Cao, D., Truong, L., Simonich, M. T., Field, J. A., and Tanguay, R. L. (2022). Sulfonamide functional head on short-chain perfluorinated substance drives developmental toxicity. iScience 25, 103789. doi:10.1016/j.isci.2022.103789
Shankar, P., Geier, M. C., Truong, L., Mcclure, R. S., Pande, P., Waters, K. M., et al. (2019). Coupling genome-wide transcriptomics and developmental toxicity profiles in zebrafish to characterize polycyclic aromatic hydrocarbon (PAH) hazard. Int. J. Mol. Sci. 20, E2570. doi:10.3390/ijms20102570
Scott, J. A., Incardona, J. P., Pelkki, K., Shepardson, S., and Hodson, P. V. (2011). AhR2-mediated, CYP1A-independent cardiovascular toxicity in zebrafish (Danio rerio) embryos exposed to retene. Aquat. Toxicol. 101, 165–174. doi:10.1016/j.aquatox.2010.09.016
Shankar, P., Garcia, G. R., La Du, J. K., Sullivan, C. M., Dunham, C. L., Goodale, B. C., et al. (2022). The ahr2-dependent wfikkn1 gene influences zebrafish transcriptome, proteome, and behavior. Toxicol. Sci. 187, 325–344. doi:10.1093/toxsci/kfac037
Shankar, P., Mcclure, R. S., Waters, K. M., and Tanguay, R. L. (2021). Gene co-expression network analysis in zebrafish reveals chemical class specific modules. BMC Genomics 22, 658. doi:10.1186/s12864-021-07940-4
Shannon, P., Markiel, A., Ozier, O., Baliga, N. S., Wang, J. T., Ramage, D., et al. (2003). Cytoscape: a software environment for integrated models of biomolecular interaction networks. Genome Res. 13, 2498–2504. doi:10.1101/gr.1239303
Shimada, T., Yamazaki, H., Mimura, M., Wakamiya, N., Ueng, Y. F., Guengerich, F. P., et al. (1996). Characterization of microsomal cytochrome P450 enzymes involved in the oxidation of xenobiotic chemicals in human fetal liver and adult lungs. Drug Metab. Dispos. 24, 515–522.
Song, M. K., Song, M., Choi, H. S., Kim, Y. J., Park, Y. K., and Ryu, J. C. (2012). Identification of molecular signatures predicting the carcinogenicity of polycyclic aromatic hydrocarbons (PAHs). Toxicol. Lett. 212, 18–28. doi:10.1016/j.toxlet.2012.04.013
Souza, T., Jennen, D., Van Delft, J., Van Herwijnen, M., Kyrtoupolos, S., and Kleinjans, J. (2015). New insights into BaP-induced toxicity: role of major metabolites in transcriptomics and contribution to hepatocarcinogenesis. Arch. Toxicol. 90, 1449–1458. doi:10.1007/s00204-015-1572-z
Tice, R. R., Austin, C. P., Kavlock, R. J., and Bucher, J. R. (2013). Improving the human hazard characterization of chemicals: a Tox21 update. Environ. Health Perspect. 121, 756–765. doi:10.1289/ehp.1205784
Timme-Laragy, A. R., Cockman, C. J., Matson, C. W., and Di Giulio, R. T. (2007). Synergistic induction of AHR regulated genes in developmental toxicity from co-exposure to two model PAHs in zebrafish. Aquat. Toxicol. 85, 241–250. doi:10.1016/j.aquatox.2007.09.005
Timme-Laragy, A. R., Noyes, P. D., Buhler, D. R., and Di Giulio, R. T. (2008). CYP1B1 knockdown does not alter synergistic developmental toxicity of polycyclic aromatic hydrocarbons in zebrafish (Danio rerio). Mar. Environ. Res. 66, 85–87. doi:10.1016/j.marenvres.2008.02.030
Walisser, J. A., Glover, E., Pande, K., Liss, A. L., and Bradfield, C. A. (2005). Aryl hydrocarbon receptor-dependent liver development and hepatotoxicity are mediated by different cell types. Proc. Natl. Acad. Sci. U. S. A. 102, 17858–17863. doi:10.1073/pnas.0504757102
Wang, E., Tu, W., Do, D. C., Xiao, X., Bhatti, S. B., Yang, L., et al. (2021). Benzo(a)pyrene enhanced dermatophagoides group 1 (der f 1)-induced TGFβ1 signaling activation through the aryl hydrocarbon receptor-RhoA Axis in asthma. Front. Immunol. 12, 643260. doi:10.3389/fimmu.2021.643260
Wang, W. D., Chen, G. T., Hsu, H. J., and Wu, C. Y. (2015). Aryl hydrocarbon receptor 2 mediates the toxicity of Paclobutrazol on the digestive system of zebrafish embryos. Aquat. Toxicol. 159, 13–22. doi:10.1016/j.aquatox.2014.11.018
Watabe, Y., Nazuka, N., Tezuka, M., and Shimba, S. (2010). Aryl hydrocarbon receptor functions as a potent coactivator of E2F1-dependent trascription activity. Biol. Pharm. Bull. 33, 389–397. doi:10.1248/bpb.33.389
Westerfield, M. (2000). The zebrafish book. a guide for the laboratory use of zebrafish (Danio rerio). Eugene: University of Oregon Press.
Wright, E. J., De Castro, K. P., Joshi, A. D., and Elferink, C. J. (2017). Canonical and non-canonical aryl hydrocarbon receptor signaling pathways. Curr. Opin. Toxicol. 2, 87–92. doi:10.1016/j.cotox.2017.01.001
Yang, L., Allen, B. C., and Thomas, R. S. (2007). BMDExpress: a software tool for the benchmark dose analyses of genomic data. BMC Genomics 8, 387. doi:10.1186/1471-2164-8-387
Yoshioka, W., Peterson, R. E., and Tohyama, C. (2011). Molecular targets that link dioxin exposure to toxicity phenotypes. J. Steroid Biochem. Mol. Biol. 127, 96–101. doi:10.1016/j.jsbmb.2010.12.005
Keywords: zebrafish, benchmark concentration, phenotypic anchoring, retene, toxicogenomics, polycyclic aromatic hydrocarbon (PAH), aryl hydrocarbon receptor
Citation: Wilson LB, McClure RS, Waters KM, Simonich MT and Tanguay RL (2022) Concentration-response gene expression analysis in zebrafish reveals phenotypically-anchored transcriptional responses to retene. Front. Toxicol. 4:950503. doi: 10.3389/ftox.2022.950503
Received: 23 May 2022; Accepted: 12 July 2022;
Published: 25 August 2022.
Edited by:
Wenyi Wang, Genentech, Inc., United StatesReviewed by:
Chang-Bum Jeong, Incheon National University, South KoreaWageh Darwish, Zagazig University, Egypt
Steven Jan Van Cruchten, University of Antwerp, Belgium
Copyright © 2022 Wilson, McClure, Waters, Simonich and Tanguay. This is an open-access article distributed under the terms of the Creative Commons Attribution License (CC BY). The use, distribution or reproduction in other forums is permitted, provided the original author(s) and the copyright owner(s) are credited and that the original publication in this journal is cited, in accordance with accepted academic practice. No use, distribution or reproduction is permitted which does not comply with these terms.
*Correspondence: Robyn L. Tanguay, cm9ieW4udGFuZ3VheUBvcmVnb25zdGF0ZS5lZHU=