
95% of researchers rate our articles as excellent or good
Learn more about the work of our research integrity team to safeguard the quality of each article we publish.
Find out more
ORIGINAL RESEARCH article
Front. Toxicol. , 13 October 2022
Sec. Clinical Toxicology
Volume 4 - 2022 | https://doi.org/10.3389/ftox.2022.1001709
This article is part of the Research Topic Exploring Impacts of Combined Exposures to Particles and Chemicals on Immune Reactions Across Living Organisms View all 5 articles
 Rutger van der Schrier1
 Monique van Velzen1Margot Roozekrans1,2Elise Sarton1
 Erik Olofsen1
 Marieke Niesters1
 Chantal Smulders3
 Albert Dahan1*
Background: Due the increasing need for storage of carbon dioxide (CO2) more individuals are prone to be exposed to high concentrations of CO2 accidentally released into atmosphere, with deleterious consequences.
Methods: We tested the effect of increasing CO2 concentrations in humans (6–12%) and rats (10–50%) at varying inhalation times (10–60 min). In humans, a continuous positive airway pressure helmet was used to deliver the gas mixture to the participants. Unrestrained rats were exposed to CO2 in a transparent chamber. In both species regular arterial blood gas samples were obtained. After the studies, the lungs of the animals were examined for macroscopic and microscopic abnormalities.
Results: In humans, CO2 concentrations of 9% inhaled for >10 min, and higher concentrations inhaled for <10 min were poorly or not tolerated due to exhaustion, anxiety, dissociation or acidosis (pH < 7.2), despite intact oxygenation. In rats, concentrations of 30% and higher were associated with CO2 narcosis, epilepsy, poor oxygenation and, at 50% CO2, spontaneous death. Lung hemorrhage and edema were observed in the rats at inhaled concentrations of 30% and higher.
Conclusion: This study provides essential insight into the occurrence of physiological changes in humans and fatalities in rats after acute exposure to high levels of CO2. Humans tolerate 9% CO2 and retain their ability to function coherently for up to 10 min. These data support reconsideration of the current CO2 levels (<7.5%) that pose a risk to exposed individuals (<7.5%) as determined by governmental agencies to ≤9%.
Carbon dioxide (CO2) is a product of the aerobic metabolism of energy containing nutrients (carbohydrates) in humans and animals and from industry- and transport-related combustion processes. The rise in global CO2 emission (37 gigatons in 2018)1 and consequently its accumulation in the atmosphere caused and continues to cause a global rise in temperature, which has deleterious effects on the climate (Jackson et al., 2018; Loeb et al., 2021). Hence, there is the need for CO2 reduction, for example through capture and storage (Marchetti, 1977; O’Callaghan, 2018). CO2 is captured in industrial plants and transported via pipelines to underground (or undersea) storage facilities, such as depleted gas stores (O’Callaghan, 2018). Large scale implementation of this technique in the near future could result in storage of CO2 in the vicinity of populated areas. In case of incidents (e.g., pipeline failures and/or problems at storage facilities) point source releases of large quantities of CO2 will result in a cloud with high CO2 levels. Acute exposure to high levels of CO2 may be hazardous for human health, both within the fence line (workers), as well as outside the fence line (general public). CO2 exerts its acute toxicity through different mechanisms. Most importantly, at acute exposure to high levels (>30%), CO2 induces the displacement of oxygen (CO2 is heavier than air), causing a hypoxic environment and toxicity from asphyxia (the lack of oxygen combined with an increase in arterial CO2 concentrations). Second, upon inhalation, CO2 causes sympathoexcitation and acidosis (Lumb, 2017), which may cause arrhythmias and tissue injury. Finally, CO2 induces severe anxiety and fear due to cerebral acidosis (Griez et al., 2007; Ziemann et al., 2009), which may cause inability to take coherent decisions, an effect that is further aggravated by cognitive decline at high inspired CO2 concentrations (Sayers et al., 1987).
Since its discovery in 1754, several scientific publications were dedicated to the effects of CO2, but the number of dose escalation studies on the effect of acute exposure to CO2 on changes in human physiology is sparse (Loevenhart et al., 1929; Sayers et al., 1987; Griez et al., 2007; Gill et al., 2014). The highest inhaled CO2 concentration studied was 40% and published almost a century ago (Loevenhart et al., 1929). While these extremely high concentrations were only applied for a few breaths, it did provide some information on CO2-induced subjective symptoms. Here we present data from an exploratory and translational project, performed in humans and rats, that was aimed to improve our understanding of the physiological and behavioral effects of short-term (acute) exposure to high levels of carbon dioxide. This understanding will facilitate the safety design and emergency response procedures for CO2 transport and storage facilities. We exposed healthy young adult humans to 6–12% inhaled CO2 for 10–60 min, and exposed rats to 10–50% CO2 for up to 60 min.
Since there is a lack of systematic examination of the effect of time-varying escalating concentrations of inhaled CO2 in humans and translation between man and animal (rodent) studies is sparsely described, we performed the current study, with ultimate aim to provide data to reassess the current guidelines for CO2 exposure. To these ends, we determined the effect of CO2 inhalation on tolerability (in human and rats), lethality (in rats) and on the acute acid-base state as measured by arterial pH. Studies involved regular arterial blood sampling for blood gas analyses during and following exposure to CO2 and objectivation of behavioral changes. In humans, we further tested cognition, cerebral oxygen saturation, and measured hemodynamic parameters. In the animals, the lungs were examined to assess pathology and possible causes for CO2-related death. Next, to correlate the results of the animal with those of the human studies, we developed a translational model of pH to provide insight in the effect of higher CO2 concentrations than tested in our human study population on pH. We hypothesized that at least 50% of healthy volunteers are able to tolerate 9% CO2 inhalation for periods up to 30 min.
In this exploratory project both animal and human studies were performed. The animal protocol was approved by the University Animal Ethics Committee (Leiden University, Leiden, the Netherlands), the human protocol by the Human Ethics Committee (Commissie Medische Ethiek, Leiden, the Netherlands) and the Central Committee on Research Involving Human Subjects (CCMO, competent authority) in The Hague, the Netherlands, all in 2015. During the study we remained in close contact with the ethics committee and regularly reported on the progress and occurrence of adverse events of the study. The human protocol was registered in the trial register of the Dutch Cochrane Center (www.trialregister.nl) under identifier NL4955 on 1 August 2015. Since the trial register is no longer available, the protocol can be obtained from the authors (YS5kYWhhbkBsdW1jLm5s). The study was conducted in accordance with current Good Clinical Practice Guidelines and adhered to the principles of the Declaration of Helsinki. The study was performed from 1 Oct 2015-1 March 2018.
Healthy male volunteers were recruited to participate in the study. Inclusion criteria were age 18–25 years; body mass index in the range 18–25 kg/m2 (inclusive) with body weight between 50 and 100 kg; absence of any significant medical, neurological, or psychiatric illness as determined by the investigators; and willingness and competence to sign a written informed consent. Exclusion criteria were: a history of panic disorder; a history of hypertension; present or a history of any illicit drug use; present or a history of alcohol abuse (intake of more than 4 units per day); smoking of more than 10 cigarettes per day; participation in a drug trial in the 3 months prior to screening; any physical abnormality as determined by an independent physician; or any other issue/condition that in the opinion of the investigator would complicate or compromise the study or the well-being of the subject (these include claustrophobia, fear of needles, car sickness, recurrent headaches, tinnitus, unwillingness to follow the instructions of the researchers).
All subjects were studied once (i.e. they only were exposed to one concentration of CO2 for just one duration). The first set of 54 subjects received one of three inhaled carbon dioxide concentrations, 6%, 7.5% or 9%, with adjusted inspired oxygen levels of 19.7%, 19.3% and 18.9%, respectively (these values simulate O2 displacement by CO2). Exposure times were escalating with 6 subjects inhaling 6% CO2 for 10 min, 6 others for 30 min and finally 6 others for 60 min. When no stopping rules were met, we increased the CO2 concentration to 7.5% and again exposed 6 subjects for 10 min, 6 others for 30 min and finally 6 subjects for 60 min. After successful completion of these cohorts, we amended the protocol to further expose 20 volunteers to 10% CO2 (inspired O2 18.8%; n = 10) and 12% CO2 (inspired O2 18.4%; n = 2) for a maximum duration of 10 min. Stopping rules were: pH < 7.20, heart rate >180 beats per min, systolic blood pressure >200 mmHg, diastolic blood pressure >120 mmHg or subjectively experienced side effects warranting discontinuation (as decided by the subject or the investigators). In case stopping rules were met in cohorts 1 to 10, we discontinued the experiment in that subject but continued to the next subject; however, the study would be terminated when all subjects of a specific cohort would have reached stopping rules. For cohort 11, we decided to evaluate the advancement to a next subject based on the results of the previous subject.
To ensure the safety of the subjects and obtain as much information during CO2 exposure we continuously measured the ECG, peripheral arterial oxygen saturation through a finger probe (SpO2), and regional cerebral oxygen saturation (rSO2) using an INVOSTM 5100C cerebral oxygen saturation monitor (Medtronic, Minneapolis, MI, United States) with the sensor applied to the left side of the forehead. An intravenous access line was placed in the cubital vein of the non-dominant arm, and a 22G arterial cannula was placed in the radial artery (at the level of the wrist) of the non-dominant arm. The arterial line was connected to a FloTrac sensor and Vigileo system (Edwards Lifesciences, Irvine, United States) for cardiac index monitoring. The oxygen and carbon dioxide concentrations were measured in the helmet close to the mouth using a capnograph (Capnomac Ultima, Datex-Ohmeda, Finland).
An adult size continuous positive airway pressure helmet (Dimair®) was used to deliver the gas mixture to the participants. The helmet was positioned over the head and closed around the neck, and allowed normal verbal communication with the research staff and permitted performance of cognition tasks without any constraints or respiratory efforts. A gas mixture was delivered to the helmet from a custom-build computer-controlled gas-mixing setup (the first-generation Leiden gas mixer) containing three mass flow controllers (Bronkhorst High-Tech BV, Veenendaal, the Netherlands) for delivery of 50 L/min gas in any combination of O2, CO2 and nitrogen (Dahan et al., 1990). The helmet had an outlet (Ø 44 mm) ensuring adequate drainage of gas flow and guaranteeing no pressure buildup within the helmet even at high respiratory rates. Prior to the exposure to increase levels of CO2, the subjects breathed a gas mixture that mimicked room air (20.8% O2 in nitrogen).
After a period of relaxed breathing, the following baseline values were collected: arterial gas values (pH, arterial PO2, arterial PCO2 and oxygen saturation; derived from the i-STAT blood gas analyzer (Abbott, United States) using CG8+ and CG4+ cartridges; in the 10 and 12% exposure cohorts, two devices were used to keep up with the frequent blood sampling; the device is able to measure pH values from 7.7—6.5), cardiac index, cerebral oxygen saturation (rSO2), and subjective experiences (sedation, nausea, headache) and a p-deletion test. Next, the subject was exposed to the preset gas mixture. During exposure arterial blood gas measurements were obtained at 5-min intervals (2-min intervals for the 10 and 12% CO2 cohorts), subjectively experienced side effects at 10-min intervals and non-invasive blood pressure using an arm cuff at 10-min intervals. All other variables (O2 and CO2 concentrations in the helmet, cardiac index and brain oxygen saturation) were logged continuously at 50 Hz.
The CO2 exposure ended when the intended duration of the experiment was reached, in case stopping rules were met, upon request of the subject, or upon judgement of the attending physician. Upon termination, 100% oxygen was administered for 5 min; thereafter the helmet was removed and the subject breathed room air. In case the experiment ended prematurely, an attempt was made to obtain a final arterial blood gas sample was obtained. We queried the subjects immediately after CO2-exposure for side effects including sedation, nausea and headache using a 11-point Likert scale ranging from 0 (not present) to 10 (maximum experience of symptom); querying continued at 30-min intervals for at least another hour. After removal of the helmet, the subject was monitored for 60-min. The subject was dismissed from the laboratory only if side effects (including subjective effects) had waned and the attending physician agreed that the subject was sufficiently recuperated to go home.
To determine the cognition of the subject during and following CO2-exposure, the modified p-deletion test was performed (Dixon and Thornton, 1973). The test consists of 19-lines on one page of 38 lower case letters b, d, q and p. A total of 45 letters p are distributed at 2 to 3 per line at a random location within the line. The test was performed at t = 10-, 30- and 60-min during CO2 exposure (depending on the cohort) and at t = 30- and 60-min following CO2 exposure. The test was scored by determining the number of successfully completed lines and the number of mistakes.
CD® (Sprague Dawley) IGS adult male rats (250–270 g) were purchased from Charles River Laboratories (Leiden, the Netherlands). The animals were obtained with a femoral arterial catheter in place (Instech Laboratories Inc., PA, United States). The animals were exposed to one of five inspired CO2 concentrations, 10, 20, 30, 40 or 50%, with adjusted inspired oxygen concentrations of 18.9, 16.7, 14.6, 12.5 or 10.4%, respectively, in cohorts of 8 animals (total number of animals used in the study is 41, including 1 control animal breathing just ambient air). Each animal was exposed for 60 min, after which they were euthanized by pentobarbital injection.
The arterial line allowed continuous access to arterial blood (100 μl) for blood gas analysis and glucose and [K+] measurement. In order to restrict blood loss from the animals two distinct sampling strategies were applied per cohort. The sampling regimen of the first group (n = 4) focused on acute changes in blood gas values following the initiation of CO2 exposure (t = 0) with sampling at 2-min interval from t = 0 (just prior to exposure) to t = 10 min, and 2 final samples at t = 15 and 20 min. In the second group, the remaining 4 animals, sampling occurred at t = 0, 5, 10, 20, 30, 40, 50 and 60 min following the start of CO2 exposure. Maintenance of the arterial catheter prior to the study was according to the guidelines of the Charles River laboratories. During exposure, all animals were monitored for changes in behavior and respiratory rate was counted at 5-min intervals. Animals that appeared in discomfort (e.g. because of epileptiform activity) or moribund (e.g. gasping) prior to the end of the CO2 exposure were taken out of the inhalation box and euthanized.
CO2 exposure occurred in a custom-build Perspex transparent inhalation box. The animals were unrestrained throughout the experiment. The air humidity and temperature in the box were maintained constant by using of a humidifier. The box was connected to the first-generation Leiden gas mixer, and the desired gas mixture flowed through the box at 20 L/min. Each CO2 exposure was preceded by inhalation of a gas mixture that mimicked ambient air. The arterial line was accessible from the outside of the box. Gas concentrations within the box were constant until completion of the 1-h CO2 exposure or in case the animal became moribund and was removed from the box. Following the death of the animals, macro and micro-pathological examination of the lungs was performed to determine exposure-induced lung damage by the department of animal pathology of the Leiden University Medical Center.
Obduction and macroscopic analysis was performed in all animals. A microscopic inspection of the lungs was performed in a random selection of the animals (n = 7), exposed to 10% CO2 (n = 1), 20% CO2 (n = 1), 30% (n = 1), 40% CO2 (n = 1) and 50% CO2 (n = 3). To serve as control, one additional animal was euthanized with pentobarbital after 1 h of air breathing (without CO2 exposure). First, the lungs were inspected for subpleural hemorrhages. Next, five to six lung sections were stained with hematoxylin and eosin to grade the number of hemorrhages (alveolar, peribronchial, perivascular), alveolar or perivascular emphysema and % total emphysematous area. A total of 46 observations were included in the analysis.
For sample size calculation, we focused on the tolerability of inhaling 6% CO2 versus 9% CO2 in the human population and assumed that all subjects in the 6% CO2 arm of the study would tolerate 30 min of CO2 inhalation, while in the 9% CO2 arm this would be 5. We then calculated a minimum sample size of 8 to detect whether the stated difference exists between the two proportions. Given the uncertainties in the assumptions, we included 10 subjects in each group (Wang and Chow, 2007). The data are described as mean ± SD, median (range) or number (percentages). No formal data comparisons were performed as this was an exploratory study. Additionally, group numbers were small, comparisons were hampered by data loss from discontinuations (human study) or premature death (animal study) and concentration-effect relationships were evident, making a post hoc comparison less relevant.
The translational model starts out with the CO2 alveolar mass balance (Olofsen et al., 2010):
where VOLALV = is the volume of alveolar tissue,
where PVCO2 is the venous CO2 concentration. Mixing of CO2 in the lungs was described as follows:
where α and β are mixing parameters with α =
The CO2 mass balance of the body is modeled as:
where ϕ is the body CO2 equilibration rate constant.
The Henderson-Hasselbalch equation equals:
CO2 exposure was tested as a covariate in the log domain of all parameters. All pH-time data of the human and rat data were fitted simultaneously to the model, while simulations were performed to predict the pH-time data in humans inspiring 10, 15, 20, 30, 40 and 50% CO2. The analysis and simulations were performed in NONMEM, a software package for nonlinear mixed effects modeling, using a population approach.
We intended to include seventy-four male subjects in the study. The study had eleven specific CO2 inhalation cohorts. Cohorts 1–9: 6, 7.5 and 9% CO2 inhalation for 10, 30 and 60 min (with 6 subjects in each cohort) and after finalizing cohorts 1-9, cohorts 10 and 11 (included after ethics approval of a protocol amendment): 10 and 12% inhalation for 10 min, with 10 subjects per cohort. The actual number of treated subjects was 66, as the study was prematurely terminated after 2 subjects were exposed to 12% CO2 for less than 10 min because of side effects (see below). The mean (±SD) age and mean body mass index of the treated subjects were 24 ± 3 years and 23 ± 2 kg/m2, respectively. Among the cohorts no differences were observed in age or body mass index distributions. After the start of CO2 exposure, the intended inspired values were reached within 1 min, arterial PCO2 and PO2 are given in Figures 1B,C.
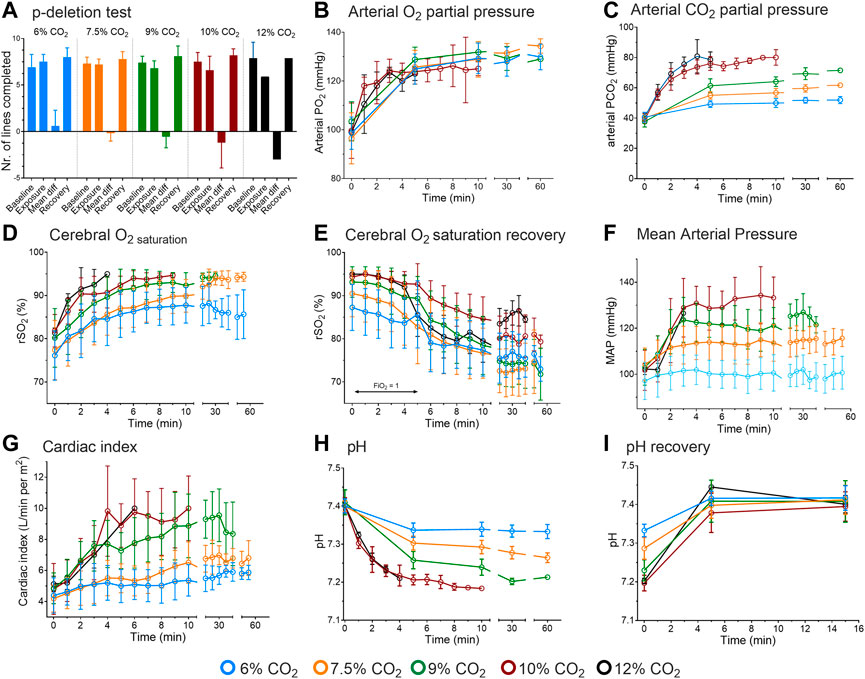
FIGURE 1. Results of the human experiments. (A) Cognitive function assessed by p-deletion test. Results are from before CO2 inhalation, during inhalation and during recovery. The mean difference is the difference between tests obtained at baseline and during inhalation. (B) Arterial oxygen concentrations during 6–12% CO2 inhalation. (C) Arterial carbon dioxide concentrations during CO2 inhalation. (D) Cerebral oxygen concentration as measured by near-infrared spectroscopy during CO2 inhalation. (E) Cerebral oxygen concentration following CO2 inhalation while breathing 100% oxygen (for 5 min) and next while breathing room air. (F) Mean arterial pressure during CO2 inhalation. (G) Cardiac index during CO2 inhalation. (H). pH values during 6–12% CO2 inhalation. (I). pH data obtained during the first 15-min following CO2 exposure while breathing 100% oxygen. The data obtained at 12% inhalation are from 2 subjects; duration of 10 and 12% CO2 inhalation was max. 10 min. All data are mean ± SD.
Average inhalation times are given in Table 1. The inhalation of 6 and 7.5% CO2 was well tolerated for up to 60 min by all subjects. The next cohort, 9% CO2, was well tolerated by subjects inhaling the gas mixture for 10 min. Longer exposure was less well tolerated by 4 (out of 6) subjects that completed 30 min and 1 of 6 completed 60 min of inhalation. The causes of discontinuation were anxiety, panic or exhaustion due to heavy breathing. In the last 2 cohorts (#10 and 11), 3 of 10 subjects completed the 10-min inhalation of 10% CO2, while none of the subjects completed the 10-min inhalation of 12% CO2 (only two subjects were tested in this cohort). The causes of discontinuation were dissociation, blackout, anxiety and overwhelming dyspnea. The two subjects that were discontinued in the 12% CO2 inhalation (after 7 ± 2 min) had pH values <7.2 and were unable to communicate with the investigators although they appeared awake. Additional symptoms observed in the 9, 10 and 12% cohorts were myoclonic twitches, restlessness, headache (average score ±SD 4.8 ± 2.2 on an 11-point Likert scale) and sedation (2.5 ± 1.9 on an 11-point Likert scale); these symptoms were not the reason for participant-initiated discontinuation. After consultation with the ethics committee, we decided not to proceed to a third subject in the 12% CO2 cohort and prematurely ended the study. Interestingly, upon recovery, during inhalation of 100% oxygen, some subjects developed a headache, and some of these subjects vomited. We relate this to the occurrence of sudden vasoconstriction (due to hyperoxia) and cerebral hypoperfusion following maximal vasodilation (due to hypercapnia) (Kety and Schmidt, 1948).

TABLE 1. Inhalation of carbon dioxide in humans.
Cognitive performance, as measured by the p-deletion test, was dose-dependently affected by CO2 inhalation, with the worst performance at inhaled CO2 concentrations of 10 and 12%, with respect to number of lines completed (Figure 1A) and number of errors (data not shown). These effects proved to be transient as a swift recovery was observed upon termination of the exposure. Inability to focus and the laborious breathing activity were the main causes for the decrease in performance. The decreased cognitive performance was unrelated to the oxygen concentration in the brain as brain oxygen concentration (measured by near-infrared spectroscopy on the forehead) increased from 75 to 80–90% within 10 min of inhalation (Figure 1D; recovery of rSO2 given in Figure 1E), most probably related to an increase in cerebral blood flow associated with the increase in cardiac output and cerebral vasodilation.
From 6 to 10% CO2 exposure, mean arterial pressure and cardiac index dose-dependently increased to a maximum of 140 mmHg and 10 L/min per m2, respectively (Figures 1F,G). No further increase in mean arterial pressure was seen in the 12% CO2 cohort, which we relate to the small number of subjects (n = 2) that remained in that cohort and the frequent blood sampling that limited the ability of the invasive blood pressure measurement device to obtain reliable blood pressure values.
Arterial PO2 increased over the first 5 min of exposure to 125 mmHg, in a dose-independent manner (Figure 1B). This was unexpected as at constant inspired oxygen fraction, water pressure and atmospheric pressure, alveolar PO2 is inversely related to alveolar PCO2. At higher inspired CO2 levels alveolar PO2, and subsequently arterial PO2 and oxygen saturation should decrease. Additionally, the right-shift of the hemoglobin-oxygen dissociation curve supports oxygen unloading from hemoglobin, causing a further drop in arterial PO2. Possibly a reduction of the ventilation/perfusion mismatch, related to an increase in ventilation and cardiac output, counteracted the expected decrease in arterial PO2 (see also below).
In all cohorts, pH decreased rapidly to a plateau after 5 min of CO2 inhalation (Figure 1H). Dose-dependency was apparent until the 10% CO2 cohort with no further decrease in the 12% CO2 cohort, which we again attribute to the small number of subjects that remained in that cohort. Lowest pH was 7.18 in the subject that was subsequently discontinued from the 12% CO2 cohort. Upon recovery, pH returned to baseline values within 5 min; pH recovery is given in Figure 1I. Finally, glucose levels (only measured in the 6–9% CO2 cohorts) remained constant over time within the normal range (range 5.5–6.3 mmol/L with normal values 4.0–6.1 mmol/L).
From the measured arterial PCO2 values, we were able to estimate the minute ventilations at static pH values as observed in the 6–9% CO2 cohorts, using the formula of the hypercapnic ventilatory response, VE = S × (PaCO2—B), where VE is minute ventilation, S the slope of the hypercapnic ventilatory response, PaCO2 arterial PCO2 and B the extrapolated arterial PCO2 at zero ventilation (Nielsen and Smith, 1951). We used values of S and B estimated in similar study populations (Dahan et al., 1990; Dahan et al., 2007; Algera et al., 2022). The results were for 6% CO2 an estimated minute ventilation of 29 L/min, for 7.5% CO2 48 L/min and for 9% CO2 66 L/min.
Forty adult male Sprague Dawley rats with mean weight 261 ± 33 g were exposed to increasing concentrations of inhaled CO2 (10, 20, 30, 40 and 50%) with 8 animals per dosing cohort. Additionally, 1 animal served as control for pathology.
All sixteen animals completed the 1-h exposure to 10 and 20% CO2 without serious discomfort. The animals in the 10% CO2 cohort exhibited normal behavior throughout the 1-h exposure. The animals in the 20% CO2 cohort displayed hyperactivity and excitation for the first 30–40 min of exposure and then transitioned slowly into hypoactivity during the remaining time in the inhalation box. Hyperactivity consisted of rapid irregular breathing, disorganized behavior and uncoordinated movements. During exposure to 30% CO2, an initial 10-min period of hyperactivity was followed by pronounced hypoactivity (apparent CO2 narcosis); in four animals sudden and severe epileptiform activity occurred and the animals were, as we wanted to prevent any further discomfort, immediately euthanized with pentobarbital. None of the other four animals showed any excitatory signs or irregular breathing. During exposure to 40% CO2, an initial 1–2 min period of hyperactivity was followed by complete hypoactivity and rapid shallow regular breathing (apparent CO2 narcosis); none of the animals died or displayed signs of epilepsy. During exposure to 50% CO2, apparent narcosis rapidly developed and the animals showed slow shallow breathing. Five animals died after 14–25 min of exposure, the others survived until the end of exposure.
During 10–40% CO2 inhalation, respiratory rate increased from baseline values (80 breaths/min) to 150–175 breaths/min within 10-min of CO2 exposure (Figure 2A). At 50% CO2 inhalation, a decrease in respiratory rate was observed from baseline to 25 breaths/min. In all cohorts, the decline in pH was biphasic, with an initial rapid decrease followed by either no further decline (10% CO2 cohort) or a further slower decline (Figure 2B). The magnitude of acidosis development was dose-dependent with lowest pH values observed in the 10% CO2: pH = 7.26 ± 0.2 at t = 10 min, 20% CO2 cohort: pH = 6.90 ± 0.4 at t = 30 min, 30% CO2 cohort = 6.82 ± 0.01 at t = 20 min; 40% CO2 cohort: pH = 6.63 ± 0.08 at 30 min; and in the 50% inhalation cohort: pH = 6.54 ± 0.02 at t = 20 min. Due to missing data from the loss of animals, device-related limitation to measure pH below 6.5 or issues with sampling from the arterial line, these values may be an overestimation of the actual values in the highest CO2 cohort.
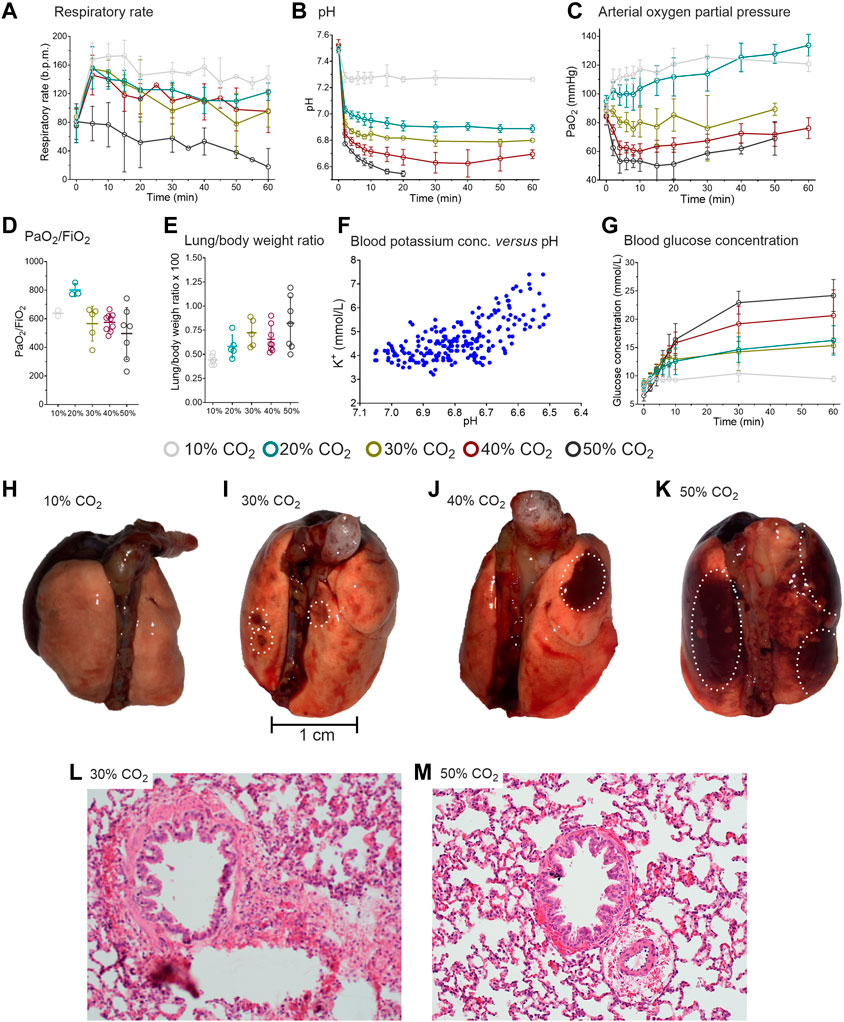
FIGURE 2. Results of the rat experiments. (A) Respiratory rate during the 1-h inhalation of 10, 20, 30, 40 or 50% CO2. (B) pH during CO2 inhalation. During 50% CO2 inhalation 5/8 animals died after 14–25 min. In the remainder of animals, no pH samples were obtained beyond 20 min (C) Arterial oxygen concentrations. (D) Arterial PO2/FiO2 ratio in the different CO2 exposure groups. (E) Lung/body weight ratio in the different CO2 exposure groups. different CO2 exposure groups. (F) Blood potassium concentration versus pH. (G) Blood glucose concentration in the various CO2 exposure groups. (H-K). Macroscopic aspect of the lungs of three distinct animals that inhaled 1-h of 10%, 30% and 50% CO2. The white circles indicate the location of hemorrhages. l and m. Microscopic aspect of lung sections of two distinct animals treated with 30% (I) and 50% (M) CO2. Peribronchiolar and perivascular hemorrhages are present as well as emphysema throughout the section. The slices in panels l and m are 200-times magnified and stained with hematoxylin and eosin. The data in panels a-c and g are mean ± SD, in panels d and e median (50–75% interquartile) are given.
In the low CO2 inhalation cohorts (10 and 20%) arterial oxygen concentrations increased, despite reduced FiO2 values that were implemented to simulate O2 displacement by CO2 (Figure 2C) (Gill et al., 2002). Similar to the observations in humans, we expect that this is the consequence of the reduced ventilation/perfusion mismatch (i.e. reduced shunting), the increase in breathing frequency, hypercapnia-potentiated hypoxic pulmonary vasoconstriction and increased cardiac output. The increase in arterial PO2 was maintained throughout the 60-min of CO2 inhalation.
In the 30–50% CO2 inhalation cohorts, arterial oxygen concentrations significantly decreased (Figure 2B). Despite the pulmonary damage (see below), the PaO2/FiO2 ratio remained unaffected by the CO2 level with relatively normal to supra-normal values irrespective of the inhaled CO2 concentration (Figure 2C). Due to missing data from the loss of animals in the 30 and 50% CO2 inhalation cohorts and sometimes sampling issues, the PaO2/FiO2 ratios are most probably largely overestimated.
Extracellular potassium concentration increased with decreasing pH due to the H+/K+ exchange across the cell membrane (Figure 2F). The increase in plasma K+-concentration may be associated with cardiac arrhythmias and death in the animals that succumbed to high dose CO2 inhalation, although other causes of death are not excluded (see below). A dose-dependent increase in glucose concentration was observed with the highest glucose concentration measured in the 50% CO2 cohort (24 mmol/L; Figure 2G). No increase in glucose was observed in the 10% CO2 cohort.
Macroscopic inspection of the lungs revealed that the animals exposed to 30–50% CO2 had signs of subpleural or pulmonary hemorrhage and edema (Figures 2H–K). The lung to body weight ratio dose-dependently increased indicative of accumulation of fluid and blood in the lungs (Figure 2E). An important finding was that the animals that had prematurely expired had 60% greater lung weights than animals that completed the exposure: 2.4 ± 0.3 g versus 1.4 ± 0.2 g. Microscopically, a dose-dependent increase in emphysematous pulmonary changes, edema and hemorrhages was observed (Table 2). The microscopic changes observed in the 30% and higher CO2 cohorts were severe and most probably not compatible with (long-term) survival (Figures. 2L and 2M). These findings indicate that pulmonary damage may be the final and definite cause of death from CO2 and/or acute hypoxia in these rats (at 50% CO2 the arterial PO2 is around 75 mmHg, Figure 2C).

TABLE 2. Effect of CO2 on lung damage in rats.
In order to predict the pH effect of higher CO2 inhalations than tested in the human subjects, we constructed a translational physiological model of acidity (pH). To that end, we simultaneously analyzed the human and animal data, using a model that combined the CO2 mass balance in the alveoli, the CO2 mass balance in the body compartment and the Henderson-Hasselbalch equation using a population approach in the statistical package NONMEM. Inspection of the data fits as well as of the goodness of fit plots (data not shown) indicate that the data from two species were well described by the model. Examples of data fits are given in Figures 3A–E: Figures 3A–C give examples human data fits with inhalations of 12, 10 and 9% CO2; Figures 3D,E show two examples of rat data fits. Parameters estimates were similar for rat and human data, except for CO2 mixing parameters α and β. Parameter values (median ±standard error of the estimate) at baseline, prior to any CO2 exposure, were: [HCO3-] = 25.6 ± 0.21 mmol/L, PCO2 = 47.3 ± 0.83 mmHg and the body CO2 equilibration rate constant ϕ = 1.98 ± 0.56; for humans α = 0.89 ± 0.01 and β = 1—α, for rats α = 0.67 ± 0.12 and α + β = 0.93 ± 0.007. CO2 exposure was a significant covariate on ϕ with logϕ = -0.031 ± 0.007. These results indicate a slower mixing of CO2 in humans with a slower decrease in pH over time and reduction of ϕ at higher CO2 exposures.
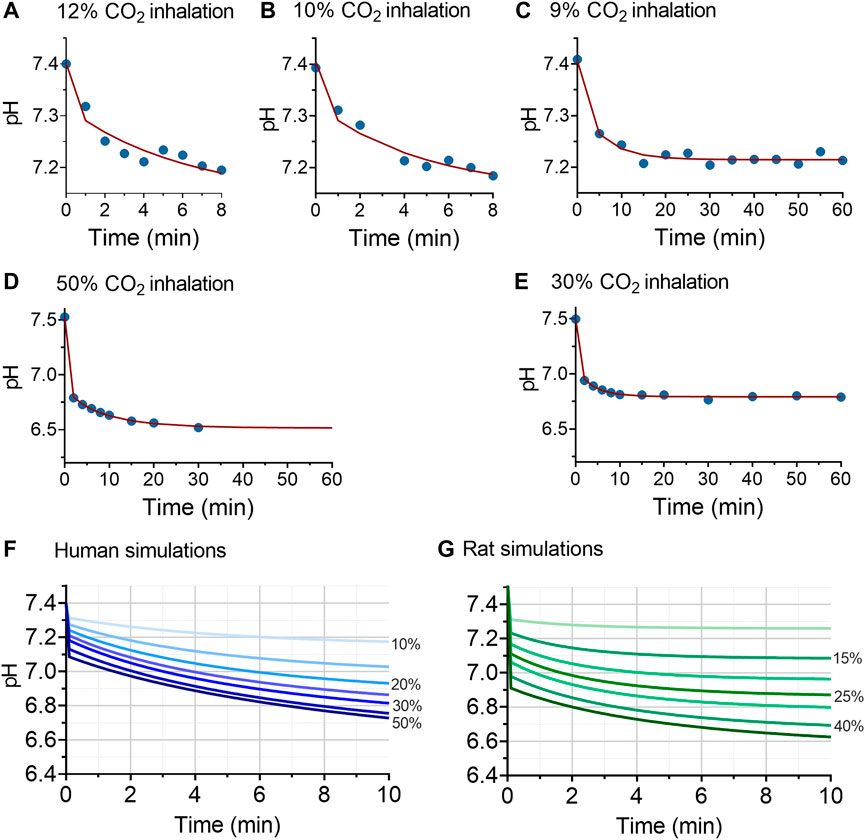
FIGURE 3. Results of the translational model analysis of acidosis (pH). Panels (A–E) given examples of the pH model fits in humans (A–C) and (D and E) in rats. The blue circles are the measured data, the red lines the data fits. Panels (F and G) give the simulations at inhalation values of 10% (top lines in the two panels), 15%, 20%, 25%, 30%, 40% and 50% (bottom lines in the two panels) CO2 inhalation. The human simulations indicate that at inhalation levels of 15% CO2 or higher, pH values <7.2 are readily reached.
Predictions of pH values at 10% inspired CO2 or higher are given in Figures 4F (humans) and 4g (rats). The human simulations predict that pH will decrease below 7.2 after 6 min of 10% CO2 inhalation and within 2 min after 15% CO2 inhalation. At higher inhaled CO2 concentration, pH decreased below 7.2 within 1 min of exposure. For example, at 20% inhaled CO2 pH decreased to 7.25 within 50 s, and reached a value of 6.9 after 10 min of inhalation. At 50% CO2 inhalation pH decreased initially to 7.08 and further towards 6.72 after 10 min of inhalation. The decrease in pH was slower in humans than in animals at similar simulated CO2 inhalations, which we related to slower CO2 mixing in humans than rats, as reflected by differences in values for α and β between the two species.
The main findings of this translational project were that in a population of heathy young volunteers, the inhalation of 6 and 7.5% CO2 was well tolerated for up to 1-h, while tolerance to 9% CO2 was limited to the short exposure time (10 min). Longer duration of 9% CO2 inhalation and higher CO2 concentrations (10 and 12%) were not tolerated, with causes for discontinuation: exhaustion, anxiety, acidosis (pH < 7.2, which was one of the stopping rules), dissociation or blackout (both led to the inability to communicate with the subject). The oxygenation of the subjects remained intact with an increase in arterial PO2 and brain oxygen saturation. In rats, all animals survived the 10% and 20% CO2 inhalation, while at 30% CO2, 4 animals developed epileptiform activity and 5 animals died during 50% CO2 exposure. These deaths were related to the high CO2 aggravated by the presence of hypoxia, and were associated with severe lung damage, sympathoexcitation (as deduced from the blood glucose levels) and possibly also acidosis-induced hyperkalemia. Oxygenation of the animals worsened at higher CO2 concentrations with a reduction in arterial PO2 to about 50 mmHg at 50% CO2 inhalation. We were able to connect the human and rat data by constructing a translational model of pH allowing the prediction of pH values over time over the CO2 concentration range of 10–50%.
The difference in the CO2-level at which the human volunteers and the rats lost tolerance to further exposure was evident but CO2-related physiological changes were such that we could perform an interpolation between species. Irrespective of species, we may conclude that up to 20% CO2 inhalation, arterial PO2 increases and only decreases at higher inhalation levels. Possibly the initial increase in arterial PO2 is related to an increase in cardiac output, reduced pulmonary vascular resistance, CO2-induced bronchodilation, acidosis-related improvement of hypoxic pulmonary constriction, that all combined led to an improvement of the ventilation/perfusion ratio. These effects counteract the expected reduction in arterial PO2 because of the lower inspired oxygen faction (reflecting oxygen dispersion by CO2), right-ward shift of the oxygen dissociation curve, increased dead space ventilation due to tachypnea, and recruitment of poorly perfused lung areas. At higher inhaled CO2 concentrations, the decrease in arterial PO2 is explained by these later factors and by lung damage (hemorrhages, edema and emphysema, Table 2 and Figure 2I–2M). The maintained PaO2/FiO2 ratio, particularly in the higher CO2 inhalation cohorts, was not expected, but we relate these to that fact that measurements were restricted to animals that survived with possibly less pulmonary damage (attrition bias). Additionally, the FiO2 values in our experiments were low, in contrast to the high FiO2 in ventilated patients with respiratory distress disorders. Another relevant observation was the development of hyperglycemia that occurred at CO2 concentrations of 10% and higher. Hyperglycemia is a sign of severe stress and is also observed during hemorrhagic shock and critical illness, and is related to sympathoadrenergic activity (Marik and Bellomo, 2013; Scheen et al., 2021). Importantly, hyperglycemia is related to poor outcome in critical illness (Scheen et al., 2021). The absence of hyperglycemia in the human experiments may be related to the restriction of measurements to the 3 lowest CO2 concentration cohorts. Overall, these results indicate the validity of translational studies in the extrapolation of physiological responses from one species (rat) to the other (human), in this case the response to high inhaled concentrations of CO2.
The development of a translational model to describe pH values at higher inhaled CO2 than tested in our human population was successful. The results (Figure 1H, Figure 2B, Figure 3F,G) indicate that the decrease in pH was more rapid in rats than in humans upon initiation of inhalation, a steady-state in pH developed earlier in the rat, and buffering capacity at steady state was greater in the rat. We relate this in part to a faster CO2 mixing (as reflected by the species differences in model parameters α and β, see Eq. 3), possibly related to the smaller body size and relatively higher spontaneous ventilation and cardiac output in the rats. The greater tolerability to CO2 in the rat may be an indication of the large phylogenetic distance between rat and man, in contrast to the distance between rat and other animals with a high tolerability to hypercapnia such as the naked mole rat (Husson and St. John Smith, 2018; Park et al., 2021; Pamenter and Cheng, 2022). In our human study, we did not allow continuation of CO2 inhalation when pH values decreased below 7.2. This was an arbitrary level, as we are aware that lower pH levels (pH < 6.9) are sometimes observed in humans without deleterious consequences (Goldstein et al., 1990). Still eventually extreme pH values (pH < 6.6) do compromise cellular and protein function and consequently will affect cardiac and brain function (Poole-Wilson, 1982; Rehncrona, 1985; Orchard and Kentish, 1990).
The causes for discontinuation (apart from the low pH observed in two subjects during 12% CO2 inhalation and death in the rats inhaling 50% CO2) were related to neuropsychiatric effects with dissociation, blackout, anxiety or exhaustion in the human subjects, and epileptiform activity during CO2 narcosis in the animals. Several mechanisms may be involved in the inability to tolerate CO2. Cerebral hyperperfusion, increased intracranial pressure, cerebral edema and/or encephalopathy may have occurred during CO2 inhalation. To detect possible structural brain damage in the animals, we removed the brains of the animals at obduction for a gross examination but observed no signs of edema or hemorrhage (data not shown). Possibly this is related to the fact that arterial PO2 remained above 75 mmHg throughout the hypercapnic exposure (Paljärvi et al., 1982; Yang et al., 2016). Still, we cannot exclude some deleterious effect of CO2 on the function of specific brain centers at levels up to 12% CO2 in humans and at higher concentrations in the animals. The coupling between local blood flow and synaptic activity may be severed at extreme levels of hypercapnia possibly due to a CO2 effect at the acid sensing ion channels (ASICs), which are important in regulating the coupling between local blood flow and synaptic activity (Faraci et al., 2019; Stark et al., 2019). Further studies are needed to disentangle the complex interaction of arterial and brain tissue CO2 concentrations and reversible and irreversible cerebral damage.
The injury to the rat lungs was of such severity at the 30% and higher CO2 cohorts that they were considered (eventually) lethal. Still, we need to realize that a small part of the emphysema may have been related to the pentobarbital injection as also in the control animal some emphysema was observed (Table 2). Irrespective, these results suggest that the pulmonary damage was the main cause of death of the animals in the 50% CO2 inhalation cohort. This is also consistent with and aggravated by the effects of acute hypoxia as oxygen levels at 50% CO2 were around 10.5% (approx. 75 mmHg; Figure 2C) (Appelt et al., 2021). However, we cannot exclude other contributing factors such as heart failure, cardiac arrhythmias or cerebral damage. Our findings agree with earlier animal studies in which acute exposure to 40% CO2 in oxygen in 8 rats was associated with dyspnea and fulminant pulmonary edema in all animals (Brosnan et al., 2007).
The combined rat and human data enable human risk assessment for CO2 transport and storage facilities, where CO2 is stored or transported in large quantities. In addition, the data can support emergency response measures for these facilities. When individuals are exposed to an excess of CO2 in ambient air, an important question is at what levels of CO2 inhalation does the human body maintain its ability to adequately function to, for example, escape from the incident scene or to perform a cognitively challenging task. An answer to this question is not only dependent on the results of our current study in healthy young volunteers but is certainly also dependent on the age and more importantly the physical condition of the exposed individual as well as presence of underlying cardiac or pulmonary disease. Our current results indicate that during exposure to 9% CO2 the body retains its ability to function for 10 min, albeit with large variability in tolerance with some subjects able to withstand 30 min and one subject 60 min of exposure. Still at this inhaled concentration all subjects experienced some form of discomfort, anxiety and reduced cognitive performance. Hence, it remains questionable whether at this inhaled concentration, the individual will be able to coherently perform a complex task. We expect that fleeing the scene will remain possible. Note that we expect CO2 tolerance to decrease rapidly in older individuals with lower resilience and those with existing cardiac or pulmonary disease. The translational model predicts that at inhaled CO2 concentrations greater than 9%, pH will rapidly decrease to values that further hamper the capacity to function adequately.
Risk assessment for CO2 storage and transport facilities also includes estimates of probability of incidents, and probability of death in these incidents. Probability of death is typically estimated from acute lethality data in animals or anecdotal information form incidents. To support risk assessment for CO2 storage and transport facilities, CO2 lethality in rats has been investigated by Muijser et al. (2014). Their lethality data are consistent with the data presented in this paper. When considering only rat lethality as endpoint, the CO2 dose-response curve is too steep to allow for derivation of a reliable estimate of probability of death in humans. Our study has included additional physiological parameters to allow translation of the animal data to the human situation. Human tolerability was demonstrated here to levels of 9% CO2 for short durations (up to 10 min) and these data support a reconsideration of the current CO2 risks determined by e.g. the United Kingdom Health and Safety Executive and United States Environmental Protection Agency, which mention the unconsciousness can result within a few minutes of exposure to 7% CO2 (US Environmental Protection Agency, 2000; McGillavray and Wilday, 2009). Further analysis of the data in this study could provide essential insight into the probability of human effects and fatality after acute exposure to high levels of CO2 and will drive land-use planning, setting of risks management measures, and emergency response planning.
Finally, in laboratory animals, a CO2 overdose is the most commonly used practice for euthanasia (Conlee et al., 2005; Boivin et al., 2017; Turner et al., 2020). Our rat data indicate that this will coincide with various neurological symptoms, indications of stress and tissue damage. Additionally, CO2 at high concentrations activates nociceptors in the nasal cavity which is associated with severe pain sensations (Thürauf et al., 1991; Green and Hummel, 2013; Hickman et al., 2016). Hence, from an animal welfare perspective it is questionable whether this form of euthanasia is harmless as our findings as well as those of others indicate that a CO2 overdose is highly distressful and will cause damage to lung tissue (Conlee et al., 2005; Boivin et al., 2017; Turner et al., 2020).
The data are available from the authors after agreement has been obtained regarding purpose of analysis and protocol.
The animal protocol was approved by the University Animal Ethics Committee (Leiden University, Leiden, Netherlands), the human protocol by the Human Ethics Committee (Commissie Medische Ethiek, Leiden, Netherlands). All human subjects gave written informed consent to participate in the study.
AD, MN, MvV, RvS and CS were involved in the design of the study. AD, RvS, MvV, EO, ES and MN performed experiments and contributed to data collected. AD, RvS and EO designed the statistical analysis and performed data analysis. MN and MvV supervised the project. AD and RvS wrote the initial draft of the manuscript. All authors were contributed to data, interpretation, final drafting of the manuscript, and approved the submitted version.
Support was provided from institutional and/or departmental sources and by Shell Global Solutions International BV, The Hague, Netherlands.
Author CS is employed by Shell Global Solutions International BV.
The remaining authors declare that the research was conducted in the absence of any commercial or financial relationships that could be construed as a potential conflict of interest.
All claims expressed in this article are solely those of the authors and do not necessarily represent those of their affiliated organizations, or those of the publisher, the editors and the reviewers. Any product that may be evaluated in this article, or claim that may be made by its manufacturer, is not guaranteed or endorsed by the publisher.
Algera, H., van der Schrier, R. M., Cavalla, D., van Velzen, M., Roozekrans, M., McMorn, A., et al. (2022). Respiratory effects of the atypical tricyclic antidepressant tianeptine in human models of opioid-induced respiratory depression. Anesthesiology 137, 446–458. [online ahead of print]. doi:10.1097/ALN.0000000000004324
Appelt, P., Gabriel, P., Bölter, C., Fiedler, N., Schierle, K., Salamehet, A., et al. (2021). Left ventricular depression and pulmonary edema in rats after short-term normobaric hypoxia: effects of adrenergic blockade and reduced fluid load. Pflugers Arch. 473, 1723–1735. doi:10.1007/s00424-021-02618-y
Boivin, G. P., Hickman, D. L., Creamer-Hente, M. A., Pritchett-Corning, K. R., and Bratcher, N. A. (2017). Review of CO2 as a euthanasia agent for laboratory rats and mice. J. Am. Assoc. Lab. Anim. 56, 491–499.
Brosnan, R. J., Eger, E. I., Laster, M. J., and Sonner, J. M. (2007). Anesthetic properties of carbon dioxide in the rat. Anesth. Analg. 2105, 103–106. doi:10.1213/01.ane.0000265556.69089.78
Conlee, K. M., Stephens, M. L., Rowan, A. N., and King, L. A. (2005). Carbon dioxide for euthanasia: concerns regarding pain and distress, with special reference to mice and rats. Lab. Anim. 39, 137–161. doi:10.1258/0023677053739747
Dahan, A., DeGoede, J., Berkenbosch, A., and Olievier, I. C. W. (1990). The influence of oxygen on the ventilatory response to carbon dioxide in man. J. Physiol. Lond. 428, 485–499. doi:10.1113/jphysiol.1990.sp018223
Dahan, A., Nieuwenhuijs, D., and Teppema, L. J. (2007). Plasticity of central chemoreceptors: effect of bilateral carotid body resection on central CO2 sensitivity. PLoS Med. 4, e239. doi:10.1371/journal.pmed.0040239
Dixon, P. A., and Thornton, J. A. (1973). Tests of recovery from anaesthesia and sedation: intravenous diazepam in dentistry. Br. J. Anaesth. 45, 207–215. doi:10.1093/bja/45.2.207
Faraci, F. M., Taugher, R. J., Lynch, C., Fan, R., Gupta, S., and Wemmie, J. A. (2019). Acid-sensing ion channels: novel mediators of cerebral vascular responses. Circ. Res. 125, 907–920. doi:10.1161/CIRCRESAHA.119.315024
Gill, J. R., Ely, S. F., and Hua, Z. (2002). Environmental gas displacement: three accidental deaths in the workplace. Am. J. Forensic Med. Pathol. 23, 26–30. doi:10.1097/00000433-200203000-00005
Gill, M., Natoli, M. J., Vacchiano, C., MacLeod, D. B., Ikeda, K., Qin, M., et al. (2014). Effects of elevated oxygen and carbon dioxide partial pressures on respiratory function and cognitive performance. J. Appl. Physiol. 117, 406–412. doi:10.1152/japplphysiol.00995.2013
Goldstein, B., Shannon, D. C., and Todres, I. D. (1990). Supercarbia in children: clinical course and outcome. Crit. Care Med. 18, 166–168. doi:10.1097/00003246-199002000-00008
Green, B., and Hummel, T. (2013). “Nociception in nose and oral mucosa,” in Encyclopedia of pain. Editors G. F. Gebhart, and R. F. Schmidt (Heidelberg, Berlin, Germany: Springer), 150–268.
Griez, E. J., Colasanti, A., van Diest, R., Salamon, E., and Schruers, K. (2007). Carbon dioxide inhalation induces dose-dependent and age-related negative affectivity. PLoS ONE 2, e987. doi:10.1371/journal.pone.0000987
Hickman, D. L., Fitz, S. D., Bernabe, C. S., Caliman, I. F., Haulcomb, M. M., Federiciet, L. M., et al. (2016). Evaluation of low versus high volume per minute displacement CO2 methods of euthanasia in the induction and duration of panic-associated behavior and physiology. Animals. 6, 45. doi:10.3390/ani6080045
Husson, Z., and St. John Smith, E. (2018). Naked mole-rat cortical neurons are resistant to acid-induced cell death. Mol. Brain 11, 26. doi:10.1186/s13041-018-0369-4
Jackson, R. B., Le Quéré, C., Andrew, R. M., Canadell, J. G., Korsbakken, J. I., Liu, Z., et al. (2018). Global energy growth is outpacing decarbonization. Environ. Res. Lett. 13, 120401. jacksonlab.stanford.edu/sites/g/files/sbiybj15141/f/jackson_et_al_2018_erl.pdf. doi:10.1088/1748-9326/aaf303
Kety, S. S., and Schmidt, C. F. (1948). The effects of altered arterial tensions of carbon dioxide and oxygen on cerebral blood flow and cerebral oxygen consumption of normal young men. J. Clin. Invest. 27, 484–492. doi:10.1172/JCI101995
Loeb, N. G., Johnson, G. C., Thorsen, J. T. J., Lyman, J. M., Rose, F. G., and Kato, S. (2021). Satellite and ocean data reveal marked increase in earth’s heating rate. Geophys. Res. Lett. 48, e2021GL093047. doi:10.1029/2021GL093047
Loevenhart, A. S., Lorenz, W. F., and Waters, R. M. (1929). Cerebral stimulation. J. Am. Med. Assoc. 92, 880–883. doi:10.1001/jama.1929.02700370028008
Lumb, A. B. (2017). “Changes in the carbon dioxide partial pressure” in Nunn’s applied respiratory physiology. 8th edition. (Amsterdam, Netherlands: Elsevier), 319–325.
Marchetti, C. (1977). On geoengineering and the CO2 problem. Clim. Change 1, 59–68. doi:10.1007/bf00162777
Marik, P. E., and Bellomo, R. (2013). Stress hyperglycemia; an essential survival response. Crit. Care Med. 41, e93–e94. doi:10.1097/CCM.0b013e318283d124
McGillavray, A., and Wilday, J. (2009). Comparison of risks from carbon dioxide and natural gas pipelines. Available at: https://www.hse.gov.uk/research/rrpdf/rr749.pdf. (Accessed July 22, 2022).
Muijser, H., van Triel, J. J., Duistermaat, E., and Bos, P. M. J. (2014). Acute toxicity of high concentrations of carbon dioxide in rats. Regul. Toxicol. Pharmacol. 69, 201–206. doi:10.1016/j.yrtph.2014.03.008
Nielsen, M., and Smith, H. (1951). Studies on the regulation of respiration in acute hypoxia; with a appendix on respiratory control during prolonged hypoxia. Acta Physiol. Scand. 24, 293–313. doi:10.1111/j.1748-1716.1952.tb00847.x
O’Callaghan, J. (2018). Storing CO2 underground can curb carbon emissions, but is it safe? Horizon, the EU research & innovation magazine. EU Commission. Available at: https://ec.europa.eu/research-and-innovation/en/horizon-magazine/storing-co2-underground-can-curb-carbon-emissions-it-safe (Accessed July 22, 2022).
Olofsen, E., Boom, M., Nieuwenhuijs, D., Sarton, E., Aarts, L., Dahan, A., et al. (2010). Modeling the non-steady state respiratory effects of remifentanil in awake and propofol-sedated healthy volunteers. Anesthesiology 112, 1382–1395. doi:10.1097/ALN.0b013e3181d69087
Orchard, C. H., and Kentish, J. C. (1990). Effects of changes of pH on the contractile function of cardiac muscle. Am. J. Physiol. 258, C967–C981. doi:10.1152/ajpcell.1990.258.6.C967
Paljärvi, L., Söderfeldt, B., Kalimo, H., Olsson, Y., and Siesjö, B. K. (1982). The brain in extreme respiratory acidosis: a light- and electron-microscopic study in the rat. Acta Neuropathol. 58, 87–94. doi:10.1007/BF00691646
Pamenter, M. E., and Cheng, H. (2022). Supermole-rat to the rescue: does naked-model rat offer a panacea for all that ails us? Comp. Biochem. Physiol. A Mol. Integr. Physiol. 266, 111139. doi:10.1016/j.cbpa.2021.111139
Park, T. J., SmithSt, E. J., Reznick, J., Bennett, N. C., Applegate, D. T., Larson, J., et al. (2021). African naked mole-rats demonstrate extreme tolerance to hypoxia and hypercapnia. Adv. Exp. Med. Biol. 1319, 255–269. doi:10.1007/978-3-030-65943-1_9
Poole-Wilson, P. A. (1982). Acidosis and contractility of heart muscle. Ciba Found. Symp. 87, 58–76. doi:10.1002/9780470720691.ch4
Rehncrona, S. (1985). Brain acidosis. Ann. Emerg. Med. 14, 770–776. doi:10.1016/s0196-0644(85)80055-x
Sayers, J. A., Smith, R. E., Holland, R. L., and Keatinge, W. R. (1987). Effects of carbon dioxide on mental performance. J. Appl. Physiol. 63, 25–30. doi:10.1152/jappl.1987.63.1.25
Scheen, M., Giraud, R., and Bendjelid, K. (2021). Stress hyperglycemia, cardiac glucotoxicity, and critically ill patient outcomes current clinical and pathophysiological evidence. Physiol. Rep. 9, e14713. doi:10.14814/phy2.14713
Stark, R. J., Choi, H., and Lamb, F. (2019). Neuronal ASIC1A as a cerebral pH sensor: bringing the flow. Circ. Res. 125, 921–923. doi:10.1161/CIRCRESAHA.119.315925
Thürauf, N., Friedel, I., Hummel, C., and Kobal, G. (1991). The mucosal potential elicited by noxious chemical stimuli with CO2 in rats: is it a peripheral nociceptive event? Neurosci. Lett. 128, 297–300. doi:10.1016/0304-3940(91)90283-y
Turner, P. V., Hickman, D. L., van Luijk, J., Ritskes-Hoitinga, M., Sargeant, J. M., Kurosawa, T. M., et al. (2020). Welfare impact of carbon dioxide euthanasia on laboratory mice and rats: a systematic review. Front. Vet. Sci. 7, 411. doi:10.3389/fvets.2020.00411
US Environmental Protection Agency (2000). Carbon dioxide as fire suppressant: examining the risks. Available at: https://www.epa.gov/sites/default/files/2015-06/documents/co2report.pdf (Accessed July 22, 2022).
Wang, H., and Chow, S. C. (2007). Wiley encyclopedia of clinical trials. New York, NY, USA: John Wiley & Sons.
Yang, W., Zhang, X., Wang, N., Tan, J., Fang, X., Wang, Q., et al. (2016). Effects of acute systemic hypoxia and hypercapnia on brain damage in a rat model of hypoxia-ischemia. PLoS ONE 11, e0167359. doi:10.1371/journal.pone.0167359
Keywords: carbon dioxide, CO2 transport, CO2 storage, tolerability, toxicity, translational study
Citation: van der Schrier R, van Velzen M, Roozekrans M, Sarton E, Olofsen E, Niesters M, Smulders C and Dahan A (2022) Carbon dioxide tolerability and toxicity in rat and man: A translational study. Front. Toxicol. 4:1001709. doi: 10.3389/ftox.2022.1001709
Received: 23 July 2022; Accepted: 12 September 2022;
Published: 13 October 2022.
Edited by:
Marcelo Dutra Arbo, Federal University of Rio Grande do Sul, BrazilReviewed by:
Adam L Balogh, University of Szeged, HungaryCopyright © 2022 van der Schrier, van Velzen, Roozekrans, Sarton, Olofsen, Niesters, Smulders and Dahan. This is an open-access article distributed under the terms of the Creative Commons Attribution License (CC BY). The use, distribution or reproduction in other forums is permitted, provided the original author(s) and the copyright owner(s) are credited and that the original publication in this journal is cited, in accordance with accepted academic practice. No use, distribution or reproduction is permitted which does not comply with these terms.
*Correspondence: Albert Dahan, YS5kYWhhbkBsdW1jLm5s
Disclaimer: All claims expressed in this article are solely those of the authors and do not necessarily represent those of their affiliated organizations, or those of the publisher, the editors and the reviewers. Any product that may be evaluated in this article or claim that may be made by its manufacturer is not guaranteed or endorsed by the publisher.
Research integrity at Frontiers
Learn more about the work of our research integrity team to safeguard the quality of each article we publish.