- 1Fire Research Laboratory, Department of Mechanical and Industrial Engineering, IIT Roorkee, Roorkee, Uttarakhand, India
- 2Reactor Safety Division, Bhabha Atomic Research Center, Mumbai, India
The initiation of the first crack mainly determines the criteria for glass failure. However, the extended consequences of cracking, with the formation of multiple cracks merging, result in fallout conditions under varying thermal loads that become more critical. Point-supported glass arrangements are globally used in high-rise and energy-efficient buildings for architectural ingenuity aimed at a low budget. However, the formation of cracks due to thermal load resulting in glass breakage could infuriate the overall fire dynamics of the enclosed area. Therefore, experimental study and prediction of glass failure become very crucial. The present experimental study focuses on finding the most critical parameter that may quantify the cause of glass failure and further breakage in fallout conditions under varying thermal loads. 45 experiments were carried out on float glass of 300 × 300 mm2 with 4 mm, 6 mm, 8 mm, 10 mm, and 12 mm with continuous fuel supply arrangements. Critical parameters analysed were the time of crack initiation, glass temperature at the time of cracking, maximum temperature difference at glass failure, and thermal strain caused by the temperature difference on the glass surface. The range of minimum and maximum temperature difference recorded on the glass surface for the present study was between 30–35°C and 55–60°C at the breakage time for all the experiments. The Maximum temperature difference measured was 56.99°C on the 12 mm glass surface, and the corresponding maximum thermal strain found was 482 ×
1 Introduction
Different types of glass show different characteristics and behaviour under varying fire conditions, so it becomes necessary for scientists and researchers to study its features and behaviour under different thermal loadings. The advantage of using glass for various construction is that it reduces the overall weight and cost of buildings, also being attractive, transparent and energy-saving (Axinte, 2011). The disadvantage of the same is that it acts as the most fragile part of the building and increases the probability of fire hazards due to fallout, as the cavity formed due to fallout allows more fresh air for fire to grow (Kang, 2009) and become uncontrolled, resulting in backdraft and flashover conditions. Glass may be edge-protected or fully exposed depending upon its various applications.
Glass may break by various means, including sudden impact and mechanical and thermal loading (solar, fire or intense radiant heat) (Zhao et al., 2022). All the breakage phenomena that occur with a different mechanism and subsequent impact on the surroundings could be analysed accordingly. Above, glass breakage due to thermal loading has the most severe and hazardous effect on humans, buildings, and the environment (Klassen et al., 2006). Various experimental and numerical studies on risk analysis (Ding et al., 2020) and glass breakage due to thermal loading are being carried out to minimise the hazard. Two dominant factors are responsible for glass breakage when it is close to fire: radiative heat transfer from the fire source and combustion gases on the glass (Lowesmith et al., 2007). Second thermal stress distribution, resulting in glass fracture and subsequent fallout (Dembele et al., 2012). Emmons (1986) first outlined the importance of glass breakage analysis in case of fire. Keski-Rahkonen (1988) analysed the glass breakage due to thermal stress induced at its edge close to the fire because the edge is the critical location where maximum temperature difference occurs. His generalised stress equation at the edge is very close to.
where,
E Is young’s modulus of elasticity
Pagni (1989), Joshi and Pagni (1994); Pagni (2003); Pagni and Joshi (2006) formulated a numerical model BREAK1 for glass breakage. They also quantified the failure strength of the glass samples using the two and three-parameter cumulative Weibull function that is later extended to double panes (Cuzzillo and Pagni, 1998). Through 59 experiments (Emmons, 1986), their four-point flexure method concluded that the breakage mechanism in the case of fire largely depends on the temperature difference between the shaded and exposed glass surface. In addition, a breaking stress of 35.8 MPa is considered a relative value in the breaking analysis of ordinary window glass. Hassani et al. (1994) registered breakage strain with the help of a strain gauge positioned in the shaded portion of the glass pane. Corresponding breakage stress can be found with the help of Young's modulus of glass. Chen et al. (2017) carried out experiments on glass breakage having 6 mm thicknesses with varying shaded widths from 10 mm to 50 mm. Various experimental and numerical works in a single (Hassani et al., 1994; Gao et al., 2013; Alvarez et al., 2000; Wong et al., 2014; Shields et al., 2001; Wang et al., 2014a; Choi et al., 2018; Gan, 2001; Chow et al., 2015) and multiple glazing (Klassen et al., 2006; Xamán et al., 2014; Aydin, 2000; Nam et al., 2015; Xamán et al., 2016; Aydın, 2006; Ni et al., 2012; Shields et al., 1997; Chen et al., 2017; Gao et al., 2013; Alvarez et al., 2000; Wong et al., 2014; Shields et al., 2001; Pérez-Grande et al., 2005; Carlos et al., 2011; Weir and Muneer, 1998) systems suggest that double and multiple-glazing glass assemblies offer more resistance in case of fire. Some critical parameters, including glass type (Pagni and Joshi, 2006; Manzello et al., 2007; Wang et al., 2015), the thickness of the glass (Wang et al., 2014b; Xie et al., 2008; Yi et al., 2011), frame protection (Chen et al., 2017; Skelly et al., 1991), edge condition (Dembele et al., 2012; Skelly et al., 1991), and fire position (Wang et al., 2016) that may affect glass breakage and fire severity (Kuznetsov et al., 2022) has been analysed, resulting in the conclusion that the temperature difference between the hottest and coldest regions of the glass is the primary cause of glass breakage and fallout.
Almost all glass breakage studies, experimental and numerical, are limited to different types of glass with protected edges and need to be extended for varying glass thicknesses with varying fire locations without edge protection. Almost all glass breakage studies, experimental and numerical, are limited to different types of glass with protected edges and need to be analysed (Wang et al., 2014b; Skelly et al., 1991; Harada et al., 2000). The effect of different fire positions (Bi et al., 2022) Protection needs to be analysed on varying glass thicknesses without edges to find the maximum temperature difference and actual thermal stress at breakage, which can be used for various design purposes. Therefore, the present experimentation aims to extend and explore the gap in glass breakage analysis of varying thicknesses without frames under different thermal loading. As float glass is widely used for various purposes, it is used in the present study for glass failure analysis.
In most of the literature on glass breakage, thermal stress is taken constantly as an input parameter, and the corresponding temperature difference is calculated (Dembele et al., 2012; Pagni, 2003; Cuzzillo and Pagni, 1998; Shields et al., 2001; Shields et al., 1997; Wang et al., 2017; Skelly et al., 1991; Dembele et al., 2010). Since thermal stress is mainly dependent on temperature gradient as given by Equation 1, rather than taking stress as constant and comparing temperature difference, the reverse approach should be adopted as suggested in conclusion by Wang et al. (2014b). This is the motivation for the present study.
The present study attempted to find the thermal stresses induced by temperature gradient and compared them with various literature. A reasonable agreement was established regarding thermal stress values obtained from multiple works of literature, as referred to in the result section.
In the present study, a set of 45 full-scale experiments on the thermal failure of float glass (without a frame) with five varying thicknesses and nine varying fire source positions was carried out. Glass without a frame is preferred because of the two reasons, first, very few experimental results and the availability of minimal literature till date (Wang et al., 2014b; Skelly et al., 1991; Harada et al., 2000), second, it is believed that the frame offers no restrain to the glass since the maximum expansion <1 mm is less than the average gap of several mm between the frame and the pane (Keski-Rahkonen, 1988).
The present study mainly focused on Glass breakage time, glass surface temperature at the time of breakage, heat flux, crack propagation, crack initiation location, heat release rate, average gas temperature, and glass fallout for further discussion and comparison. It firmly believes that the most appropriate and relevant critical parameter to study and quantify glass breakage is the maximum temperature gradient over the glass surface. The second most important parameter to quantify glass breakage and the fallout is incident heat flux, followed by average temperature distribution over the glass surface. Test data obtained agree reasonably well with various literature compared and, therefore, can be helpful for safety, design, and glass breakage modelling in case of varying thermal load.
2 Experimental setup
2.1 Test facility
As given in Figure 1, the experimental setup mainly consists of heat flux, thermocouple, float glass sample, fire source and six pins to support the glass against the wall. Five different thicknesses of float glass having dimensions 300 × 300 × 4 mm3, 300 × 300 × 6 mm3, 300 × 300 × 8 mm3, 300 × 300 × 10 mm3 and 300 × 300 × 12 mm3 are used for glass breakage analysis under thermal loading. Figure 1D shows that the glass area is divided into four parts to determine the crack initiation position. Heat flux is mounted on the wall parallel to the glass at 50 mm to resister the total heat load upon the glass surface. The flow rate of cooling water circulating inside the heat flux was considered per the recommended range of 25–30 L/h. Figure 1C shows the position of thermocouples on the glass’s front and rear sides. Ten thermocouples are mounted on the glass, five on each face, as indicated in Figure 1C. Thermocouples were fixed on the glass with the help of NP-50 B high-temperature adhesive with a maximum working temperature range of 350°C. Thermocouple bids were protected from high-temperature-resistant sleeves to measure glass temperature accurately. These sleeves protect thermocouple bids from direct exposure to the flame. Three additional thermocouples were mounted on the wall (close to HF and Glass) to register the average air temperature around the glass. The respective positions of the thermocouples were 5 mm, 10 mm, and 25 mm beads pointing outside from the wall. A high-performance DAQ NI PXI-8106 PXI/Compact PCI is used for data acquisition.
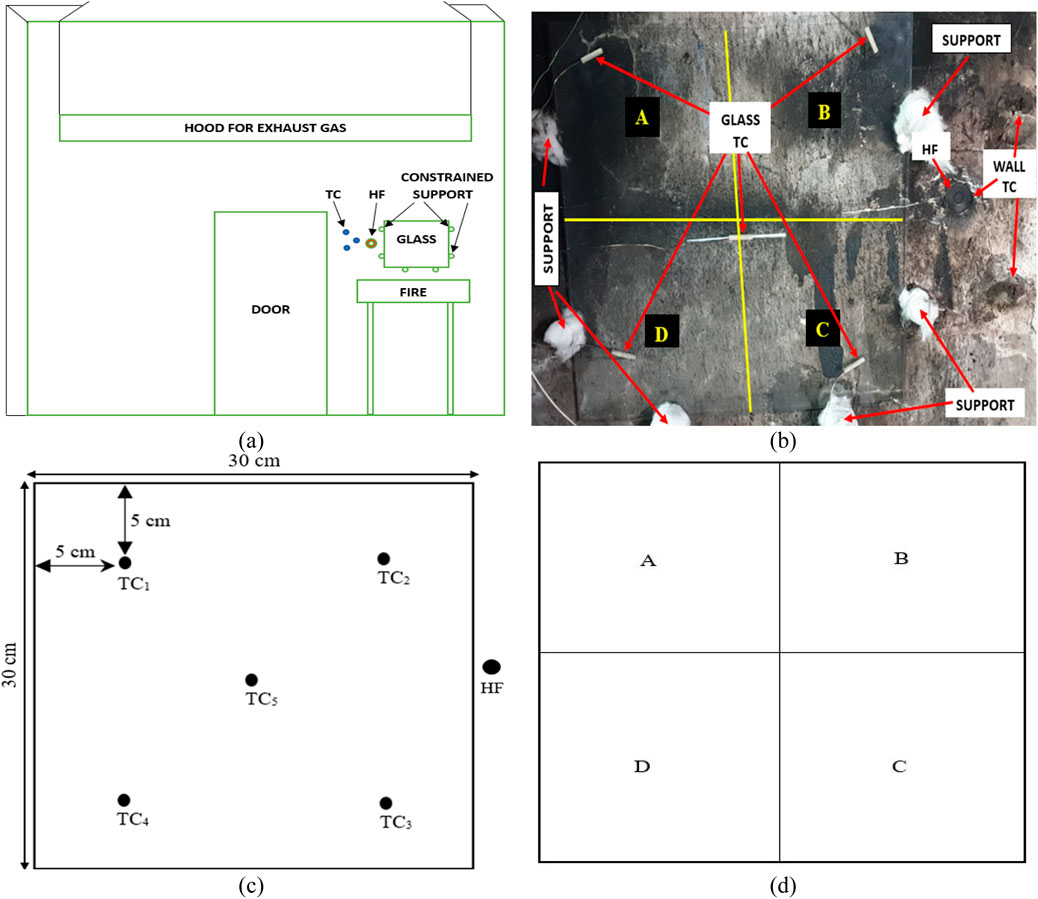
Figure 1. (A) The schematic of the experimental setup. (B) Experimental setup with instrumentation. (C) Sketch of arrangement of thermocouple and heat flux on the glass. (D) Subdivision of glass surface.
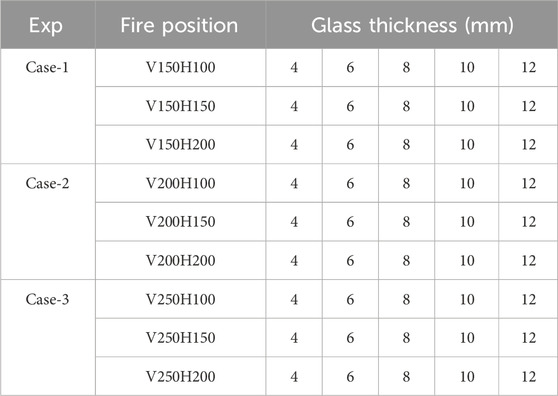
Pins made of mild steel were used to support the glass, which was held on the wall with the help of a six-pin support arrangement. Pins are insulated with ceramic wool to prevent heat transfer from pins to glass. Figure 1A outlines the experimental setup with a continuous fuel supply system to sustain fire without disruption. Diesel is used extensively in India as a burning fuel. An actual experimental test arrangement of constrained glass along with HF and TCs is shown in Figure 1B. Glass was 6-point constrained with insulated pins to prevent heat transfer from pins to the glass. The TCs on the front side of the glass were covered with heat-resistant sleeves to avoid the radiative heat transfer from the fire source, ensuring that the temperature measured from TCs was only conductive heat transfer from glass to TCs. A real fire scenario was developed with the help of a fire source of mild steel with dimensions 1,005 × 150 × 70 mm3, whose fuel level was maintained at 50 mm from the bottom surface with diesel for thermal loading on the glass surface. The fire source’s position varied horizontally and vertically to vary the thermal load on the glass. All 45 experiments are sub-divided into three sets of experimental conditions based on the relative position of the fire source concerning glass, as shown in Table 1. The first experimental condition includes a fire source with a fixed vertical distance of 150 mm from the lower edge of the glass, with three varying horizontal distances of 100 mm, 150 mm and 200 mm away from the glass for all 5 thicknesses. Therefore, the first experimental condition includes 15 experiments followed by three fire source positions (V150H100, V150H150 and V150H200). Similarly, the second experimental condition consists of a fire source with a fixed vertical distance of 200 mm, and the same horizontal distance varied, resulting in another 15 experiments followed by three fire source positions (V200H100, V200H150 and V200H200). Likewise, the third experimental condition includes a fire source with a fixed vertical distance of 250 mm along with three varying horizontal distances of 100 mm, 150 mm and 200 mm adding 15 experiments followed by three fire source positions (V250H100, V250H150 and V250H200). Therefore, the above three conditions (15 experiments in each experimental condition) followed by three different fire source locations resulted in 45 experiments included in this study. The test followed the sequence of first testing on 4 mm float glass, then 6 mm and so on in increasing order of thicknesses. The calorimeter hood with dimensions 3,000 mm × 3,000 mm in plan and 1,000 mm in height is fixed above the experimental setup to collect the exhaust gases from the fire source. In addition, an exhaust duct is set with the hood plenum; the duct has a 200 mm radius and is 6,000 mm long. The sampling probe was fixed at the centre of the duct at 4,000 mm from the hood plenum to collect and measure HRR.
At the end of the duct, an exhaust fan is provided with a maximum extraction rate of 1.9 m3/s (Tiwari et al., 2021). A Nikon D-SLR camera D850 with AF-S NIKKOR lens 200–500 mm f/5.6E ED VR is used for a close and immediate insight into glass breakage time monitoring experiments and capturing its videos and pictures.
2.2 Glass sample
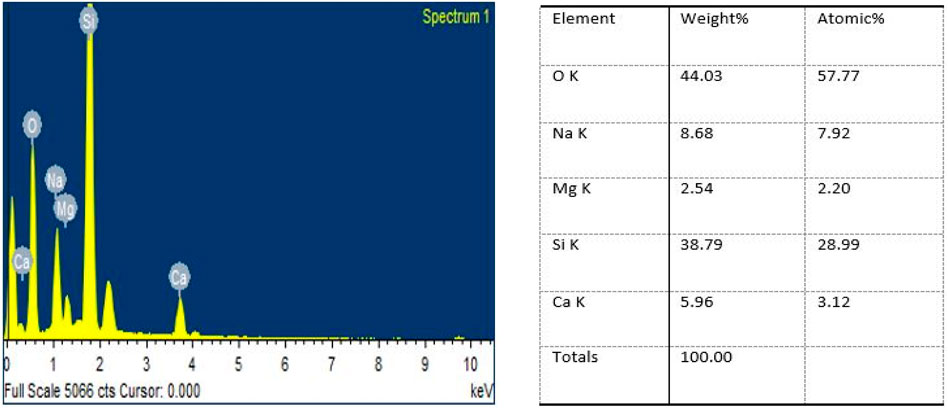
EDX, an energy-dispersive X-ray spectroscopy analysis of a glass sample, was performed at the Institute Instrumentation Centre (IIC) at IIT Roorkee to determine the exact elemental composition. The Carl Zeiss Ultra Plus was used for the analysis with Resolution Up to 0.8 nm and Magnification 12- 100,000X (SE); 100- 100,000X (BSE). Figure 2 gives the detailed elemental composition of the glass sample used.
2.3 Instrumentation and calibration
Glass temperature was measured with the help of a type-K thermocouple having a bead diameter of 1.0 mm with an uncertainty of ±2.0°C. The measuring range of thermocouples used was 0°C–1,200°C. A water-cooled SBG01 heat flux sensor fixed on the wall parallel to the glass with an uncertainty of 6% is used. The measuring heat flux range was between 0–50 kW/m2.
A large-scale cone calorimeter, supplied by the fire testing technology (FTT), UK, was used to measure the HRR based on the oxygen depletion principle having ±14% uncertainty.
2.4 Repeatability
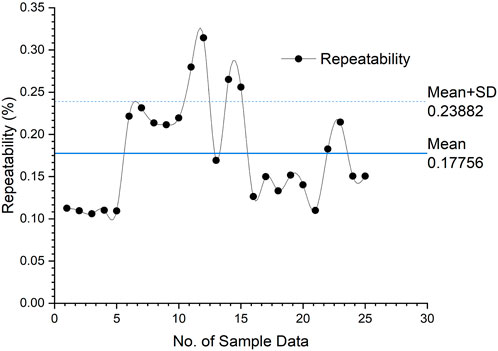
Repeatability refers to the variability caused by any instrument to measure the exact quantity when operated at different times by the same person. The repeatability of any measurements is essential for any engineering and scientific work. The error in the same instrument for the same reading at different times shows repeatability, which determines the trust in the measurement taken on a system. Equations 2–5 show the procedure of estimating the repeatability of the measuring instrument. The readings in each row of Table 2 represent the average data of the instrument reading acquired at different times.
where,
S is the variance.
re is the random error.
t is the Student’s t-test value with 95% confidence level.
n is the number of samples.
Figure 3 shows the repeatability graph for the thermocouple sensors for five consecutive experiments. It is clear from Figure 3, that the variation in repeatability curve of temperature sensors are well lies under ± 5 C.
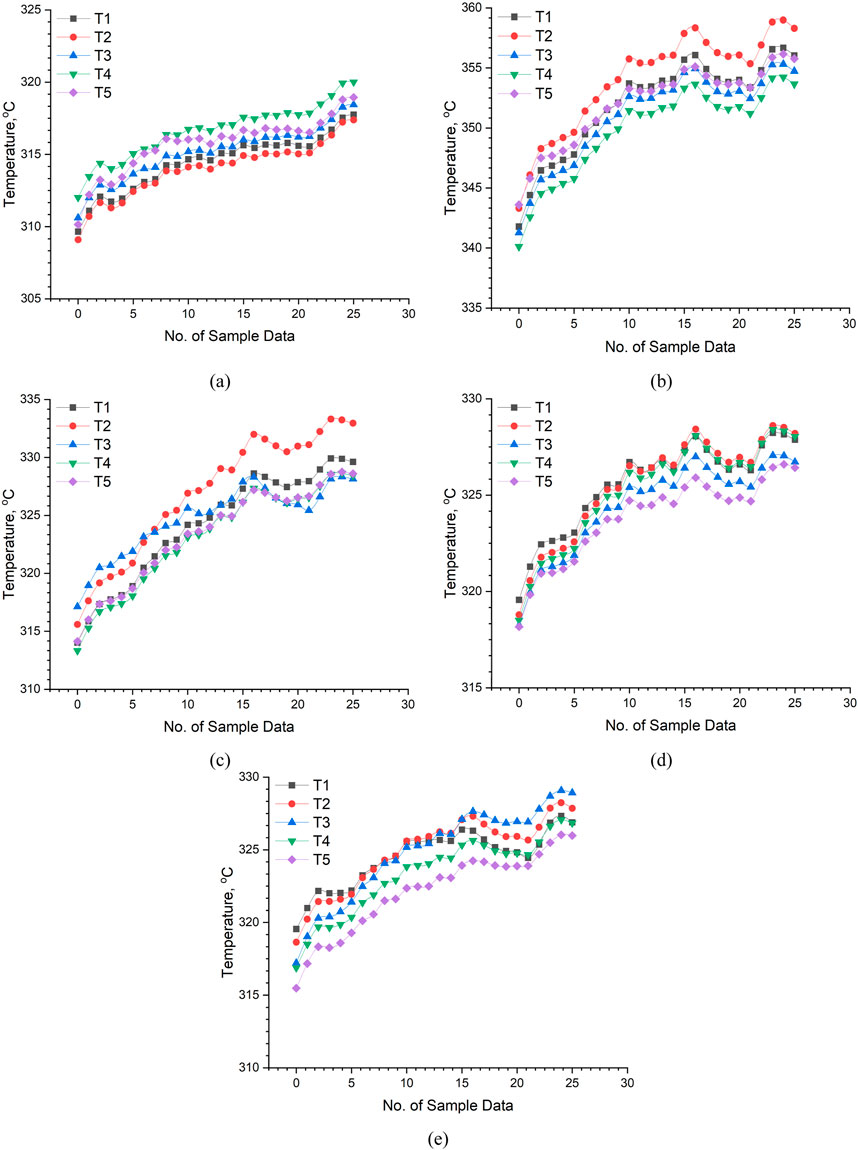
Figure 3. Repeatability of Thermocouples data for (A) 4 mm glass thickness. (B) 6 mm glass thickness. (C) 8 mm glass thickness. (D) 10 mm glass thickness. (E) 12 mm glass thickness.
The maximum random error found for experiment 4 (10 mm glass) is 1.5879%. The minimum random error for the experiment 2 is 0.1105%. The results show that the system’s repeatability is excellent, and the measurements performed on the glass breakage are trustable.
Figure 4 represents the repeatability graph in % for the five experiments. Repeatability was found within ±2%, which is well accepted under ISO 21748:2017(E).
2.5 Systematic uncertainty
The uncertainty in measurements is estimated as per IEC 60193 and 60041. The calculations for strain at the time of glass breakage are performed by measuring the glass surface temperature. As the strain equals beta (
Since
Therefore, the systematic uncertainty in calculating strain is given by uncertainty in measuring strain divided by strain, shown in Equation 3.
where
From Equations 3–7, the systematic uncertainty in calculating strain becomes.
Furthermore, total uncertainty in measuring strain is given by.
where,
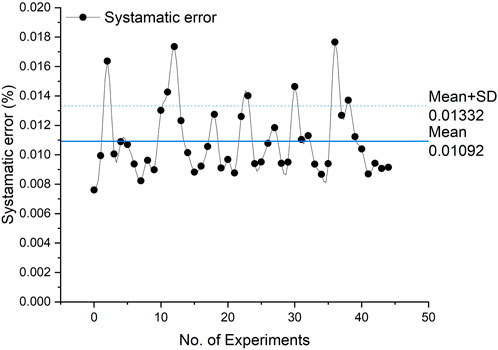
Systematic uncertainty is the range of systematic error or residual error in the measured value by the instrument or measuring system during the experiments. The systematic uncertainty cannot be reduced by increasing the number of measurements. The value of systematic uncertainty depends on the class of instrumentation used and its installation. Systematic uncertainty is invariably associated with the experimental setup, which cannot be removed, unfortunately. Therefore, it becomes a critical parameter in determining the degree of accuracy and predicting the % deviation of our experimental value from the theoretical value if the setup would be ideal. Figure 5 shows the systematic uncertainty,
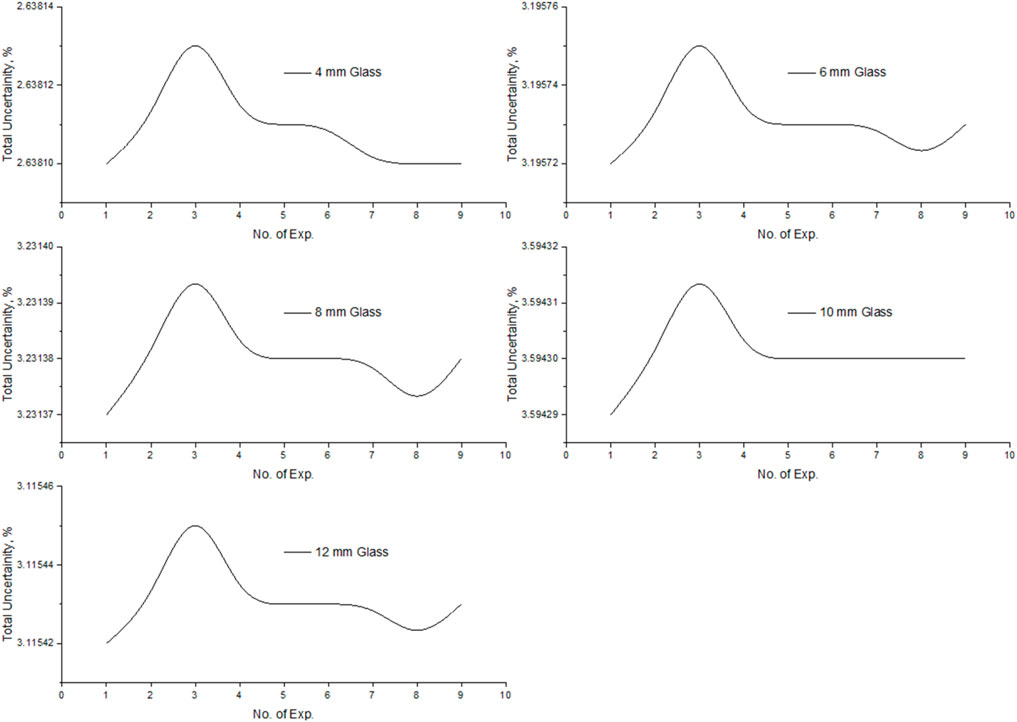
Figure 6 shows the total uncertainty,
2.6 Experimental matrix
The present study consists of 45 experiments, shown in Table 1. The experiments are divided into three SETs based on the position of fire source.
3 Result and discussion
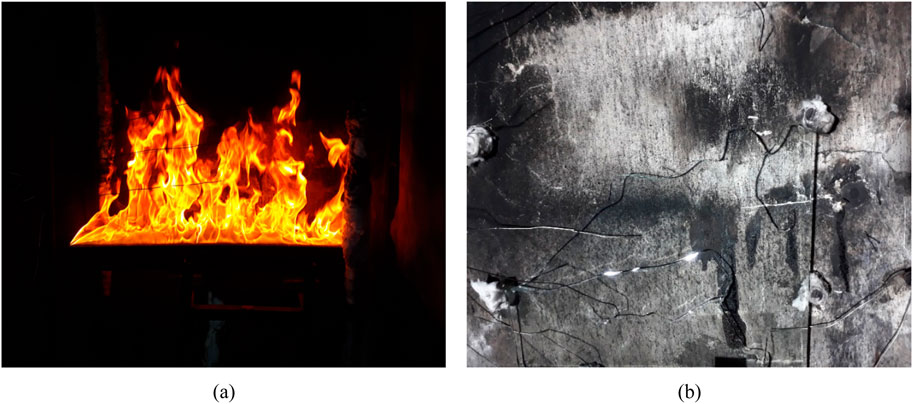
The results obtained from 45 experiments for the float glass of five different thicknesses are summarised with the help of tables and figures. A fuel quantity of 9 L was used with varying fire source positions for different thermal loading. Figure 7A shows a photograph of an ongoing experiment. Figure 7B shows a critical fallout condition of 8 mm float glass at a fire position of vertical distance of 150 mm and horizontal distance of 200 mm. Figure 8A shows the maximum heat release rate (HRR) of 200 kW registered during experiments with the help of a large-scale cone calorimeter supplied by Fire Testing Technology (FTT), United Kingdom.
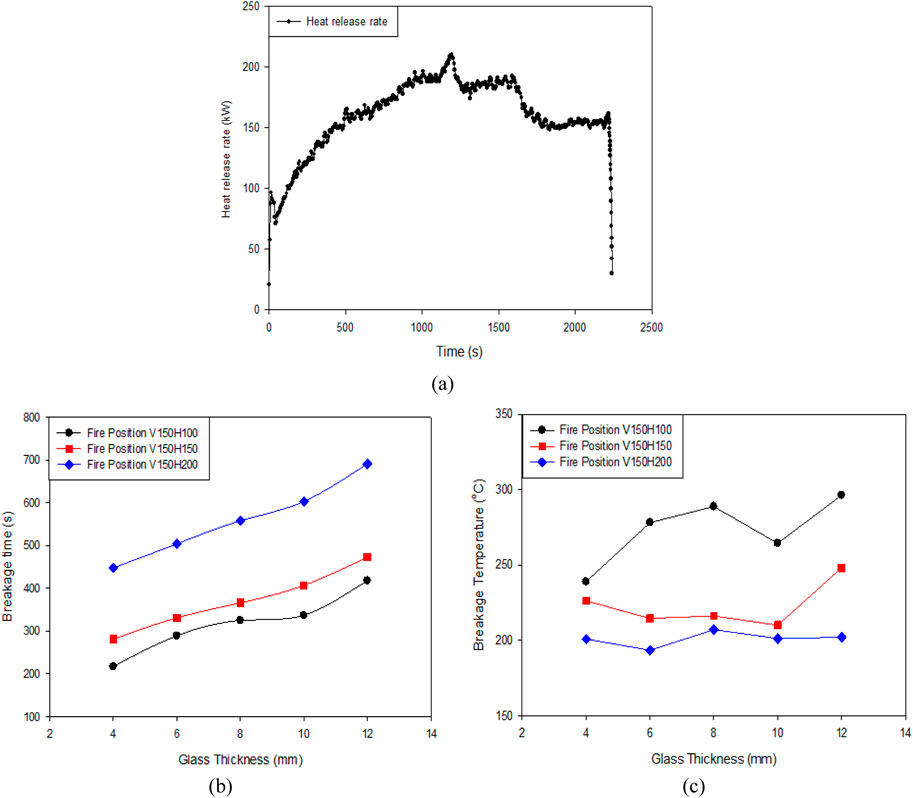
Figure 8. (A) Heat release rate. (B) Breakage time with respect to thickness. (C) Breakage temperature with respect to thickness. TEST SET-1.
3.1 Glass breakage time, temperature and crack position
In the case of fire, the most critical parameter that increases the threat of fallout resulting in sudden fire growth due to excess oxygen entrainment through the vent created by glass fallout is the time of the first crack and its position. The criteria of glass failure are mainly determined by the time of its first crack. Once the first crack grows, it multiplies along with time as the fire grows, resulting in the formation of an Iceland of various cracks and resulting in a fallout condition. For all three experimental conditions, fallout (approximately 50%) occurred for only 8 mm glass, as shown in Figure 7B at a fire position of 150 mm vertical and 200 mm horizontal (V150H200) from glass. The fallout resulted due to multiple crack formations immediately after the first crack. Cracks propagated from sub-divided glass areas C and D, forming a close loop of cracks and merging results in instant fallout shown in Figure 7B. Figures 8B, C show glass breakage time and temperature for the first experimental condition TEST SET‒1 (V150H100, V150H150, V150H200) followed by three fire source positions for all the thicknesses. For the first experimental condition, it is noted that as the glass’s thickness increases, the first crack’s time increases.
For 4 mm float glass time of the first crack was reported at 217, 281 and 448 s at breakage temperatures of 238, 226°C and 200°C, similar to those reported in Mishra et al. (2021), corresponding to the present study with a heat flux value of 19.43, 17.87 and 13.13 kW. It is noted that for 12 mm glass, the time of the first crack was highest at 418, 473, 691 s, and the corresponding temperature at the time of crack was 296, 248°C and 202°C. Moreover, it is found that as heat flux decreases, the time of the first crack increases.
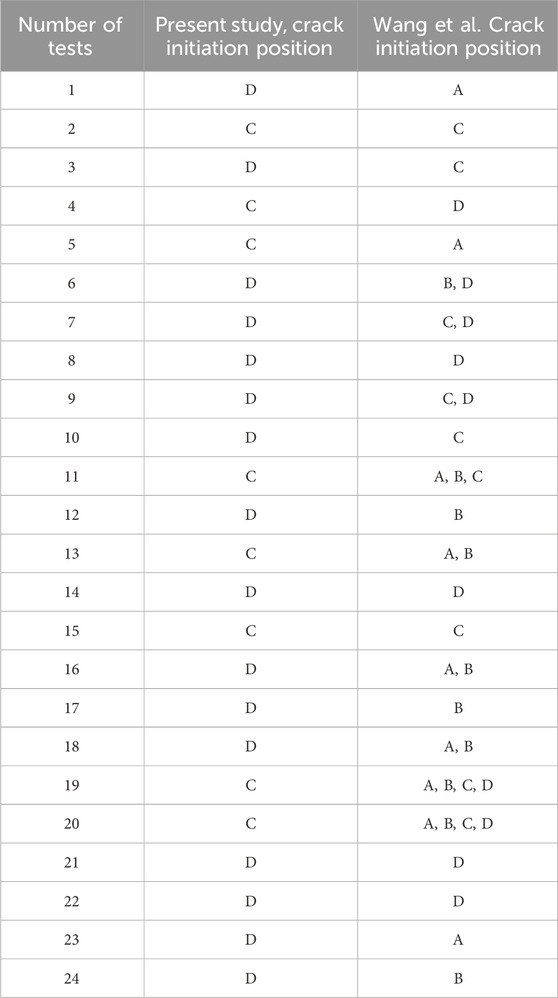
For the second experimental condition, TEST SET‒2 (V200H100, V200H150, V200H200) shown in Figures 9A, B a similar trend of increasing breakage time with increasing thickness followed by decreasing heat flux was registered. However, the breakage temperature range was between 200°C and 300°C, similar to the first experimental conditions. Figures 9C, D represent the third experimental condition TEST SET‒3 (V250H100, V250H150, V250H200), where the highest time of the first crack was noted at 1,355 s, along with a glass breakage temperature of 231°C at a heat flux of 10.33 kW. The air temperature was measured with three thermocouples found in the range of 130°C–190°C, close to Wang et al. (Wang et al., 2014c), in agreement with increasing heat flux which is approximately less than 120°C than the temperature registered on the glass. Therefore, it gives rise to the agreement that at the time of glass breakage mode of thermal energy exchange is radiation dominant Wang et al. (Wang et al., 2014c). Therefore, it can be concluded that the first crack’s time largely depends on the rate of incident heat flux and temperature, as the first crack’s temperature lies in the range of 200°C–300°C for float glass without edge protection. For the entire 45 experiments, most of the cracks were initiated from the lower edge, i.e., subdivided areas C and D of the Glass, similar to Wang et al. (Wang et al., 2014c) as compared in Table 2 Crack is mainly initiated from the subdivided areas C and D because it represents the location of maximum temperature difference. During most of the tests, a single crack formed. Two or multiple cracks occurred for higher heat flux more significant than 13 kW/m2, mainly for the first and second experimental conditions. The second crack initiated from the initial crack at an approximate distance of 50 mm in most of the tests having heat flux more significant than 15 kW/m2. The average time of the first crack for 6 mm, 8 mm and 10 mm glass reported by Li et al. (Li et al., 2012) is 523, 585, and 791 s. The corresponding values obtained in the present study for a glass of the same thickness are 446, 571 and 617 s, respectively. The difference in the values may be due to the difference in experimental conditions of the present study, where glass without a frame is six-point constrained on the wall. Table 3 compares glass breakage temperatures and time with the Present study versus Skelly et al. (Skelly et al., 1991). The time of the first crack for 2.4 mm glass reported by Skelly et al. (Skelly et al., 1991) is 75, 65, 70, 200, 190 and 200 s, along with glass breakage temperatures 184, 215, 195, 218, 186, and 186°C respectively. The value obtained in the present study with 4 mm glass for the time of the first crack is 217, 281, 484, 401, 468, and 487 s with corresponding breakage temperatures 238, 226, 200, 249, 270, and 251°C respectively. In both experimental conditions, the glass used for the test was edge unprotected.
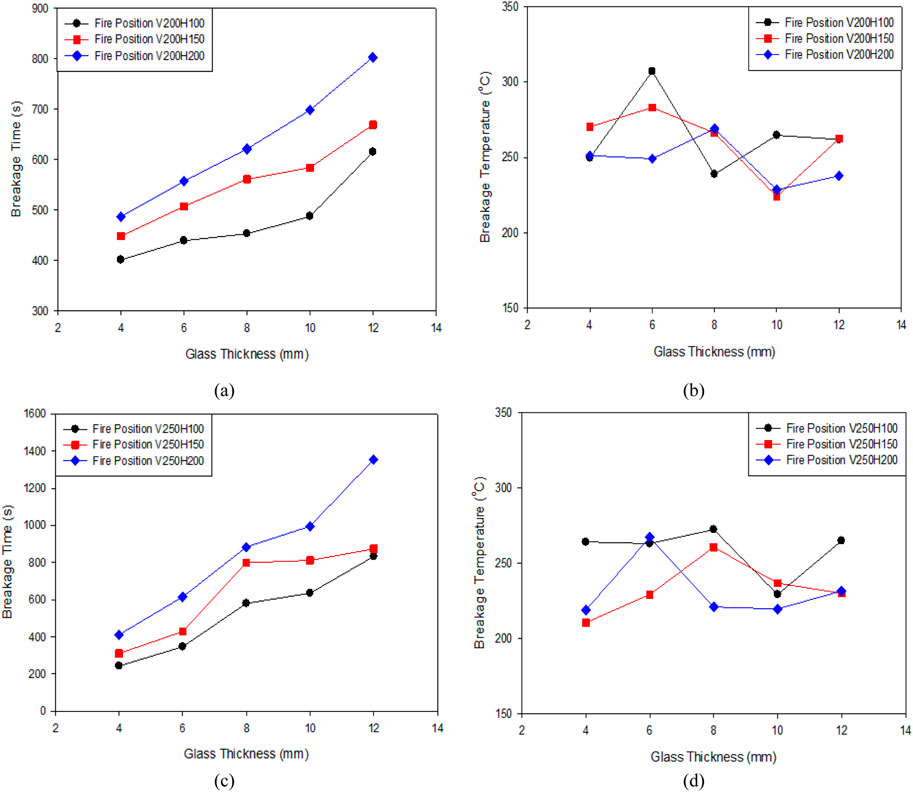
Figure 9. (A) Breakage time with respect to thickness. (B) Breakage temperature with respect to thickness, TEST SET-2. (C) Breakage time verses thickness. (D) Breakage temperature with respect to thickness, TEST SET-3.
The difference in the compared value listed in the above table is due to the difference in experimental conditions as well as the variation in thickness of the test specimen taken into consideration for the present study. Therefore, based on the above compared experimental data, it can be said that thickness plays a significant role in the first crack initiation. The maximum and minimum range of 4 mm glass temperature at the time of cracking for the present study lies in the range of 270 and 200°C, whereas for that of Skelly et al., it is reported to be 218 and 184°C. From the experimental data, for 4 mm and 2.4 mm glass, the maximum temperature at which the first crack occurs has a difference of 52°C.
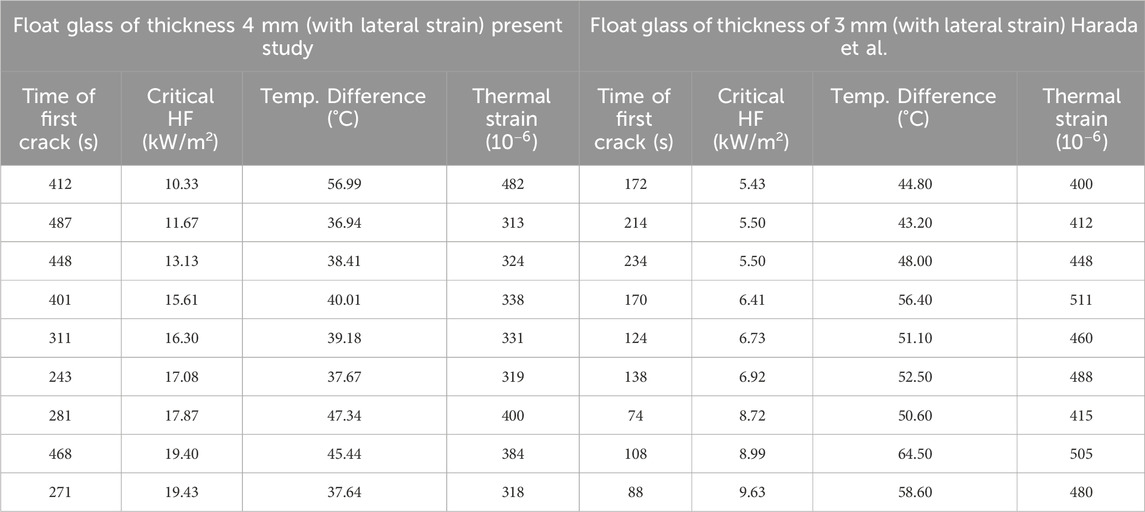
Table 3 gives a similar comparison as Table 3 between the time of the first crack, critical heat flux, temperature difference, and thermal strain with the Present study versus Harada et al. (Harada et al., 2000). The average time of the first crack for 3 mm float glass reported by Harada et al. (Harada et al., 2000) was 166.71 s, along with an average critical heat flux of 7.09 kW/m2, respectively, as listed in Table 4. The corresponding average value obtained in the present study for 4 mm glass is 369.11 s with an average critical heat flux of 15.64 kW/m2, respectively. In both cases, a similar trend is obtained as heat flux increases the time of the first crack decreases. An overall conclusion can be drawn by combining all three experimental findings on float glass of different thicknesses (4 mm, 3 mm and 2.4 mm) with the help of Table 3 and 4 that the time of the first crack largely depends on the incident heat flux or fire size as well as the thickness of glass taken into consideration. More precisely, the time of the first crack is indirectly related to incident heat flux or fire size and directly related to the thickness of the glass sample. More interestingly, it is found that despite different thicknesses, the temperature difference at the time of the first crack is almost the same. Table 4 points out that although the difference in the critical heat flux was nearly double for both studies, the temperature difference obtained at the time of breakage was very close to each other. For the present study, corresponding to the maximum heat flux of 19.43 kW/m2, the temperature difference on the glass surface at the time of the first crack initiation was 56.99°C. In comparison, Harada et al. (Harada et al., 2000) obtained a maximum temperature difference of 56.80°C for a corresponding heat flux of 7.16 kW/m2. The average temperature difference of 52.18°C for 3 mm float glass, whereas a temperature difference of 42.18°C for 4 mm, according to the present study, was found. The approximately 10°C temperature difference value for 4 mm glass is due to the greater volumetric material contained than that of 3 mm glass. The resulting average thermal strain for the 3 mm and 4 mm float glass is found to be 457.66 ×
Figure 10 shows the percentage location of cracks initiated for all 45 experiments. It is found that the maximum crack initiated at sub-division D (lower left) of the glass surface. Approximately 55–60% of cracks initiated from the lower left portion of the glass surface, followed by the 20–25% sub-divided region C (lower right). The minimum number of cracks initiated from the glass surface’s sub-divided region B (upper right).
Wang et al. reported the crack position on the glass surface, which is compared with the present study shown in Table 2. The present study result agrees well with Wang et al. that the maximum number of cracks are initiated from the lower half of the glass surface. This is because the edges of the glass surface contain some unavoidable impurities as well as some infinitely small voids and cracks during its solidification. In addition, the glass’s overall weight acts downward, resulting in a lower edge in a pre-stress zone. Therefore, most cracks start and propagate from the edges, the most critical regions on the glass surface from the failure point of view.
3.2 Maximum temperature difference, thermal strain and heat flux
When glass is subjected to the thermal load, its temperature increases, and so does the temperature gradient, resulting in the coldest and hottest area on the glass surface. This coldest and hottest area gives rise to the maximum temperature difference responsible for thermal strain and subsequent stresses, resulting in a glass failure. Keski-Rahkonen (1988) gives the generalised form of thermal strain, represented in Equation 12.
When E, Young’s modulus multiplied in Equation 2, Equation 1 yields, giving thermal stress. Therefore, measuring the maximum temperature difference on the glass surface is essential and critical for predicting glass failure that results in thermal strain and resulting glass breakage. Since the thermal coefficient of linear expansion,
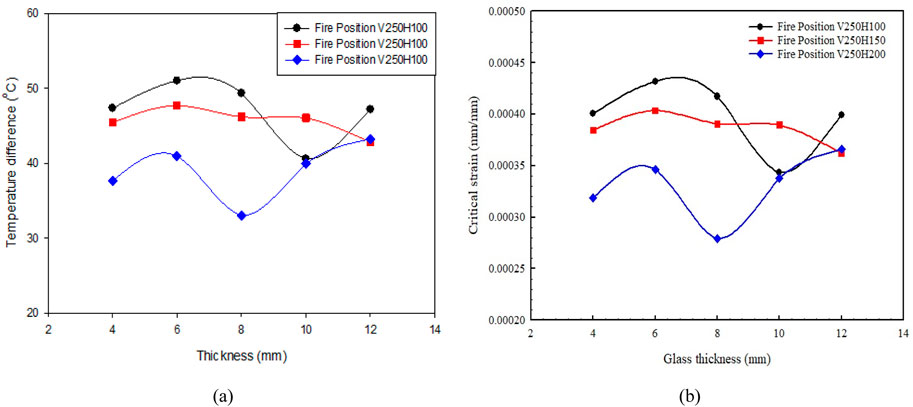
Figure 11 and Figure 12 show the experimental results of the maximum temperature difference measured and the corresponding thermal strain using Equation 2. The experimental results of the maximum temperature difference and thermal strain with respect to time for TEST SET‒1 (V150H100, V150H150 and V150H200) are shown in Figures 11A, B. Temperature difference registered significantly lies in the range of min. 33.89°C to the max. 56.99°C followed by the heat flux value of 13.62 kW/m2 to 23.27 kW/m2 for 15 experiments. The corresponding thermal strain for the first experimental condition lies in the range of min. 286.71 ×
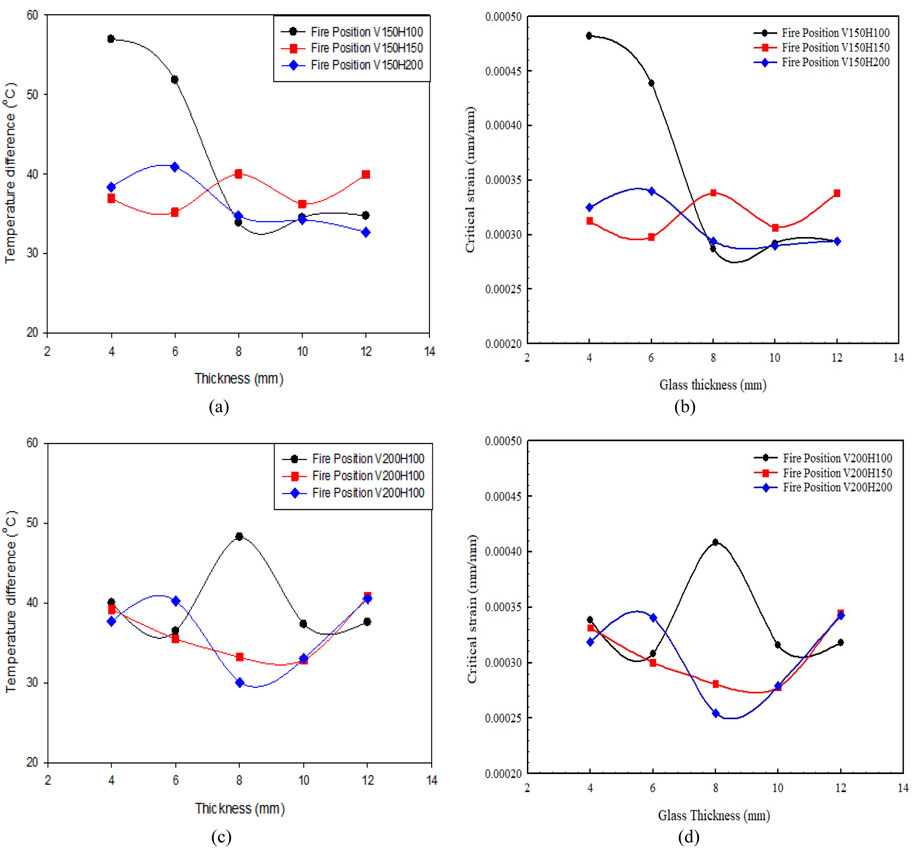
Figure 11. (A) Temperature difference, (B) Thermal strain with respect to thickness for TEST SET‒1. (C) Temperature difference, (D) Thermal strain with respect to thickness for TEST SET‒2.
Based on the temperature difference recorded during all three experimental conditions, it can be concluded that for float glass of thicknesses 4 mm, 6 mm, 8 mm, 10mm, and 12 mm, the maximum temperature gradient lies in the considerable range of 35°C–50°C for almost 90% tests results. Wang et al. (2014b) obtained the range of temperature difference between 49.0°C and 65.8°C, which exceeds by approximately 15°C for the upper and lower temperature difference value in the case of the present study. The lowest and highest temperature difference measured was 30.06°C and 56.99°C, corresponding to glass temperatures of 184.98°C and 257.98°C. The above minimum temperature difference of 30.06°C registered is lower by 8.44°C and the glass temperature of 184.98°C higher by 59.98°C than what obtained by Wang et al. (2014b). Li et al. (2012) obtained a temperature difference of 36.6–68.6°C. The temperature difference obtained in the present study has a lower value deviation of 6.54°C and 18.94°C whereas 11.61°C and 8.81°C in the upper range of the temperature differences claimed by Wang et al. (2014b), Li et al. (2012). The difference in upper and lower values of temperature differences reported by Wang et al. (2014b), Li et al. (2012) is 16.80°C and 32.00°C.
In the present study, this difference in the maximum and minimum value of temperature differences measured on the glass surface was 26.08°C, which lies in between the above-reported literature. With an increase in the thickness of the glass
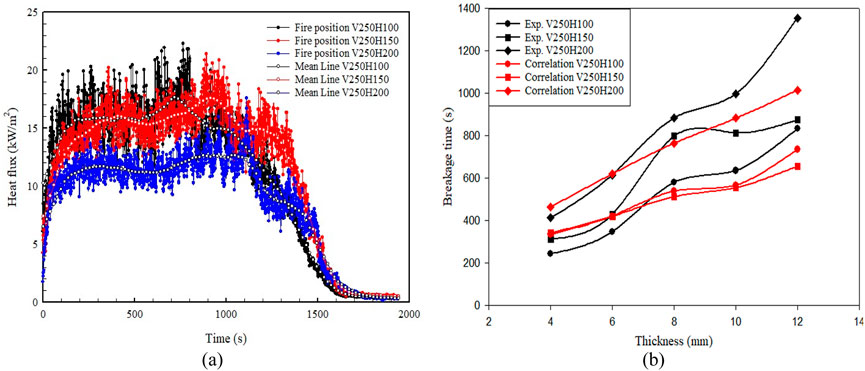
When comparing the correlation to experimental results shown in Table 5, the correlation was found within the max variation of 30% ± 5% of experimental results. In contrast, the lower limit variation ranges from 5% ± 5%. Minimum variation between correlation and experimental value was registered for the max thickness of the glass used for the test, i.e. 12 mm. These correlation holds best and can be used within the range of 15–20% variation on average. This could be pretty satisfactory for glass breakage design under different thermal loading. Figures 13A, C, Figure 14A show the corresponding heat flux at which correlations were developed. Figures 13B, D, Figure 14B show the graphical comparison of experimental data with the correlation for all the thicknesses. It is found that the correlation holds well and follows almost the same trend as the experimental data for individual glass thicknesses. To precisely illustrate the relationship between the various critical parameters, the average value at the breakage time is plotted against glass thicknesses. Figure 15A shows the 39.96°C maximum temperature difference value for 4 mm glass during experiments. The corresponding maximum average strain registered was found to be 338 ×
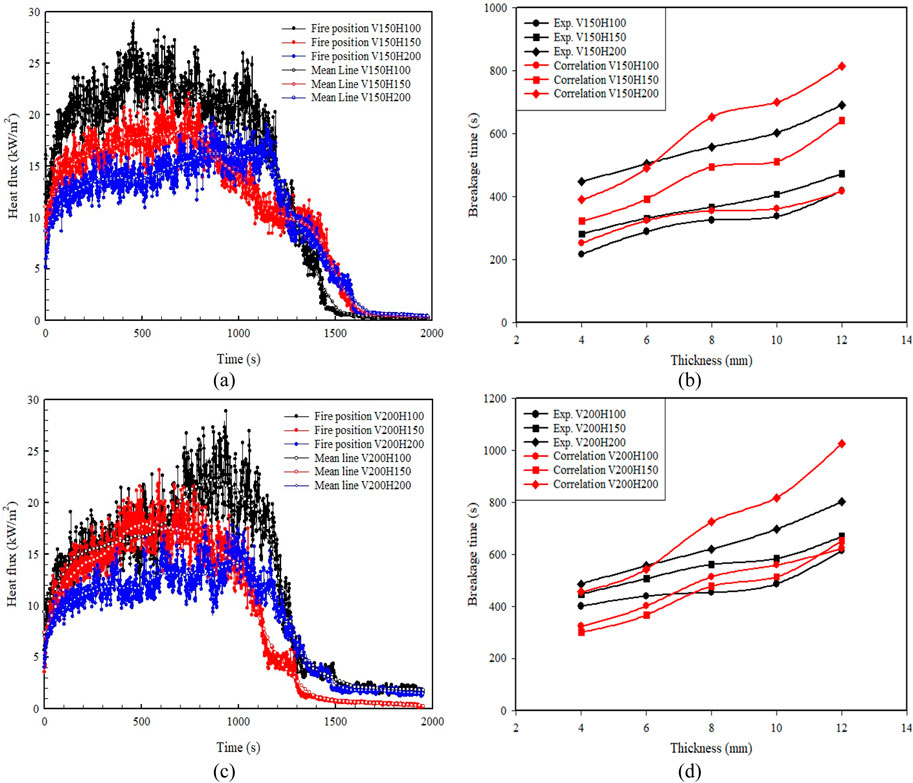
Figure 13. (A) Heat flux, (B) Experiment vs. correlation for TEST SET‒1. (C) Heat flux, (D) Experiment vs. correlation for TEST SET‒2.
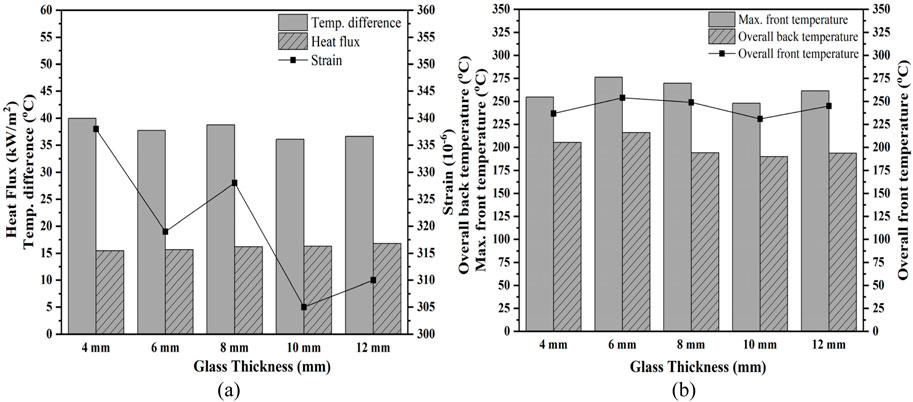
Figure 15. The relationship between (A) the average value of heat flux, temperature difference and strain (B) various glass temperatures at the time of breakage for all the thicknesses.
Figure 16 shows the relationship between incident heat flux, failure temperature and time during glass breakage. Figure 16A For case 1, the maximum heat flux recorded was 23.27 kW/m2, the maximum failure temperature was 296.34°C, and the maximum failure time observed was 691 s, corresponding to 12 mm glass. The relative minimum value was found for heat flux, failure time and failure temperature 13.65 kW/m2, 193.49°C for 6 mm, and 217 s for 4 mm glass. Figure 16B For case 2 shows the maximum heat flux recorded was 17.93 kW/m2, the maximum failure temperature was 307.17 °C for 6 mm glass, and the maximum failure time observed was 803 s, corresponding to 12 mm glass. The relative minimum value was found for heat flux, failure time and failure temperature 11.69 kW/m2, 207°C for 12 mm, and 401 s for 4 mm glass. For case 3, Figure 16C shows the maximum heat flux recorded was 17.36 kW/m2, the maximum failure temperature was found to be 272.19°C for 8 mm glass, and the maximum failure time observed was 1,355 s for 12 mm glass. The corresponding minimum value was found for heat flux, failure time and failure temperature 11.16 kW/m2, 210 °C for 8 mm, and 243 s for 4 mm glass.
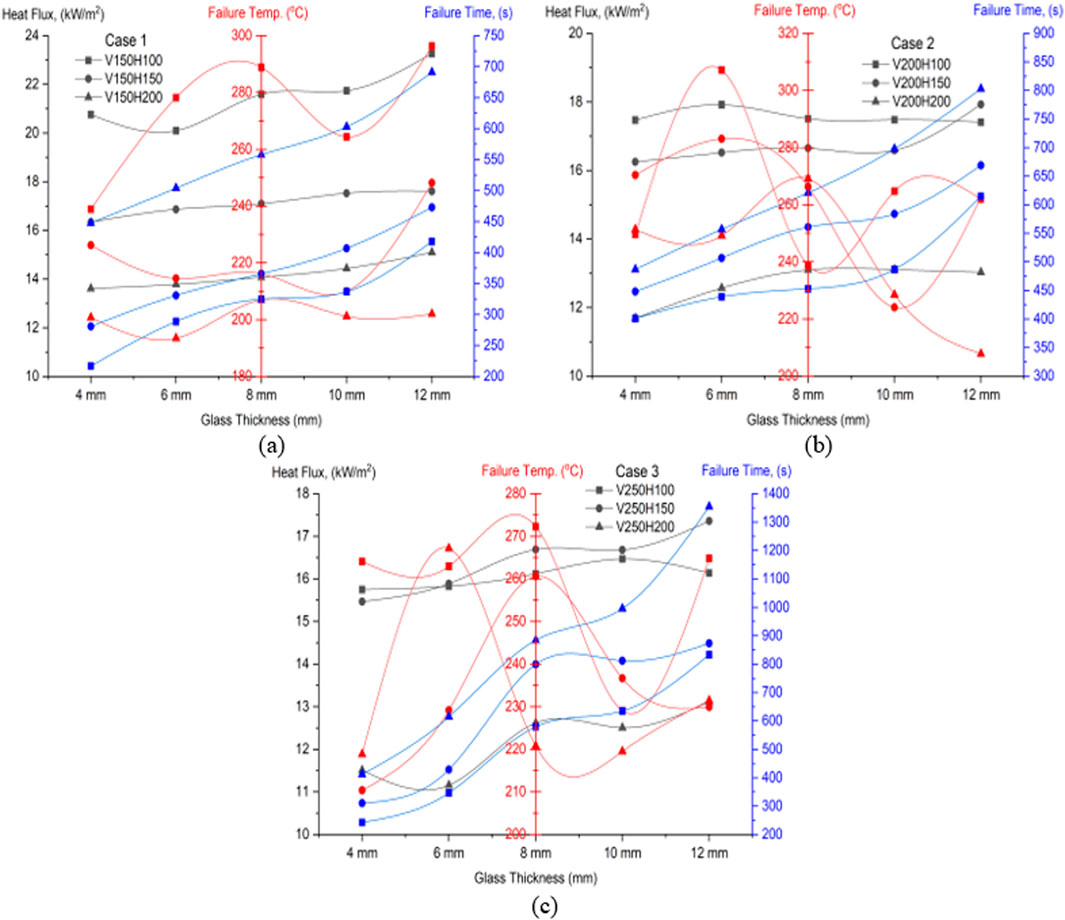
Figure 16. Relationship between heat flux, Failure Temp, and Failure Time (A) case 1 (B) case 2 (C) case 3.
A total of 18 experimental results for the average temperature of the glass surface (front and back), air temperature and average heat flux are shown below. Figures 17A–C shows the average experimental value obtained for TEST SET ‒ 1 for 4 mm and 6 mm glass. The graphs are marked by dashed lines (for 4 mm) and solid lines (for 6 mm) at breakage. For TEST SET ‒ 1 at the time of breakage, at the average air temperature and heat flux value of 140.13°C and 19.41 kW/m2, it was found that the maximum front temperature of 251.21°C for the front side of 6 mm glass. The maximum back temperature of 204.86°C recorded for 4 mm glass. The experimental result of TEST SET ‒ 2 is shown in Figures 18A–C. The maximum values of the front and back sides of the glass surface corresponding to the air temperature and heat flux of 175.27°C and 18.56 kW/m2 were found to be 275.94°C and 252.03°C, respectively.
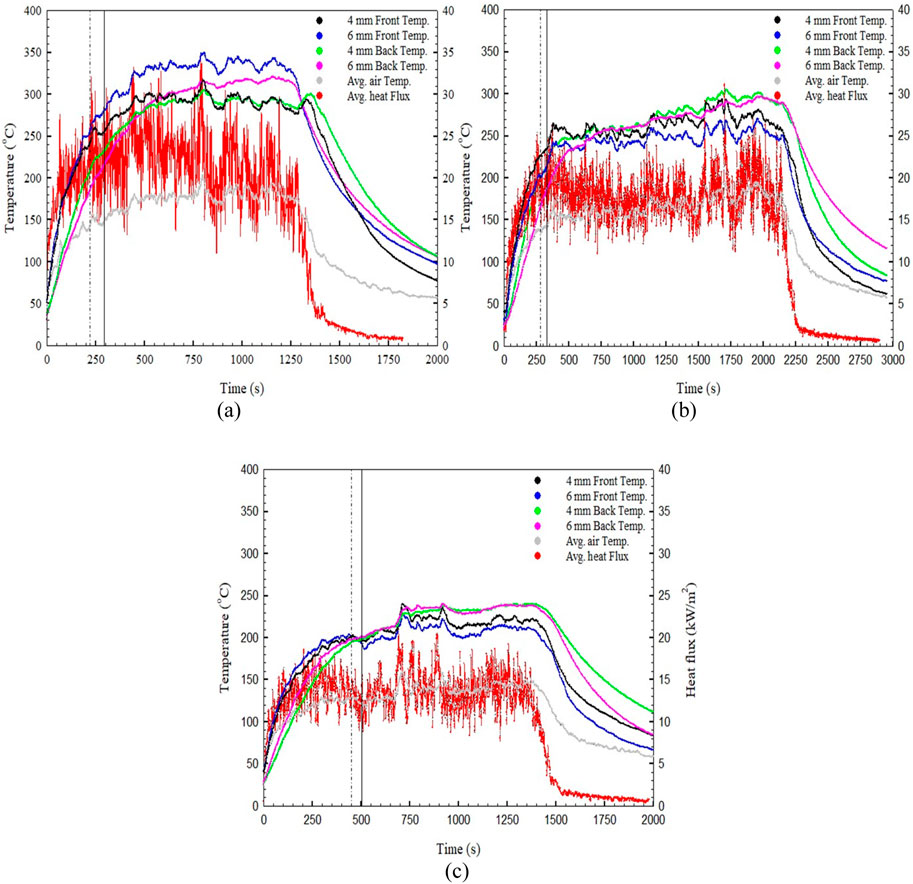
Figure 17. The relationship between average heat flux, air temperature, front and back glass temperature with respect time for (A) TEST SET‒1 (V150H100). (B) TEST SET‒1 (V150H150). (C) TEST SET‒1 (V150H200).
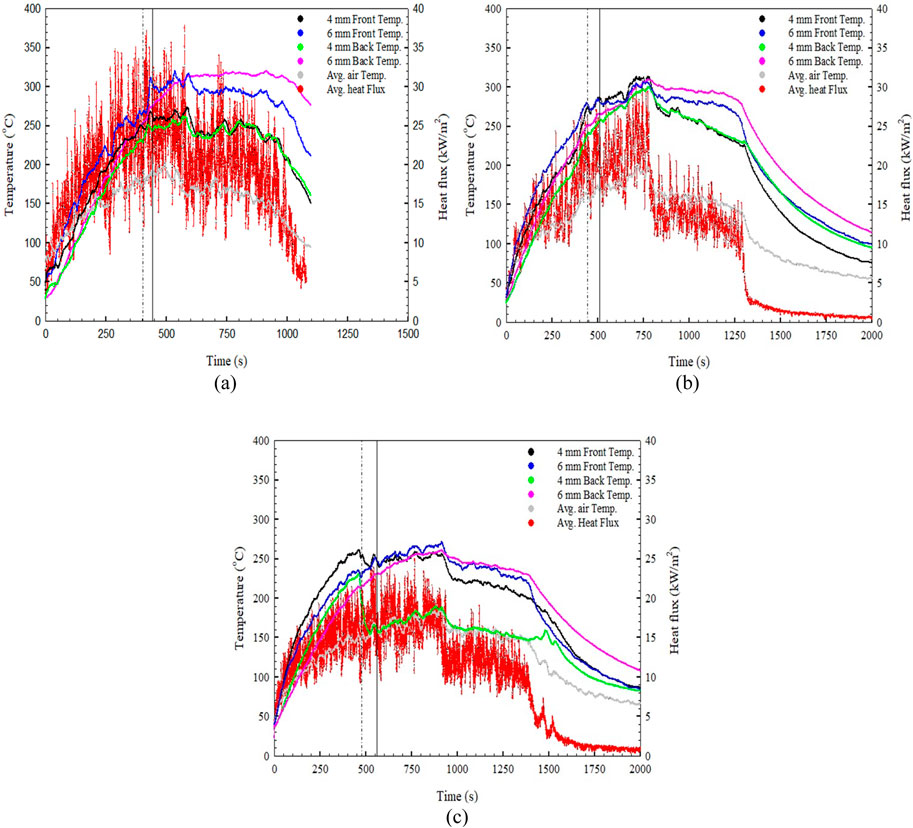
Figure 18. The relationship between average heat flux, air temperature, front and back glass temperature with respect time for (A) TEST SET‒2 (V150H100). (B) TEST SET‒2 (V150H150). (C) TEST SET‒2 (V150H200).
For TEST SET ‒ 3, the experimental results are shown in Figures 19A–C at average air temperature and heat flux values of 164.48°C and 17.08 kW/m2. The maximum front temperature of 264.09°C was registered for 4 mm glass, whereas the maximum back side temperature was 243.22°C for 6 mm glass. The above results can be generalized, and the average range of front and back temperatures of glass surfaces for all the 4 mm and 6 mm glass can be said to lie in the range of 250–275°C and 200–250°C, respectively. It can be noted that increasing the thickness of the glass can delay the breakage time, but as soon as the temperature reaches the range of breakage temperature, the glass will break, irrespective of the thickness. Therefore, it can be understood that while the breakage time for the different thicknesses may vary over a wide range of time, but the breakage temperature remains in the close range of ±25°C for all thicknesses.
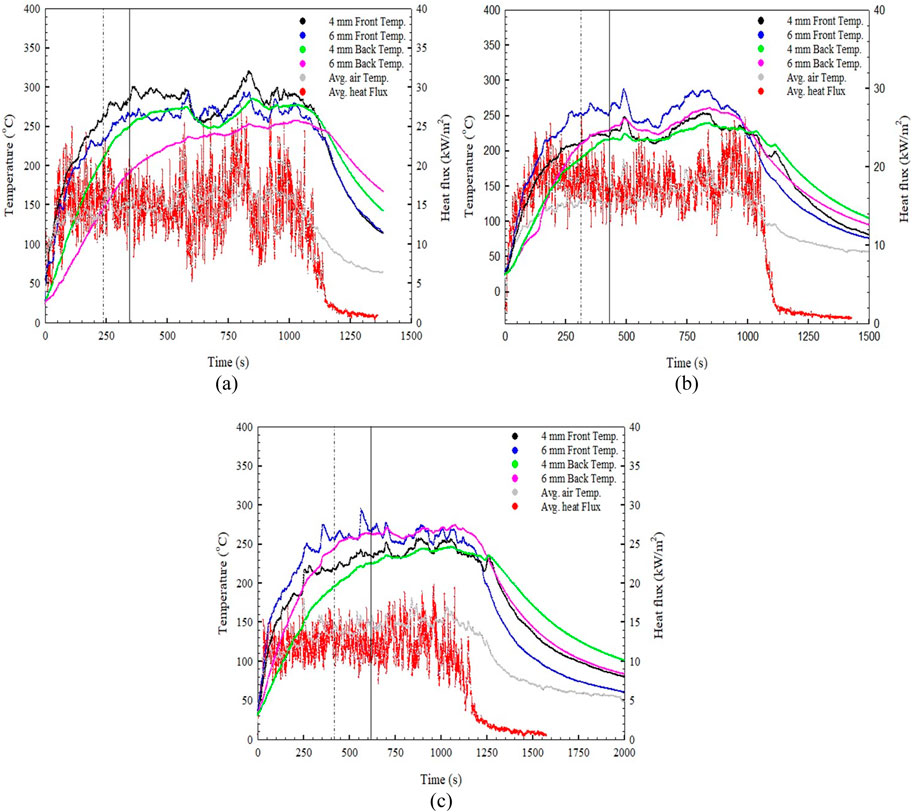
Figure 19. The relationship between average heat flux, air temperature, front and back glass temperature with respect time time for (A) TEST SET‒3 (V150H100). (B) TEST SET‒3 (V150H150). (C) TEST SET‒3 (V150H200).
4 Conclusion
Failure criteria of float glass were analysed with the help of 45 experiments divided into three experimental conditions. Critical parameters such as time of the first crack, glass surface temperature, fallout condition, maximum temperature gradient, maximum thermal stress, Heat release rate, heat flux, average air temperature and average back side temperature at the time of cracking are noticed, analysed and compared for float glass of thickness 4 mm, 6 mm, 8 mm, 10 mm, 12 mm. Thermal stress calculated by maximum temperature difference registered on the glass surface. It is found that a glass surface without a frame poses a significantly less temperature gradient than a glass with a frame. It is noted that glass without a frame shows fewer cracks after the first crack occurs than glass with a frame, where multiple cracks suddenly form after initiating the first crack, forming Iceland and resulting in fallout conditions. This is so because in the case of glass without a frame, glass edges are directly exposed to fire along with the entire glass area, resulting in a lower temperature gradient over the glass surface. However, in the case of glass with a frame, the glass edges are covered with the frame, preventing its direct exposure to the fire, whereas the remaining glass surface is directly exposed to fire, resulting in forming a hot and cold zone. This difference in hot and cold surface results in higher temperature gradients for the entire glass surface.
Some critical conclusions drawn based on the present study are as follows:
(1) For all 45 experiments, the average temperature difference found on the glass surface at the first crack is 37.19°C–42.18°C for all thicknesses. The range of thermal stress values corresponding to the temperature difference lies between 21.49 to 23.94 MPa and agrees well with previous literature considerably.
(2) The conclusion drawn based on 45 experiments can be outlined as the most critical parameter for the first crack and determining glass failure criteria is the temperature difference on the glass surface. A temperature gradient should be preferred to any other parameters as it is directly related to the thermal stress induced and causes failure. The fire size of incident heat flux on glass may be considered the second most critical parameter for glass failure analysis. For the fire safety design and fire hazard analysis caused by glass failure, the combined effect of the temperature difference and heat flux should be carefully analysed and quantified to get the most accurate prediction of glass failure criteria.
(3) The maximum random error associated with experiment 4 (10 mm glass) is 1.5879%, and the minimum random error found for experiment 2 (6 mm glass) is 0.1105%, resulting in a total random error in measurement of around ±1%. The results show that the system’s repeatability is within ±2%, which is well accepted under ISO 21748:2017(E), and the measurements performed on the glass breakage can be trusted sensibly and reasonably. The maximum and minimum values of systematic uncertainty associated with the present experimental setup were 0.017% and 0.007%, resulting within a well-acceptable limit of ±0.01%. The total or overall uncertainty encountered in calculating strain was found to be a maximum of 3.59%, whereas the minimum value of overall uncertainty was 2.63%. The values of uncertainty obtained assure that the critical strain calculated at the time of glass breaking possesses less than ±2% of overall uncertainty.
(4) It is observed from Figures 17–19 (TEST SET‒1, TEST SET‒2, TEST SET‒3) that before the glass breakage, fire-exposed glass surface temperature increases rapidly while the back side glass surface temperature quite slowly. But after breakage, the exposed and the back side of the glass surface temperature becomes almost equal and follows a steady state temperature trend. This thermal behaviour of glass along the thickness is due to the fact that after breakage, the integrity of the glass is unrestrained.
Data availability statement
The original contributions presented in the study are included in the article/supplementary material, further inquiries can be directed to the corresponding author.
Author contributions
RM: Conceptualization, Data curation, Formal Analysis, Funding acquisition, Investigation, Methodology, Project administration, Resources, Software, Supervision, Validation, Visualization, Writing–original draft, Writing–review and editing. PS: Supervision, Writing–review and editing. RK: Supervision, Writing–review and editing.
Funding
The author(s) declare that financial support was received for the research, authorship, and/or publication of this article. Bhabha Atomic Research Centre, Mumbai, India (Grant No. DAE-973-MID, supported for experimentation and instrumentation).
Conflict of interest
The authors declare that the research was conducted in the absence of any commercial or financial relationships that could be construed as a potential conflict of interest.
Publisher’s note
All claims expressed in this article are solely those of the authors and do not necessarily represent those of their affiliated organizations, or those of the publisher, the editors and the reviewers. Any product that may be evaluated in this article, or claim that may be made by its manufacturer, is not guaranteed or endorsed by the publisher.
References
Alvarez, G., Palacios, M. J., and Flores, J. J. (2000). A test method to evaluate the thermal performance of window glazings. Appl. Therm. Eng. 20, 803–812. doi:10.1016/S1359-4311(99)00065-4
Axinte, E. (2011). Glasses as engineering materials: a review. Mater. Des. 32, 1717–1732. doi:10.1016/j.matdes.2010.11.057
Aydin, O. (2000). Determination of optimum air-layer thickness in double-pane windows. Energy Build. 32, 303–308. doi:10.1016/S0378-7788(00)00057-8
Aydın, O. (2006). Conjugate heat transfer analysis of double pane windows. Build. Environ. 41, 109–116. doi:10.1016/j.buildenv.2005.01.011
Bi, Y., Yang, Z., Cong, H., Bi, M., and Gao, W. (2022). Experimental and theoretical investigation on the effect of inclined surface on pool fire behavior. Process Saf. Environ. Prot. 162, 328–336. doi:10.1016/j.psep.2022.03.084
Carlos, J. S., Corvacho, H., Silva, P. D., and Castro-Gomes, J. P. (2011). Modelling and simulation of a ventilated double window. Appl. Therm. Eng. 31, 93–102. doi:10.1016/j.applthermaleng.2010.08.021
Chen, H., Wang, Q., Wang, Y., Zhao, H., Sun, J., and He, L. (2017). Experimental and numerical study of window glass breakage with varying shaded widths under thermal loading. Fire Technol. 53, 43–64. doi:10.1007/s10694-016-0596-0
Choi, Y. K., Kim, J. T., Jeong, M. G., Cho, S. W., and Ryou, H. S. (2018). The influence of fire size on breakage time for double glazed curtain wall system in enclosure fire. J. Mech. Sci. Technol. 32, 977–983. doi:10.1007/s12206-018-0148-7
Chow, N. C. L., Li, S. S., and Huang, D. X. (2015). Apron design for protecting double-skin façade fires. Fire Mater 39, 189–206. doi:10.1002/fam.2238
Cuzzillo, B. R., and Pagni, P. J. (1998). Thermal breakage of double-pane glazing by fire. J. Fire Prot. Eng. 9, 1–11. doi:10.1177/104239159800900101
Dembele, S., Rosario, R. A. F., Wang, Q. S., Warren, P. D., and Wen, J. X. (2010). Thermal and stress analysis of glazing in fires and glass fracture modeling with a probabilistic approach. Numer. Heat. Transf. Part B Fundam. 58, 419–439. doi:10.1080/10407790.2011.540953
Dembele, S., Rosario, R. A. F., and Wen, J. X. (2012). Thermal breakage of window glass in room fires conditions – analysis of some important parameters. Build. Environ. 54, 61–70. doi:10.1016/j.buildenv.2012.01.009
Ding, L., Khan, F., and Ji, J. (2020). Risk-based safety measure allocation to prevent and mitigate storage fire hazards. Process Saf. Environ. Prot. 135, 282–293. doi:10.1016/j.psep.2020.01.008
Emmons, H. W. (1986). The needed fire science. Needed Fire Sci. 1, 33–53. doi:10.3801/iafss.fss.1-33
Gan, G. (2001). Thermal transmittance of multiple glazing: computational fluid dynamics prediction. Appl. Therm. Eng. 21, 1583–1592. doi:10.1016/S1359-4311(01)00016-3
Gao, Y., Chow, W. K., and Wu, M. (2013). Thermal performance of window glass panes in an enclosure fire. Constr. Build. Mater. 47, 530–546. doi:10.1016/j.conbuildmat.2013.05.027
Harada, K., Enomoto, A., Uede, K., and Wakamatsu, T. (2000). An experimental study on glass cracking and fallout by radiant heat exposure. Fire Saf. Sci. 6, 1063–1074. doi:10.3801/IAFSS.FSS.6-1063
Hassani, S. K. S., Shields, J., and Silcock, G. W. (1994). An experimental investigation into the behaviour of glazing in enclosure fire. J. Appl. Fire Sci. 4, 303–323. doi:10.2190/F6VD-TDLW-C6E4-C5H9
Joshi, A. A., and Pagni, P. J. (1994). Fire-induced thermal fields in window glass. I-theory. Fire Saf. J. 22, 25–43. doi:10.1016/0379-7112(94)90050-7
Kang, K. (2009). Assessment of a model development for window glass breakage due to fire exposure in a field model. Fire Saf. J. 44, 415–424. doi:10.1016/j.firesaf.2008.09.002
Keski-Rahkonen, O. (1988). Breaking of window glass close to fire. Fire Mater 12, 61–69. doi:10.1002/fam.810120204
Klassen, M. S., Sutula, J. A., Holton, M. M., Roby, R. J., and Izbicki, T. (2006). Transmission through and breakage of multi-pane glazing due to radiant exposure. Fire Technol. 42, 79–107. doi:10.1007/s10694-006-7254-x
Kuznetsov, G. V., Volkov, R. S., Sviridenko, A. S., and Strizhak, P. A. (2022). Fast detection of compartment fires under different heating conditions of materials. Process Saf. Environ. Prot. 168, 257–274. doi:10.1016/j.psep.2022.09.062
Li, L., Xie, Q., Cheng, X., and Zhang, H. (2012). Cracking behavior of glazings with different thicknesses by radiant exposure. Fire Mater 36, 264–276. doi:10.1002/fam.1108
Lowesmith, B. J., Hankinson, G., Acton, M. R., and Chamberlain, G. (2007). An overview of the nature of hydrocarbon jet fire hazards in the oil and gas industry and a simplified approach to assessing the hazards. Process Saf. Environ. Prot. 85, 207–220. doi:10.1205/psep06038
Manzello, S. L., Gann, R. G., Kukuck, S. R., Prasad, K. R., and Jones, W. W. (2007). An experimental determination of a real fire performance of a non-load bearing glass wall assembly. Fire Technol. 43, 77–89. doi:10.1007/s10694-006-0001-5
Mishra, R. K., Dasgotra, A., Tiwari, M. K., Gupta, A., Kumar, R., and Sharma, P. K. (2021). Experimental and numerical study of temperature distribution on float glass along the wall. Sustain. Energy Technol. Assessments, 447–453. doi:10.1007/978-981-15-7831-1_41
Nam, J., Ryou, H.-S., Kim, D.-J., Kim, S.-W., Nam, J.-S., and Cho, S. (2015). Experimental and numerical studies on the failure of curtain wall double glazed for radiation effect. Fire Sci. Eng. 29, 40–44. doi:10.7731/KIFSE.2015.29.6.040
Ni, Z., Lu, S., and Peng, L. (2012). Experimental study on fire performance of double-skin glass facades. J. Fire Sci. 30, 457–472. doi:10.1177/0734904112447179
Pagni, P. (1989). Fire physics - promises, problems, and progress. Fire Saf. Sci. 2, 49–66. doi:10.3801/IAFSS.FSS.2-49
Pagni, P. J. (2003). 2002 howard W. Emmons invited plenary lecture - thermal glass breakage. Fire Saf. Sci. 7, 3–22. doi:10.3801/IAFSS.FSS.7-3
Pagni, P. J., and Joshi, A. A. (2006). Glass breaking in fires, fire saf. Sci. Proc. Third Int. Symp., 791–802. doi:10.4324/9780203973493
Pérez-Grande, I., Meseguer, J., and Alonso, G. (2005). Influence of glass properties on the performance of double-glazed facades. Appl. Therm. Eng. 25, 3163–3175. doi:10.1016/j.applthermaleng.2005.04.004
Shields, T. J., Silcock, G. W. H., and Flood, M. F. (2001). Performance of a single glazing assembly exposed to enclosure corner fires of increasing severity. Fire Mater 25, 123–152. doi:10.1002/fam.764
Shields, T. J., Silcock, G. W. H., and Hassani, S. K. S. (1997). The behavior of double glazing in an enclosure fire. J. Appl. Fire Sci. 7, 267–286. doi:10.2190/5X8G-JGNX-3QCE-YFLU
Skelly, M. J., Roby, R. J., and Beyler, C. L. (1991). An experimental investigation of glass breakage in compartment fires. J. Fire Prot. Eng. 3, 25–34. doi:10.1177/104239159100300103
Tiwari, M. K., Gupta, A., Kumar, R., and Sharma, P. K. (2021). Experimental investigation on diesel fire toxicity in a compartment under different pool locations. Fire Technol. 57, 2205–2233. doi:10.1007/s10694-021-01110-4
Wang, Y., Li, K., Su, Y., Lu, W., Wang, Q., Sun, J., et al. (2017). Determination of critical breakage conditions for double glazing in fire. Appl. Therm. Eng. 111, 20–29. doi:10.1016/j.applthermaleng.2016.09.079
Wang, Y., Wang, Q., Shao, G., Chen, H., Su, Y., Sun, J., et al. (2014c). Fracture behavior of a four-point fixed glass curtain wall under fire conditions. Fire Saf. J. 67, 24–34. doi:10.1016/j.firesaf.2014.05.002
Wang, Y., Wang, Q., Shao, G., Chen, H., Sun, J., He, L., et al. (2014b). Experimental study on critical breaking stress of float glass under elevated temperature. Mater. Des. 60, 41–49. doi:10.1016/j.matdes.2014.03.038
Wang, Y., Wang, Q., Su, Y., Sun, J., He, L., and Liew, K. M. (2015). Fracture behavior of framing coated glass curtain walls under fire conditions. Fire Saf. J. 75, 45–58. doi:10.1016/j.firesaf.2015.05.002
Wang, Y., Wang, Q., Sun, J., He, L., and Liew, K. M. (2016). Influence of fire location on the thermal performance of glass façades. Appl. Therm. Eng. 106, 438–442. doi:10.1016/j.applthermaleng.2016.06.057
Wang, Y., Wu, Y., Wang, Q., Liew, K. M., Chen, H., Sun, J., et al. (2014a). Numerical study on fire response of glass facades in different installation forms. Constr. Build. Mater. 61, 172–180. doi:10.1016/j.conbuildmat.2014.03.012
Weir, G., and Muneer, T. (1998). Energy and environmental impact analysis of double-glazed windows. Energy Convers. Manag. 39, 243–256. doi:10.1016/s0196-8904(96)00191-4
Wong, D., Li, K., and Spearpoint, M. (2014). A probabilistic model for the fallout area of single glazing under radiant heat exposure. Fire Saf. Sci. 11, 444–457. doi:10.3801/IAFSS.FSS.11-444
Xamán, J., Jiménez-Xamán, C., Álvarez, G., Zavala-Guillén, I., Hernández-Pérez, I., and Aguilar, J. O. (2016). Thermal performance of a double pane window with a solar control coating for warm climate of Mexico. Appl. Therm. Eng. 106, 257–265. doi:10.1016/j.applthermaleng.2016.06.011
Xamán, J., Pérez-Nucamendi, C., Arce, J., Hinojosa, J., Álvarez, G., and Zavala-Guillén, I. (2014). Thermal analysis for a double pane window with a solar control film for using in cold and warm climates. Energy Build. 76, 429–439. doi:10.1016/j.enbuild.2014.03.015
Xie, Q., Zhang, H., Wan, Y., Zhang, Q., and Cheng, X. (2008). Full-scale experimental study on crack and fallout of toughened glass with different thicknesses. Fire Mater 32, 293–306. doi:10.1002/fam.968
Yi, Z., Qing-song, W., Xiao-bin, Z., Xin-jie, H., and Jin-hua, S. (2011). Experimental study on crack of float glass with different thicknesses exposed to radiant heating. Procedia Eng. 11, 710–718. doi:10.1016/j.proeng.2011.04.717
Keywords: float glass, heat release rate, heat flux, critical thermal stress, temperature gradient, fallout float glass, fallout
Citation: Mishra RK, Sharma PK and Kumar R (2024) Experimental analysis of glass failure criteria under different thermal conditions. Front. Therm. Eng. 4:1488206. doi: 10.3389/fther.2024.1488206
Received: 29 August 2024; Accepted: 22 October 2024;
Published: 06 November 2024.
Edited by:
Ankit Sharma, Johns Hopkins University, United StatesReviewed by:
Mukesh Tomar, Jacobs, United KingdomMahesh Kumar Tiwari, Muscat College, Oman
Deepak Sahu, Dr. B. R. Ambedkar National Institute of Technology Jalandhar, India
Copyright © 2024 Mishra, Sharma and Kumar. This is an open-access article distributed under the terms of the Creative Commons Attribution License (CC BY). The use, distribution or reproduction in other forums is permitted, provided the original author(s) and the copyright owner(s) are credited and that the original publication in this journal is cited, in accordance with accepted academic practice. No use, distribution or reproduction is permitted which does not comply with these terms.
*Correspondence: Raj Kumar Mishra, cm1pc2hyYTJAbWUuaWl0ci5hYy5pbg==
 Raj Kumar Mishra
 Pawan Kumar Sharma2