 Pedro Pontes1
 Guido Marseglia
 Ana S. Moita
- 1IN+—Center for Innovation, Technology and Policy Research, Department of Mechanical Engineering, Instituto Superior Técnico, Universidade de Lisboa, Lisboa, Portugal
- 2Department of Engineering for Innovation, University of Salento, Lecce, Italy
- 3CINAMIL—Military Academy Research Center, Department of Exact Sciences and Engineering, Portuguese Military Academy, Amadora, Portugal
The development of new and more effective cooling technologies is required for several high thermal power dissipation applications such as in electronics cooling or high concentrated photovoltaic panels. The present paper addresses an experimental study on the development of a microchannel based heat sink to cool photovoltaic panels. Experiments focus on the test of a microchannel, with geometry and dimensions optimized from previous work. The analysis performed here emphasizes the experimental characterization of flow boiling in the microchannel under different working conditions. The results include pressure drop and heat flux maps, obtained combining pressure sensors with high-speed imaging and time resolved thermography. The analysis performed was able to identify where nucleation sites were formed. Slug flow interfacial heat transfer could be observed and accurately described in the heat flux maps. Overall, results show the high potential of combining high-speed imaging with time resolved infrared thermography to characterize complex flows. These results also show that there is a good potential for this microchannel based flow cooling in removing the required heat fluxes for the application considered here, when compared to other liquid and air-cooling technologies.
1 Introduction
There has been a wide interest in designing better and more efficient cooling devices, which is an essential need for many high-power dissipation technologies, such as in electronics cooling. In the field of photovoltaics, to take advantage of the radiation that reaches the surface, a new technology started to emerge: High Concentration Photovoltaics (HCPV). These panels offer higher efficiency, when compared to standard photovoltaic panels, as they concentrate solar radiation in a smaller area. Concentration of irradiation improves the efficiency of the panels, but also leads to larger heat fluxes to dissipate, which promote a dangerous increase in the temperature of the PV cells and to an overall temperature increase of the electronic components which require an efficient cooling.
The use of a cooling technology on solar panels has been a focus of study since the early 2000’s. Regarding active cooling, Krauter (2004) studied a water film flowing on the surface of the cell, aiming to not only cool down the surface as well as removing dust present. Krauter reports an increase of 9% in the overall efficiency of the cell. Colt (2016) studied a similar solution, but instead of using water flowing on the surface of the cell, used water flowing on the back of the cell. His results showed an increased cell efficiency of 57%. Other studies were conducted using air instead of water, although better results were obtained with water flowing on the back of the panel (Sharaf et al., 2022). Different reviews and research works can be found on cooling techniques applied specifically to thermal management of concentrator photovoltaics. Conclusion on this subject show that passive cooling is not sufficient for the cooling requirements and in the most demanding working conditions, single-phase flows may still not be enough. Indeed, several authors stand for the use of microchannel liquid-based heat sinks as a solution, as they depict low thermal resistances in comparison with other cooling strategies (Royne et al., 2005). Furthermore, several studies report significant improvement in the heat transfer coefficients (e.g., Gilmore et al., 2018). Always with the aim of extracting as much heat as possible, authors now focus on microchannel cooling enhancement with most studies converging to the usage of two-phase flow and alternative geometries. Tuckerman and Pease (1981) were pioneers in the study of micro liquid-cooling heat exchangers, showing the possibility of high heat transfer rates while using more compact structures (Kandlikar, 2012). In their work, Tuckerman and Pease (1981) prove that the expected heat transfer limit of only 20 W/cm2 could be dramatically increased, showing results with heat transfer rates of 790 W/cm2 saying that it could reach up to 1000 W/cm2 by using micro liquid-cooling heat exchanger with optimal geometry. Wambsganss et al. (1991) introduced the study of two-phase flow to microchannels since by this time, the research on two-phase flow was still focused on larger channels. Valeh-e Sheyda et al. (2013) performed a comparative study for single and two-phase flows in heat sinks to cool PV cells, the latter specifically addressing the slug flow regime. These authors report a much higher cell performance for two-phase flows, associated with higher rates of heat transfer which could be removed under such flow conditions. The potential of two-phase flows lies in the additional latent heat removed during evaporation. However, highly unstable flow conditions and pressure losses are inevitable in flow boiling. So, to understand the boiling phenomena inside the microchannels, visualization techniques may provide advantages and improve the analysis to further understand the observed phenomena, thus aiding to solve the problem of the flow instabilities. Mohammadi and Sharp (2013) presented a review on the different techniques used for bubble dynamics analysis in microchannels, including high-speed photography, fluorescent microscopy, and magnetic resonance with high-speed imaging, being high-speed visualization the most used technique. As for the characterization of the heat transfer mechanisms, Liu and Pan (2016) explored the use of infrared thermography and showed that this technique can definitely be a useful tool towards the quantification of temperature distribution in the two-phase region. Most of the studies reported in the literature on microchannel flow boiling are analyzed, based on high-speed visualization and only a few would complement these results with infrared techniques.
Two-phase flows combined with surface modification are also known to enhance heat transfer. Different studies on application of surface modification (topography, fins, cavities and fins, among others) showed great potential of this strategy to improve pool boiling heat transfer (e.g., Kim, 2015; Moita et al., 2015; Pontes et al., 2020). This strategy is much more difficult to implement in microchannel flows, but there are already a few studies on this topic. Hence, Tullius et al. (2011) reported a review of microchannel cooling with emphasis on different surface modification strategies for both single and two-phase flows, concluding that these surface modifications contribute to an improved cooling performance. However, the physical mechanisms behind this performance enhancement are not yet well described, particularly when understanding its possible effect in the instabilities. For that purpose, it is also relevant to get a more detailed insight into the actual mechanisms triggering and governing the various flow boiling regimes. In this context, the present paper addresses the experimental study towards the development of a microchannel based heat sink to cool HCPV panels, in the context of a wider project addressing the development for commercialization in particularly harsh environments of PV panels cooling with microchannels based heat sinks. Experiments focus on the test of a microchannel, with geometry and dimensions optimized from previous work (e.g., Marseglia et al., , b). Then, the influence of surface cavities in improving heat transfer in microchannels with two-phase and flow stability, by controlling where nucleation sites appear is also investigated, using a transparent single channel configuration. A smooth surface is compared against a surface with two cavities, under different working conditions. The observed phenomena are characterized by combining high-speed imaging with infrared thermography with high temporal resolution. This work introduces new insights and detailed analysis of the bubble boiling and slug regimes, with detailed images of the flow which are clearly connected to the detailed information given by high-speed thermography. Original analysis is also given with respect to the use of modified surfaces.
2 Experimental methodology
2.1 Experimental arrangement
The experimental arrangement is schematically shown in Figure 1. The microchannel is put on top of an AISI304 stainless-steel sheet and pressure sealed by an acrylic plate. To simulate the heat to be dissipated from the solar cells, the stainless-steel sheet is connected to electric contacts on both ends of the sheet, which in turn are connected to an AX-3010DS Axiomet digital power supply. This procedure allows providing an imposed and well controlled heat flux by Joule effect. A type K thermocouple with an accuracy of ±0.5°C is assembled between the stainless-steel foil and the microchannel/heat sink, to register the temperature of the foil. The working fluid (3M NOVEC HFE7100) is first degassed in a degasification station, where the fluid is heated up to its boiling point inside a syringe with a heating pad. This heating pad has a temperature control device which is set at the saturation temperature of the working fluid, at ambient pressure. After degasification and cooling, the fluid goes into the syringe that is placed on the syringe pump (Harvard Apparatus Model 22). This pump allows the control of the volumetric flow entering the channel/heat sink. The fluid then passes through a thermal bath of oil, to be heated before entering the channel/heat sink, to a temperature close to the saturation temperature of the working fluid (at ambient pressure). After leaving the thermal bath, the fluid enters the test section and returns to a reservoir, also at atmospheric pressure.
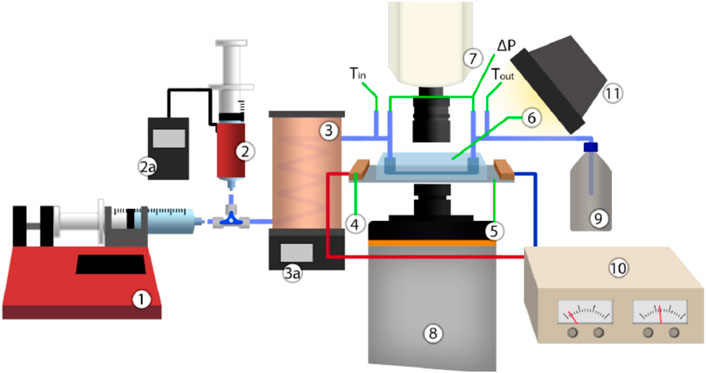
Figure 1. Schematic representation of the experimental setup: 1) Syringe Pump; 2) Heated syringe for Degasification with Temperature Controller (2a.); 3) Thermal Bath with Temperature Controller (3a.); 4) Electric contacts; 5) Stainless steel foil (20 μm thick); 6) PDMS microchannel; 7) High-speed camera; 8) Thermographic camera; 9) Output HFE-7100 Container; 10) DC Power Supply; 11) Light Source.
A high-speed camera (Phantom V4.2, Vision Research) placed directly above the channel takes images from the two-phase flow, at 2200 fps, with an image resolution of 250 × 250 pixels. Also, an Onca MWIR-InSb-320 high-speed infrared (IR) thermographic camera records the evolution of the temperature distribution of the stainless-steel sheet at 1000 fps. Two additional type K thermocouples located at the entrance and exit of the microchannel/microchannel based heat sink, register the fluid temperature. The signals read by the thermocouples are sent to a DT9828 data acquisition device. The pressure drop between the entrance and exit of the microchannel/heat sink is also measured, using an Omega PX409- 001DWUV differential pressure sensor connected to another DT9828 data acquisition device. For the optical configuration used here, a resolution of 125 μm/pixel was obtained for the cameras.
2.2 Fabrication and geometric characteristics of the microchannels and of the heat sinks
The microchannels were produced in PDMS—Polydimethylsiloxane (Sylgard 184), a self-healing and transparent material, very easy to mold. The production process of the microchannels followed the procedure described in Marseglia et al. 2024a; Marseglia et al., 2024b. Molds are fabricated by addictive manufacturing from polylactic acid (PLA), using an Ultimaker 3 3D printer. Afterwards, a mixture of the PDMS with the curing agent with a ratio of 10:1 is poured on the mold and left to dry for 48 h. When dry, it can be removed from the mold carefully. In terms of dimensions, the single microchannel has a hydraulic diameter of 1 mm2.
Finally, the cavities on the stainless-steel foil were produced by laser etching, following the procedure detailed in Teodori et al. (2017). The cavities have a diameter of 100 μm. The distance between cavities is 200 μm.
2.3 Working conditions
The working fluid chosen for this work was 3M NOVEC HFE-7100. The main thermophysical properties of this fluid are summarized in Table 1.
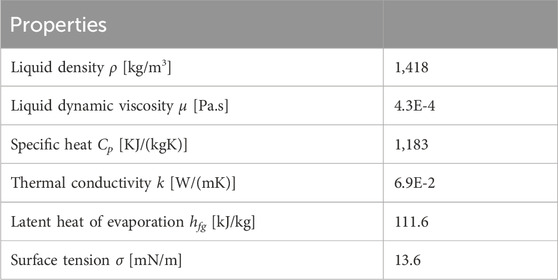
Table 1. Properties of HFE7100 at atmospheric pressure and 61°C (Engineered fluid hfe-7100 physical properties, 2, 2002).
The experiments were performed to better understand the basic physics governing the observed phenomena. For these experiments, the inlet temperature range was set to be 45°C–55°C maximum. For temperature values higher than this range, fluid evaporation is already very intense, and the fluid is closer to a slug flow regime. Below this temperature range, boiling is very difficult to achieve in the microchannels. For working conditions like those reported in Marseglia et al. 2024a; Marseglia et al., 2024b, three different heat fluxes were imposed, which lead to different values of the stainless-steel foil. The minimum foil temperature should be close to 61°C to allow bubble formation. This was achieved for an imposed heat of 1346 W/m2. The maximum temperature of the sheet was set to 80°C (to protect the acrylic), corresponding to an imposed heat flux of 1637 W/m2.
The volumetric flow rate was defined to 1.114 mL/min and 1.119 mL/min corresponding to Reynolds number values of 70 and 120, respectively associated with one channel. All flow rates correspond to a laminar flow regime.
Data given in the plots results from 6 repetitions for each test condition. Averaged values are taken with error bars associated to the standard deviation of the results. Larger deviations were observed for the pressure drop measurements.
2.4 Data processing
The high-speed videos were converted into image batches and processed using a MATLAB routine. The videos from the infrared thermographic camera IR camera were extracted with raw data from the software, and a custom-made calibration was applied to transform the data into °C. Regarding the calibration method (for IR images), a custom-made cavity-based blackbody radiator was custom made and used for the calibration. For each imposed temperature at the cavity and after achieving a stable condition for which the temperature is homogeneous in the cavity, the measured temperatures were converted into radiated energy performing an energy balance and plotted against the received intensity signal in ADU’s (Analogic to Digital Units). Then a polynomial curve is fitted to these data. This calibration was performed considering a pixel-by-pixel approach. More details can be found for instance in Teodori et al. (2018). Then images are post-treated, namely, using a NUC2 (Non-Uniform Correction) methodology, following that proposed in Perry and Dereniak (1993). Detailed description of the entire procedures is given in Mendes (2021). A schematic summarizing the data processing steps for the thermal images is given in Figure 2. Depending on the phenomena seen in each test, another filter should be applied when calculating the heat flux. This filter works as a background remover. An averaging value of each frame is taken from a given time sample (background) and the heat flux is calculated by subtracting the background from the heat flux already calculated and adding the heat flux provided to the stainless-steel sheet. Finally, the surface local heat flux (q”) was calculated using an energy balance on the stainless-steel foil surface, given as (Kenning and Yan, 1996), Eq. 1:
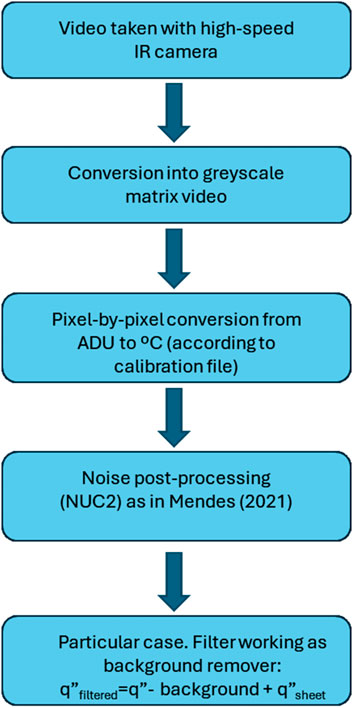
Figure 2. Schematic summarizing data processing for the IR images.
Where q” is the imposed heat flux from the heater, while ts kh, ρh, Cph and δh are the conductivity, density, specific heat and thickness of the heated surface. It is worth mentioning that for the thickness of the stainless-steel foil considered here and following previous work including our own and that from Kenning and Yan (1996) and from Sielaff (2014), the thermal information taken from the back side of the stainless-steel surface can be extrapolated to the heat transfer occurring in the liquid flow. The heat imposed at the foil solely results from Joule effect (from the current fed to the foil) and simulates the entire heat transfer that comes to the PV cell to be cooled, which includes the radiation contributions. The energy balance performed here is mainly addressed to the conductive and convective heat that is taken from the surface.
2.5 Uncertainty analysis
Uncertainties were mostly associated with the errors from the equipment, as summarized in Table 2.
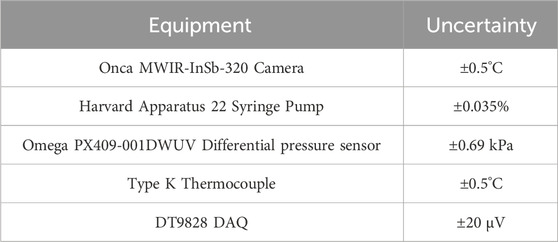
Table 2. Uncertainties associated to the errors of the most relevant equipment used in the experiments.
The heat losses were taken into account by measuring the surface temperature and addressing an equivalent resistance model considering a 6 mm acrylic plate underneath the sheet with a conductivity of 0.17 W/(m.K) and natural convection to air at 21°C. More details can be found in Marseglia et al. (2023). In terms of uncertainties and error propagation, the main uncertainty besides those reported in Table 2 is within the heat flux. Following the analysis performed as in Taylor and Kuyat (1994), the maximum uncertainty in the heat flux is ±12%.
3 Results and discussion
The first parameter relevant to observe is the pressure drop, which can be quite relevant in flow boiling, due to clogging issues, which may significantly increase the required pumping power. Hence, pressure drop is depicted in Figures 3A, B) for a smooth surface and for a surface with cavities, respectively. There are noticeable error bars associated with the higher heat flux, thus showing the high variability between measurements. This behavior is due to frequent clogging of the channel with vapor slugs, back flow and unpredictable activation and deactivation of nucleation sites. In this context, the effect of the cavities is not very significant, although, as shown in the following results, the method used in this study is able to completely detect and characterize quite well bubble dynamics and heat transfer at the nucleation sites. Hence, results suggest a positive effect of the use of cavities, but possibly with adjusted dimensions and between them, to prevent clogging.
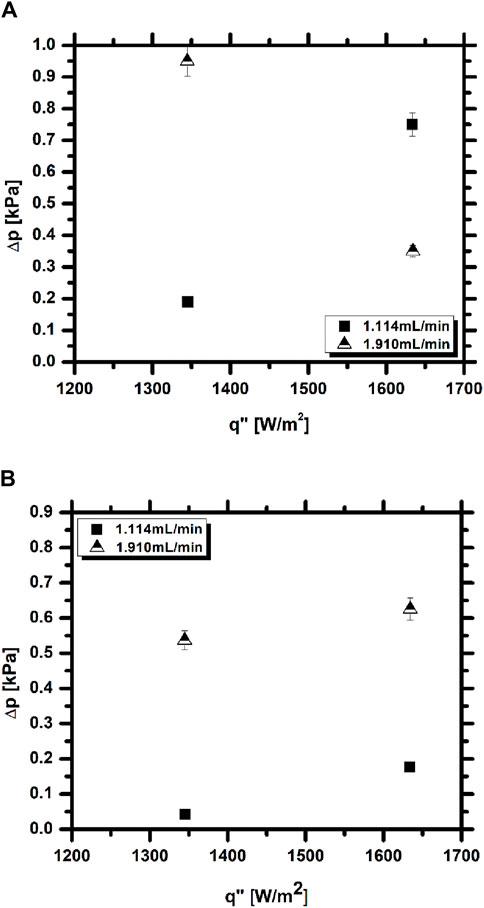
Figure 3. Pressure drop between the inlet and outlet: (A) Sheet with no cavities, (B) Sheet with two cavities.
The combined analysis of the high-speed images with the thermal images further provides relevant insight into the nucleation processes in the channel and to the effect of the microcavities.
On a first analysis, the nucleation sites were examined and compared on the 2-cavity foil. The resulting high-speed image and corresponding temperature map, together with the surface heat flux map are depicted in Figure 4. Although the cavities are inside the channel, they were not immediately activated as heat flux is imposed. Instead, it is possible to see 3 different nucleation sites in the figure. While in the high-speed image this is less visible and can only be seen by detecting the origin of smaller vapor bubbles, looking at both the thermal and heat flux images these sites are much more visible. In the thermal image, the nucleation sites have a lower temperature of approximately 1.5°C around them and in the heat flux map, it is possible to see a higher heat flux of around 4000 W/m2 in the sites. The example presented here shows increased heat flux transferred in the region where evaporation occurs thus decreasing the local surface temperature. Although the objective of adding cavities was to create possible nucleation sites, these were not activated, and usually activated sites were on the contact line between the PDMS and stainless-steel. This is likely due to the insulation provided by the PDMS which increases temperature in the heated surface near the wall.
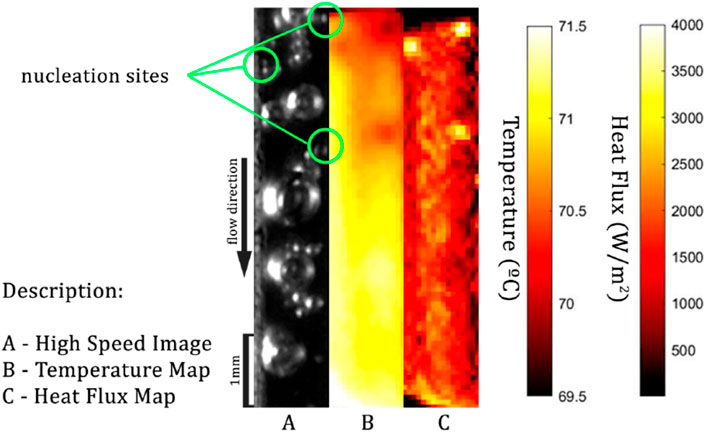
Figure 4. Images captured with the high-speed camera and respective temperature and heat flux obtained with the images taken with the thermographic camera showing active nucleation sites. (Stainless-steel sheet with 2 cavities; Heat flux: 1637 W/m2; Volumetric flow rate: 1.910 mL/min).
Even though the placement of nucleation sites changed during the tests, it was possible to observe interfacial heat transfer phenomena during vapor slug development, as shown for instance in Figure 5.
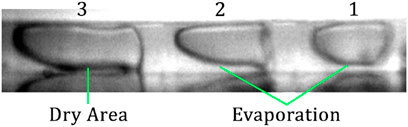
Figure 5. Example of a slug flow development.
In Figure 4, a bubble that traverses the channel grows through surface evaporation into a slug. Initially, when its size is smaller, it is possible to observe an area of increased heat flux below the bubble. It is worth mentioning that liquid phase-change occurs on a thin liquid layer below the bubble, which then elongates, and so does the high heat flux patch. In the final frame (t = 41 ms), it is possible to see the effect of a dry area, as the slug grows, and the vapor is in direct contact with the heated surface. In this area the vapor is insulating the surface from the convection heat transfer. Around the slug, one can observe a higher heat flux of around 3500 W/m2. Here, near the 3-phase contact line, evaporation keeps occurring while in the back of the slug the rewetting phenomenon can also be seen. This can be better observed when looking at Figure 6. In this figure, depicting a view from the side, using high-speed imaging, one can clearly see the bubble evolving to a slug. In the earlier stages, a thin liquid film is visible in between the vapor mass and the heated surfaces, while in later stages the slug comes into full contact with the surface.
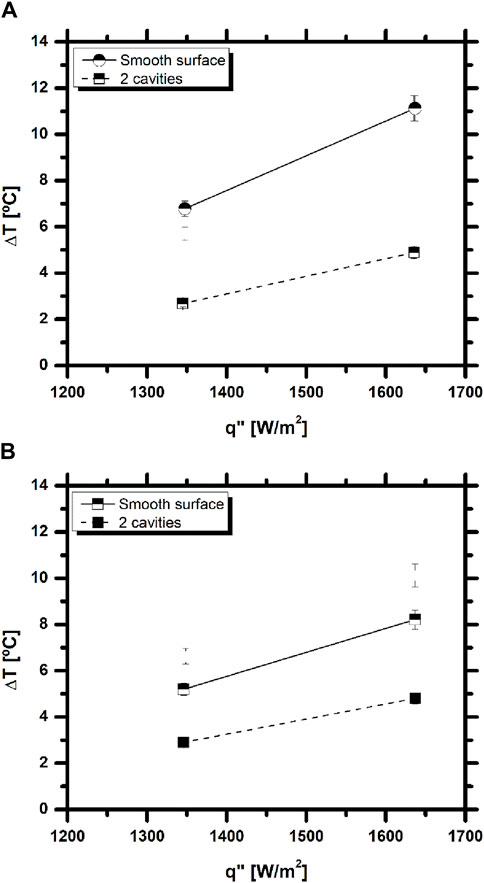
Figure 6. Average temperature difference between the inlet and outlet of the microchannel as a function of the imposed heat flux: (A) Sheet with no cavities; (B) Sheet with 2 cavities.
Figure 6 depicts the obtained averaging temperature difference between the inlet and the outlet of the channel.
For all the working conditions analyzed here, the temperature difference is higher for lower flow rates. The lower volumetric flow rate means that the fluid flows slower inside the microchannel, which enables more heat transfer and therefore, increased cooling of the stainless-steel sheet. From the analysis of the data collected, it can be concluded that the inlet temperature has larger variation for the highest heat flux tested. In fact, when comparing the difficulty of achieving stable conditions inside the microchannel, for each of the heat fluxes imposed, the highest value tested was much more difficult to maintain. Moreover, for the stainless-steel sheet with no surface modification, the inlet temperature for the higher heat flux tested is close to the minimum acceptable, which is because during these experiments, the ambient temperature was not being controlled. Since the ambient temperature was much higher than intended, the heat losses to the surroundings were smaller, so the temperature of the working fluid did not vary as much as expected between the outlet of the thermal bath and the inlet of the channel. Hence, the temperature of the thermal bath had to be adjusted to counteract the effects of the ambient temperature which affected the inlet temperature of the fluid, since the control of the thermal bath has an accuracy of 1aC and as aforementioned, HFE 7100 has a fast reaction to temperature change. Although the temperature data collected is below the boiling temperature of the working fluid, it is still possible to occur phase change inside the microchannel. This is explained by the temperature variations across the section of the microchannel that are not monitored. In fact, the temperature is higher close to the heated wall and decreases gradually as it moves away from the heating element. In addition, the measured outlet temperature is after the microchannel exit, so the fluid may suffer some cooling in that position, as it is no longer in contact with the heated wall. An energy balance performed inside the microchannel can be compared with the experimental values obtained. Hence, the theoretical temperature difference between the inlet and outlet of the channel can be calculated for each heat flux and mass flow rate tested according to Eq. 2:
Where Ta,out and Ta,in are the average outlet and inlet temperature of the fluid in the microchannel, q” is the imposed heat flux on the stainless-steel foil, with an area A.
Table 3 depicts the theoretical temperature differences expected for each sheet tested. The presented values can also be subtracted by the theoretical heat losses, calculated as described in Section 2.5.
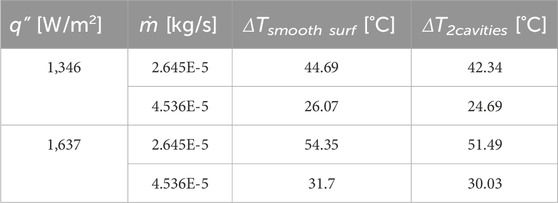
Table 3. Theoretical temperature difference between the inlet and outlet of the microchannel.
The values calculated theoretically are much higher than those obtained experimentally. The results presented in Table 3 assume a single phase-flow in contact with all heated walls. In two-phase flows a part of the energy, that is used to heat the fluid in single-phase flows, is used as latent heat to enable the phase-change of the liquid phase. This means that the temperature of the fluid will not be as high as predicted for single-phase flow.
Hence, the results are consistent and mainly show the high potential of combining high-speed imaging with time resolved infrared thermography to characterize complex flows. The results also show that there is a good potential for this microchannel based flow cooling in removing the required heat fluxes for the application considered here. A deeper analysis is now required to optimize the surface structuring to provide heat transfer enhancement and considerably control the flow instabilities in a more effective way.
4 Final remarks
The present work addresses an experimental study on the development of a microchannel based heat sink to cool photovoltaic panels. Experiments focus on the experimental characterization of flow boiling in a microchannel, with geometry and dimensions optimized from previous work, combining high-speed visualization and time resolved thermography. The presence of microcavities on the surface was also investigated, to infer on their influence in heat transfer and in the control of instabilities.
The results confirm the high potential of combining high-speed imaging with time resolved thermography to accurately describe two-phase flows in the microchannel. Hence, combination of both techniques allowed to investigate interfacial heat transfer phenomena, providing heat flux maps that can enable to identify the flow regimes and understand the heat transfer processes. There are still issues to overcome, related to possible limitations in the results due to insufficient optical resolution. Care must be taken with the calibration and post-processing procedures of the thermal images to ensure that reliable information is provided on the flow and heat transfer mechanisms.
The results also show that microchannel based flow cooling is effective in removing the required heat fluxes for the application considered here, with minor pumping power requirements (low pressure drops). The microcavities patterns did not promote significant effects either in heat transfer or in the control of the flow instabilities, but the patterns used are not optimized yet. Hence, a deeper analysis is now required to optimize the surface patterns.
Data availability statement
The raw data supporting the conclusion of this article will be made available by the authors, without undue reservation.
Author contributions
PP: Methodology, Formal Analysis, Data curation, Writing–original draft. GM: Writing–review and editing, Writing–original draft. MP: Writing–original draft, Investigation, Data curation, Conceptualization. MGdG: Writing–review and editing, Supervision. ALNM: Project administration, Writing–review and editing. ASM: Writing–original draft, Supervision, Conceptualization, Writing–review and editing, Project administration, Funding acquisition.
Funding
The author(s) declare that financial support was received for the research, authorship, and/or publication of this article. Authors acknowledge to Fundação para a Ciência e Tecnologia (FCT) for partially financing the research through project PTDC/EMETED/7801/2020 and UIPD/50009/2020-FCT and UIDB/50009—FCT to Portuguese Army—Ministério da Defesa, for financing projects CINAMIL STECOMBAT—Development of thermal management and climatization systems for NBQ equipment and COOLUAV—Cooling system for electronics and batteries for military unmanned vehicles, which partially also supported this project. AM also acknowledges FCT for partially financing her contract through CEECINST/00043/2021/CP2797/CT0005, doi: 10.54499/CEECINST/00043/2021/CP2797/CT0005 and for supporting PP’s PhD fellowship (Ref. SFRH/BD/149286/2019).
Conflict of interest
The authors declare that the research was conducted in the absence of any commercial or financial relationships that could be construed as a potential conflict of interest.
Publisher’s note
All claims expressed in this article are solely those of the authors and do not necessarily represent those of their affiliated organizations, or those of the publisher, the editors and the reviewers. Any product that may be evaluated in this article, or claim that may be made by its manufacturer, is not guaranteed or endorsed by the publisher.
References
Colt, G. (2016). “Performance evaluation of a pv panel by rear surface water active cooling,” in Proceedings of the 2016 IEEE International Conference on Applied and Theoretical Electricity (ICATE), Craiova, Romania, October, 2016, 1–5. doi:10.1109/icate.2016.7754634
Gilmore, N., Timchenko, V., and Menictas, C. (2018). Microchannel cooling of concentrator photovoltaics: a review. Renew. Sustain. Energy Rev. 90, 1041–1059. doi:10.1016/j.rser.2018.04.010
Kandlikar, S. G. (2012). History, advances, and challenges in liquid flow and flow boiling heat transfer in microchannels: a critical review. J. Heat Transf. 134 (3). doi:10.1115/1.4005126
Kenning, D., and Yan, Y. (1996). Pool boiling heat transfer on a thin plate: features revealed by liquid crystal thermography. Int. J. Heat Mass Transf. 39 (15), 3117–3137. ISSN 0017-9310. doi:10.1016/0017-9310(96)00006-3
Kim, D. E., Yu, D. I., Jerng, D. W., Kim, M. H., and Ahn, H. S. (2015). Review of boiling heat transfer enhancement on micro/nanostructured surfaces. Exp. Therm. Fluid Sci. 66, 173–196. doi:10.1016/j.expthermflusci.2015.03.023
Krauter, S. (2004). Increased electrical yield via water flow over the front of photovoltaic panels. Sol. energy Mater. Sol. cells 82 (1-2), 131–137. doi:10.1016/j.solmat.2004.01.011
Liu, T. L., and Pan, C. (2016). Infrared thermography measurement of two-phase boiling flow heat transfer in a microchannel. Appl. Therm. Eng. 94, 568–578. doi:10.1016/j.applthermaleng.2015.10.084
Marseglia, G., De Giorgi, M. G., Carvalho, D. S., Pontes, P., Souza, R. R., Moreira, A. L. N., et al. (2024a). Experimental investigation on the effects of the geometry of microchannels based heat sinks on the flow boiling of HFE-7100. Appl. Therm. Eng. 236, 121479. (Published online on the 2nd September 2023). doi:10.1016/j.applthermaleng.2023.121479
Marseglia, G., De Giorgi, M. G., Pontes, P., Solipa, R., Souza, R. R., Moreira, A. L. N., et al. (2024b). Enhancement of microchannel heat sink heat transfer: comparison between different heat transfer enhancement strategies. Exp. Therm. Fluid Sci. 150, 111052. (Published online on the 4th September 2023). doi:10.1016/j.expthermflusci.2023.111052
Mendes, J. F. P. (2021). Técnicas de pós-processamento de imagens para métodos experimentais em termografia. MSc. Thesis in Mechanical Engineering. Universidade de Lisboa: Instituto Superior Técnico.
Mohammadi, M., and Sharp, K. V. (2013). Experimental techniques for bubble dynamics analysis in microchannels: a review. J. fluids Eng. 135 (2), 212021–2120210. doi:10.1115/1.4023450
Moita, A. S., Teodori, E., and Moreira, A. L. N. (2015). Influence of surface topography in the boiling mechanisms. Int. J. Heat Fluid Flow 52, 50–63. doi:10.1016/j.ijheatfluidflow.2014.11.003
Novec (2002). Engineered fluid hfe-7100 physical properties. Available at: https://www.acota.co.uk/wp-content/uploads/2018/11/3M-Novec-use-as-a-carrier-fluid-for-Ninhydrin-or-DFO-in-latent-fingerprint-development.pdf.
Perry, D. L., and Dereniak, E. L. (1993). #Linear theory of nonuniformity correction in infrared staring sensors. Opt. Eng. 32 (No 8).
Pontes, P., Cautela, R., Teodori, E., Moita, A. S., Liu, Y., Moreira, A. L. N., et al. (2020). Effect of pattern geometry on bubble dynamics and heat transfer on biphilic surfaces. Exp. Therm. Fluid Sci. 115 (No 1), 110088. doi:10.1016/j.expthermflusci.2020.110088
Radwan, A., Ookawara, S., and Ahmed, M. (2019). Thermal management of concentrator photovoltaic systems using two-phase flow boiling in double-layer microchannel heat sinks. Appl. Energy 241, 404–419. doi:10.1016/j.apenergy.2019.03.017
Royne, A., Dey, C. J., and Mills, D. R. (2005). Cooling of photovoltaic cells under concentrated illumination: a critical review. Sol. energy Mater. Sol. cells 86 (4), 451–483. doi:10.1016/j.solmat.2004.09.003
Sharaf, M., Yousef, M. S., and Huzayyin, A. S. (2022). Review of cooling techniques used to enhance the efficiency of photovoltaic power systems. Environ. Sci. Pollut. Res. 29 (18), 26131–26159. doi:10.1007/s11356-022-18719-9
Sielaff, A. (2014). Experimental investigation of single bubbles and bubble interactions in nucleate boiling. PhD thesis. Germany: TU Darmstadt. Available at: http://tuprints.ulb.tu-darmstadt.de/3703/.
Taylor, B. N., and Kuyatt, C. E. (1994). Guidelines for evaluating and expressing the uncertainty of NIST measurement results. NIST Tech. Note 1297, 20. doi:10.6028/nist.tn.1297
Teodori, E., Moita, A. S., Pontes, P., Moura, M., Moreira, A. L. N., Bai, Y., et al. (2017). Application of bioinspired superhydrophobic surfaces in two-phase heat transfer experiments. J. Bionic Eng. 14 (N° 3), 506–519. doi:10.1016/s1672-6529(16)60417-1
Teodori, E., Pontes, P., Moita, A. S., and Moreira, A. L. N. (2018). Thermographic analysis of interfacial heat transfer mechanisms on droplet/wall interactions with high temporal and spatial resolution. Exp. Therm. Fluid Sci. 96, 284–294. doi:10.1016/j.expthermflusci.2018.03.013
Tuckerman, D. B., and Pease, R. F. W. (1981). High-performance heat sinking for vlsi. IEEE Electron device Lett. 2 (5), 126–129. doi:10.1109/edl.1981.25367
Tullius, J. F., Vajtai, R., and Bayazitoglu, Y. (2011). A review of cooling in microchannels. Heat. Transf. Eng. 32 (7-8), 527–541. doi:10.1080/01457632.2010.506390
Valeh-e Sheyda, P., Rahimi, M., Karimi, E., and Asadi, M. (2013). Application of two-phase flow for cooling of hybrid microchannel pv cells: a comparative study. Energy Convers. Manag. 69, 122–130. doi:10.1016/j.enconman.2013.01.029
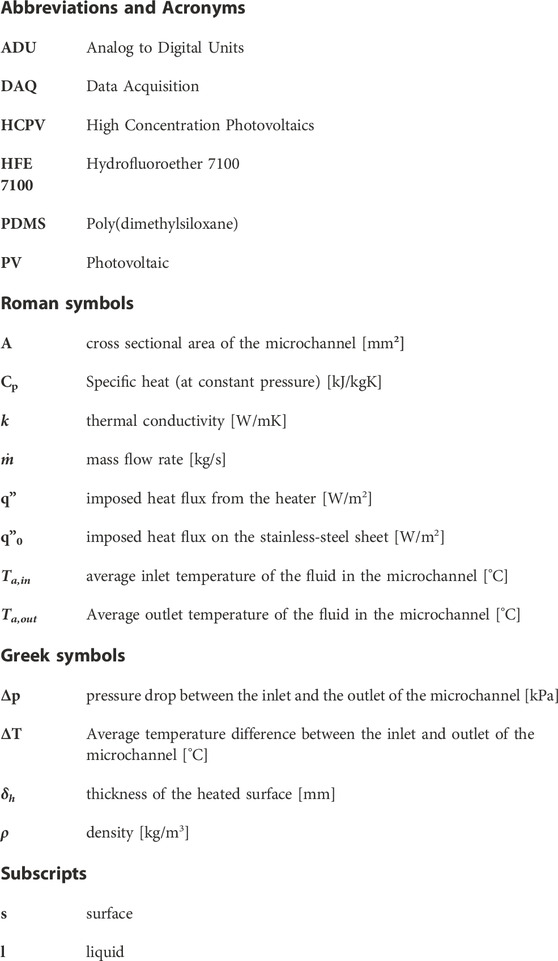
Nomenclature
Keywords: cooling, microchannel, microchannel based heat sink, PV panel, phase change, flow boiling
Citation: Pontes P, Marseglia G, Perez M, de Giorgi MG, Moreira ALN and Moita AS (2024) Experimental description of heat transfer processes at two-phase flow in microchannels towards the development of a heat sink for PV panels. Front. Therm. Eng. 4:1345452. doi: 10.3389/fther.2024.1345452
Received: 27 November 2023; Accepted: 22 May 2024;
Published: 19 June 2024.
Edited by:
Isabel Simões De Carvalho, Portuguese Military Academy, PortugalReviewed by:
Saeed Tiari, Gannon University, United StatesGabriela Bracho, Universitat Politècnica de València, Spain
Copyright © 2024 Pontes, Marseglia, Perez, de Giorgi, Moreira and Moita. This is an open-access article distributed under the terms of the Creative Commons Attribution License (CC BY). The use, distribution or reproduction in other forums is permitted, provided the original author(s) and the copyright owner(s) are credited and that the original publication in this journal is cited, in accordance with accepted academic practice. No use, distribution or reproduction is permitted which does not comply with these terms.
*Correspondence: Ana S. Moita, YW5hbW9pdGFAdGVjbmljby51bGlzYm9hLnB0