 Wesckley Gomes1*
 Methanias Colaço Júnior1*
 Luca Pareja Credidio Freire Alves2
 Raphael Fontes2
 Rodrigo Silva2
 Bruno Nunes2
 Caldeira Silva2
 Ricardo Valentim2
- 1Department of Information Systems, Federal University of Sergipe, São Cristóvão, Brazil
- 2Laboratory of Technological Innovation in Health (LAIS), Federal University of Rio Grande do Norte, Natal, Brazil
Context: The OPME (Órteses, Próteses e Materias Especiais or Orthoses, Prosthetics and Special Materials) Brazilian sector presents a wide variety of products and technologies, involving both multinational and local companies in healthcare. Despite technological advances, many services and information systems, especially in the public sphere, still use unstructured natural language descriptions of products, services or events, making their classification and analysis difficult. However, for efficient audits, it is necessary to classify and totalize invoices issued for product purchases automatically. In this way, the standardization lacking regarding nomenclature in the OPME marketing not only makes it difficult to compare products, whether for price standardization or standardization of use but also opens up space for possible acts of corruption.
Objective: To mitigate the problem of ineffective standardization and coding, develop and assess the effectiveness and efficiency of an OPME classifier, in the context of electronic invoice descriptions, from the point of view of auditors, healthcare professionals, and data scientists.
Method: Controlled Experiment, to evaluate scientifically mapped Artificial Intelligence (AI) algorithms and compare accuracy measures, F1-Score, sensitivity, precision, average training time, and classification.
Results: With an accuracy of 99%, the Linear Support Vector algorithm stood out among the others in terms of accuracy, while Naïve Bayes in terms of efficiency, had the fastest average training time.
Conclusion: The results showed that it is possible to identify and classify OPMEs in invoices automatically. This allows for a more precise and effective analysis of signs such as anomalously high prices and quantities of OPMEs purchased per inhabitant, which are analyzed by the Audit of Brazil’s Unified Health System (AudSUS), Ministry of Health -Brazil, for identification of potential irregularities and contribution to transparency and efficiency in the management of health resources.
1 Introduction
Corruption is characterized as the improper use of power, to obtain illegal advantages, and can be identified in practically all forms of organizations or groups, ranging from government institutions to private companies and non-profit organizations (Kratcoski and Edelbaher, 2018). The United Nations (UN) Convention against Corruption describes corruption as an insidious plague that has a wide range of corrosive effects on societies: it undermines democracy and the rule of law, leads to violations of human rights, distorts markets, harms the quality of life and allows organized crime, terrorism and other threats to human security to flourish (United Nations, 2003). In Brazil, a study carried out by the Federação de Indústrias do Estado de São Paulo (2010), using a neoclassical model of economic growth, based on Mankiw, Romer, and Weil (1992), estimated a range between 1.38% and 2.30% for GDP losses due to corruption. According to the Brazilian Institute of Geography and Statistics (IBGE, 2023), with the Brazilian GDP values for 2019, these values represent between R$100 and 160 billion.
The financial resources from the federal government allocated to health-related expenses are transferred to the States, the Federal District, and the Municipalities through two types of financing: the Costing Block for Public Health Actions and Services and the Network Investment Block of Public Health Services. Each of these blocks is subdivided into specific categories, and the entire accounting system covers a variety of programs and budgetary actions related to the health area. This includes several initiatives that involve the purchase of Orthoses, Prostheses, and Special Materials (OPME) by the Ministry of Health, as established by Ordinance No. 3,992.
The Tax Administration uses the Mercosur Common Nomenclature (NCM) field (Batista, Bagatini and Frozza, 2017) present on the e-invoice, to define which rate will apply to the item. However, miscoding and weaknesses in the descriptions of products, services, per diems, and cost centers is a general and recurring problem in public administration (Santos, et al., 2015; Ribeiro, et al., 2018). With invoices, similarly, the NCM entered by the taxpayer sometimes matches the description of the goods sold, which prevents the automatic and accurate identification of products, hindering investigations and audits.
When it comes to healthcare, the Orthotics, Prosthetics, and Special Materials (OPME) market is highlighted by the variety of products available and the technological diversity. It is a sector dominated by multinational companies, it also has small and medium-sized local companies, which causes heterogeneity in these devices, concentrating knowledge on specialists and producing information asymmetry (Cruz et al., 2022). This, together with the difficulty of standardizing the terminology in the commercialization of OPMEs, makes it difficult to compare products, either to standardize prices or standardize use, which gives rise to acts of corruption.
In January 2015, the national press reported evidence of a fraudulent scheme to purchase and use orthoses, prostheses, and special materials (OPME), which became known as the “prostheses mafia.” The alleged scheme involved a series of agents - manufacturers, distributors, hospitals, doctors, and lawyers - and various types of irregularities - selling devices at overprices, receiving irregular commissions, fraud, and embezzlement, among others (TCU, 2016). This problem is not unique to Brazil; in 2017, for example, the European Court of Auditors reported that the most widely applied forms of payment evasion are undervaluation, misclassification when switching to a product classification with a lower rate, and misdescription of goods (Spichakova and Haav, 2020).
Based on this context, this article aims to present and evaluate a tool, based on artificial intelligence, to identify and classify OPME invoices, the OPMinEr, following the experimental process contained in (Colaço Júnior, et al., 2022). The tool currently uses the Linear Support Vector algorithm with Inverse Frequency, based on pre-processing and customized parameterizations. With this knowledge model, based solely on the notes description, they are classified into the type of OPME, Class to which the product belongs, and the Brazilian Unified Health System (SUS) procedure in which the product may have been used. This classification allows the automatic identification of OPMEs by the SUS National Audit Department auditors, AudSUS, enabling the execution of OPME audit trails, for which the classifier is a sine qua non condition.
From this onwards, the article is subdivided as follows: in Section 2, the conceptual basis is described; Section 3 presents the methodology used; in Section 4, some related works are presented; Section 5 presents the OPMinEr classifier; Section 6 presents the definition and design of the experiment; the operation and results of the experiment are described in Sections 7, 8, respectively; and finally, the final considerations and future work are presented.
2 Conceptual basis
2.1 Public activity control
The ICMS is the main source of its revenue, concerning the state’s taxes, contributing by 19.7% of the country’s total revenue. This tax is non-cumulative, allowing the amount due in each transaction related to the movement of goods or the provision of services to be offset against the amount charged in previous transactions, according to information from the Brazilian Institute of Planning and Taxation.
In this context, the Electronic Invoice is one of the main proofs of legal validity in commercial operations carried out by the taxpayer. Being a nationwide program, the Electronic Invoice (NF-e) was developed by the Tax Administration, which instituted a unified tax document model in electronic form, replacing the paper tax document. The main objective of the NF-e is to modernize the Tax Administration by reducing costs and bureaucratic obstacles, making it easier for taxpayers to comply with their tax obligations, as well as strengthening transparency and inspection by the control bodies (Constitutional Amendment no. 42, 2003).
The graphic (physical) representation of the NF-e is called the Electronic Invoice Auxiliary Document (DANFE). The DANFE has the same fields as those defined in the models before the NF-e. It only serves as an auxiliary tool for consulting the NF-e, as it contains the printed access key, which allows the document to be validated on the Sefaz website. The DANFE is not an invoice and does not replace it.
From the DANFE it is possible to identify the goods that have been invoiced. These items, products, or services have an identifying code that is used by the NF-e issuer to identify them in its billing system, a textual description of the item for reading and easy identification of what the item refers to, and the NCM code - Mercosur Common Nomenclature - in addition to the tax information, quantities, and values of the goods. An NCM is nothing more than a number whose purpose is to make it easier to identify goods for inspection and taxation by the competent authorities. Each NCM has a rate value attached to it, corresponding to the related tax on the goods. In addition, each item on the invoice must be linked to the corresponding code in the NCM table.
However, some taxpayers may associate codes from the NCM table that do not correspond to the product items described in the NF-e, so the wrong rates may be levied on the products supplied. As presented by, this impacts the state’s revenue, since the tax due is not correctly collected. In addition, it is impossible to assess the taxpayer involved due to the lack of evidence of irregularities in issuing the NF-e. Finally, codes that are incompatible or incongruous with the actual product descriptions can turn the tide against the control bodies investigation process, as they are prevented from accurately ascertaining variables such as the average price, values, and exorbitant quantities of products purchased, often accounted for in categories completely different from their own.
2.2 Word importance measure (TF-IDF)
During the pre-processing stage, the text is split into words, which can then be labeled as tokens. Tokens are generally divided by spaces, and each word between spaces becomes a token. This tokenization process is used to identify keywords that make sense and represent the document (Vijayarani and Janani, 2016).
Term Frequency (TF) corresponds to the number of times the term appears in the document. Terms that are frequently mentioned in certain documents can serve as discriminators. For a more contextual calculation, the TF-IDF statistical measure, presented by Salton et al. (1983), considers the importance of a term in the corpus (complete dictionary of words), whether it is structured or not. To calculate the TF-IDF, a value is assigned to each term based on term’s frequency in the document itself (TF already seen) and in the entire corpus (IDF), indicating its importance.
The term’s relevance is calculated using the Inverse Document Frequency (IDF) equation (Salton and Buckley, 1988). The IDF is defined by the following equation: the logarithm of the ratio between the total number of documents, ND, and the frequency of documents containing the term t dft. The higher the IDF of the term, the more representative it is.
The final weight is assigned by the TF-IDF equation, in which the weight is associated with the proportion of the term’s frequency in the document (TF) and the inverse proportion of the number of times the term appears at least once (IDF). The TF-IDF is represented by the following equation:
If the word appears in all documents, following the formula, the IDF will be the Log of 1, i.e., it will be zero, because the Log of 1 in any base is zero. As the IDF will be zero, when multiplied by any TF value, the result will also be zero. In other words, the more the word appears in the corpus, the lower its weight will be. Thus, the word shall have zero weight if it appears in all documents (low discriminatory power).
2.3 Quality metrics
The following metrics were used to evaluate the classifier: accuracy, sensitivity, precision, and F1-Score (Zhu et al., 2010). These metrics are measured using the following frequencies:
A. True Positive (TP): Total number of instances of note products in the annotated base (the algorithm’s training base) that were correctly classified;
B. True Negative (TN): Total instances of products, which are not OPMEs, and have been correctly classified;
C. False Positive (FP): Total instances of other products that were incorrectly classified as belonging to OPME;
D. False Negative (FN): Total instances of OPME products that were not correctly classified;
2.3.1 Accuracy
Accuracy represents the percentage of instances (invoices) that were classified correctly, and is defined by:
2.3.2 Sensitivity
Sensitivity or recall, also known as the true positive rate, sensitivity, or true positive sampling coverage, is the percentage of positive instances that were classified correctly:
2.3.3 Precision
Precision is the ratio of instances classified as “true positive” to all instances classified as positive:
2.3.4 F1-score
The F1-Score is the metric that combines two performance indicators and is the expression of the harmonic mean of accuracy and sensitivity:
3 Methods
The methodology adopted for this study initially involved a systematic mapping of the literature, published in (Gomes and Colaço Júnior, 2022), to find state-of-the-art research into methods for products in invoices and tax returns classification. The mapping enables it to identify the most used, most effective, and fastest algorithms, making it possible to select the ones that stood out for these last two characteristics, since the environment proposed here has Big Data characteristics.
Concerning the main methodological classification, this article is an experimental study, which follows the steps presented in (Colaço Júnior, et al., 2022), to evaluate the results obtained from the OPME classifier, OPMinEr. This evaluation, detailed below, used the quality metrics presented in Subsection 2.2, implemented using the libraries mentioned in Subsection 6.2.6.
To design the knowledge model, a data dictionary was built with information from various sources (see Section 5), which was used to train the algorithms evaluated. Then the pre-processing stage was carried out, breaking the descriptions into tokens. The TF-IDF vector model was used to calculate the frequency and importance of a token in the dictionary. After developing OPMinEr, which aggregates the dictionary created and makes available all the algorithms selected in the mapping, an experiment was carried out to evaluate these algorithms, of the in vitro type, since the objects were removed from the original base to be manipulated within a controlled environment. This method enables it to analyze and evaluate the results using statistical analysis, allowing a faithful replication of the procedures presented in this work.
The replication of experiments is an important characteristic of any scientific area. Thus, in the software niche, it is necessary to apply methods that can replicate and evaluate, to avoid new methods, techniques, languages, and tools being suggested, published, or presented for sale, without experimentation and validation (Travassos et al., 2020).
Finally, the experiment definition and planning are described in detail, with their self-contained methodologies, in Section 6. Therefore, the experiment is divided into four main stages: planning; the data cleaning operation, collection and generation of the experimental base; the comparison of methods; and the analysis of the results.
4 Related works
The study of Batista et al. (2017) aimed to automatically classify NCM codes using the descriptions found on NFs issued in the state of Rio Grande do Sul. The databases were distinguished by their complexity, assessed as simple, medium, or complex, which obtained 98%, 90%, and 83% accuracy respectively. The work of Correa and Leal (2018) aimed to identify overpricing in the acquisition of medicines purchased by the Brazilian federal government, made available through transparency portals, using text mining and clustering techniques to classify the products. Although the problem of OPMEs involves a greater number of classes and is therefore considered more complex, the automatic classification of medicines is similar to the work proposed here, and the identification of overpricing is one of the audit trails made possible by OPMinEr.
In the article by Spichakova and Haav (2020), the authors provided automated solutions to the problem of misclassification of goods, using a hybrid approach that combines knowledge derived from textual descriptions and the taxonomy of the Harmonized System (HS) code nomenclature. Using the cosine similarity technique, they checked whether similar textual descriptions are related to similar HS codes. In the case of the work presented here, the data dictionary also combines a taxonomy of orthoses, prostheses, and special materials related to surgery from Brazil’s Unified Health System (SUS), the invoice descriptions themselves, the table of products from the National Health Surveillance Agency (ANVISA) and the Federal Government’s Official Materials Register (CATMAT).
The work of Yue et al. (2020) proposed a method for classifying extremely short texts in Chinese invoices, in which the association between the name and the class label is weak. The method was based on Bidirectional Semantic Extension and used a Chinese knowledge map to look up synonyms, thus extending the length of the texts. The technique achieved over 90% accuracy and proved more efficient when compared to other techniques such as LibShortText, NBSVM, and TextGrocery. The technique achieved over 90% accuracy and proved to be superior when compared to other techniques such as LibShortText, NBSVM, and TextGrocery.
5 OPMinEr
OPMinEr is a system that performs three types of classifications related to OPMEs. These classifications are carried out in sequence. First, the system predicts the type of OPME based on the product description. If the description does not fit into any of these categories, the product is classified as “Other.” Next, the system classifies the product into one of 83 different classes, such as Stent, Catheter, Orthopaedic Prosthesis, Cannula, etc. Finally, OPMinEr predicts the specific Unified Health System (SUS) procedure in which the product may have been used. There are 319 different procedures in this category, such as Detachable Balloon Placement, Atrial/Peritoneal Catheter, Kirschner Wire, and Tibio-Tarsal Intramedullary Stem, among others. These classifications are carried out after pre-processing the product description, and OPMinEr uses previously trained models to perform these tasks. Figure 1 shows an example of the classification process. The complete operation is described in Section 7.
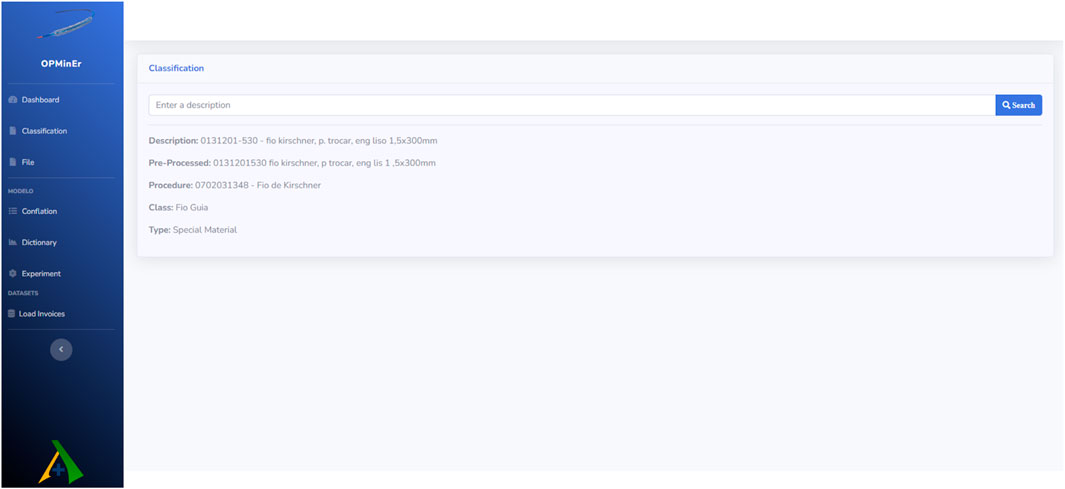
Figure 1. Classification screen.
The knowledge model used to learn how OPMEs are described was designed using several data sources. These sources included records from the National Health Surveillance Agency (Anvisa), the federal government’s official materials register (Catmat), additional descriptions entered manually by auditors and information from the state of Rio Grande do Norte’s (RN) own invoices, which were labeled manually.
To obtain the data from Catmat, a Python script was developed that automates the downloading of.csv files from Catmat and inserting them into a database table. This made it possible to create an up-to-date and accessible repository of information.
Cosine Similarity, a natural language processing technique, was used to semi-automatically identify products in the Anvisa and Catmat databases that fall into the category of OPMEs. The script reads the data from SUS procedures referring to OPMEs and calculates the cosine similarity for the product descriptions from Anvisa and Catmat. Descriptions with a cosine similarity less than or equal to 0.6 were initially discarded as part of a preliminary filter. Therefore, the chosen descriptions underwent a manual review and were inserted into the data dictionary. Figure 2 of the article shows some of these descriptions contained in the dictionary, illustrating the diversity and complexity of OPME descriptions.
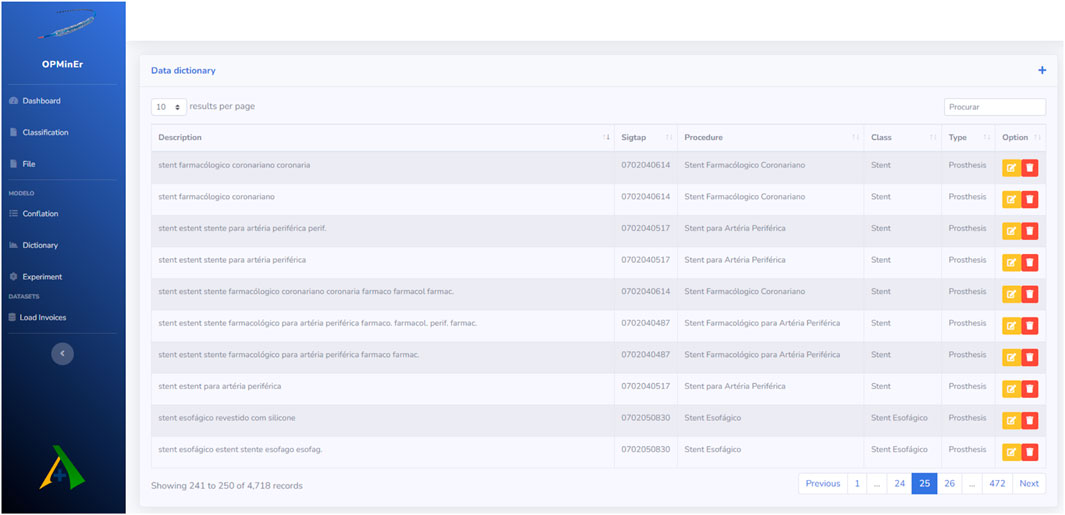
Figure 2. Data Dictionary screen.
In addition, a word standardization and conflation dictionary were created as part of the system. This dictionary not only standardizes words but also serves as an effective synonym tool. For example, whenever the system encounters the word “parafus.”, it performs an automatic correction, instantly transforming it into “parafuso.”
It is worth noting that for each classification type, one algorithm may outperform another, so the different classifications of invoices may have distinct algorithms. Thus, the tool is ready to be re-evaluated as the dictionary is added.
6 Experiment definition and planning
6.1 Objective
To analyze an OPME classifier, OPMinEr, which is based on natural language processing, to evaluate its accuracy, precision, sensitivity, F-1 measure, average training and execution time, from the point of view of auditors, health professionals, and data scientists, in the context of invoice descriptions analyzed by the Public and Health Ministries, as well as by the Audit of the Brazilian Unified Health System (SUS).
6.2 Planning
6.2.1 Context selection
The experiment was undertaken “in vitro” analysis in a controlled environment, where OPMinEr was used to classify OPMEs invoices. Data was obtained from invoices held by AudSUS, the Laboratory for Technological Innovation in Health (LAIS), and the Federal Public Ministry. There were 465,726 invoices, corresponding to the period from January 2020 to May 2022.
6.2.2 Research questions
In the context of classifying OPMEs invoices, based on the algorithms selected, two questions are involved in formulating the hypotheses:
• Q1: Which of the selected algorithms is the best in terms of effectiveness?
• Q2: Which of the selected algorithms is the best in terms of efficiency?
Formulation of Hypotheses:
To answer question Q1, the following hypotheses were drawn up:
• H0: Algorithms (1,2.n) are equally effective.
• H1: The algorithms (1,2.n) have different efficiencies.
To answer question Q2, the following hypotheses were drawn up:
• H0: The algorithms (1,2.n) have the same efficiency.
• H1: The algorithms (1,2.n) have different efficiencies.
6.2.3 Independent variables
The independent variables considered for this experiment were: the data dictionary built; the electronic invoice database with the target descriptions to be classified; the OPMinEr classifier, the algorithms used for the classification task: Naïve Bayes Multinomial, Naïve Bayes Gaussian and Naïve Bayes Bernoulli, Linear Support Vector, Decision Tree, Random Forest and Gradient Boosting.
6.2.4 Dependent variables
The predictions achieved, from which the metrics can be derived: Accuracy (ACU), Precision (PRE), Sensitivity (SEN), and F1-Score (F1). In addition, the average training time (ATT) and average classification time (ATT).
6.2.5 Selection of participants and objects
Since there are far more notes for products in general, which are not OPMEs, a sample of 4,718 records was selected, maintaining an approximate proportion of OPME notes. The algorithm was selected based on a systematic mapping performed by Gomes and Colaço Júnior (2022), who listed the fastest classification algorithms for solving the general problem of incongruous descriptions.
6.2.6 Instrumentation
The materials and resources used were:
• The OPMinEr tool;
• PostgreSQL 12.12 (PostgreSQL, 2021);
• Python 3.10.8 (Python, 2021);
• Django 4.1.7 (Django, 2023);
• Mlflow 2.3 (MLflow, 2023);
• Power BI 2.117.984.0 64-Bit (PowerBI, 2023);
• Scikit-learn (Pedregosa et al., 2011),
• Computer with Intel(R) Core(TM) i7-8700T CPU @ 2.40 GHz and 32 GB RAM.
7 Experiment operation
7.1 Preparation
In synthesis, the environment for the controlled experiment was prepared, i.e., the items described in Section 6.2.6 were downloaded and installed, and all the data was uploaded to the database. The invoice data was made available via a database dump, and the ANVISA and CATMAT data was available via.csv files. Figure 3 provides an example of invoice descriptions for the procedure HASTE FEMORAL CURTA. Such descriptions complicate the process of converting invoice text into accurate and standardized descriptions.
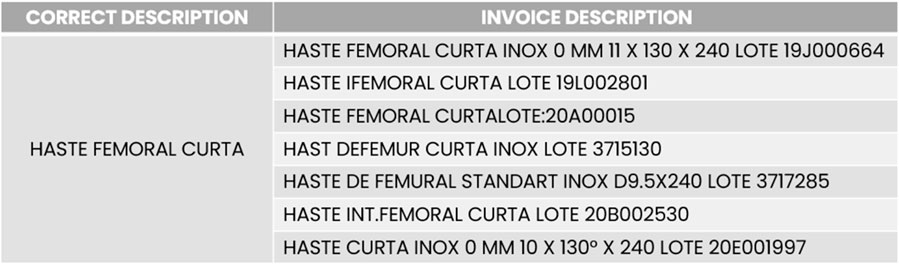
Figure 3. Invoice descriptions.
7.2 Implementation
The process began by normalizing and conflating the descriptions, aiming to standardize and mitigate classification errors. Normalization, in this study, is responsible for keeping the text lowercase and removing, the following tokens or special characters: (“\' [!@#$%^and*()[]{};:.<>?\|`∼ = _-); date; accentuation, keeping the original letter; excessive whitespace; punctuation and stopwords (prepositions, articles, etc.). The process of transforming the data into a vector model began.
After transforming the data into a vector model, the model was trained and evaluated using the k-fold cross-validation technique. Which, involves dividing the available data set into several parts (folds), usually k equal parts. For each iteration of the cross-validation process, one of the k parts is used as the test set, while the remaining k-1 parts are used as the training set. In this work, the dictionary data was divided into 10 sets (10-fold), i.e., the model was trained and tested ten times, making the average of the 10 interactions for each metric evaluated. It is worth noting that as the tool performs three different types of classification, it was necessary to build and train three different models. After execution, the following metrics were obtained: accuracy, sensitivity, F1-Score, precision, average training time, and average classification time. To better deliver the test and production models, the models and metrics were handled by MLflow, an open-source tool for managing machine learning model lifecycles. The results of this data collection will be presented in the next section.
7.3 Data validation
Five (5) types of statistical tests were used for analysis, interpretation, and validation: Shapiro-Wilk, Kruskal-Wallis, Post-Hoc Dunn, Anova, and Tukey HSD. The Shapiro-Wilk test (Shapiro and Wilk, 1965) was used to test the normality of the data, while the Kruskal and Wallis (1952) and Post-Hoc Dunn (Dunn, 1961) tests were used to compare the Accuracy and F1-Score medians in cases where the normality test indicated a non-normal data distribution. For normal data with homoscedasticity, the ANOVA test checks whether the difference between the means of two or more groups is significant. The Tukey test is then used as a complement to test any contrast between two treatment means (Field, 2009).
8 Results
To answer the research questions listed in Section 6.2.2, the execution stage followed, and the classification results were obtained, as well as their average time, for each of the three classifications: Type, Class, and Procedure. Table 1 shows the metric averages for the Type classification.
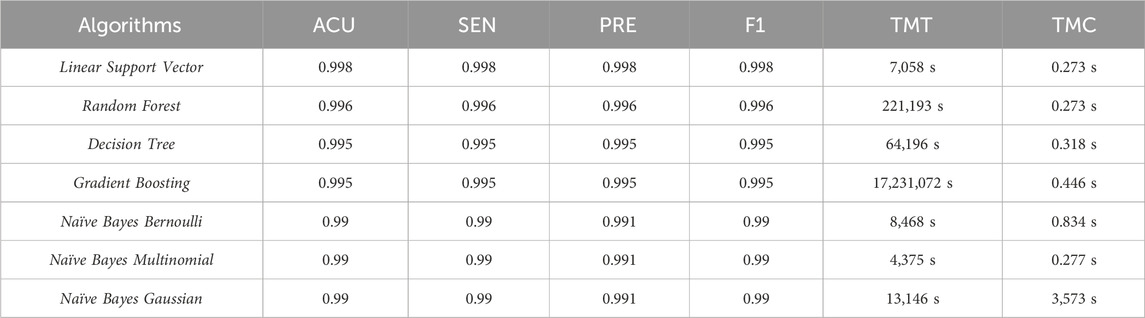
Table 1. Comparison of the averages of the metrics for Type classification.
The algorithms obtained similar accuracy averages, with Linear Support Vector standing out the most. Regarding training time, the Multinomial Naïve Bayes algorithm was the fastest, and regarding classification time, the Linear Support Vector and Random Forest algorithms obtained the best results. Despite the good accuracy of algorithms for identifying whether the description on an invoice is an orthosis, prosthesis, or special material, it is not possible to make assertions without sufficiently conclusive statistical evidence. Therefore, a significance level (α) of 0.05 was set for the entire experiment. When the Shapiro-Wilk test was applied to analyze the normality of the data distribution, the p-values shown in Table 2 were obtained.

Table 2. Shapiro-Wilk test results to analyze the normality of the Type data.
Since the normality test indicated non-normal distributions for the Multinomial Naïve Bayes algorithm (p-value <0.05), the non-parametric Kruskal-Wallis test was applied to check whether there is at least one difference between the metrics medians. The test was employed to Accuracy and F1-Score, noting that the latter harmonizes the accuracy and sensitivity metrics. The Kruskal-Wallis test showed a p-value of 0.000143, significantly lower than the significance level adopted for both the Accuracy metric and F1-Score. In this way, it was possible to confirm the differences between the medians, i.e., the hypotheses H0, that the methods have the same F1-Score and the same Accuracy were rejected. On the other hand, the difference between the median scores of some groups is large enough to be statistically significant.
Hence, it was clear that at least one method differs from the others, but it is not possible to affirm which is the most discrepant. To do this, the two-by-two Kruskal-Wallis test was used, equivalent to the Mann-Whitney U test with normal approximation. Table 3 shows the results of this test, showing that, after analysis and application of the Dunn Post-Hoc test, applying the Bonferroni correction (α = 0.0024), for Accuracy and F1-Score, the following pairs were significantly different (p-value < 0.0024): Naïve Bayes Bernoulli - Linear Support Vector; Gaussian - Linear Support Vector; Multinomial - Linear Support Vector.
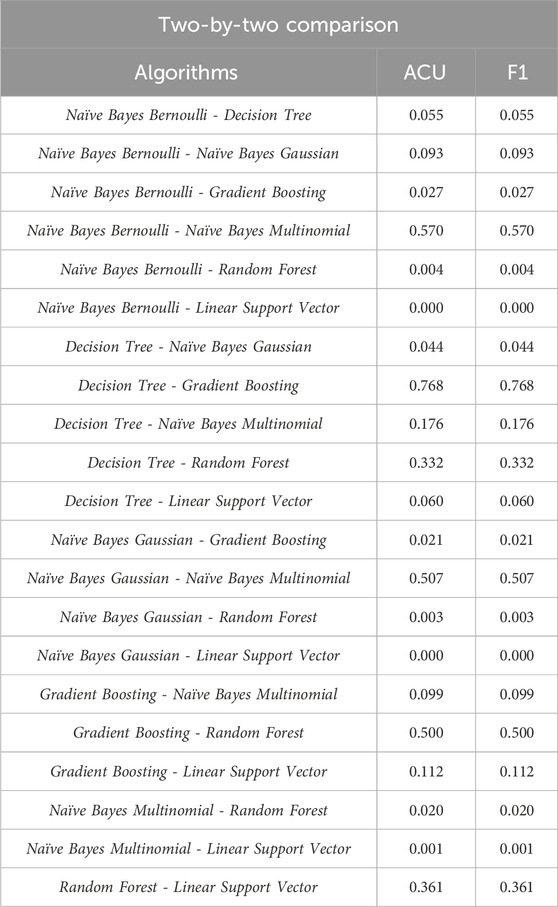
Table 3. Kruskal-Wallis test, two-by-two.
Table 4 shows the averages of the metrics for Class classification.
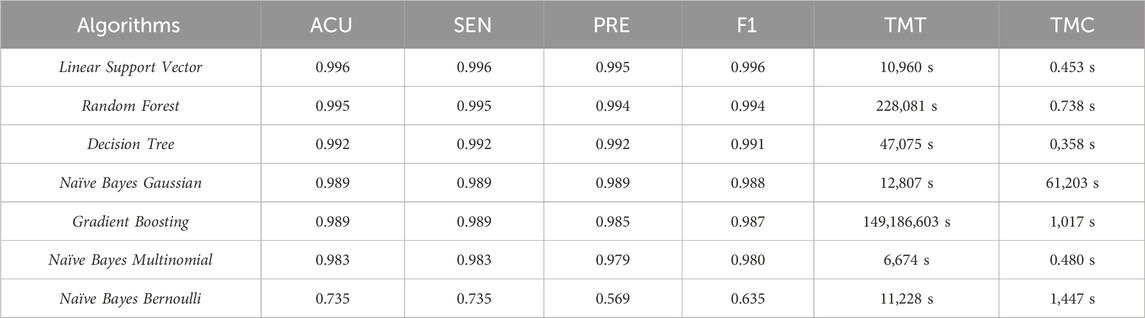
Table 4. Comparison of Class classification metric averages.
The algorithms maintained similar accuracies, with only Naïve Bayes Bernoulli deviating from the others. As with the Type classification, the Linear Support Vector algorithm was more accurate than the others. Similarly, the Multinomial Naïve Bayes algorithm stood out regarding training time efficiency, and Decision Tree in classification time. Upon analyzing the distribution normality of the data, we noticed that for the Class classification, the data assumed a non-normal distribution for Accuracy and a normal distribution for F1-Score. Table 5 shows the Shapiro-Wilk test for Class.
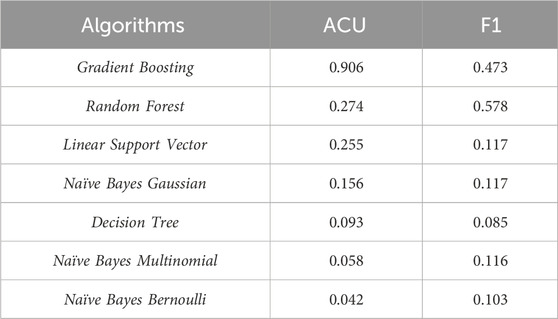
Table 5. Shapiro-Wilk test results to analyze the normality of the class data.
This enabled using the ANOVA test for F1-Score to check whether the difference between the metrics medians of two or more groups is significant. After applying for the test, a p-value of 0.000 was found. Thus, hypothesis H0 was rejected, that the methods have the same F1-Score. The test shows that some of the medians of the groups are not the same, but it does not say what the differences are. To achieve this, the Tukey HSD test was applied two by two and the following pairs were significantly different: Naïve Bayes Bernoulli - Decision Tree; Naïve Bayes Bernoulli - Naïve Bayes Gaussian; Naïve Bayes Bernoulli - Gradient Boosting; Bernoulli - Naïve Bayes Multinomial; Naïve Bayes Bernoulli - Random Forest; Bernoulli - Linear Support Vector; Decision Tree - Naïve Bayes Multinomial; Naïve Bayes Multinomial - Random Forest; Naïve Bayes Multinomial - Linear Support Vector.
Since the normality test indicated non-normal distributions in the Naïve Bayes-Bernoulli algorithm for Accuracy measurement, the Kruskal-Wallis test was used to check whether the difference between the medians of the metrics is significant. The p-value found after applying the test was 0.000, and therefore hypothesis H0, that the methods have the same Accuracy, was rejected. Therefore, the two-by-two Kruskal-Wallis test, applying the Bonferroni correction (α = 0.0024), was used to identify the significantly different pairs: Naïve Bayes Bernoulli - Decision Tree; Naïve Bayes Bernoulli - Gradient Boosting; Naïve Bayes Bernoulli - Random Forest; Naïve Bayes Bernoulli - Linear Support Vector; Naïve Bayes Multinomial - Random Forest;
Table 6 shows the test results.
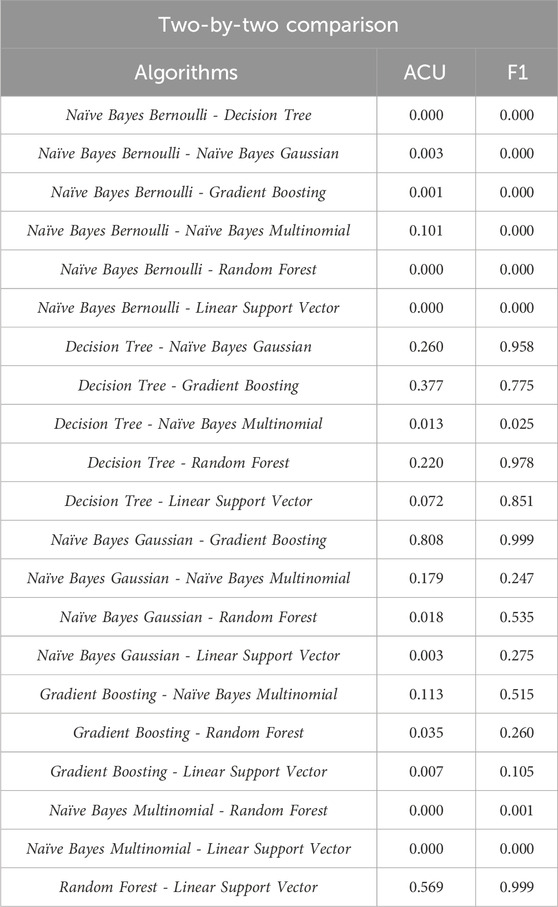
Table 6. Kruskal-Wallis test (ACU) and Tukey HSD (F1), two by two.
Table 7 shows the averages of the metrics for the Procedure classification.
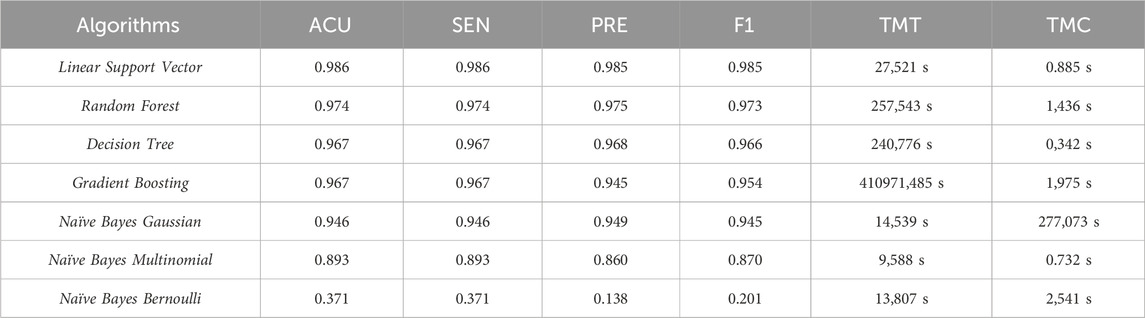
Table 7. Comparison of the averages of the metrics for classification Procedure.
The graph in Figure 4 shows the layout of the Accuracy and F1-Score measures concerning the algorithms.
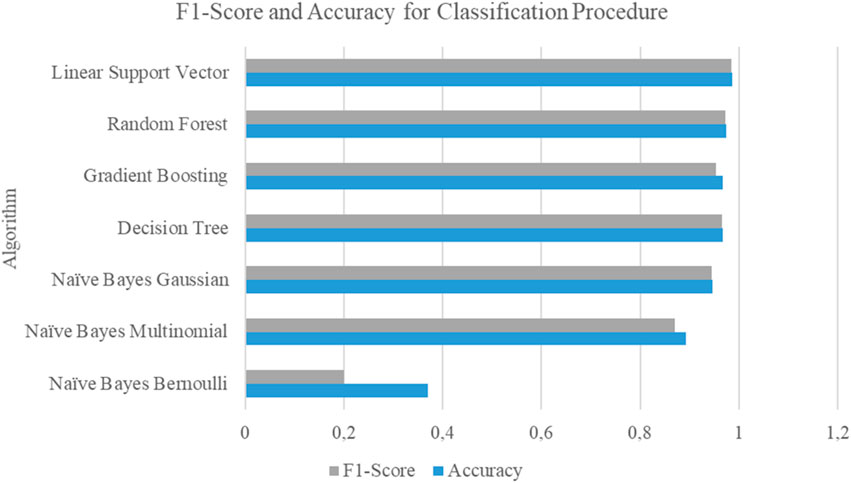
Figure 4. F1-Score and Accuracy metrics for classification Procedure.
Concerning the classification steps, the Linear Support Vector algorithm had an accuracy of over 98%. Regarding efficiency, we have Multinomial Naïve Bayes as the most efficient for average training time and Decision Tree for average classification time. Table 8 shows the Shapiro-Wilk test for analyzing the normality of the distribution of the Procedure classification data.
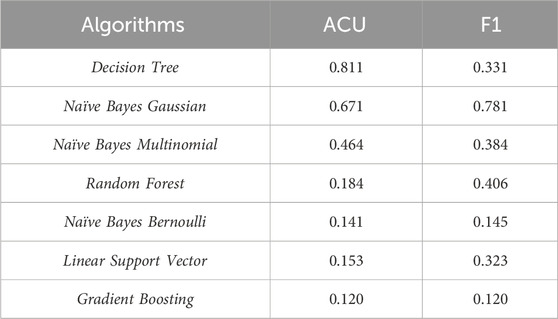
Table 8. Results of the Shapiro-Wilk test to analyze the normality of the Procedure data.
When analyzing the normality of the data distribution, it was found that for the Procedure classification, the data assumed a normal distribution for both the Accuracy measure and the F1-Score, then, the ANOVA test was used to check whether the difference between the medians of the metrics of two or more groups was significant. After applying for the test, a p-value of 0.000 was found. Thus, hypothesis H0, that the methods have the same Accuracy and F1-Score, was rejected. The Tukey HSD two-by-two test was used to identify significantly different pairs: Naïve Bayes Bernoulli - Decision Tree; Naïve Bayes Bernoulli - Naïve Bayes Gaussian; Naïve Bayes Bernoulli - Gradient Boosting; Naïve Bayes Bernoulli - Naïve Bayes Multinomial; Naïve Bayes Bernoulli - Random Forest; Naïve Bayes Bernoulli - Linear Support Vector; Decision Tree - Naïve Bayes Gaussian; Decision Tree - Naïve Bayes Multinomial; Decision Tree - Linear Support Vector; Naïve Bayes Gaussian - Gradient Boosting; Naïve Bayes Gaussian - Naïve Bayes Multinomial; Naïve Bayes Gaussian - Random Forest; Naïve Bayes Gaussian - Linear Support Vector; Gradient Boosting - Naïve Bayes Multinomial; Gradient Boosting - Linear Support Vector; Naïve Bayes Multinomial - Random Forest; Naïve Bayes Multinomial - Linear Support Vector. Table 9 shows the test results.
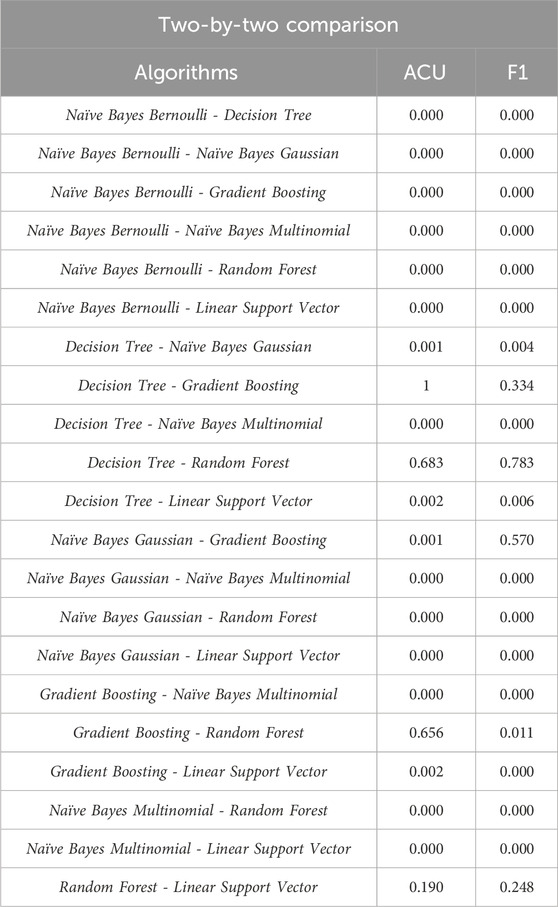
Table 9. Tukey HSD test, two-by-two.
The classifier can also generate intelligent reports that help AudSUS auditors make decisions. The classifier enables audit trail creation and intelligent reports that help AudSUS auditors make decisions. Figure 5 shows a dashboard with the volume of OPME purchases made by the state of Rio Grande do Norte (RN), which shows the volume of purchases by Type, Class, and Procedure. The data on the dashboard represented fictitious data and was constructed by applying the three classifications to each invoice made available.
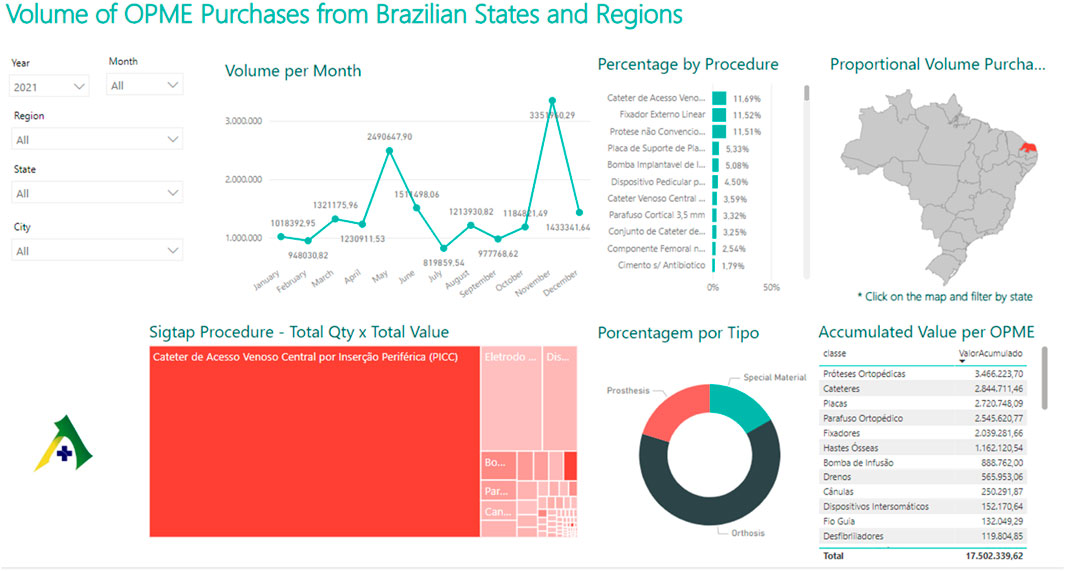
Figure 5. Volume of OPME purchases.
Figure 6 shows an audit trail designed to identify anomalous relationships between requesting and authorizing professionals. This trail is especially focused on detecting possible collusion between doctors, based on analyzing the unusual frequency of associations between requesting and authorizing professionals in angiology procedures. For a relationship to be considered an indication of fraud, the volume between the pair of doctors must exceed 3% of the total volume of transactions and a minimum of 65% confidence in the association. The map highlights the states with the highest incidence of identified signs. The table details the anomalies discovered among professionals. For example: “Out of a total of 17,861 authorizations, 2,223 (12.4%) were made by doctor 1811 to doctor 5719. In addition, all the authorizations (100.0%) from doctor 1811 went to doctor 5719, for a total of R$4,157,115.49.”
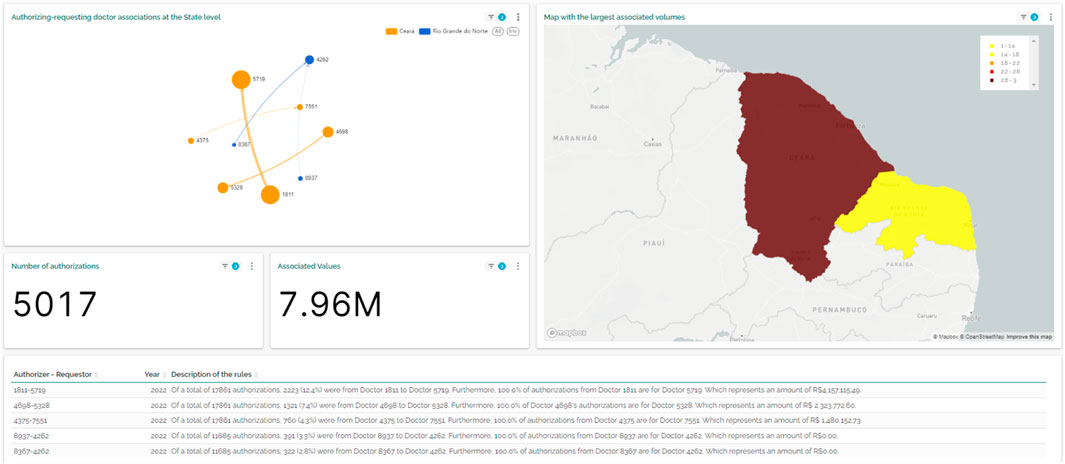
Figure 6. Dashboard of anomalous relationships between professionals.
Based on the classification of invoices performed by OPMinEr, Figure 7 presents a dashboard showing the number of OPMEs sold at an anomalously high rate. This panel aims to identify cases in which the quantity of a given material purchased by the health unit significantly exceeds the expected demand, suggesting the existence of sales with invoices that do not reflect reality, cold invoices and/or stolen stock.
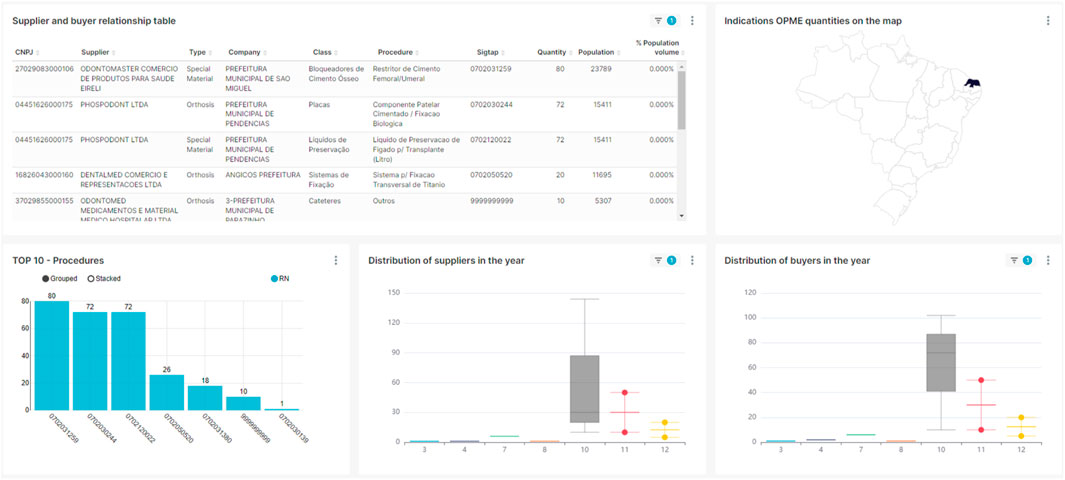
Figure 7. Dashboard of the number of OPMEs sold.
8.1 Discussion and lessons learned
Creating a knowledge model is an ongoing and challenging process. Initially, the priority was to collect data and pre-process the information needed to build the models. In this study, a meticulously curated dictionary (corpus) was constructed, drawing insights from several reliable sources. To gather the data from group 65- “EQUIPAMENTOS E ARTIGOS PARA USO MÉDICO, DENTÁRIO E VETERINÁRIO” do CATMAT, for example, a script was developed in the Python language. However, numerous adversities were encountered, due to the Federal Government’s website instability, which resulted in a considerable amount of time to gather all the available data. The script recorded when the site stopped responding and periodically tried to download the data. Figure 8 show an example of data.
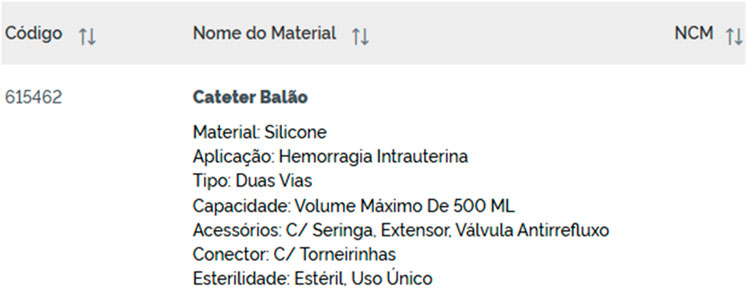
Figure 8. Example of CATMAT descriptions.
A peculiarity of this study is the predominance of invoices with products that are not OPMEs.In certain machine learning algorithms, such as Naïve Bayes, deciding whether to estimate the class probabilities from the training data is critical. When these probabilities are not calculated, the model considers them to be uniform, impacting the algorithm prediction process, especially in data sets with unequal class distributions, such as the one in question. For this reason, after tests carried out with and without calculating the priori probabilities in the algorithms, Multinomial Naïve Bayes showed greater accuracy when these probabilities were not calculated, differing from the other models tested.
In performance, the main idea behind the Gradient Boosting algorithm is to create a strong model from simple individual models. In each iteration, the algorithm builds a new decision tree to correct the mistakes made by the previous trees. This is conducted by assigning higher weights to the examples incorrectly classified in the previous model, allowing the new model to focus more on these cases. Despite the algorithm’s good accuracy, it was difficult to train the model, taking more than 4 days to train the data for the classification procedure.
In terms of winners, the Linear Support Vector and Random Forest algorithms differ in their approaches. The Linear Support Vector seeks to find the hyperplane that best separates the points of different classes in space, maximizing the margin between the classes. Random Forest consists of multiple decision trees trained on different subsets of the data set, and predictions are made based on the average or vote of the individual tree predictions. However, in some specific contexts or datasets, the performance of the two algorithms can be similar, as was the case in the study presented here. The algorithms stood out the most in terms of accuracy for the three types of classification and, based on the statistical tests, although Linear Support Vector has a higher accuracy, the algorithms are statistically similar.
8.2 Validity threats
To validate an experiment, it is necessary to consider issues that influence the result. This section presents the threats encountered during the experiment.
8.2.1 Building and internal validity
It is necessary to establish a cause-and-effect relationship between the treatment and the result. The invoice data obtained from the RN government was analyzed and processed by the authors, so this threat must be considered. To minimize this type of threat, the artifacts constructed for processing the data were approved and reviewed by more than one researcher and tests were carried out in the construction phase (construct validity) of the artifacts, as well as in the execution phase (internal validity).
8.2.2 External validity
Although the data is made available by the RN government, it cannot be guaranteed that there is not some kind of underreporting or incorrect information in the files, which could directly influence the results of the survey.
9 Final thoughts and future work
The problem involving the wrong coding and descriptions of OPMEs associated with wrong codes on invoices, as well as the use of these artifacts for taxation, inspection and investigation involves many areas and technologies. This study presented the results of a classifier, OPMinEr, through a controlled experiment, which is capable of classifying OPME invoices into three types: Type, Class, and Procedure, and which will support fraud detection. To assess its viability, an experimental process was carried out, since truly effective tools are becoming increasingly necessary as corruption also evolves with technological advances.
The experiment verified the metrics as: accuracy, sensitivity, precision, and F-1 measure. The highlight was the Linear Support Vector algorithm, which achieved above 99% accuracy for Type and Class classifications, and above 98% accuracy for Procedure classification. Regarding the efficiency of the algorithms, Multinomial Naïve Bayes scored highest with the fastest average training time for the three types of classification, and Decision Tree was the fastest in terms of average classification time. The Linear Support Vector was chosen because it demonstrated the best accuracy among all tested algorithms. Its superior performance indicates that the dataset's features are effectively separated in a linear space, making Linear SVM an optimal choice for this problem. The algorithm's ability to maximize the margin between classes ensures a high level of generalization, which is crucial for achieving consistent results on unseen data.
These classifications will optimize audits by AudSUS, which will be able to find clues such as anomalously high prices, quantities of OPMEs purchased per inhabitant, etc. As future work, other types of deep learning algorithms will be used and compared to create a hybrid metamodel, which can be configured according to the availability of architectures with high-performance Graphics Processing Units (GPUs). An example of this is the use of the BERT algorithm (Bidirectional Encoder Representations from Transformers), which is a language model capable of assigning a probability score to each word in a sentence. This is achieved by considering both the preceding and following context of a word in a sentence, allowing for a more complete understanding of the meaning of words.
Data availability statement
The original contributions presented in the study are included in the article/Supplementary Material, further inquiries can be directed to the corresponding authors.
Author contributions
WG: Writing–original draft, Writing–review and editing. MC: Writing–original draft, Writing–review and editing. LA: Writing–original draft, Writing–review and editing. RF: Conceptualization, Data curation, Formal Analysis, Funding acquisition, Investigation, Methodology, Project administration, Resources, Software, Supervision, Validation, Visualization, Writing–original draft, Writing–review and editing. RS: Conceptualization, Data curation, Formal Analysis, Funding acquisition, Investigation, Methodology, Project administration, Resources, Software, Supervision, Validation, Visualization, Writing–original draft, Writing–review and editing. BN: Conceptualization, Data curation, Formal Analysis, Funding acquisition, Investigation, Methodology, Project administration, Resources, Software, Supervision, Validation, Visualization, Writing–original draft, Writing–review and editing. CS: Conceptualization, Data curation, Formal Analysis, Funding acquisition, Investigation, Methodology, Project administration, Resources, Software, Supervision, Validation, Visualization, Writing–original draft, Writing–review and editing. RV: Conceptualization, Data curation, Formal Analysis, Funding acquisition, Investigation, Methodology, Project administration, Resources, Software, Supervision, Validation, Visualization, Writing–original draft, Writing–review and editing.
Funding
The author(s) declare that financial support was received for the research, authorship, and/or publication of this article. North-Rio-Grandense Foundation for Research and Culture (FUNPEC)/Federal University of Rio Grande do Norte (UFRN)/National Department of Auditing of the SUS (DENASUS) of the Ministry of Health of Brazil (Process Number: 53/2022).
Conflict of interest
The authors declare that the research was conducted in the absence of any commercial or financial relationships that could be construed as a potential conflict of interest.
Publisher’s note
All claims expressed in this article are solely those of the authors and do not necessarily represent those of their affiliated organizations, or those of the publisher, the editors and the reviewers. Any product that may be evaluated in this article, or claim that may be made by its manufacturer, is not guaranteed or endorsed by the publisher.
References
Batista, R. d., Bagatini, D. D., and Frozza, R. (2017). Classificação Automática de Códigos NCM utilizando o Algoritmo de Naïve Bayes. Rev. Bras. Sist. Inf 13, 4–29.
Carmo de Souza Cruz, R. a., Pedreira Marzullo, M., De Carvalho Barbosa Ramos, M., Peters, J. R., and Do Nascimento Cavalcanti, I. T. (2022). Análise do impacto do Banco de Preços em Saúde (BPS) para redução das assimetrias de informação dos preços de compras de Órteses, Prótese e Materiais Especiais (OPME). JMPHC J. Manag. and Prim. Health Care 14, e006. doi:10.14295/jmphc.v14.1200
Colaço Júnior, M., Cruz, R., Araújo, L., Bliacheriene, and A., and Nunes, F. (2022). Evaluation of a process for the experimental development of data mining, AI and data science applications aligned with the strategic planning. 19, 1807–1775. doi:10.4301/S1807-1775202219018
Correa, M. A., and Leal, A. (2018). “Identification of overpricing in the purchase of medication by the federal government of Brazil, using text mining and clustering based on ontology,” in ICCBDC'18: proceedings of the 2018 2nd international conference on cloud and Big data computing, 66–70. doi:10.1145/3264560.3264569
Cruz, R., Colaço Júnior, M., and Gois, V. (2022). Quão experimentais e estratégicas são as aplicações de Business Intelligence (BI) e Data Mining?; how experimental and strategic are business intelligence (bi) and data mining applications? Rev. Ibero-Americana Estratégia 21, e17689. doi:10.5585/riae.v21i1.17689
Django (2023). Django 4.1.7 documentation. Available at: https://docs.djangoproject.com/en/4.1/.
Dunn, O. (1961). Multiple comparisons among means. J. Am. Stat. Assoc. - J AMER STATIST ASSN 56, 52–64. doi:10.1080/01621459.1961.10482090
Federação de Indústrias do Estado de São Paulo (2010). Corrupção: custos econômicos e propostas de combate [Relatório]. Brasil: São Paulo, SP.
Field, A. (2009). Descobrindo a estatística usando o SPSS-2. São Paulo, SP, Brasil: Bookman Editora.
Gomes, W., and Colaço Júnior, M. (2022). “Applications of artificial intelligence for auditing and classification of incongruent descriptions in public procurement,” in Proceedings of the Brazilian symposium on information systems, 1–8. doi:10.1145/3535511.3535551
Instituto Brasileiro de Geografia e Estatística (2023). Produto interno bruto – PIB. Available at: https://www.ibge.gov.br/explica/pib.php.
Kratcoski, P., and Edelbacher, M. (2018). “Perspectives on fraud and corruption in the future,” in Fraud and Corruption. Editors P. Kratcoski, and M. Edelbacher (Springer: Cham). doi:10.1007/978-3-319-92333-8_14
Kruskal, W. H., and Wallis, W. A. (1952). Use of ranks in one-criterion variance analysis. J. Am. Stat. Assoc. 47 (260), 583–621. doi:10.2307/2280779
Mankiw, N. G., Romer, D., and Weil, D. N. (1992). A contribution to the empirics of economic growth. Q. J. Econ. 107 (2), 407–437. doi:10.2307/2118477
MLflow (2023). MLflow 2.3 documentation. Available at: https://www.mlflow.org/docs/2.3/.
Pedregosa, F. (2011). Scikit-learn: machine learning in Python. J. Mach. Learn. Res. 12 (Oct), 2825–2830.
PostgreSQL (2021). PostgreSQL 12.12 documentation. Available at: https://www.postgresql.org/docs/12/.
PowerBI (2023). Power BI desktop. Available at: https://powerbi.microsoft.com/.
Python (2021). Python 3.10. Available at: https://www.python.org/.
Ribeiro, L., Brandão, W., Marques, Í., Andrade, P., Júnior, R., Oliveira, F., et al. (2018) Reconhecimento de entidades nomeadas em itens de produto da nota fiscal eletrônica, 36, 116–126.
Salton, G., and Buckley, C. (1988). Term-weighting approaches in automatic text retrieval. Inf. Process. Manag. 24, 513–523. doi:10.1016/0306-4573(88)90021-0
Salton, G., Fox, E. A., and Wu, H. (1983). “Extended Boolean information retrieval,”Commun. ACM, 26. 1022–1036. doi:10.1145/182.358466
Santos, B., Colaço Júnior, M., Meneses Santos, R., and Nascimento, A. (2015). “Análise Comparativa de Algoritmos de Mineração de Texto Aplicados a Históricos de Contas Públicas,” in Proceedings of the Brazilian symposium on information systems.
Shapiro, S. S., and Wilk, M. B. (1965). An analysis of variance test for normality (complete samples). Biometrika 52 (3/4), 591–611. doi:10.2307/2333709
Spichakova, M., and Haav, H.-m. (2020). Using machine learning for automated assessment of misclassification of goods for fraud detection., (pp. 144–158). doi:10.1007/978-3-030-57672-1_12
TCU (2016). Auditoria em òrtese, Prótese e Materiais Especiais (OPME). Available at: https://portal.tcu.gov.br/biblioteca-digital/auditoria-em-ortese-protese-e-materiais-especiais-opme.htm.
Travassos, G. H., Gurov, D., and Amaral, E. (2020). “Introdução à Engenharia de Software,” in Experimental [relatório]. Rio de Janeiro, RJ, Brasil: Universidade Federal do Rio de Janeiro.
United Nations (2003). United Nations convention against corruption. Vienna, Áustria: United Nations Office on Drugs and Crime.
Vijayarani, S., and Janani, M. (2016). Text mining: open source tokenization tools – an analysis. Adv. Comput. Intell. An Int. J. 3 (1), 11. doi:10.5121/acii.2016.3104
Yue, Y., Zhang, Y., Hu, X., and Li, P. (2020). Extremely short Chinese text classification method based on bidirectional semantic extension. J. Phys. Conf. Ser. 1437, 012026. doi:10.1088/1742-6596/1437/1/012026
Keywords: orthoses, prostheses and special materials (OPME), health, audit, classification, artificial intelligence (AI), electronic invoices, corruption
Citation: Gomes W, Colaço Júnior M, Alves LPCF, Fontes R, Silva R, Nunes B, Silva C and Valentim R (2025) A smart classifier of orthoses, prostheses and special materials (OPMEs) in invoices. Front. Internet. Things 4:1436757. doi: 10.3389/friot.2025.1436757
Received: 29 July 2024; Accepted: 14 January 2025;
Published: 27 February 2025.
Edited by:
Kashif Saleem, King Saud University, Saudi ArabiaReviewed by:
John R. Talburt, University of Arkansas at Little Rock, United StatesShahid Saheb Shaiku, VIT-AP University, India
Copyright © 2025 Gomes, Colaço Júnior, Alves, Fontes, Silva, Nunes, Silva and Valentim. This is an open-access article distributed under the terms of the Creative Commons Attribution License (CC BY). The use, distribution or reproduction in other forums is permitted, provided the original author(s) and the copyright owner(s) are credited and that the original publication in this journal is cited, in accordance with accepted academic practice. No use, distribution or reproduction is permitted which does not comply with these terms.
*Correspondence: Wesckley Gomes, d2VzY2tsZXkuZ29tZXNAZ21haWwuY29t; Methanias Colaço Júnior, bWpyc2VAaG90bWFpbC5jb20=