- 1Department of Computer Science and Informatics, Cardiff University, Cardiff, United Kingdom
- 2Department of Computer Science, City University, London, United Kingdom
Due to an increase in the number of attacks on Industrial Control Systems (ICS), the security of these systems is now of paramount concern. Many solutions have been proposed to defend such systems, particularly those adopting Machine Learning (ML). The goal of this study is to increase the likelihood of the solution being deployed into a real environment. As part of that, multiple interviews were held with industry experts who have been embedded within ICS cyber-security for decades. The findings revealed that the current security solutions for ICS lack the sophistication required to be adopted due to flawed assumptions made about the end-user. Therefore, this work provides personas of each end-user group within ICS that need to be taken into consideration when designing a security solution. In addition, wireframes are provided showing what a desired solution could look like. By sharing these findings, it is hoped to inform those working within this space and increase the likelihood of their solutions being adopted within a real environment. Furthermore, the expert panel requested a number of features that do not currently exist within the ICS cyber-security space, therefore, by sharing these with the wider community, it is hoped that the field will move closer towards providing solutions containing these features.
1 Introduction
Industrial Control Systems (ICS) are inherently insecure due to the legacy devices used within them that are rarely, if ever, updated. In the past, such systems relied on the principle of “security in obscurity” which suggests that since the devices/technologies used are relatively unknown to most attackers, they are unlikely to be targeted (Byres and Lowe, 2004). It was also argued that since such systems are not connected to the wider internet, it would be very difficult, if not impossible, for anyone to establish a foothold on the system. The latter assumption no longer holds true with the advent of the Internet of Things and the push to connect devices that were traditionally not part of the internet (Leszczyna et al., 2011). Additionally, with the growth of the internet and availability of information, the principle of “security in obscurity” no longer applies. The flaws in the assumptions regarding ICS technology were most clearly demonstrated in the Ukrainian power grid attack in which at least 27 substations were taken offline (Case, 2016). Attackers were able to gain access to the systems controlling the power supply through remote access software installed on the internet-connected SCADA workstations (Case, 2016). As a result, they were able to cut off the power supply of 2,25,000 customers for a few hours (Case, 2016). Prior to the attack, the attackers were able to gain much of the information regarding the allegedly obscure devices operating at the substations from open-source resources on the internet (Case, 2016). Though it might be tempting to remedy such attacks by simply disconnecting ICS networks from the internet, the attack on the Iranian nuclear facility by Stuxnet demonstrates that even that does not guarantee safety since it gained a foothold via a USB connection Langner (2011). Additionally, since OT infrastructure is now so tightly interwoven with IT infrastructure, this is not a feasible option (Filkins et al., 2019).
Kaspersky reported in 2021 that one in three ICS were the target of malicious activity. In fact, Kaspersky alone blocked 20,000 malware variants on ICS devices (Kaspersky, 2021). The recent attack on Maersk by NotPetya showed just how fragile the entire infrastructure is and how easily it can be exploited. The incident was estimated to have cost Maersk up to $300 million (Greenberg, 2018). Far from fading into the background, these systems are now a common target amongst both nation-state actors and petty criminals as seen in the rise of ransomware as a service over 2021 (Dragos, 2021). Therefore, the security of ICS is now more pertinent than ever. Much literature has been published regarding the inherent insecurity of ICS devices and networks (Bonney et al., 2015; Wilhoit, 2013). Additionally, there are many solutions that look to pre-emptively find vulnerabilities as well as secure such devices/networks (Antrobus et al., 2016; Jardine et al., 2016; McLaughlin et al., 2016). However, securing ICS environments effectively requires exploiting user-centered design because operators of ICS systems often have different expertise and priorities compared to traditional network administrators. User-centered design ensures that security solutions are tailored to the specific needs and decision-making processes of ICS operators, making these solutions more effective and likely to be adopted. Therefore, the details regarding an attack that are communicated are much the same as those seen by network administrators managing traditional networks. However, administrators of ICS networks may not possess the same type of knowledge as operators of traditional networks and the information they want to see, therefore, may not overlap. Furthermore, unlike traditional networks where cyber-attacks almost always require a response, operators of ICS networks must weigh up the cost of responding to a cyber-attack against several other variables. For example, taking a network offline to stop an attack will not just affect profit but can have profound safety implications. Therefore, the goal of this research is to produce a more user-centric security solution that supports informed decision-making by considering the unique requirements and restrictions within an ICS environment. Creating such a solution is time-consuming since it requires iteration, with regular back and forth between experts in the field and developers, but it has the benefit of being more likely to support the experts and capture their real needs as they develop. Ultimately, this means it is more likely to be employed in a real environment. Therefore, the goal is less about achieving a technological breakthrough but in using technology as a means of iteratively probing and ultimately capturing the requirements of ICS operators within a security solution.
To achieve this, the initial focus was on producing a novel visualisation that can better illustrate the competing variables within ICS. However, through interviews with the expert panel, it became clear that a visualisation alone will not suffice. Therefore, the aims of the project were altered accordingly and, taking a step back, the first goal was to capture the requirements of ICS security, particularly in how it differs from traditional network security. This was accomplished through interviews with industry experts in ICS. Using the input from interviews, personas of the various actors involved in the decision-making process were produced to represent all the differing requirements. Following that, wireframes of a potential solution were created to take back to the experts to determine if the unique needs within ICS had been accurately captured. After further iteration through the wireframes, the aim is to produce a technical prototype of the refined solution. The contributions in this research are as follows:
Due to the volume of insight generated from the interviews with the expert panel, it was deemed appropriate to publish these separately. The hope is that this will provide valuable information to the wider research community with regards to the current needs within ICS cyber-security. The rest of the paper is structured as follows: The Background section reviews existing literature on ICS security. The Methodology section outlines the research approach, including expert interviews and the development of personas and wireframes. The Findings section presents insights from these interviews. The Design and Implementation section discusses the proposed user-centered security solution. The Evaluation section assesses the effectiveness of the solution. Finally, the Conclusion summarizes the contributions and implications of the research.
2 Background and theoretical framework
This paper contributes to the user-centred design of IDS for ICS. Given the early stage of this field, insights have been drawn from related areas to inform our approach.
2.1 Intrusion detection systems in ICS
ICS environments are particularly suited to IDSs, especially those employing anomaly detection, due to the repetitive and predictable nature of device communications (Zhang et al., 2015; Hadžiosmanović et al., 2014). Numerous IDS solutions for ICSs have been proposed, typically focusing on either physical-level or cyber-level monitoring (Koucham, 2018). Physical-level monitoring involves assessing the actual physical processes and controller communications for deviations, while cyber-level monitoring focuses on communications and devices above the PLC level (Hadžiosmanović et al., 2014; Caselli et al., 2015; Beaver et al., 2013; Zolanvari et al., 2019; Gómez et al., 2019; Lin et al., 2017). However, most of these solutions emphasize attack detection, often simplifying outputs to binary classifications of “malicious” or “benign.” This approach, while functional, is not always informative for end-users, especially those not specialized in cybersecurity.
2.2 Security challenges in SCADA systems
A critical gap in existing ICS security solutions is the lack of user-centred design. Traditional security tools prioritize data over user experience (Staheli et al., 2014) while user-centred design focuses on the needs and limitations of end-users, involving them throughout the design process (Mckenna et al., 2015). The recruitment of cybersecurity experts for such iterative design processes can be challenging due to the time commitment required (Botta et al., 2007). Hence, user-centred design has shown promise in broader network security visualization contexts.
2.2.1 User-centred design approaches
Ocelot, a network visualization tool, exemplifies the benefits of a user-centred approach. Developed through expert interviews, Ocelot uses a petri dish visualization to provide an overview of network activity, with interactive features like a quarantine panel and zoom capabilities added based on user feedback (Arendt et al., 2015; Gersh and Bos, 2014). Similarly, Zhao and Silverajan (2022) created user-centred dashboards for smart building cybersecurity, identifying key user groups and tailoring visualizations to their needs. These studies demonstrate the value of involving end-users in the design process to create more intuitive and effective security tools.
2.2.2 Cybersecurity visualizations and personas
Mckenna et al. (2015) present the utility of qualitative coding, personas, and data sketches in cybersecurity visualization, leading to the development of BubbleNet, an interactive cybersecurity dashboard. This tool, created through an end-to-end design study, provided principles for effective cybersecurity visualization (McKenna et al., 2016). Furthermore, Grobler et al. (2021) emphasized the importance of clear communication between security tools and their users, identifying poor communication as a significant security risk.
2.3 Advancements in SCADA security
Recent advancements in SCADA security have leveraged ML to improve detection accuracy and reduce vulnerabilities. Rabie et al. (2023) introduced an optimized security model that integrates classification algorithms, achieving notable improvements in detection performance. Khadidos et al. (2022) demonstrated the benefits of incorporating learning algorithms in SCADA networks, enhancing security and resource management. Additionally, various ML methods have been evaluated for their effectiveness in detecting malicious SCADA communications, providing valuable insights into their strengths and limitations (Rabie et al., 2022; Chen et al., 2014).
2.4 Theoretical framework
Our research is based on a theoretical framework that combines concepts from IDS, optimization techniques, and user-centered design to guide the development of a robust and user-friendly security solution for SCADA environments.
2.4.1 Core components of SCADA security
SCADA systems monitor and control industrial processes such as electricity generation and water treatment. Despite their importance, these systems often use outdated devices, making them vulnerable to cyber threats (Kayan et al., 2022). The integration of SCADA systems with modern IT infrastructures and the IoT introduces significant security challenges. Historical incidents, such as the Ukrainian power grid attack (Case, 2016) and the Stuxnet virus (Langner, 2011) are an example of how these vulnerabilities can cause disasters. Addressing these challenges requires advanced detection and prevention mechanisms tailored to the SCADA context.
2.4.2 Relevant theories and models
2.4.2.1 Intrusion detection systems (IDS) in SCADA
IDS are essential for detecting malicious activities in SCADA systems. Both anomaly-based (Kreimel et al., 2017) and signature-based (Kwon et al., 2022) IDS are used, with anomaly-based IDS being particularly effective for unknown threats. These systems must differentiate between normal and abnormal behavior in real-time.
2.4.2.2 Optimization-based IDS
Recent advancements in IDS have employed optimization techniques to enhance detection accuracy and reduce false positives. The combination of the Whale Optimization Algorithm (WOA) and Graph Neural Networks (GNN) has proven effective in optimizing feature selection and capturing complex network relationships. Shitharth et al. (2021) describe the use of the WI-CS and GNN algorithm for anomaly detection in SCADA networks, demonstrating significant improvements in identifying and categorizing anomalies through data optimization. Initially, real-time SCADA datasets are inputted, and machine learning algorithms cluster and optimize these data. This approach enhances detection capabilities and efficiently identifies the type of intrusion, making it a robust solution for securing SCADA systems.
2.4.2.3 Hybrid unsupervised algorithms for IDS
Hybrid unsupervised algorithms, such as Mutated Self-Organizing Maps (MSOM), enhance anomaly detection by leveraging unsupervised learning to identify unknown threats. MSOM improves upon traditional Self-Organizing Maps (SOM) by addressing key limitations such as learning rate dependency and neighborhood size issues. In this approach, the median distance between each node and its neighbors is calculated to identify anomalies, with significant deviations flagged as potential threats. Additionally, quantization error is used to detect outliers within the network. By eliminating external influences on the learning rate and focusing solely on internal variables, MSOM achieves more accurate and efficient clustering, hence enhancing the respond to evolving threats in SCADA environments. This dual-phase methodology ensures robust intrusion detection and minimizes false positives (Sangeetha et al., 2022).
2.4.2.4 User-centered design in security solutions
It ensures that cybersecurity solutions are user-friendly by involving end-users in the design process. Iterative design and continuous user feedback are crucial for creating intuitive and effective security tools, as demonstrated in previous studies (Mckenna et al., 2015).
2.4.3 Integration of theories into our study
Our research integrates optimization-based IDS and hybrid unsupervised algorithms with user-centred design principles to develop a user-centred IDS for SCADA systems. By understanding the specific security challenges and operational patterns of SCADA systems, we aim to create an effective and user-friendly security solution.
The proposed solution combines the aforementioned principles with advanced IDS techniques, addressing both technical and user-related challenges. The iterative design process, guided by expert feedback, ensures the effectiveness and practicality of the solution. Visualizations and interfaces tailored to diverse user groups enhance decision-making capabilities. Our research demonstrates the value of integrating such a design with advanced IDS techniques in SCADA security. The findings provide a foundation for future research and highlight the importance of user-centred approaches in enhancing cybersecurity.
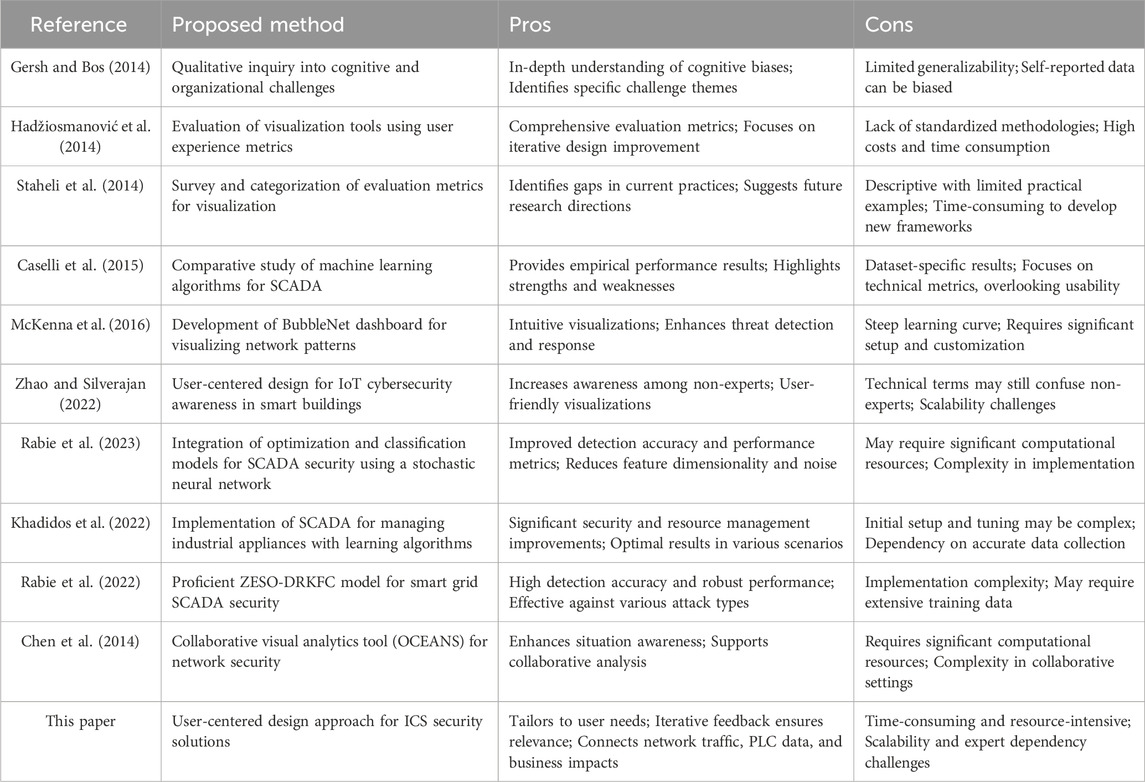
In summary, our theoretical framework integrates insights from IDS optimization, hybrid unsupervised algorithms, and user-centred design to develop a robust security solution for SCADA systems. This approach addresses technical challenges while ensuring user-friendliness and practicality for real-world applications, aiming to make significant contributions to SCADA cybersecurity. A summary of related work is presented in Table 1.
2.4.4 Access policies in SCADA security
Access policies play a critical role in the security framework of ICS. These policies define who can access the system, what resources they can interact with, and under what conditions. The effectiveness of access policies is paramount to ensuring the security and integrity of ICS environments.
Access policies are particularly relevant to our research as they directly impact the user experience and the practical applicability of the security solutions being developed. A well-designed access policy ensures that the right users have the right level of access, thereby reducing the risk of insider threats and accidental breaches. Integrating access policies into the user-centered design framework involves understanding the specific needs and behaviors of different user groups and tailoring access controls accordingly.
There are several types of access policies commonly implemented in ICS:
In real-world ICS environments, the implementation of access policies needs to be pragmatic and tailored to specific operational requirements. For example, in a power plant, access to critical system controls must be restricted to highly trained and authorized personnel only. This reduces the risk of accidental or malicious interference. To evaluate the practical applicability of access policies, several factors need to be considered:
The effectiveness of access policies can be assessed by examining their ability to mitigate security risks and their adaptability to evolving threats. In recent years, several high-profile cyber-attacks have demonstrated the importance of robust access policies (Etigowni et al., 2016). For instance, the Stuxnet attack exploited weak access controls to infiltrate and manipulate critical infrastructure. In contrast, environments with well-implemented RBAC and continuous monitoring have shown greater resilience against such attacks.
In a medium-sized water treatment facility, RBAC was implemented to segregate access to various system components (Deng et al., 2021). Engineers had access to system configurations and maintenance tools, while operators had access only to operational data and control interfaces. This segregation ensured that any compromise in operator credentials would not impact critical system settings. Regular audits and monitoring further reinforced the security, allowing for quick detection and response to any unauthorized access attempts.
By integrating access policies into our user-centered design approach, we ensure that our IDS solutions are not only technically robust but also practically applicable and user-friendly. This holistic approach to security design addresses both the technical and human factors, enhancing the overall effectiveness and adoption of the security solutions in real-world ICS environments.
3 Methodology
ISO 9241-210 “Ergonomics of human-system interaction” (ISO, 2010) defines human-centred design as development that “aims to make systems useable by focusing on the users, their needs and requirements, and by applying human factors/ergonomics, and usability knowledge and techniques.” ISO 9241 states that a principle of human-centred design is “an explicit understanding of users, tasks and environments” and points out that this is an “iterative” process. With this in mind, the design methodology drawn from is Action Design Research (ADR) (Sein et al., 2011) (see Figure 1), in particular, with regards to visualisation (McCurdy et al., 2016). Figure 1 presents the four stages and seven principles of ADR, illustrating how this iterative process informs the development of user-centered security solutions by continuously reflecting on real-world practices, theory, and feedback from stakeholders.
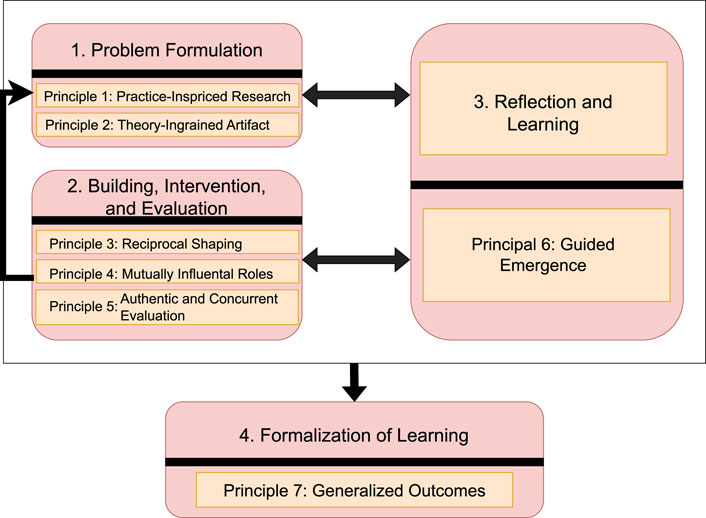
Figure 1. Action design research four stage model taken from Sein et al. (2011).
ADR is composed of four stages and seven principles. The cycle between stages 1, 3, and 2 are testament to its emphasis on continued reflection and evaluation, something that was particularly important throughout the project. The seven principles have also guided the choices and work, as will be alluded to throughout this report.
The first principle of the first stage of ADR - “Practice-Inspired Research” - states that real-world problems should be underpinning the research (McCurdy et al., 2016). Therefore, the first task was to understand the ICS sector better and the problems it is facing. There are several qualitative methods by which requirements can be established Hennink et al. (2020). Interviews are by far the most popular method within cyber-security (Fujs et al., 2019) and are particularly appropriate for this project. Unlike surveys, interviews allow for the collection of unstructured information and open-ended questions (Edgar and Manz, 2017). They also allow for follow-up questions and requests for clarifications, important in a complex field and where individual expertise is core to solution building. These are all particularly relevant since there was no clear solution in mind to build. Another advantage of interviews is that, unlike observation, it is not necessary to be on-site to collect data. Rather, the goal is to better understand the needs within the ICS environment.
A semi-structured interview with experts in the field using open-ended questions was chosen. The purpose of the interviews was to establish and better understand how ICS differs from the traditional network security domain since traditional network security is already familiar and very well documented. Inspiration for questions was taken from (Lam et al., 2012) as they provide lists of questions to ask when evaluating visualisation solutions and one of the goals was to evaluate the current methods/tools employed within ICS. The literature has thoroughly documented the technical differences between the two domains with regards to devices and inbuilt security, however, through interviews the goal was to capture the differences within processes and personnel expertise. When choosing an interview panel, the third principle of ADR, “Reciprocal Shaping,” was particularly relevant. It emphasises a need for diversity of perspectives in the team informing the design McCurdy et al. (2016). The team and expert interviewees come from a range of backgrounds. The panel of interviewees consists of practitioners in ICS security with varied experience working within a variety of different ICS sectors. Likewise, the team consists of visualisation and cyber-security experts, but, with “mutually influential roles” (as stated in principle four).
The second principle of the first stage “Theory-ingrained Artifact” emphasises the importance of drawing upon the literature and existing solutions to inform the work. There are several solutions that were looked at and documented in previous reports, some that were particularly relevant include (Komlodi et al., 2005; Fischer and Keim, 2013; Cappers and van Wijk, 2016; Boschetti et al., 2011). A lot of inspiration for design was also taken from (Mckenna et al., 2015) as alluded to later in this section. This also fed into the third stage and sixth principle “Guided Emergence” which suggests that the research be informed by the literature and context in which it sits (McCurdy et al., 2016). The initial designs (such as the dot plot mentioned later) were informed more from the literature than from the meeting with the experts. Having met the experts, the aim was to refine the requirements of the solution.
Following the expert interview, it was necessary to represent the information in forms that would eventually meet the real needs of ICS analysts. The first method chosen to better understand the requirements was to create personas. A persona is a representation of a category of users, highlighting their requirements from the system (Maguire, 2001; Cooper, 1999). Personas can help to identify “actionable knowledge” from the interviews (Mulder and Yaar, 2006). They also allow for the identification of the user types that the system is being designed for. The inspiration for using personas came from (Mckenna et al., 2015). In their paper “Unlocking user-centered design methods for building cyber security visualization,” they explain how a number of design methods helped to produce two successful real-world cyber-security visualisation solutions. One method they chose to employ was personas since they “concluded that more than one type of user was meant to utilize the dashboard” (Mckenna et al., 2015). Given the variety of users involved, this widely used method was adopted (Mckenna et al., 2015; Stoll et al., 2008; Chang et al., 2008; Pruitt and Grudin, 2003; McGinn and Kotamraju, 2008; Martin et al., 2012; Faily and Flechais, 2011).
Finally, once the requirements were represented, the design stage, the second stage of ADR (the building, intervention and evaluation cycle) was commenced. Since the design is still in the early stages, wireframes were created as they are clearly informal and therefore easy to discard and recreate. Due to this, the experts are less likely to be reluctant to suggest redrawing an entire interface since they can clearly see that it did not take much effort to create them. Wireframes have been shown to be an effective way to bridge the knowledge gap between domain experts and visualisation experts, particularly if incorporating real data (Lloyd and Dykes, 2011). Additionally, they are particularly appropriate in early design stages (Maguire, 2001). Wireframes allow for trialing several different interface designs very quickly with little investment in time, money or emotion. This gives the stakeholders essential input early on in the design process to influence designs, establish needs and change any aspects that do not fit their requirements as requirements and designs develop. The benefits of wireframing have long been recognised (Heaton, 1992; Rudd et al., 1996), but achieving this in data prototypes is challenging given the investment needed to produce these. Balsamiq (Faranello, 2012) was used to do this rapidly in a manner that was lightweight for developers and both meaningful and engaging for other stakeholders as requirements and designs were shaped in a reciprocal manner around the prototypes.
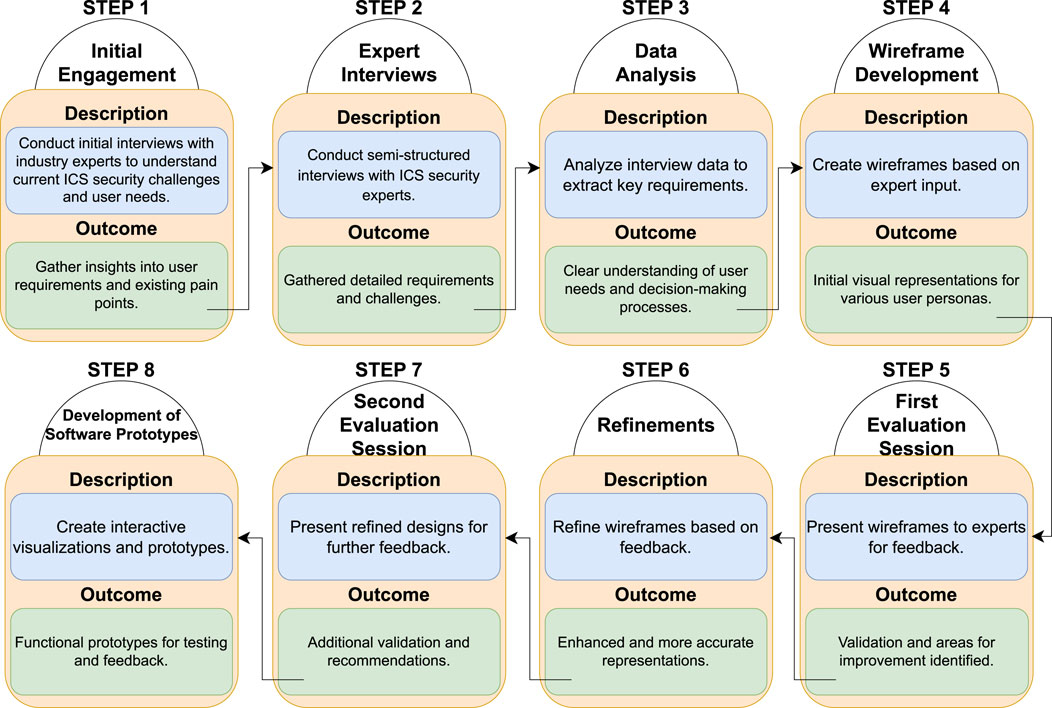
Having represented the requirements, another interview with the panel was arranged to evaluate the interpretation of the requirements (as represented in the personas and wireframes). While this does not represent the finished product, principle 5 of ADR emphasises concurrent evaluation. Continuous evaluation is emphasised within the second stage which consists of a cycle of building, intervention and evaluation. While principle 5 also suggests evaluating the solution within its desired context, that would be more applicable when the solution is further developed. Currently, three meetings with experts have been held. The first was an informal meeting to get familiar with one another and the work. The latter two (which are discussed below) were formal sessions to outline and flesh out the requirements and design for the system. Following this, as the project moves towards a technical implementation of a system, more sessions will follow to continuously evaluate the artefact. The aforementioned methodology prior to final prototype is illustrated in Figure 2.
4 First session
4.1 Expert interviews
The interview was conducted with a panel of three industry experts, each working for a different organisation that specialises in ICS security. The experts possessed a wide range of experience, some in multiple organisations within this field. In total, the interview lasted just over 2 h.
The content of the interview is provided below through a synthesis of the discussions that took place. Any questions in a similar vein that were discussed as a single unit have been listed together. After summarising the answers, the requirements for the system obtained from the answers to all the questions are listed. The first set of discussion questions asked are listed below.
1. What data would you expect to have available in real time? For example, Network data, device-level data or physical data.
2. What experience level would you expect people to have? Will they have the capability to examine traffic traces and log files?
The first of these questions aims to understand what an end-user needs to see to be able to solve the problem. The second question seeks to determine how that information would need to be displayed or communicated to assist the user in solving the problem. This is particularly important within ICS, since unlike with traditional networks where the end-user of a monitoring solution tends to be a network administrator who is well understood and defined. Within ICS, it is not clear who the end-user of a cyber-security solution would be and what their level of expertise would be.
The experts said that in their experience, most people working in an industrial environment do not have the expertise necessary to analyse network or physical data. For example, safety engineers don’t tend to look at IDS alerts. The experts felt that what is needed is a system that can display a network diagram or alert with different views so that depending on who is viewing it at the time can choose the view relevant to them. For this to be successful, the system would need to have a link between network traffic, PLC data and business cost. This would allow someone more concerned with the business side of an ICS looking at an alert to see how much the attacked device or process is earning them per day. Whereas a safety engineer would be able to see how an attack on a device will impact safety at the plant. The experts also alluded to the problem that network data and alerts were completely decoupled from safety alerts.
The experts also said that linking network traffic features to process integrity impacts and costs would be useful. The potential business impact is often known, as are the impacts of not meeting regulatory requirements, but links between attacks and their impacts, and the potential business impact are lacking. Linking Indicators of Compromise (IOC) to business need/solution is key.
The reason for needing the different views is that when it comes to making a decision regarding an attack, there are many stakeholders, some with a background in OT, some with an electronics background, some that are business owners, and some will be network administrators. All of them are part of the decision-making process. Therefore, a system communicating about cyber-attacks should be able to speak to people who come from more than one domain in an integrated and transparent way.
The experts were adamant that the decision-making process should not be automated but made easier for actors from different backgrounds to make an educated decision regarding the best response. The system could empower network administrators to make decisions by comparing an attack against a provided risk tolerance. If the system is provided with a risk tolerance (minimum operating requirement), it can calculate the breach of such tolerance by determining how much the attacked process is earning per time unit. Additionally, the level of degradation (minimal, partial, full shutdown) it will face from an attack can be factored into this. Putting a price on things is key.
When providing alerts about attacks, the experts stressed that a confidence rating is important. People need to know how confident the system is in the alert. The system should also be willing to demonstrate how it has produced its confidence value.
3. How is the data used to make a decision?
a. Who is currently involved?
b. What intel do they require?
c. How is the information used to decide how and when to act?
d. What level of confidence do they require?
e. What is currently missing?
In this question, further details on the decision-making process that takes place within an ICS environment in the event of a cyber-attack were sought. Understanding what is missing from current solutions was also an objective.
The experts gave an example of a reporting chain for decisions; however, they were quick to point out that this might not generalise across all sectors. Usually, the first point of contact is the operations team running the day-to-day activities followed by more specialised engineers (IT, safety, maintenance, basically people with a deeper knowledge of the processes). They would then communicate with SOC analysts which may have engineers as part of their team but may not. Eventually, this communication chain would reach up to the board. The difficulty within this chain is that everyone has different interpretations of when to make decisions. Some of the factors that feed into the decision are the internal safety of personnel and equipment, the internal risk, and whether any regulatory requirements are being infringed.
The experts said that in their experience the time taken to make a decision would depend on the type of alert. With anything that is an imminent safety problem, the decision will be made in hours. Regulatory violations can be resolved within hours, but it could also take days or even weeks. Business risk usually takes longer to be addressed. However, this can be quicker if the ground staff know who the point of contact is for each issue. For instance, if they’re facing a brute force attack, they can wait, if they have elevated privileges, they need to act. Likewise, uploading firmware, modifying ladder logic are important issues. This comes back to key things to alert for.
The experts said that the problem currently is that they don’t have the data they need, and decisions are being made very late. In some cases, it comes down to luck as to whether the right thing is done at the right time. Therefore, a successful security system doesn’t just need to provide the necessary technology but needs to get people talking to each other. This can be done through the amount and type of data that is displayed. In addition, it can help communication to display the risks on a qualitative scale (low, medium and high) because this prevents people from needing to put a number on it. It also avoids conflict over specifics on the numbers. However, again an important point is the audit log, providing an explanation on how the decision was made.
4. How would this be best displayed?
a. What attributes of network/device data would you need to see?
b. What connections would you like to see?
c. What type of data? PCAP? Netflow?
d. What level of granularity – IP addresses, ports, devices?
The experts agreed that firmware updates with matches to changelog need to be visible in such a system. They mentioned the company Adolus, which contains a list of legitimate firmware. Having a list like that would mean that it could be checked if any firmware updates being sent to devices are legitimate firmware. Though this will not prevent someone from sending legitimate firmware to the wrong device. They also pointed out that, unlike most networking tools, displaying an IP address is rarely helpful, users need to know “this RTU controls engineering capability X.”
With regards to risk ratings, they suggested looking at CVSS and EPSS scores for inspiration. Additionally, value can be attached to devices based on the amount of network traffic going in and out of each device.
The following is the list of requirements captured from the interview:
1. Provide different views that cater to staff with differing interests and expertise.
a. Provide a visual for network administrators/SOC analyst
b. Provide a visual for engineers/safety engineers
c. Provide a visual for business directors
2. Link network traffic to safety alerts
3. Provide a Risk tolerance and an attack’s potential breach of that
a. Provide an estimated monetary loss from an attack
(1) Attach financial value to each device
(2) Attach financial value to a process
4. Attach confidence levels to alerts that indicate the warning system’s confidence in the alert
a. Provide an audit log on how the confidence rating was calculated
5. Provide qualitative risk rating
a. Provide an explanation for how the risk rating was calculated
6. Provide more than an IP address for each device
a. Provide information about the process controlled by the device
b. Provide information regarding the type of device (RTU/PLC etc.)
7. Assess importance of devices based on percentage of network traffic flowing through each device
4.2 Requirements encoding
4.2.1 Personas
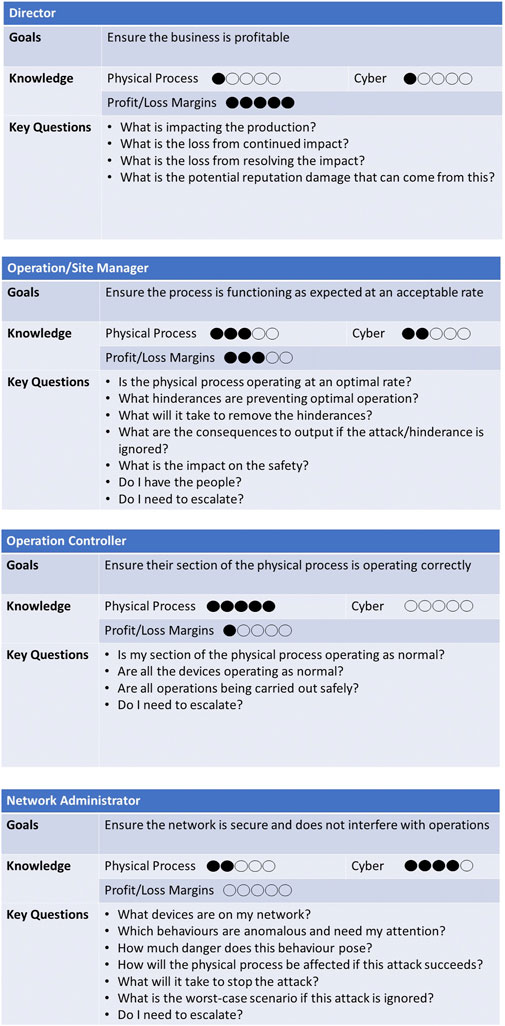
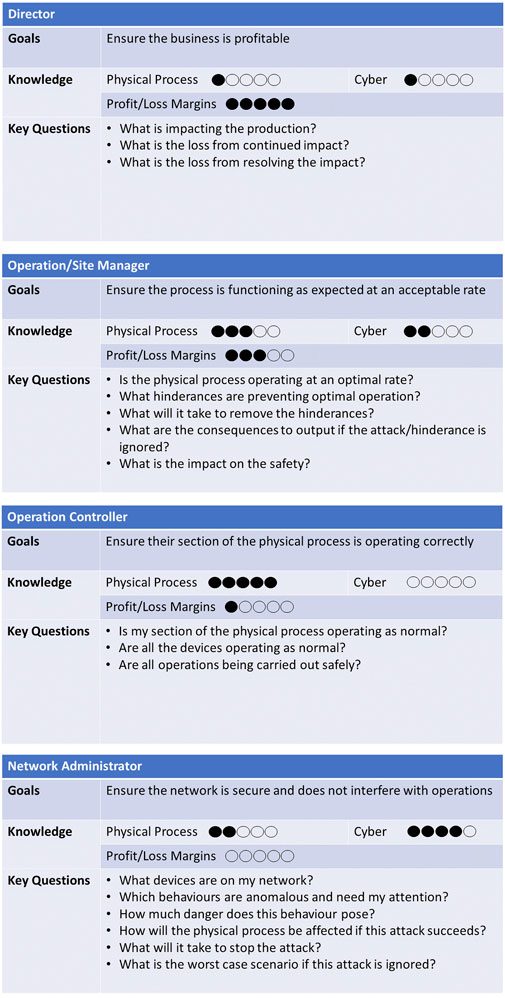
On capturing the requirements from the expert interviews, the personas felt particularly appropriate for the type of system described by the experts since it needed to produce information relevant to people from a very wide range of backgrounds. The personas created are shown in Figure 3.
The personas created represent the main dilemma highlighted during the interview, in that each of the actors present in an ICS environment making decisions have different levels of knowledge about each aspect of the system. The knowledge of personnel is categorised using three variables: 1) Physical Process: This refers to the user’s knowledge of what is being controlled or produced within the plant. For example, within a power plant, this would refer to their knowledge of how the plant produces electricity and what it needs to operate correctly. 2) Cyber: This refers to the user’s knowledge of the network and its security. Users that have knowledge here understand how devices are connected to one another and whether they are being attacked but are unlikely to know how the devices contribute to maintaining the physical process. 3) Profit/Loss Margins: This refers to a user’s knowledge of the financial operation of the company and, particularly, its tolerance levels for any disruption.
The key questions within each persona highlight the concerns of that particular user group. This can be particularly helpful in ensuring that an end-product meets the needs of the group(s) that it is targeting.
4.2.2 Wireframes
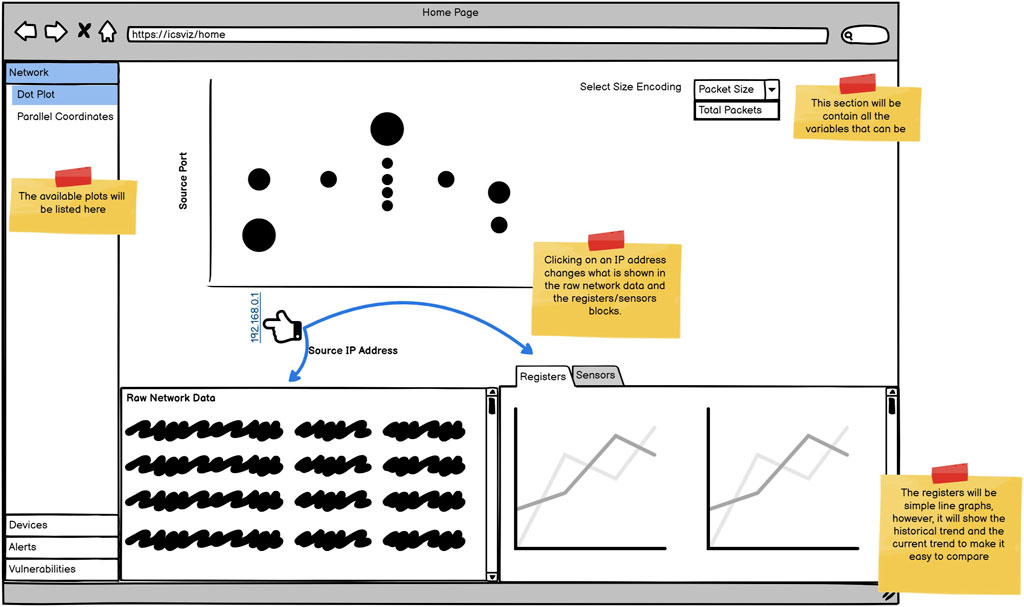
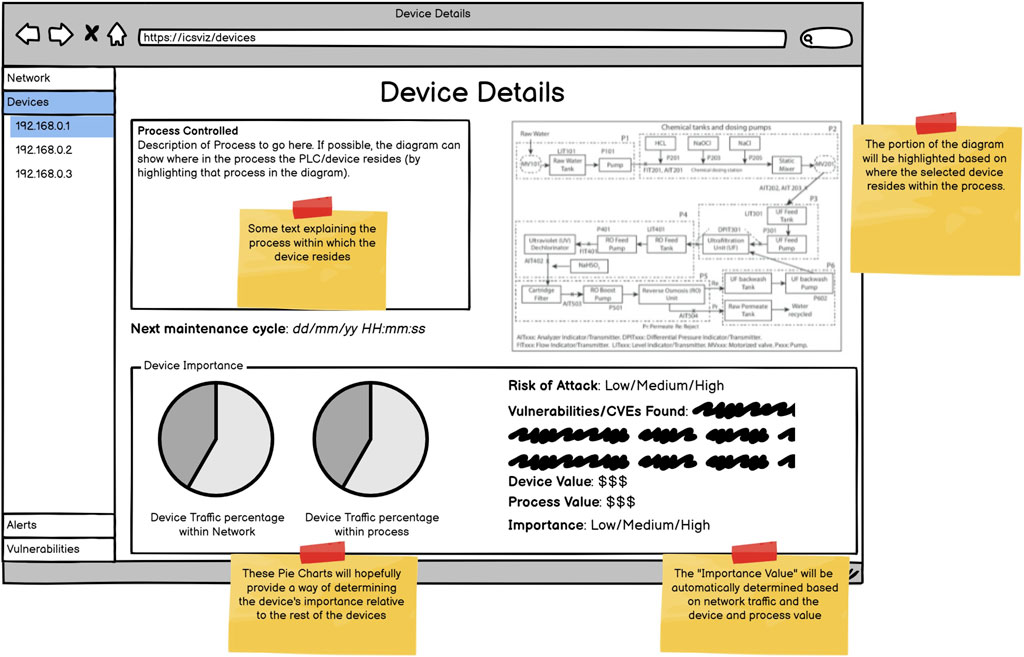
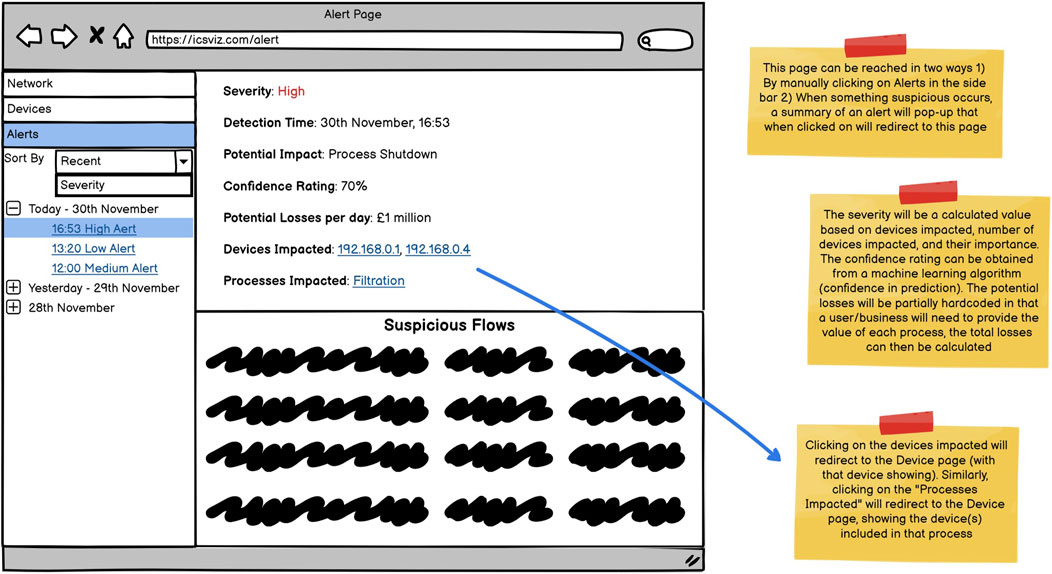
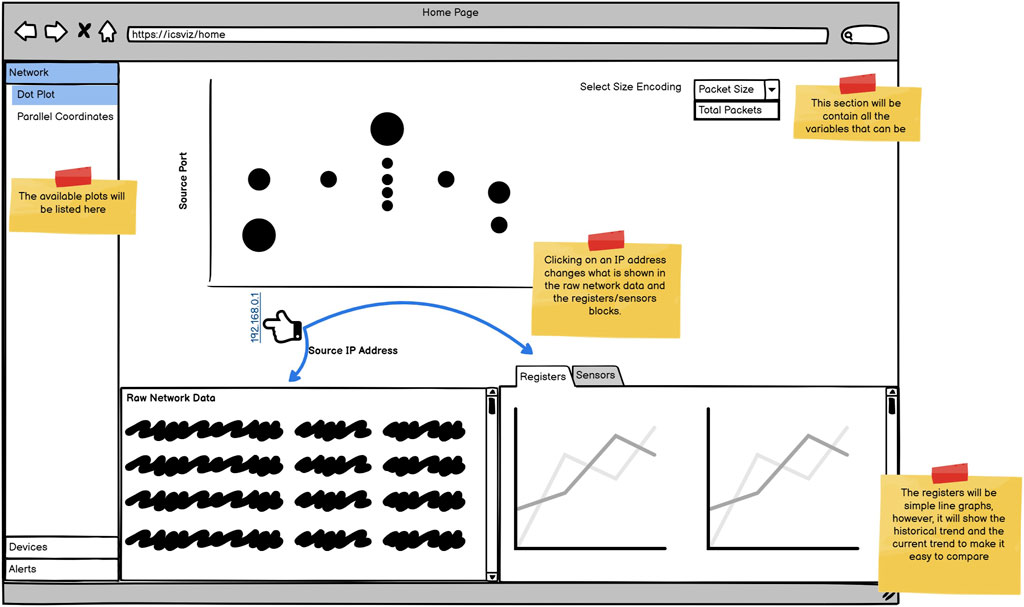
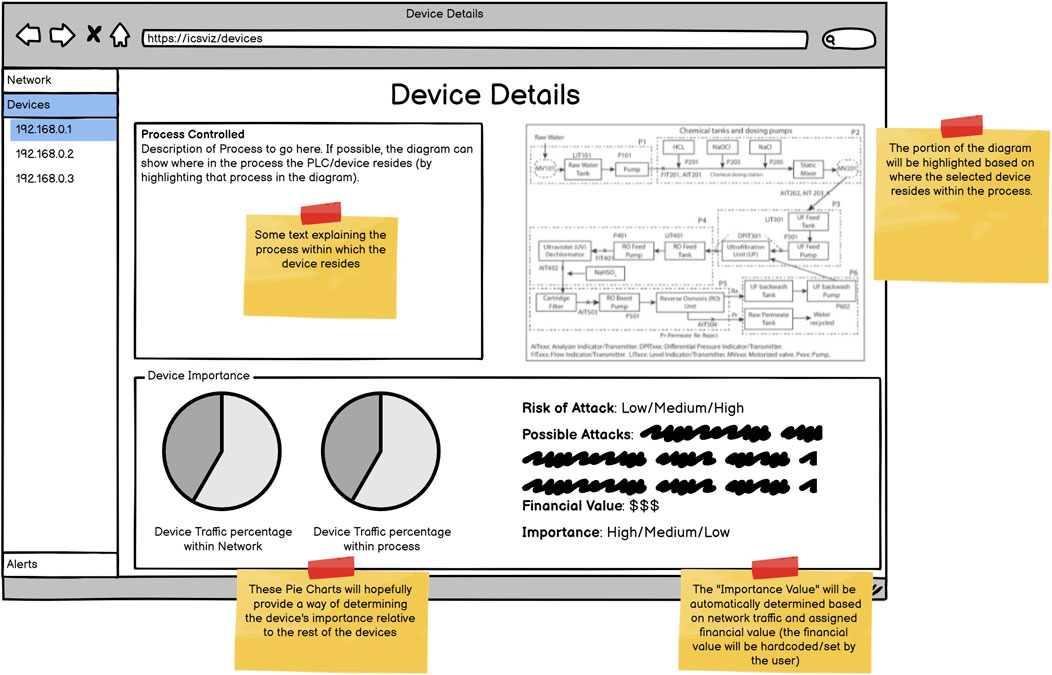
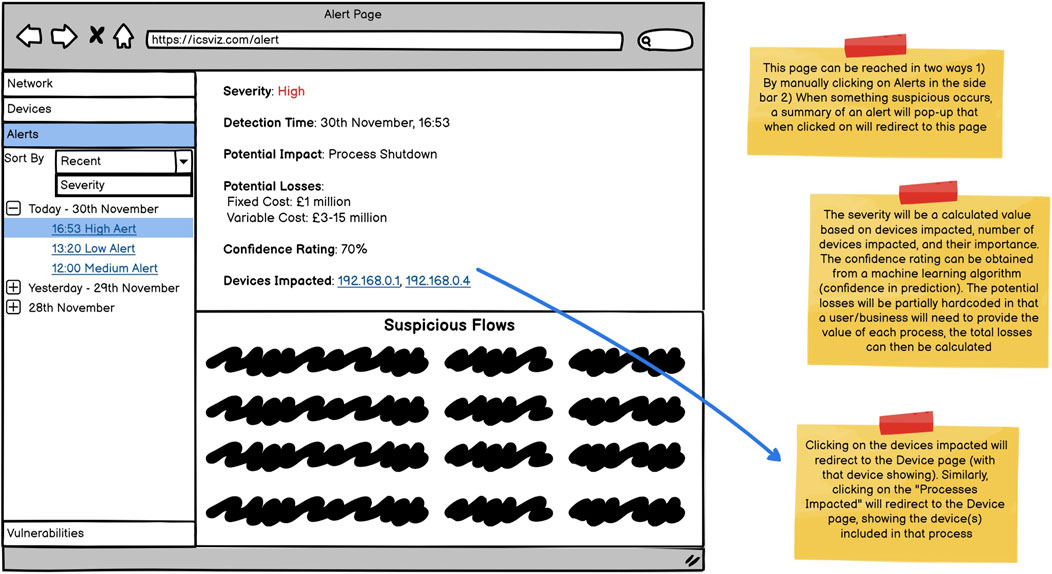
In addition to personas, wireframes were created to take back to the experts before starting implementation, these are shown in Figures 4–6. The wireframes are annotated to describe how they behave when a user interacts with them, and aim to provide different views to different users as requested in R1.
The solution is split into three pages. Figure 4 shows the overview page that will provide an overview of what’s happening on the network. A dot plot is presented as the main graph to visualise the traffic within the network, and a demo of it using real data is available1. Avoiding any visuals using three dimensions, as they are overwhelmingly ill-advised (Komlodi et al., 2005).
The intention with the overview page is to meet R6. While displaying the IP address of devices, these labels will be modifiable to a user-supplied value, and clicking on them displays many more details about the device allowing different users to identify the device’s purpose. Hovering over an IP will also display some simple identifying features of the device. To view even more details about the device, the user can navigate to the device page (Figure 5). This fits in with the generic but useful Overview First, Zoom and Filter, Details on Demand pattern described by Shneiderman (2003). Here, the interface will describe and show the physical process that the device is a part of (for example, within a water treatment plant this may be chlorination). The location of the device within the process will also be highlighted in a schematic diagram showing a high-level overview of the processes used within the plant. The example shown in Figure 5 is taken from the SWaT water treatment testbed (Mathur and Tippenhauer, 2016). In addition, details regarding the financial value of the process controlled by the device are provided as well as the importance of the device to meet R3. The importance of the device will be calculated based on the percentage of traffic flowing through that device in keeping with R7. This would inevitably have the effect of marking the network switches as extremely important devices, however, the experts did not feel that would be inconsistent. To meet R5, the device page includes a qualitative risk rating indicating how vulnerable the device is to an attack. The explanation for the risk includes the attacks that the device is vulnerable to. The rating, alongside the possible attacks, can be determined by a vulnerability scanner.
Finally, the alert page will allow a user to view additional details about any alert (Figure 6). Importantly the alert will include a confidence rating providing an indication of the security system’s confidence in the alert as specified in R4. As ML is used to detect attacks, the confidence rating will be supplied by the classifier. Additionally, it will include the potential losses that could be incurred if the issue is not resolved as required in R3. Alerts will also contain the network traffic/flows that resulted in the alert being triggered. This will allow network administrators to dig into the data if they want to investigate further. In addition, by showing the potential physical impact (under “Potential impact”), R2 is fulfilled.
The system as a whole meets R1 by providing a network-oriented view on the home page for SOC analysts/network administrators, a device-level view on the device page for factory operators and financial details shown within the device and alert pages.
4.2.3 Software prototypes
A number of visualisations of the network data were created in order to get a better idea of what the expert panel think users operating an ICS would need to see on that front. The visualisations use data from the testbed and the SWaT testbed (Mathur and Tippenhauer, 2016). Each of the visualisations allow a considerable amount of customisation from the user since this was thought to generate a high degree of insight. As mentioned previously, the first visualisation shown to the end-users was a dot plot that allowed the user to customise the size encoding for the dots, whether the dots were circles or discs, the percentage of data to display, whether or not there is jitter in the data, and the size threshold at which to start displaying dots. This is available here1. A few alternatives to this visualisation were also provided. One was a side-by-side dot plot, where two linked dot plots are displayed, one showing the source information and the other showing the destination information. This is available here2. A customisable parallel coordinates plot, capable of showing communications from the source to destination, was also shown to the expert panel. This is available here2. The goal with all these plots is to keep them as customisable as possible to generate insight as well as arrive at the most helpful visualisation for the end-user.
The expert panel was also shown a table displaying the network data where two of the columns were coloured based on the maliciousness of the values of that column (blue is not malicious, white is in between, and red is malicious). A Decision Tree was used to find those limits as the goal here was to show a simple way by which ML can assist an operator without overwhelming them with technical details or, alternatively, not giving them enough detail. This is available here3.
5 Second session - concurrent evaluation
The second interview was conducted to evaluate whether the interpretations of the suggestions matched with what they envisioned. Evaluations within cyber-security visualisation can fall into a number of categories depending on the domain being evaluated (Staheli et al., 2014). The evaluation focuses on three domains/metrics identified by Staheli et al. (2014), namely, “Effect on collaboration,” “Insight generation,” and “Feature set utility.” Effect on collaboration refers to whether the interface promotes conversation among team members, much like mutual influence within ADR. Insight generation refers to whether the system is likely to lead to “more aha moments” (Staheli et al., 2014). Finally, feature set utility refers to assessing the utility of the features being provided. Staheli et al. (2014) observed that “Insight generation” and “Effect on collaboration” were relatively underused metrics and therefore suggested that using them could bring about important contributions.
Broadly, the interview was broken into three parts to discuss each of the artefacts produced to represent the requirements. These were, the personas, the wireframes and the software prototypes.
5.1 Personas
The panel felt that the personas were accurate depictions of the user groups that would need information from the system (directly or indirectly) and covered largely everything they had asked for. They suggested adding the question “Do I have the people?” for either one of the operations roles. This was not just with regards to whether the required number of people work for them, but also because within the safety community there are a number of strict rules regarding how long someone can work around dangerous equipment, for example. Therefore, this question is relevant from a cyber-security perspective since a cyber-security incident might require some staff to work overtime, therefore, an operations manager would need to assess whether they need additional staff to manage the incident.
With regards to a cyber-security incident, one of the concerns the panel mentioned a director may have is the potential reputation loss that it could bring. One example where this could occur is if the recipes stored within an HMI were stolen. While these recipes are closely guarded within the IT infrastructure, the same is not true within OT. Were they to be stolen (or altered!) from within the OT infrastructure, it could lead to loss of confidence in the product and give competitors an upper hand due to the downtime resulting from the incident.
The conclusion from the session held discussing the personas was that they were broadly accurate. Where there were suggestions for improvement, they were amended in this iteration.
5.2 Wireframes
As with the personas, the panel was very positive regarding the wireframes and felt the project was definitely on the right track. They could see how a system modeled after the wireframes could be hugely beneficial within an ICS environment. They said the alert page works well as the translation layer clearly communicating information regarding an incident to multiple personas. They liked the idea of attaching importance to a device within a process. They added that it would also be hugely beneficial to know the cost to the process of individual components going down. They suggested that if the process itself can be priced, the costs of the individual components within the process could be derived from there. They liked the idea of using the percentage of network traffic to/from a device to attach importance to it, however, they cautioned that this might make DNS servers seem unimportant since DNS queries do not happen that often.
The panel helped to better understand how to show and calculate cost for incidents. They pointed out that incidents typically have a fixed cost and a variable cost. For example, personnel cost is fixed, however, availability downtime may be a variable cost since the profit made varies per season. If a third party needs to be brought in (such as firefighters) that needs to be factored into the cost. They suggested that costs can even be broken down using the CIA triad, meaning the cost of an incident can be shown with regards to its impact on confidentiality, integrity, and availability. Availability, they suggested, would be a cost over time, while integrity and confidentiality tend to be a single cost. They also pointed out that if an incident would trigger a regulatory requirement, it may be possible to estimate the cost of that using historical data. An additional cost (potentially with regards to mitigating an attack) that can come with taking the plant offline is the cost of continuing to fulfill contractual obligations. For example, though production may have stopped, shipments will still be coming, therefore, there can be a cost associated with trying to store the goods somewhere. They pointed out that the cost is easier to estimate if a regulatory requirement is triggered since there are historical examples. They acknowledged that it will be impossible to correctly calculate these costs, however, as long as an uncertainty value of these estimates is provided by the system, the panel did not feel this would be a problem.
Providing cost estimates for attacks and vulnerabilities/CVEs empowers more people to be involved in a decision. If, for example, the plant operators know the cost an attack could have if a particular PLC is not patched, they can compare the cost of shutting it down for a few hours with that of leaving it vulnerable. To that end, a helpful bit of information that a system could display is when the PLC is due for its next maintenance cycle as it may be possible to apply a patch during that time as well. Additionally, when providing an estimated risk, the system could provide the risk of the vulnerability being exploited before the next maintenance cycle.
The main topic that kept coming up within the conversation was with regards to risk. The panel pointed out that every conversation they have with regards to cyber-security always comes back to risk. Once a system is providing risk estimates for various incidents, this can be measured against a supplied risk tolerance provided by the directors. The panel also explained that though the cost of events/attacks, etc. can be estimated in terms other than financial (such as hours wasted), they recommend monetary values since it makes it easy to compare values.
5.3 Software prototypes
When it comes to the software prototypes, the participants had less to say as they were not overly concerned with the manner in which the network data was displayed provided it was coupled with the financial/risk information. They mentioned liking the coloured limits used in the table since it provides a simple and easy-to-understand view of something quite complex under the hood. However, ultimately, the information presented to the users needs to show them enough to know whether they need to escalate. They also mentioned that the risk threshold of what a company is willing to tolerate mentioned earlier would need to be provided at different levels to different users. For a business person, the threshold will be in monetary terms, however, a technician may need to see it in more technical terms.
They suggested that in future iterations, to ensure that the network visualisations and the more technical aspects meet the needs of those using them, more people routinely operating an ICS should be consulted. This is because they come from a wide variety of backgrounds and are therefore likely to interpret the visualisations differently. However, they felt that the other aspects addressed by the wireframes were more critical and therefore did not consider it a priority to fully refine the network visualisation in this iteration.
6 Final draft
6.1 Personas
As the panel was very positive regarding the personas, there was very little that needed to change. No new personas were added as they were satisfied that all user-groups within the ICS setting were represented. For the Operations Manager persona, the question “Do I have the people?” was added. For the Director role, the question “What is the potential reputation damage that could come from this?” was included. Finally, for every persona except the Director persona, the question “Do I need to escalate?” was added. The edited personas are shown in Figure 7.
6.2 Wireframes
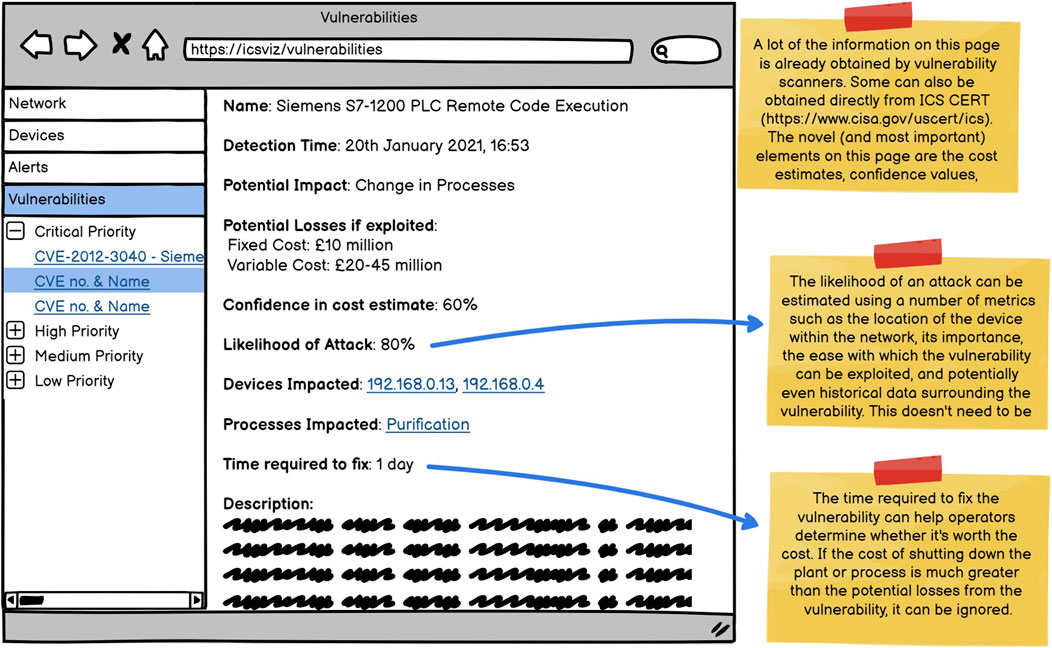
As with the personas, the panel was very positive about the wireframes (Figures 8–10), and therefore the changes that needed to be made to them were minimal. The biggest change was the creation of an additional wireframe as seen in Figure 11. This wireframe shows any vulnerabilities that have been found. This was created due to noticing some differences in concerns between attacks being conducted (for which there are alerts and the alert page) and potential attacks. Therefore, the decision was made to separate the two.
The remaining additions were comparatively minor. One such addition was the inclusion of the cost of the process. Since the importance of a device within the process was already included, this would simply be an extension of that. Extensive discussions were held with the panel regarding cost calculations, and it was recommended to break down costs into fixed and variable costs. This would also allow for more helpful uncertainty calculations since the fixed cost can be the cost that is certain, while the variable cost represents both the costs that can change with time and those that are less certain. Finally, a metric that would be extremely useful to include is the time until each device is next maintained. This would provide an opportunity to also patch some of the vulnerabilities that had been found in the device.
7 Discussion
Before conducting panel interviews, the conception of the likely solution to the problem being faced comprised solely of finding a novel visualisation to display the data. However, as suggested in Principle 6 of Action Design Research (Guided Emergence), the thinking around the “ideal solution” was adapted through engagement with the panel of experts. While visualisation certainly has a role to play in this, it is within a much broader context. Rather than coming away from the interviews with a matured network visualisation, the blueprints for a complete system that would fill many of the gaps within ICS security were developed.
At the start of this project, a literature review was conducted. This revealed that the information needed is not currently available. No user-centred studies within ICS were found. While many IDS and other security solutions have been proposed for use within ICS, their novelty has been their technical capabilities over and above their applicability or usability. As a result, prior to interviewing the expert panel, it was difficult to derive any requirements for the system other than some of the more generic ones such as to refrain from using 3D visualisations. This is why the suggestions from the expert interviews took us by surprise.
The interviews with industry experts highlighted some of the flawed assumptions taken for granted when designing a security system for use within ICS. The main one being that the level of expertise within ICS settings would be similar to that of a network administrator. Therefore many of the sketches made prior to speaking to any experts emphasised a number of technical details. Conversations with the expert panel revealed just how unhelpful these solutions would be since the background of many of those responsible for keeping an ICS safe is very different from that of a network administrator. The panel said most ICS operators rarely have any experience of interpreting network traffic or alerts. Therefore, existing network security tools cannot simply be extended to recognise ICS traffic and be deployed into those environments as they would be useless to their end-users. Rather, tools operating in these environments need to be built from the ground up.
Personas proved to be a helpful tool in formalising and understanding the requirements. Due to the large number of user-groups within ICS, each with very different interests, but all actively involved within the decision-making process, personas were a great fit for representing the problem space. They also provide a much more universal representation of the requirements that can be used by researchers and developers beyond this project. The personas were constantly referred to when designing the wireframes.
The wireframes helped to understand how many of the suggestions could potentially be embodied within a security solution. They also helped promote discussion around some of the more technical aspects that had not been covered in as much detail previously. This is also true of the software prototypes, however, much more feedback needs to be elicited about them before confidence in their value can be established.
As detailed previously, the methodology followed was Action Design Research. ADR’s Build, Intervention and Evaluation (BIE) cycle has been a central tenet within the approach to design and has encouraged careful production of the artefact in stages, ensuring that at each stage there is no deviation from what is wanted. ADR has proven to be accommodating to the needs as the BIE cycle expects a level of unpredictability and changes in the definition of the problem which occurred quite early on. Furthermore, ADR’s goal of producing “Generalised Outcomes” has been particularly informative as it was quickly realised that it is not possible to produce solutions for all of the problems mentioned, but by generalising them, they can be outsourced to the rest of the community as encouraged within ADR. This is the aim in publishing the outputs and process thus far.
While this research has developed a comprehensive user-centered security solution for ICS, future work is needed to refine and validate these findings further. Specifically, gathering additional feedback from a wider range of industry experts is essential to confirm the value and practicality of the proposed prototypes. Ongoing studies could assess the long-term effectiveness and user adoption of the solution in real-world settings. Additionally, exploring the scalability of the system in larger and more complex ICS environments will be important. Future research should also investigate how emerging technologies, such as AI and machine learning, can enhance the adaptability and performance. Furthermore, a more comprehensive and nuanced analysis of access policies is necessary to understand their practical applicability and effectiveness in real-world scenarios.
8 Conclusion
Motivated by the lack of user-centered security solutions and visualizations within ICS, the goal of this research was to develop a solution with a higher likelihood of being deployed in a real ICS environment. To achieve this, the Action Design Research (ADR) methodology was followed, and a panel of experts with decades of experience in the ICS field was assembled to guide the process. Before meeting with the experts, several visualizations deemed potentially useful for monitoring ICS security were prepared; however, the interviews and subsequent sessions challenged many assumptions regarding ICS security and the personnel involved in decision-making. As a result, the findings were documented and shared before proceeding further. In summary, the findings highlighted the diversity of user groups that must be informed by a security system within an ICS context during an attack, with the need to communicate information in terms relevant to technical staff, process safety personnel, and business stakeholders. Ultimately, any information about an attack must also relate back to risk. Our research contributes a set of validated requirements, personas, and wireframes for a potential security solution that is likely to be adopted in a real ICS setting, with the hope that these contributions will provide direction and inspiration for future research in ICS cybersecurity.
Data availability statement
The original contributions presented in the study are included in the article/supplementary material, further inquiries can be directed to the corresponding authors.
Ethics statement
The studies involving human participants were reviewed and approved by Cardiff University COMSC ethics committee. Written informed consent to participate in this study was provided by the participants.
Author contributions
MN: Writing–original draft, Writing–review and editing. HK: Writing–review and editing. PB: Writing–review and editing. CP: Writing–review and editing. JD: Writing–review and editing.
Funding
The author(s) declare that financial support was received for the research, authorship, and/or publication of this article. This work is supported by EPSRC PETRAS (EP/S035362/1).
Conflict of interest
The authors declare that the research was conducted in the absence of any commercial or financial relationships that could be construed as a potential conflict of interest.
Publisher’s note
All claims expressed in this article are solely those of the authors and do not necessarily represent those of their affiliated organizations, or those of the publisher, the editors and the reviewers. Any product that may be evaluated in this article, or claim that may be made by its manufacturer, is not guaranteed or endorsed by the publisher.
Footnotes
1https://observablehq.com/@matthewnunes/network-data-visualisation-from-radiflow-testbed
2https://observablehq.com/d/fcf12d28872e81fb
3https://observablehq.com/d/ed6e13a695db552a
References
Antrobus, R., Frey, S., Green, B., and Rashid, A. (2016). “Simaticscan: towards a specialised vulnerability scanner for industrial control systems,” in 4th International Symposium for ICS and SCADA Cyber Security Research 2016, Belfast, United Kingdom, August 23–25, 2016 4, 11–18.
Arendt, D. L., Burtner, R., Best, D. M., Bos, N. D., Gersh, J. R., Piatko, C. D., et al. (2015). “Ocelot: user-centered design of a decision support visualization for network quarantine,” in 2015 IEEE Symposium on Visualization for Cyber Security (VizSec), Chicago, IL, October 25, 2015, 1–8.
Beaver, J. M., Borges-Hink, R. C., and Buckner, M. A. (2013). “An evaluation of machine learning methods to detect malicious scada communications,” in 2013 12th International Conference on Machine Learning and Applications, Miami, FL, December 04–07, 2013 2, 54–59.
Bonney, G., Höfken, H., Paffen, B., and Schuba, M. (2015). “Ics/scada security analysis of a beckhoff cx5020 plc,” in 2015 International Conference on Information Systems Security and Privacy (ICISSP), Angers, France, February 09–11, 2015, 1–6.
Boschetti, A., Salgarelli, L., Muelder, C., and Ma, K.-L. (2011). “Tvi: a visual querying system for network monitoring and anomaly detection,” in Proceedings of the 8th International Symposium on Visualization for Cyber Security, Pittsburgh, PA, July 20, 2011 (New York, NY, USA: Association for Computing Machinery).
Botta, D., Werlinger, R., Gagné, A., Beznosov, K., Iverson, L., Fels, S., et al. (2007). “Towards understanding it security professionals and their tools,” in Proceedings of the 3rd Symposium on Usable Privacy and Security, Pittsburgh, PA, July 18–20, 2007 (New York, NY, USA: Association for Computing Machinery), 100–111.
Byres, E., and Lowe, J. (2004). The myths and facts behind cyber security risks for industrial control systems. Proc. VDE Kongress (Citeseer) 116, 213–218.
Cappers, B. C. M., and van Wijk, J. J. (2016). “Understanding the context of network traffic alerts,” in 2016 IEEE Symposium on Visualization for Cyber Security (VizSec), Baltimore, Maryland, October 24, 2016, 1–8.
Case, D. U. (2016). Analysis of the cyber attack on the Ukrainian power grid. Electr. Inf. Shar. Analysis Cent. (E-ISAC) 388, 1–29.
Caselli, M., Zambon, E., and Kargl, F. (2015). “Sequence-aware intrusion detection in industrial control systems,” in Proceedings of the 1st ACM Workshop on Cyber-Physical System Security (New York, NY, USA: Association for Computing Machinery), 13–24.
Chang, Y.-N., Lim, Y.-K., and Stolterman, E. (2008). “Personas: from theory to practices,” in Proceedings of the 5th Nordic Conference on Human-Computer Interaction: Building Bridges, Lund, Sweden, October 20–22, 2008 (New York, NY, USA: Association for Computing Machinery), 439–442.
Chen, S., Guo, C., Yuan, X., Merkle, F., Schaefer, H., and Ertl, T. (2014). “Oceans: online collaborative explorative analysis on network security,” in Proceedings of the Eleventh Workshop on Visualization for Cyber Security, Paris, France, November 10, 2014 (New York, NY, USA: Association for Computing Machinery), 1–8.
Cooper, A. (1999). The inmates are running the asylum: why high-tech products drive us crazy and how to restore the sanity. Indianapolis: SAMS.
Deng, J., Zhao, L., Yuan, X., Tang, Z., and Guo, Q. (2021). “Research on the role-based access control model and data security method,” in Big data and security. ICBDS 2020. Communications in computer and information science. Editors Y. Tian, T. Ma, and M. K. Khan (Singapore: Springer), 1415, 86–96. doi:10.1007/978-981-16-3150-4_8
Edgar, T., and Manz, D. (2017). Research methods for cyber security. Rockland, Massachusetts: Syngress.
Etigowni, S., Tian, D., Hernandez, G., Zonouz, S., and Butler, K. (2016). “Cpac: securing critical infrastructure with cyber-physical access control,” in Proceedings of the 32nd annual conference on computer security applications, Los Angeles, CA, December 5–8, 2016, 139–152.
Faily, S., and Flechais, I. (2011). “Persona cases: a technique for grounding personas,” in Proceedings of the SIGCHI Conference on Human Factors in Computing Systems, Vancouver, Canada, May 7–12, 2011 (New York, NY, USA: Association for Computing Machinery), 2267–2270.
Faranello, S. (2012). Balsamiq wireframes quickstart guide. Birmingham, United Kingdom: Packt Publishing.
Filkins, B., Wylie, D., and Dely, A. (2019). Sans 2019 state of ot/ics cybersecurity survey. Rockville, MD: SANS Institute.
Fischer, F., and Keim, D. (2013). Vacs: visual analytics suite for cyber security-visual exploration of cyber security datasets. IEEE Vis.
Fujs, D., Mihelič, A., and Vrhovec, S. L. R. (2019). “The power of interpretation: qualitative methods in cybersecurity research,” in Proceedings of the 14th International Conference on Availability, Reliability and Security, Canterbury, CA, August 26–29, 2019 (New York, NY, USA: Association for Computing Machinery). doi:10.1145/3339252.3341479
Gersh, J. R., and Bos, N. (2014). “Cognitive and organizational challenges of big data in cyber defense,” in Proceedings of the 2014 Workshop on Human Centered Big Data Research, Raleigh, NC, April 1–3, 2014 (New York, NY, USA: Association for Computing Machinery), 4–8.
Gómez, Á. L. P., Maimó, L. F., Celdran, A. H., Clemente, F. J. G., Sarmiento, C. C., Masa, C. J. D. C., et al. (2019). On the generation of anomaly detection datasets in industrial control systems. IEEE Access 7, 177460–177473. doi:10.1109/access.2019.2958284
Greenberg, A. (2018). The untold story of notpetya, the most devastating cyberattack in history. Wired.
Grobler, M., Gaire, R., and Nepal, S. (2021). User, usage and usability: redefining human centric cyber security. Front. Big Data 4, 583723. doi:10.3389/fdata.2021.583723
Hadžiosmanović, D., Sommer, R., Zambon, E., and Hartel, P. H. (2014). “Through the eye of the plc: semantic security monitoring for industrial processes,” in Proceedings of the 30th Annual Computer Security Applications Conference, New Orleans, LA, December 8–12, 2014 (New York, NY, USA: Association for Computing Machinery), 126–135.
Heaton, N. (1992). “What’s wrong with the user interface: how rapid prototyping can help,” in IEE Colloquium on Software Prototyping and Evolutionary Development, London, UK, November 11, 1992.
Hennink, M., Hutter, I., and Bailey, A. (2020). Qualitative research methods. Thousand Oaks, CA: Sage.
Huang, J., Nicol, D. M., Bobba, R., and Huh, J. H. (2012). “A framework integrating attribute-based policies into role-based access control,” in Proceedings of the 17th ACM symposium on Access Control Models and Technologies, Newark, NJ, June 20–22, 2012, 187–196.
ISO (2010). Ergonomics of human-system interaction: Part 210: human-centred design for interactive systems (ISO)
Jardine, W., Frey, S., Green, B., and Rashid, A. (2016). “Senami: selective non-invasive active monitoring for ics intrusion detection,” in Proceedings of the 2nd ACM Workshop on Cyber-Physical Systems Security and Privacy, Vienna, Austria, October 28, 2016 (New York, NY, USA: Association for Computing Machinery), 23–34.
Kashmar, N., Adda, M., and Atieh, M. (2020). “From access control models to access control metamodels: a survey,” in Advances in information and communication. Editors K. Arai, and R. Bhatia (Cham: Springer), 2, 892–911. doi:10.1007/978-3-030-12385-7_61
Kayan, H., Nunes, M., Rana, O., Burnap, P., and Perera, C. (2022). Cybersecurity of industrial cyber-physical systems: a review. ACM Comput. Surv. (CSUR) 54, 1–35. doi:10.1145/3510410
Khadidos, A. O., Khadidos, A. O., Manoharan, H., Alyoubi, K. H., Alshareef, A. M., and Selvarajan, S. (2022). Integrating industrial appliances for security enhancement in data point using scada networks with learning algorithm. Int. Trans. Electr. Energy Syst. 1–11. doi:10.1155/2022/8685235
Komlodi, A., Rheingans, P., Ayachit, U., Goodall, J., and Joshi, A. (2005). “A user-centered look at glyph-based security visualization,” in IEEE Workshop on Visualization for Computer Security, 2005 (VizSEC 05), Minneapolis, MN, October 26, 2005, 21–28.
Koucham, O. (2018). Intrusion detection for industrial control systems. Ph.D. thesis. Saint-Martin-d’Hères, France: Université Grenoble.
Kreimel, P., Eigner, O., and Tavolato, P. (2017). “Anomaly-based detection and classification of attacks in cyber-physical systems,” in Proceedings of the 12th international conference on availability, reliability and security, Reggio Calabria, Italy, August 29–September 1, 2017, 1–6.
Kwon, H.-Y., Kim, T., and Lee, M.-K. (2022). Advanced intrusion detection combining signature-based and behavior-based detection methods. Electronics 11, 867. doi:10.3390/electronics11060867
Lam, H., Bertini, E., Isenberg, P., Plaisant, C., and Carpendale, S. (2012). Empirical studies in information visualization: seven scenarios. IEEE Trans. Vis. Comput. Graph. 18, 1520–1536. doi:10.1109/TVCG.2011.279
Langner, R. (2011). Stuxnet: dissecting a cyberwarfare weapon. IEEE Secur. and Priv. 9, 49–51. doi:10.1109/msp.2011.67
Leszczyna, R., Egozcue, E., Tarrafeta, L., Villar, V. F., Estremera, R., and Alonso, J. (2011). Protecting industrial control systems-recommendations for europe and member states. tech. rep. Heraklion, Greece: European Union Agency for Network and Information Security.
Li, Q., Sandhu, R., Zhang, X., and Xu, M. (2015). Mandatory content access control for privacy protection in information centric networks. IEEE Trans. Dependable Secure Comput. 14, 494–506. doi:10.1109/tdsc.2015.2494049
Lin, C., Wu, S., and Lee, M. (2017). “Cyber attack and defense on industry control systems,” in 2017 IEEE Conference on Dependable and Secure Computing, Taipei, Taiwan, August 07–10, 2017, 524–526.
Lloyd, D., and Dykes, J. (2011). Human-centered approaches in geovisualization design: investigating multiple methods through a long-term case study. IEEE Trans. Vis. Comput. Graph. 17, 2498–2507. doi:10.1109/TVCG.2011.209
Maguire, M. (2001). Methods to support human-centred design. Int. J. Human-Computer Stud. 55, 587–634. doi:10.1006/ijhc.2001.0503
Martin, B., Hanington, B., and Hanington, B. M. (2012). Universal methods of design: 100 ways to research complex problems. Dev. Innovative Ideas, Des. Eff. Solutions, 12–13.
Mathur, A. P., and Tippenhauer, N. O. (2016). “Swat: a water treatment testbed for research and training on ics security,” in 2016 International Workshop on Cyber-physical Systems for Smart Water Networks (CySWater), Vienna, Austria, April 11, 2016, 31–36.
McCurdy, N., Dykes, J., and Meyer, M. (2016). “Action design research and visualization design,” in BELIV ’16: Novel Evaluation Methods For Visualization, Baltimore, MD, October 24, 2016 (New York, NY, USA: Association for Computing Machinery), 10–18.
McGinn, J. J., and Kotamraju, N. (2008). “Data-driven persona development,” in Proceedings of the SIGCHI Conference on Human Factors in Computing Systems, Florence, Italy, April 5–10, 2008 (New York, NY, USA: Association for Computing Machinery), 1521–1524.
McKenna, S., Staheli, D., Fulcher, C., and Meyer, M. (2016). Bubblenet: a cyber security dashboard for visualizing patterns. Comput. Graph. Forum 35, 281–290. doi:10.1111/cgf.12904
Mckenna, S., Staheli, D., and Meyer, M. (2015). “Unlocking user-centered design methods for building cyber security visualizations,” in 2015 IEEE Symposium on Visualization for Cyber Security (VizSec), Chicago, IL, October 5–25, 2015, 1–8.
McLaughlin, S., Konstantinou, C., Wang, X., Davi, L., Sadeghi, A.-R., Maniatakos, M., et al. (2016). The cybersecurity landscape in industrial control systems. Proc. IEEE 104, 1039–1057. doi:10.1109/JPROC.2015.2512235
Mulder, S., and Yaar, Z. (2006). The user is always right: a practical guide to creating and using personas for the web (New Riders).
Pruitt, J., and Grudin, J. (2003). “Personas: practice and theory,” in Proceedings of the 2003 Conference on Designing for User Experiences, San Francisco, California, June 6–7, 2003 (New York, NY, USA: Association for Computing Machinery), 1–15.
Rabie, O. B. J., Balachandran, P. K., Khojah, M., and Selvarajan, S. (2022). A proficient zeso-drkfc model for smart grid scada security. Electronics 11, 4144. doi:10.3390/electronics11244144
Rabie, O. B. J., Selvarajan, S., Alghazzawi, D., Kumar, A., Hasan, S., and Asghar, M. Z. (2023). A security model for smart grid scada systems using stochastic neural network. IET Generation, Transm. and Distribution 17, 4541–4553. doi:10.1049/gtd2.12943
Rudd, J., Stern, K., and Isensee, S. (1996). Low vs. high-fidelity prototyping debate. Interactions 3, 76–85. doi:10.1145/223500.223514
Sangeetha, K., Shitharth, S., and Mohammed, G. B. (2022). Enhanced scada ids security by using msom hybrid unsupervised algorithm. Int. J. Web-Based Learn. Teach. Technol. (IJWLTT) 17, 1–9. doi:10.4018/ijwltt.20220301.oa2
Sein, M. K., Henfridsson, O., Purao, S., Rossi, M., and Lindgren, R. (2011). Action design research. MIS Q. 35, 37–56. doi:10.2307/23043488
Shitharth, S., Satheesh, N., Kumar, B. P., and Sangeetha, K. (2021). “Ids detection based on optimization based on wi-cs and gnn algorithm in scada network,” in Architectural wireless networks solutions and security issues. Editors S. K. Das, S. Samanta, N. Dey, B. S. Patel, and A. E. Hassanien (Singapore: Springer), 247–265. doi:10.1007/978-981-16-0386-0_14
Shneiderman, B. (2003). “The eyes have it: a task by data type taxonomy for information visualizations,” in The craft of information visualization. Editors B. B. Bederson, and B. Shneiderman (San Francisco: Morgan Kaufmann), 364–371. doi:10.1016/B978-155860915-0/50046-9
Staheli, D., Yu, T., Crouser, R. J., Damodaran, S., Nam, K., O’Gwynn, D., et al. (2014). “Visualization evaluation for cyber security: trends and future directions,” in Proceedings of the Eleventh Workshop on Visualization for Cyber Security, Paris, France, November 10, 2014 (New York, NY, USA: Association for Computing Machinery), 49–56.
Stoll, J., McColgin, D., Gregory, M., Crow, V., and Edwards, W. K. (2008). “Adapting personas for use in security visualization design,” in VizSEC 2007. Mathematics and visualization. Editors J. R. Goodall, G. Conti, and K. L. Ma (Berlin, Heidelberg: Springer), 39–52.
Zhang, W., Cao, X., Hu, Q., Liang, P., and Qin, Y. (2015). “Research on fpn-based security defense model of oil and gas scada network,” in Computational Intelligence in Industrial Application: Proceedings of the 2014 Pacific-Asia Workshop on Computer Science in Industrial Application (CIIA 2014), Singapore, December 8–9, 2014 (CRC Press), 31.
Zhao, H., and Silverajan, B. (2022). “User-centered design to enhance iot cybersecurity awareness of non-experts in smart buildings,” in 2022 Thirteenth International Conference on Ubiquitous and Future Networks (ICUFN), Barcelona, Spain, July 05–08, 2022, 369–371.
Keywords: visualisation, user-centred design, ICS, IDS, cyber-security
Citation: Nunes M, Kayan H, Burnap P, Perera C and Dykes J (2024) Exploiting user-centred design to secure industrial control systems. Front. Internet. Things 3:1436023. doi: 10.3389/friot.2024.1436023
Received: 21 May 2024; Accepted: 27 August 2024;
Published: 13 September 2024.
Edited by:
Oktay Cetinkaya, University of Oxford, United KingdomReviewed by:
Shitharth Selvarajan, Leeds Beckett University, United KingdomChanapha Bast, Udon Thani Rajabhat University, Thailand
Copyright © 2024 Nunes, Kayan, Burnap, Perera and Dykes. This is an open-access article distributed under the terms of the Creative Commons Attribution License (CC BY). The use, distribution or reproduction in other forums is permitted, provided the original author(s) and the copyright owner(s) are credited and that the original publication in this journal is cited, in accordance with accepted academic practice. No use, distribution or reproduction is permitted which does not comply with these terms.
*Correspondence: Pete Burnap, YnVybmFwcEBjYXJkaWZmLmFjLnVr; Charith Perera, cGVyZXJhY0BjYXJkaWZmLmFjLnVr
 Matthew Nunes1
 Hakan Kayan
 Charith Perera