 R. F. Kirwan
 F. Abbas
 I. Atmosukarto
 A. W. Y. Loo1
94% of researchers rate our articles as excellent or good
Learn more about the work of our research integrity team to safeguard the quality of each article we publish.
Find out more
ORIGINAL RESEARCH article
Front. Internet Things, 26 October 2023
Sec. IoT Enabling Technologies
Volume 2 - 2023 | https://doi.org/10.3389/friot.2023.1256163
This article is part of the Research TopicReal-World Deployment of Internet of Things (IoT) Applications, Experiences, and ChallengesView all 5 articles
Introduction: Urban farming has gained prominence in Singapore, offering opportunities for automation to enhance its efficiency and scalability. This study, conducted in collaboration with a leading Singaporean urban farming company, introduces an IoT-based automated farming system. This system incorporates an agnostic growbox and a web application dashboard for intelligent monitoring of crop growth. The presented approach provides an open-source and cost-effective solution for a scalable urban farming architecture. The agnostic growbox system offers both accessibility and scalability, utilizing cost-effective and modular hardware components with open-source software, thereby increasing customizability and accessibility compared to commercial growbox products. The authors anticipate that this approach will find diverse applications within the realm of urban farming, streamlining, and improving the efficiency of urban farming through automation.
Methods: The study employs an integrated solution that incorporates an image analytics approach for the proficient and accurate classification of crop disease phenotypes, specifically targeting chlorosis and tip burn in lettuce crops. This approach is designed to be hardware- and software-efficient, obviating the necessity for extensive image datasets for model training. The image analytics approach is compared favourably with a machine learning approach, evaluating the accuracy of categorization using the same dataset. Additionally, the approach is assessed in terms of time and cost efficiency in comparison to machine learning techniques.
Results: The image analytics approach demonstrated notable scalability, time efficiency, and accuracy in the detection of crop diseases within urban farming. Early detection, particularly of chlorosis and tip burn, proves critical in mitigating crop wastage. The results indicate that the integrated solution provided a reliable and effective means of disease classification, with significant advantages over traditional machine learning approaches in terms of time and cost efficiency.
Discussion: The presented IoT-based automated farming system, incorporating the agnostic growbox and image analytics approach, holds promise for revolutionizing urban farming practices. Its open-source nature, coupled with cost-effectiveness and scalability, positions it as a practical solution for urban farming architecture. The system's ability to efficiently detect and classify crop diseases, particularly chlorosis and tip burn, offers a substantial contribution to reducing wastage and enhancing crop yield. Overall, this approach paves the way for a more efficient and sustainable future for urban farming through the integration of automation and advanced analytics. Further exploration and implementation of this technology in diverse urban farming settings is warranted.
When implementing technology in urban farming production, effectiveness is crucial, but cost-efficiency and scalability are equally important considerations. Given the large-scale production requirements of urban farms, the chosen technology must scale appropriately with the quantity of crops. Even effective technological interventions may not be suitable for practical use if they cannot be scaled in a cost-effective manner. Therefore, this work emphasizes the adoption of meaningful technological interventions that align with the principles of cost-efficiency and scalability.
This manuscript presents a scalable approach to efficient crop management in urban farming using IoT protocols and embedded controllers. The research question addressed in this work is how to design a scalable yet customizable system for monitoring and regulating the environment in urban farming. By leveraging on a standardized physical and software architecture, the growbox provides a customizable framework which can be adapted by the users to fulfill their requirement. By using low-cost components and message transfer protocols, the growbox enables easy scalability.
Urban farming is a growing industry with particular relevance to densely populated areas, but that current practices require significant human involvement. To address this problem, this work aims to develop an automated system that enhances efficiency, ultimately producing an urban farming architecture that is scalable.
The manuscript contributes to the research field by presenting a standardized and modular system that uses image processing algorithms to increase the efficiency of crop production. The proposed system can monitor and regulate three sub-environments in urban farming: Light, Climate, and Nutrients. The use of embedded controllers and Message Queuing Telemetry Transport (MQTT) IoT protocols facilitates heterogeneity and modularity (allowing a plug-and-play approach to growbox customization), while the web application dashboard allows for real-time monitoring of sensor information and management of growboxes.
This work demonstrates the feasibility and effectiveness of the proposed approach in an urban farming context. The scalability and modularity of the system makes it adaptable to various crops and urban environments. Overall, this manuscript contributes to progress in the research discipline by presenting a scalable approach to monitoring and regulating the environment in urban farming that addresses current challenges and opens up new opportunities for automation and optimization in the field.
Urban farming necessitates significant human involvement in monitoring and assessing crop health and developmental stages. This results in a considerable overhead when scaling crop production and increases the potential for human error.
To address these challenges, this manuscript proposes the development of an innovative and agnostic growbox that embraces a modular and open-source framework for monitoring and influencing crop growth. The growbox incorporates IoT sensors, which can be added or removed as independent modules based on specific requirements. A top-down camera is utilized to identify crop phenotypes, monitor growth parameters, and detect the end-stage of crop development, indicating the suitability for harvesting. The growbox communicates information to a centralized database that offers a dashboard view, presenting crop statuses and alerts through a web application. The transfer of sensor data follows standardized protocols to ensure compatibility and seamless integration.
The agnostic growbox serves as a platform for investigating growth parameters and their relationship to desired outcomes. While a variety of sensor data can be collected, their correlation with desired outcomes may be limited. Therefore, it is crucial to understand which sensors are informative and the degree of accuracy required. Making efficient choices of sensors and actuators for the growbox is pivotal for scalability. The system addresses scalability in terms of size, cost, and knowledge.
Regarding size, the selection of IoT sensors and actuation devices should be efficient for large-scale urban farming operations. The chosen components should enable a highly modular system where modules can be added or removed without compromising the overall functionality. The devices must be capable of monitoring hundreds of crops in close proximity simultaneously. Cost efficiency is essential for scalability, and unnecessary expenses ought to be avoided by excluding commercially irrelevant parameters. Only impactful sensors and actuators are incorporated into the system. By constructing the agnostic growbox from the ground up and focusing on commercially relevant aspects, production costs are optimized. Establishing a baseline set of essential sensors and actuators, alongside their required accuracy levels, ensures a cost-efficient solution. The advocated growbox enables the exploration of suitable devices and their effectiveness relative to cost.
Building a scalable knowledge base is also essential. Artificial Intelligence via Machine Learning (ML) models can be employed to combine images and data from various sensors to characterize plant phenotypes accurately. To overcome transferability challenges, ML models are developed using datasets from commercially relevant crop varieties recommended by Archisen Pte Ltd. (2021). Standardized lighting conditions during measurements further enhance consistency and comparability.
The agnostic growbox system integrates IoT devices with standardized data transfer protocols, a live crop monitoring dashboard, and automated crop assessment through image analytics to achieve scalability in size, cost, and knowledge. This approach streamlines urban farming processes, reduces human intervention, and facilitates efficient and data-driven decision-making for optimal crop production.
Singapore is currently generating approximately 10% of its food within its borders, but it has set a goal to raise this percentage to 30% by the year 2030 (Diaz, 2021). In order to achieve this target, it will be necessary to expand the urban farming sector. At present, urban farms need to be diligently maintained to ensure optimal growth conditions and regularly inspected to determine if seeds have sprouted or crops are in a healthy state and ready for harvesting. Additionally, ensuring financial feasibility is a significant consideration, which entails choosing cost-effective IoT sensors and actuators to monitor and regulate the growbox environments.
In recent years, there has been notable progress in indoor farming, ranging from small-scale growboxes for personal use to large-scale grow-towers for commercial markets. Various solutions (Maldonado et al., 2019; Wijanarko et al., 2021; Zervopoulos et al., 2020) have been developed to enable continuous monitoring of crops and basic automation tasks such as watering and lighting control, which reduce labor costs and facilitate production expansion. While these solutions have streamlined the monitoring process, their evaluations have primarily concentrated on assessing the quality of the resulting image rather than analyzing the performance of the image classification.
(Loresco and Dadios, 2020) developed an decision support system based on Artificial Neural Networks (ANN) to classify lettuce growth stage by using various extracted vision features including morphological features, color features, and textural features. Their approach showed promising results in lettuce growth stage classification. Subsequent research (Wimalasiri et al., 2021; Hamouda and Msallam, 2020) have focused on analyzing this data and empowering systems to adapt to environmental fluctuations, maintaining optimal crop conditions. For example, Seedo Seedo. (2021) offers hydroponic growing devices with an intelligent automation system that minimizes human intervention by monitoring and adjusting crop needs. These advancements have significantly improved crop production and reduced costs through optimized parameters for specific crops, resulting in savings in water and power consumption.
Niche farmers often strive to customize their crops to achieve desired characteristics. However, this process is typically manual and time-consuming, requiring extensive experimentation with various permutations. Recent studies (Kwon et al., 2020; SharathKumar et al., 2020) explore automated customization techniques for specific crops, demonstrating that controlling selected factors can lead to more desirable outcomes. By tracking monitored crop data and associating it with the final product characteristics, a control loop can be established to optimize outcomes. Our research contributes to the approach presented here, with a distinct emphasis on scalability and device-agnostic characteristics of the growbox.
Existing growbox solutions offer sensing and actuating capabilities for some specific growing conditions in Percival and Conviron (Percival Scientific Inc, 2022; Controlled Environments Limited, 2023), but seldom cover all requirements. These solutions are often tailored for research purposes and may include sensors and actuators that are commercially unnecessary, driving up costs (ranging from $15,000 SGD to $30,000 SGD per growbox). Phenotyping functions, such as plant size and health status, come with an even more higher price tag which is in line with many sophisticated but expensive analytical instruments, for example, (Phenospex - Smart Plant Analysis, 2022). Additionally, the algorithms used for plant health phenotyping are not generalizable and lack transferability across different crop types and lighting conditions due to variations in plant morphology and differences between natural and artificial lighting.
According to a guide on the identification of nutrient deficiency in plants in (NP Foods Singapore, 2022), nutrient deficiency occurs when plants lack sufficient quantities of essential nutrients. Nutrients are vital for proper growth, and their absence can impede plant development, leading to various symptoms such as chlorosis and eventually tip burn (necrosis of the leaf tips) (Wong, 2006; Capon, 2010).
Chlorosis is characterized by the inability to produce chlorophyll due to nutritional disturbances, fungal or bacterial infections, or viral attacks. This condition can be visually identified by its pale to yellow discoloration of leaves due to a lack of chlorophyll (Prasad, 2003; Behboudian et al., 2016). Depending on the underlying causes, chlorosis can affect either younger or older leaves of lettuce Prasad. (2003), which is a prominent crop in urban farming.
Tip burn, on the other hand, results from calcium deficiency in the growing tissues, which can occur even when calcium levels in the nutrient solution are sufficient (Behboudian et al., 2016). It is commonly observed in indoor farming due to high-density crop production, limited space, lack of natural ventilation, and the reliance on artificial lighting (Gozzovelli et al., 2021). Similar to chlorosis, tip burn can be visually identified by the browning of the leaf edges, which may manifest as small spots near the leaf margins or affect the entire leaf edge.
Urban farming has seen the emergence of fully automated farms worldwide, such as (Kalera, 2022). These innovative operations leverage technological advancements to optimize production and reduce labour costs. However, these solutions have yet to incorporate automatic assessment of crop health through image analytics or ML, which is a key consideration in our research. Furthermore, our work focuses on the practicality of automation through consultation with Archisen Pte Ltd. (2021). Specifically, our collaboration explores the scalability and cost-efficiency of automated urban farming systems, from both small to large scale systems.
In a review by Ma et al. (2022), they explored the current progress in high-throughput plant phenotyping for crop monitoring, covering sensors, communication protocols, data management, and platforms. Their analysis highlighted the need to address a gap in achieving a communication protocol that is fast, wide-ranging, energy-efficient, and cost-effective for high-quality crop monitoring systems.
Some existing research has focused on detecting plant diseases such as chlorosis and tip burn. For instance, Gozzovelli et al. (2021) investigated the detection of tip burn in lettuce cultivated in plant factories. Their approach involved dividing top-view images of lettuce into patches and performing patch-level classification. While achieving satisfactory classification accuracy, the method faced challenges in dataset collection and performance evaluation due to its high complexity. Most existing methods have primarily focused on binary classification tasks, rather than quantifying the extent of plant illness.
In Hegedűs et al. (2023) the authors discusses the scalability of vertical farming with IoT solutions. They state that “it is worth noting that energy consumption is considered still too high in practice to produce “low price” plants with vertical farming.” This emphasises the need for scalable solutions. They go on to identify the need for “more advanced data-driven, autonomous and yield-optimising control mechanisms to be developed,” this aligns with the premise for our work. Their work stresses the essential nature of counteracting rising energy prices and labour costs to maintain vertical farms, our work addresses this as it aims to reduce human labour.
A similar, multi-growbox setup is presented in Haris et al. (2019). This work describes a modular indoor vertical farming prototype platform, distributed over cloud, fog, and sensors/actuators. They use an open growbox setup where the cloud is realized as a virtual machine and deployed on a remote server. This work also advocates a plug and play, modular, approach. However, neither this nor the previous work incorporate camera sensors and image analytics for disease detection into the growbox framework.
This section describes the core elements of this work; namely, the Growbox specification, Dashboard specification, IoT communications, and Image analytics approach. The overall system setup is represented in Figure 1. This illustrates the connection between the elements of the system, providing an overview of the workflow. The outer rectangle, on the left, represents the growbox area. The actuators and sensors function as indicated in the internal rectangles at the top and bottom of the growbox area, respectively. Note that (Node-RED, 2023) is used to communicate with the IoT sensors devices as data is aggregated into the database. The database is accessed and monitored via the web application dashboard.
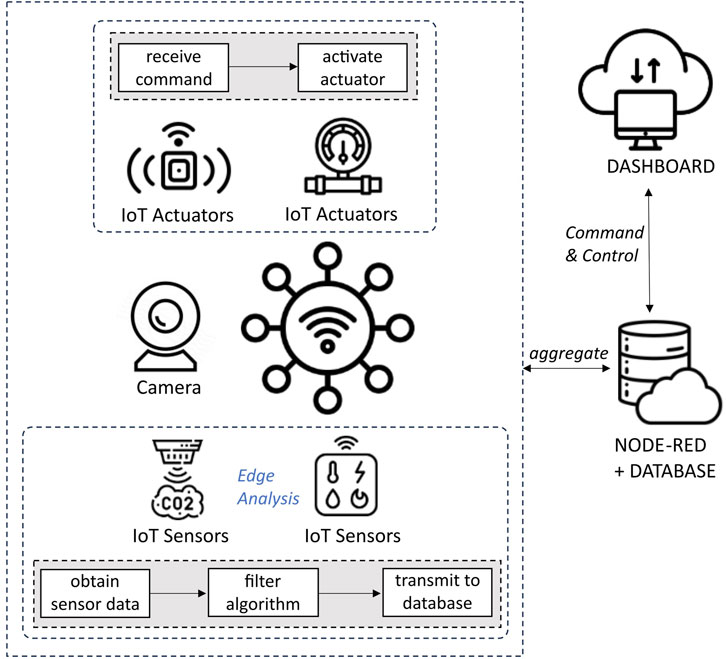
FIGURE 1. Overview of proposed system.
The system is primarily for monitoring environmental factors in urban farming, which includes the use of sensors, actuators, controllers, and a cloud-based database. The system is designed to standardize the use of existing IoT protocols to facilitate heterogeneity and modularity of the growbox. The sensors and actuators are connected to their respective controllers, which acquire and process sensor data and control the elements.
The growbox is designed to house various sensors and actuators in an enclosed frame that facilitates close monitoring of the crops. The system accommodates various sensors to monitor growth-related elements, i.e., temperature, humidity and images from the camera to monitor the elements that can influence crop growth. If these monitored elements go beyond the normal range, the system can regulate them, e.g., ambient temperature, wind speed, control water flow and lighting conditions via the IoT-based actuators such as a side-mounted fan, a water pump and top-down grow lights, as illustrated in Figure 2.
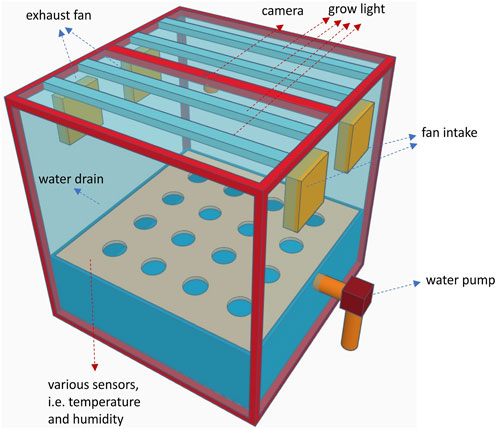
FIGURE 2. Agnostic growbox physical layout.
Furthermore, the growbox can be configured for three methods of fertigation (Grant, 2023), to supply the crops, namely,: Nutrient Film Technique (NFT), Deep Water Culture (DWC), and Ebb-and-Flow. The IoT-based water pump irrigation system manages this.
Each sensor is connected to a controller, which performs data acquisition and processing before transmitting it to the cloud-based database. Moreover, to regulate the environment, the actuators (e.g., the water pump) are also connected to dedicated controllers and performs operations as required.
The controller communications is standardised using existing IoT protocols, specifically Message Queuing Telemetry Transport (MQTT). Standardising to MQTT allows for a variety of sensor and actuator controllers (e.g., Raspberry Pis and ESP32s in the initial setup), facilitating heterogeneity. MQTT’s flexibility leads to interchangeability of hardware; hence, facilitating the modular design of the growbox.
Controllers can also exchange data to collectively manage the growboxes. This approach leverages the advantages of each controller’s native OS (for our initial setup this is Raspberry Pi Os and RIOT-OS) having low power consumption and supporting various implementation languages, such as C and Python. Although interchangeable, when selecting controllers the interface to the sensors and actuators should be considered because will require specific ports such as digital, analog, I2C, PWM, and UART.
Elicitation through crops scientists at Archisen provided the most commercially relevant factors to monitor. These environmental factors can be divided into three sub-environments: Light, Climate, and Nutrients, shown in Table 1. The system is designed to monitor and regulate these sub-environments for optimal crop growth. Temperature.
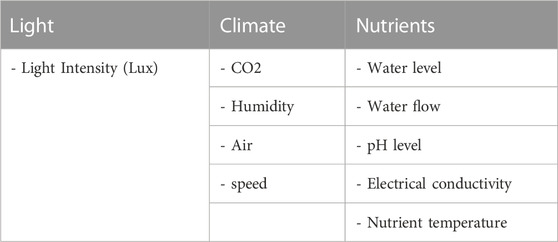
TABLE 1. Environmental factors to monitor.
For the initial setup of our growbox, the specific sensors chosen are indicated in Table 2. Here the listed elements monitored are broken down into constituent factors and the corresponding sensors used to monitor them.
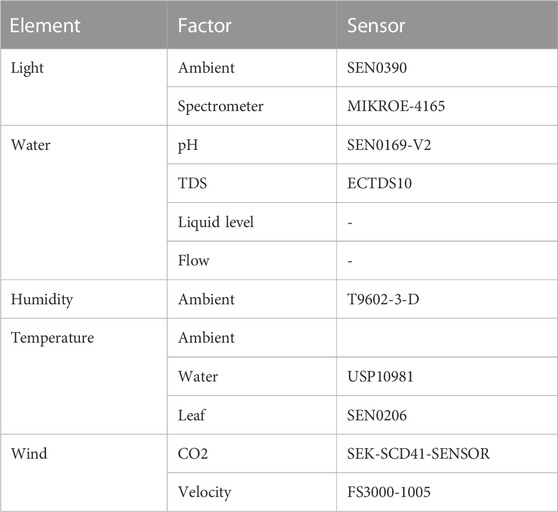
TABLE 2. Multi-sensor monitoring system.
Regulation of these elements is performed by actuators, after analysing data from the sensors. The regulation of the actuators is preformed by four types of controllers: PWM, Relay, GPIO and digital communications. PWM controllers are used for the motor-based actuators. Simple on-off devices, such as water pumps, nutrient dispensers, and grow lights are controlled by a relay (high-powered) or GPIO (low-powered). The rest use digital communications, such as UART and ModBus to manage them. In the initial setup, four types of actuators were deployed to control the environment: a relay module, pump, controlled water valve, and LED lights.
Specifically, the regulation of wind and humidity are managed by the placement of ventilation fans which serve a fundamental role in ensuring optimal environmental conditions for plant cultivation (see Figure 2, labelled “fan intake” and “exhaust fan”). The intake fan draws in fresh external air, while the exhaust fan is positioned on the opposite side to expel stale air and maintain proper air circulation within the growbox. Intake and exhaust ventilation fans play a pivotal role in regulating humidity and CO2 levels within an enclosed growbox. These fans form a crucial component of the environmental control system, working in tandem to create a balanced and conducive atmosphere for plant growth.
The intake fan serves as the gateway for fresh air from the external environment to enter the growbox. This incoming air typically carries a different humidity and CO2 content compared to air inside the growbox. The airflow can mitigate elevated humidity levels that may accumulate. Moreover, the incoming air often contains a higher concentration of CO2, which is essential for photosynthesis.
On the other hand, the exhaust ventilation fan is responsible for expelling excess humidity, and accumulated Oxygen or even CO2, if the threshold is surpassed (As plants respire they release moisture and CO2 during their growth cycles, the exhaust fan prevents the buildup of these components to undesirable levels.) By expelling stale air, the fan helps maintain optimal humidity and CO2 concentrations, preventing the onset of issues such as mould or stunted plant growth.
The growbox and dashboard are configured such that the user is able to adjust the threshold values that trigger the intake and exhaust fan system. This maintains the desired flow and air composition. The choice of thresholds depend on the specific requirements of the user and the crops being cultivated. Ideally, this exchange ensures that humidity and CO2 levels are regulated within the desired range, creating an environment conducive to healthy plant growth and maximizing agricultural yields.
Filtering algorithms are critical in ensuring the accuracy and utility of data collected by these sensors, especially in precision agriculture and environmental monitoring, as they help extract meaningful information from these sensors, enhancing decision-making processes. The Kalman and Moving Average filters are commonly used filtering methods.
The Kalman filter, (Kalman, 1960), is a versatile and adaptive filtering algorithm that excels at accurately estimating the state of dynamic systems, making it valuable in applications involving sensor fusion, state estimation, and noise reduction. The Kalman filter can enhance data quality from sensors monitoring variables in precision agriculture.
The Moving Average filter offers a simpler but effective data smoothing and noise reduction approach in measurement, (Tham, 1998). It operates by averaging a set of recent measurements, thereby reducing short-term fluctuations and sensor noise. Moving Average filters are particularly useful for obtaining stable, long-term trends from sensor data, aiding in identifying patterns and anomalies in variables in crop growth behaviour.
Kalman and Moving Average filters provide benefits but come with distinct characteristics. The choice between these filters should align with the specific requirements of urban farming applications, where sensors monitor various variables critical for crop growth, resource management, and environmental control.
The Kalman filter is useful in urban farming scenarios where accurate and adaptive estimation is vital. For instance, when managing automated hydroponic systems, the Kalman filter dynamically adjusts to changing nutrient conditions, helping optimize plant growth. It excels in sensor fusion tasks, such as integrating data from environmental sensors measuring temperature, humidity, and light levels to make informed decisions about climate control. However, it is worth noting that implementing a Kalman filter may require expertise in mathematics and can be computationally intensive.
The Moving Average filter offers a simpler yet effective solution for urban farming applications, particularly when addressing short-term fluctuations and noise reduction in sensor data. They effectively reduce short-term noise and provide smoothed data for trend analysis. While their performance may be slightly lower than Kalman filters, they offer a practical balance between accuracy and simplicity. For example, when tracking the growth of leafy greens in an indoor farm, a moving average filter can smooth out sensor measurements, allowing growers to make timely adjustments to optimize yields. This filtering method is also advantageous for real-time applications in urban farming, providing noise reduction while being computationally efficient.
Filtering algorithms are indispensable tools in the growbox setup, enhancing data quality and supporting informed decision-making. Whether employing Kalman or Moving Average filters, the choice should be guided by sensor calibration to align with the specific requirements. Calibration is essential to ensure the best filtering is used for a particular sensor. Calibration involves characterizing the sensor’s behaviour, noise characteristics, and response to different environmental conditions. This example growbox uses Moving Average filtering, on the edge, to smooth out noise from the sensor data.
In urban farming, coordinating CO2 and humidity sensors alongside ventilation fans is pivotal in maintaining optimal environmental conditions for plant growth. These sensors are vital components of the automated control system, working in unison to ensure a controlled and stable indoor climate.
The CO2 sensors are responsible for monitoring the concentration of carbon dioxide within the enclosed farming environment. In our example, the ideal CO2 level for lettuce typically falls within a range of 400–800 parts per million (ppm). When CO2 levels fall outside these thresholds it is indicative of inadequate ventilation and the CO2 sensors trigger the ventilation fans into action. The ventilation fans, designed to expel stale air and introduce fresh air from the external atmosphere, effectively normalize the CO2 levels (atmospheric CO2 being around 424 ppm, (Ian Tiseo, 2023), with indoor environments generally being higher due to human respiration). This action typically serves to facilitate photosynthesis, as the rate of consumption of CO2 is higher than its excretion in plant respiration.
Additionally, the humidity sensors continuously measure the moisture content in the air, ensuring that it remains within the desired range. Elevated humidity levels can lead to various issues such as mold growth, diseases, and poor nutrient uptake by plants. When humidity surpasses the predefined upper limit, the humidity sensors collaborate with the ventilation fans to expel humid air and introduce drier air into the growing area. This helps to maintain an optimal humidity level conducive to the wellbeing of crops and prevents moisture-related problems. For the example lettuce crop the desired range was set to between 50% and 85% humidity, with reference to Tibbitts and Bottenberg. (1976). In Tibbitts and Bottenberg. (1976), it was shown that higher humidity creates larger leaves and hence yields, this was also reinforced in Chia and Lim. (2022). However, increasingly high humidity also promotes soil mould which can eventually detract from the crop health.
The integration of CO2 and humidity sensors with ventilation fans forms a feedback control system tailored to the unique requirements of urban farming. For the proposed growbox framework, the threshold values can be catered to a specific crop of interest. The synergy between sensors and fans ensures that the enclosed growbox remains conducive for plant growth while the containment helps minimize the risk of external interference, pests, and helps avoid rapid spread of disease.
Alongside the physical growbox, a web application dashboard is used to display real-time sensor information from the growboxes. Dashboard views also allow for the visual assessment of crop health through image analytics and ML models.
The growbox dashboard serves as the user’s main interface, providing an overview of all existing growboxes within the system. Each growbox is listed with its physical location and displays real-time data retrieved from various sensors. Users can add new growboxes, customize their settings, and remove them as needed. The dashboard also includes an analytics page for analyzing sensor data over different time periods. A ticketing system is integrated into the dashboard for task management across growboxes. Users can create, assign, and update tickets for plant or sensor-related issues. The device inventory page showcases all sensor devices associated with the growboxes. Users can search and filter for specific devices and monitor their status. For user management, the profile management page allows users to view and edit account information. Administrators can add or remove users from the system. The dashboard features a standard user login system with password management.
The dashboard uses the MERN architecture (MongoDB, 2023) that this is a dynamic and flexible approach that adheres to the current systems at Archisen. This three-tiered architecture includes frontend, backend, and the Mongo database, using JavaScript and JSON, see Figure 3.
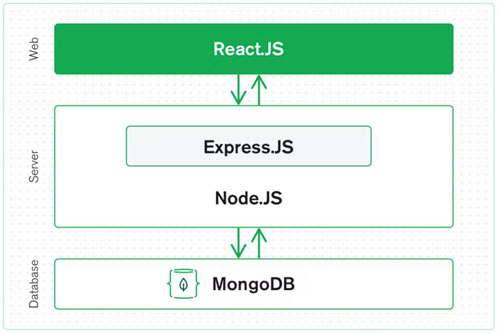
FIGURE 3. MERN stack MongoDB. (2023).
The dashboard is scalable as it allows for the monitoring of a dynamic set of growboxes. It provides various views and functionality, these are covered herein.
The growbox Landing page, see Figure 4 top right, presents all the existing growboxes in the system, alongside their physical location, and the latest data retrieved from sensors such as temperature, humidity, moisture level, and light intensity. Additional growboxes can be added to the dashboard with the specification of seeding and harvesting dates, intervals for IoT variable updates, schedules for lighting and water flow, and threshold values for sensor alerts. Different crops may require customized setups determined by the crops. Once created, users can update information and configurations. Growboxes may also be removed from the system as needed.
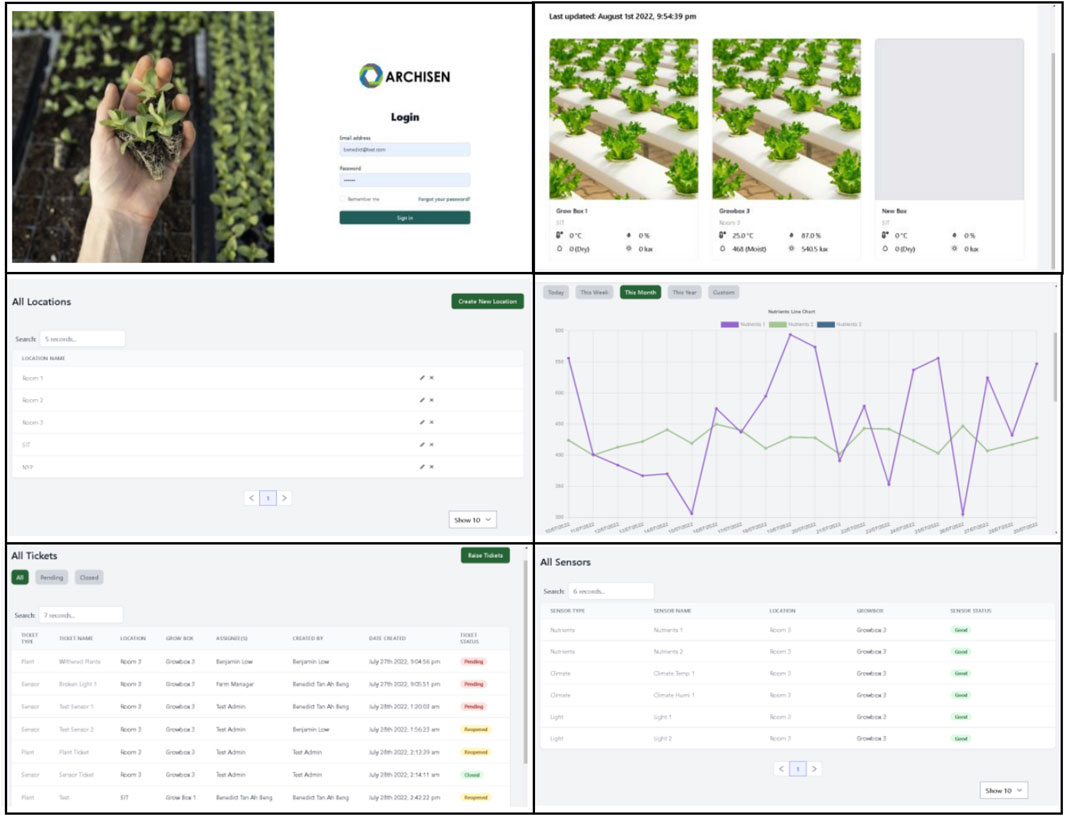
FIGURE 4. Web app dashboard pages.
The analytics page, see Figure 4 middle right, presents the user with time-mapped data for sensor values over indicated periods. Specifically, periods can be viewed as per day, week, month, or year. This real-time data can be analyzed for trends and patterns across different sensors. This data is preserved in the database and will be used to discover correlations through ML models.
The dashboard uses a ticketing system, see Figure 4 bottom left, to manage tasks across a distributed set of growboxes. All tickets are displayed to the users and can then be filtered based on their status; specifically either “pending” or “closed.” These tickets represent tasks and reminders for users to manage their urban farms. All dashboard users are also able to create new tickets of different types for either plant or sensor-related issues. Once created, tickets are assigned to users. Ticket details can be updated, and tickets can be closed or even reopened when creating or after being assigned to a user. This ticket system facilitates the management of a scalable set of growboxes.
Distributed growboxes systems may contain a variety of different sensor devices. The device inventory page, see Figure 4 bottom right, displays all these sensors, with their current status and including with of the growboxes they are associated with. Users can filter when searching for specific sensor devices, their locations and their status.
The dashboard is designed to be managed by a collection of urban farmers. To facilitate this, the profile management page allows for viewing and editing of the current account information. It is where the admin can add and remove users from the system. The dashboard uses a standard user login system, see Figure 4 top left, and the password can be managed within the management page.
The successful implementation of the proposed system relies on the setup and registration of IoT sensors, as well as the seamless transmission of sensor data to the backend. This section discusses the key aspects of IoT sensor setup, the initiation and registration process, and the methods employed for transmitting sensor data to the backend database.
The setup of IoT sensors involves configuring and deploying the physical devices within the target environment. These sensors are typically equipped with various sensors and communication modules to collect and transmit data to the database via the Data Acquisition System. The initial setup process may include hardware installation, connectivity configuration, and sensor calibration.
Hardware installation involves physically installing the IoT sensor devices in the desired locations, ensuring proper placement and connectivity to power sources. The M5Stick-C (M5Stack, 2019) is chosen as the main IoT device as it can be found as a complete package that eases deployment. These M5Stick-Cs are then connected to the sensors via ADC, UART, I2C or SPI. Sensor calibration may be necessary to ensure accurate measurements, involving the adjustment of sensor parameters and settings to align with the intended use case. Connectivity configuration involves configuring the sensors to establish network connectivity through Wi-Fi. MQTT has been chosen as the protocol of choice due to its simplicity and its ability to scale when needed.
Figure 5 illustrates the eight stages of communication between the IoT sensors and the backend. The following sections explain how each stage is designed and implemented.
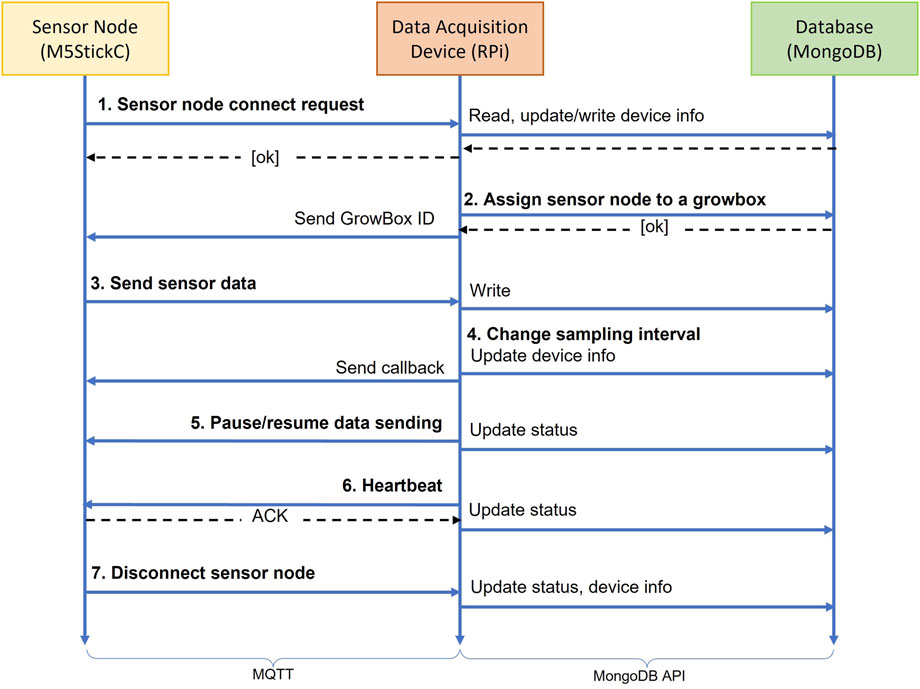
FIGURE 5. Data acquisition system.
After the physical setup, sensor nodes must initiate and register themselves with the MongoDB via the Data Acquisition Device. This step lets the system identify and authenticate the sensor nodes, enabling secure data transmission. The initiation and registration process typically involves bootstrapping, authentication and configuration. Bootstrapping occurs upon power-up, where the sensor devices initialize the required components, establish network connections, and prepare for registration. Authentication occurs during the registration process, where the sensors provide their credentials to verify their identity, and the backend system grants them appropriate access rights and privileges. Provisioning and configuration involve the backend infrastructure allocating necessary resources for the sensors and assigning configuration parameters such as data transmission intervals or thresholds.
The Data Acquisition Device uses (Node-RED, 2023) to communicate with the IoT Sensors via MQTT. It then processes the data and relays it to the MongoDB backend. Any request to change the configuration of the IoT sensor (e.g., interval time, UUID, etc.) goes through the Data Acquisition Device. Subsequently, the Data Acquisition Device communicates with this database via MongoDB’s API.
Figure 6A illustrates the communication sequence between the sensor node and the backend systems. The sensor node initiates the request to join the network when it first boots up by sending an MQTT request. Upon receiving an MQTT message, the Data Acquisition Device validates the UUIDShort by comparing it with the hashed value of the MAC address using a randomly generated salt. Next, the uniqueness of the UUIDShort is verified within the sensor nodes collection of the database. If a previous sensor node is found, the corresponding GrowBoxID in the GrowBoxList collection updates its UUID to the new value while also unsubscribing from topics associated with the previous UUID. Additionally, a subscription is established for the [UUID]/[sensor]/data topic. Lastly, a message is published to the [UUID]/connectionApproved topic, indicating “ok” to signify successful processing or the GrowBoxID if the sensor node was previously assigned to a growbox.
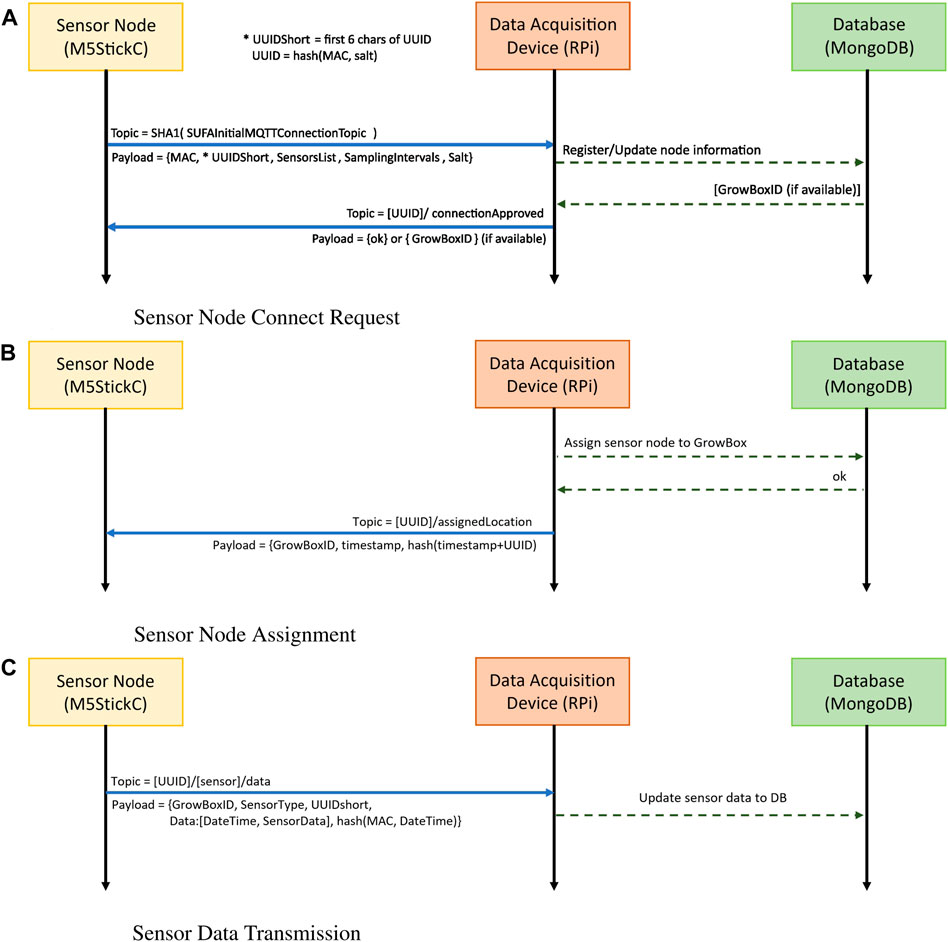
FIGURE 6. Message sequence diagram for (A) Sensor Node Connect Request, (B) Sensor Node Assignment, and (C) Sensor Data Transmission.
Figure 6B illustrates assigning a pre-registered sensor node to a growbox. This is done by transmitting the GrowBoxID to a specific topic to which the specific sensor node is subscribed. Timestamps and hashing are incorporated to reduce the chances of replay or MITM attack. After initiation, the Data Acquisition Device subscribes to all topics associated with the UUIDhort, i.e., sensor sampling interval, actuator state value, etc.).
Once the sensor nodes are initiated and registered, they transmit data to the backend at regular intervals, where it is stored, processed and analyzed. Figure 6C illustrates the sensor node sequence of sending sensor data to the backend via the Data Acquisition Device. The GrowboxID and UUIDShort reference this node to the growbox, while the hash ensures that this message comes from a verified node.
By default, the sensor data is transmitted every 5 s. However, the system can update the time interval of any sensor node. Again, the hash function ensures the sensor node’s message is authentic. Furthermore, the system can pause or resume the sensor data transmission at any time using the sequence depicted in Figure 8A.
Actuator nodes are connected to actuators, i.e., pumps and lights. The connection request process is similar to the sensor nodes process. As seen in Figure 7A, ActuatorsList and StateValue are sent to the backend via the Data Acquisition Device to represent the list of actuators connected to this node and the number of states for each actuator.
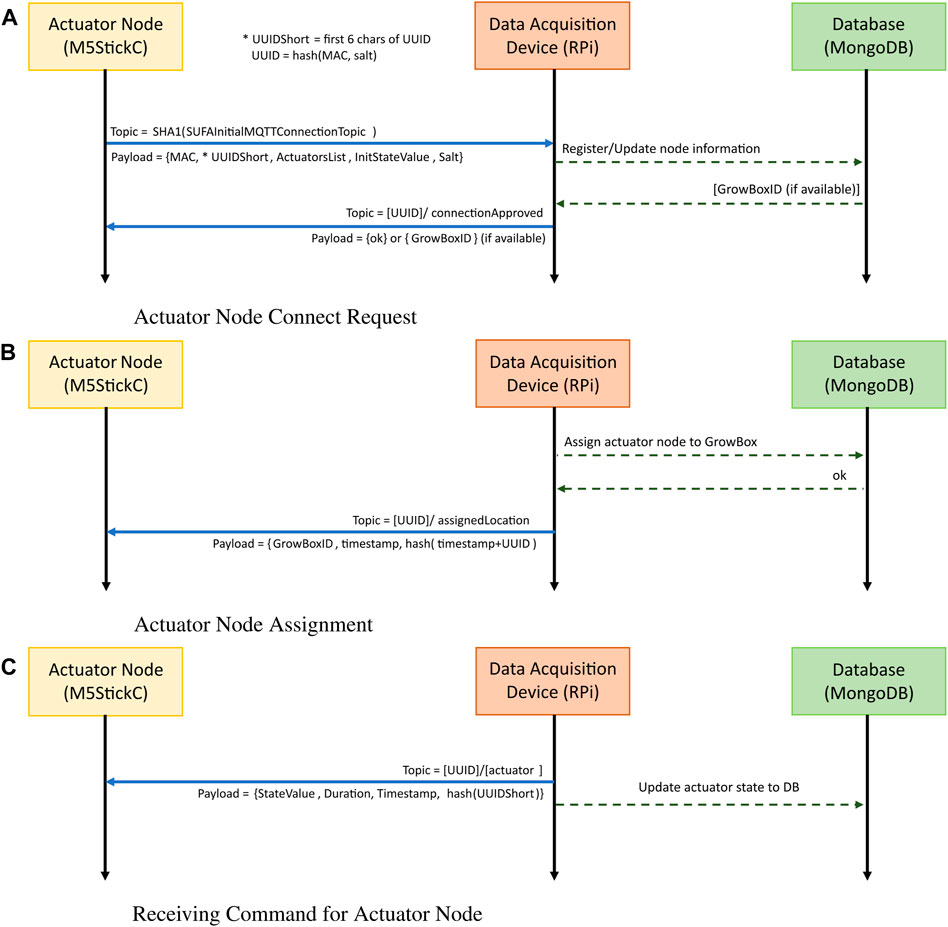
FIGURE 7. Message sequence diagram for (A) Actuator Node Connect Request, (B) Actuator Node Assignment, and (C) Receiving Command for Actuator Node.
The process of assigning the actuator nodes to the growbox is the same as the sensor nodes, as seen in Figure 7B.
Once the actuator node is assigned a growbox, it listens for commands via the distinct topic addressed by its UUID. The process of the actuator node receiving command data from the backend via the Data Acquisition Device is visually depicted in Figure 7C. Enclosed within the payload is the updated state value intended for the actuator, the duration for which this new state should be maintained, and a timestamp indicating the initiation of the state transition. The integrity of the message is upheld by hashing the UUIDShort to ensure its authenticity.
IoT systems must also account for potential disconnections between sensors and the backend, as well as implement measures for heartbeat monitoring and recovery. Disconnections can occur due to various factors such as network outages, sensor malfunctions, or environmental issues. To address this challenge, IoT systems often incorporate mechanisms to detect and handle disconnections.
One commonly employed technique is the implementation of heartbeat monitoring. Heartbeat messages are periodically exchanged between the sensor and the backend to indicate the sensor’s operational status. It is considered disconnected if a sensor fails to send a heartbeat within a specified timeframe. Upon detecting a disconnection, appropriate actions can be taken, such as generating alerts, initiating troubleshooting procedures, or attempting to re-establish the connection.
It is important to design robust recovery mechanisms to minimize data loss and maintain system reliability. These mechanisms should include error handling procedures, fallback options, and automated recovery processes to streamline the re-establishment of communication between sensors and the backend once the disconnection is resolved. Alternatively, old sensors that need to be shutdown can send a notification to disconnect themselves from the network as shown in Figure 8C.
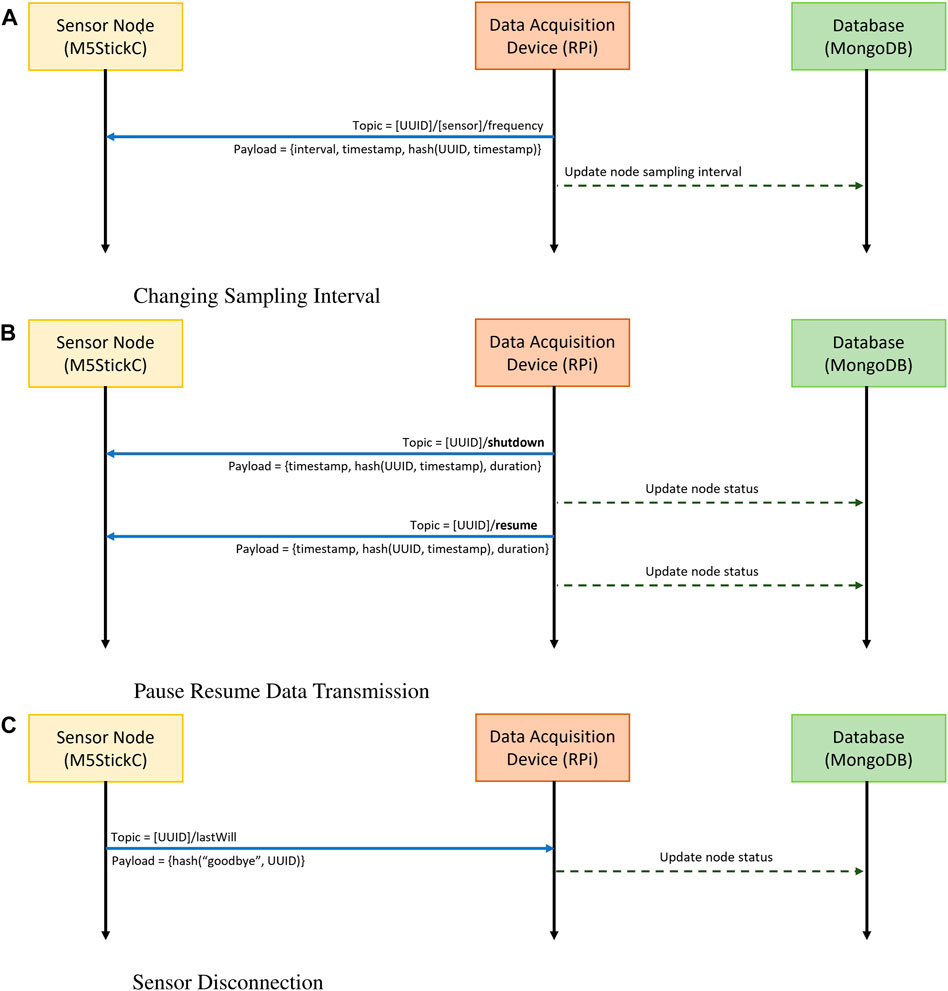
FIGURE 8. Message sequence diagram for (A) Changing Sampling Interval, (B) Pause Resume Data Transmission, and (C) Sensor Disconnection.
Designing a protocol that guarantees clarity, transparency, and robustness against interference and common attacks is paramount. Clarity and transparency in the protocol ensure that the communication between sensor nodes and the backend system is well-defined, understandable, and interpretable by all involved parties. This enables seamless interoperability, efficient data exchange, and effective collaboration among increasingly diverse IoT devices and systems.
Moreover, a robust protocol architecture incorporating security measures is essential to safeguard against potential interference and attacks. This is important as IoT systems are susceptible to various threats, including data breaches, unauthorized access, and malicious attacks. The integrity, confidentiality, and availability of IoT data and systems can be ensured by integrating robust security mechanisms into the protocol design, such as encryption, authentication, and secure data transmission protocols. This promotes trust, reliability, and resilience, safeguarding critical infrastructure, sensitive information, and user privacy. Therefore, an IoT protocol that combines clarity, transparency, and robust security measures is vital for the successful deployment and long-term viability of IoT ecosystems in today’s interconnected world.
IoT communication plays a fundamental role in the scalability of the proposed growbox setup. One factor of significant importance is the message throughput required for such a system, or set of systems, as the farming requirements scale. The implication of having a multi-growbox environment led to using MQTT and considering brokers that scale sufficiently. Performance evaluations of broker services, in Mishra. (2018), concluded that there were minimal performance differences with the choice of broker. Notably, under MQTT stress tests, all brokers were able to achieve broker-to-client message delivery throughput in the tens of thousands.
For our example growbox setup, the HiveMQ broker was selected. HiveMQ is a free, public MQTT broker which is scalable and reliable, with its Quality of Service levels (QoS) ensuring dependable data exchanges. The cluster-based architecture supports growth, accommodating additional devices and messages efficiently. Additionally, HiveMQ prioritizes data security, implementing Transport Layer Security encryption and multiple authentication methods, in line with managing sensitive agricultural data.
According to the findings presented in Mishra. (2018) (Figure 9), the HiveMQ broker can support a minimum throughput of 3166 messages per second (and a maximum of 522298), translating to 189960 messages per minute, in the worst case. Within the agritech domain, considering a demanding scenario where a crop sensor node dispatches one message every minute (opposed to the our implemented rate of one message per hour), the HiveMQ broker can effectively cater to 189960 clients. Nevertheless, should the system necessitate scaling beyond this threshold, an alternative public broker or local broker that can support higher publisher throughput can be deployed to meet the heightened demand.

FIGURE 9. White balancing: Original image (A), White-balanced image (B).
The integration of automation into the domain of urban farming is a growing practice that offers numerous potential enhancements to production efficiency and process management. This practice, commonly referred to as agritech, utilizes technology to improve agricultural yield and efficiency. This section specifically focuses on the application of image analytics to automate the assessment of crops cultivated in an urban farming setting.
The image analytics approach, comprises several stages. Specifically, the utilization of the OpenCV (Pulli et al., 2012) and PlantCV (Gehan et al., 2017) libraries facilitated the determination of the ratio between healthy and unhealthy crops, with unhealthy crops defined as those exhibiting symptoms of chlorosis and tip burn.
Each image undergoes a series of processing steps to eliminate background elements, followed by the isolation and quantification of unhealthy sections within the plant using pixel count. The resulting proportion of unhealthy sections relative to the entire crop was then employed to classify the presence or absence of chlorosis and tip burn.
This section discusses the methodology of the image analytics approach used for disease detection. The solution comprises four phases: image acquisition, white balancing, background removal, and pixel colour detection.
Our proposed solution is targeted for urban farming system involving indoor hydroponics that grow crops with protection from the elements. The first phase, image acquisition, is performed by capturing images against their native background for automated crop health assessment. Ideally, these crops grow against a single colour tone backdrop, such as white. Crop images are preferably taken from a top-down perspective, providing a wider view of the growing environment. This view is suited to urban farming as crops can be tightly packed. If multiple crops are captured in one view segmentation can be used to isolate individual crops, or one images can be used to assess the whole area captured. A view of the whole growth environment is necessary for assessing and identifying the current health of batches of crops.
In this study, a total of 200 images of lettuce crops were acquired from Archisen’s urban farms, using the ESP32-CAM, (Espressif Systems, 2023), a cost-effective and low-power camera device chosen to facilitate an accessible and scalable approach. The ESP32-CAM possesses desirable attributes, including its affordability when purchased in bulk and its application in other pertinent studies such as (Narvios et al., 2022), where it has proven effective for lettuce crops.
The image dataset was divided into two distinct categories: 100 images depicting crops affected by chlorosis and tip burn, which is characterized by necrosis of the leaf tips, and another 100 images showcasing healthy crops. To minimize crop wastage, a deliberate cultivation of 20 lettuces was conducted to exhibit the chlorosis and tip burn phenotypes, while an additional 20 lettuces were specifically grown to generate images of healthy crops. Each image represented an individual lettuce plant and was captured from diverse angles, employing a top-down perspective and covering various growth stages. Consequently, approximately five unique images were obtained per lettuce. The image acquisition process spanned a period of 4 weeks, during which the lettuces were cultivated in a controlled indoor hydroponics growth environment that is typical of Archisen’s urban farming practice. This hydroponics system involved the growth of lettuces in PVC pipes filled with a growth mediuma, while precise control over the water supply was maintained.
White balancing is used to mitigate the affect of warmth (yellow) and cool (blue) in the images, as these could affect the pixel colour detection. This phase reduces the white shade variations of the images’ backgrounds which could lead to inaccuracies in subsequent phases.
To begin with, the system identifies a Region of Interest (ROI) for white balancing, the total Hue, Saturation, and Values (HSV) value for each pixel in the image is calculated. The total value per array is then compared to determine the maximum value. White has the HSV value [0-255 0-255 255], so the ROI with the closest HSV value is chosen for white balancing. A ROI size of 50 × 50 pixels was empirically tested to show an accurate and time-efficient outcome (smaller sizes led to whitewashing, and larger ones less effect). An example ROI is identified (red circle) in Figure 9.
The right image shown in Figure 9 shows the outcome after the white balancing phase is completed. The image is brighter, and the background is closer to the shade of white than the original image, where the background looks greyer.
Removal of the background isolates the relevant crop area for further processing. Objects found in the background of the image, if not removed, are likely to impact the subsequent stages.
To facilitate the background removal, processing was done using HSV values. This approach is evidenced by Mohd Ali et al. (2013), where a comparison between RGB and HSV was used for segmentation and detection of road signs. The accuracy of the HSV was concluded to be at least 88% as compared to the RGB colour space accuracy of only 80% on non-occluded images. Hence, the first step to removing the background the RGB is converted to HSV. The separation into hue, saturation, and luminance channels allows the extraction of the image binary using the saturation channel.
Figure 10 illustrates the greyscale image (left) that is processed through its HSV values and then translated using the binary threshold algorithm to generate a binary image (shown on the right). This differentiates between the plant and the background, which facilitates the background removal to obtain only the image of the crop leaves. An additional median blur filter is then applied to the binary image, which reduced the noise in the binary image. The noise can be seen in the grainy area of the image as denoted by the red circle in Figure 10.
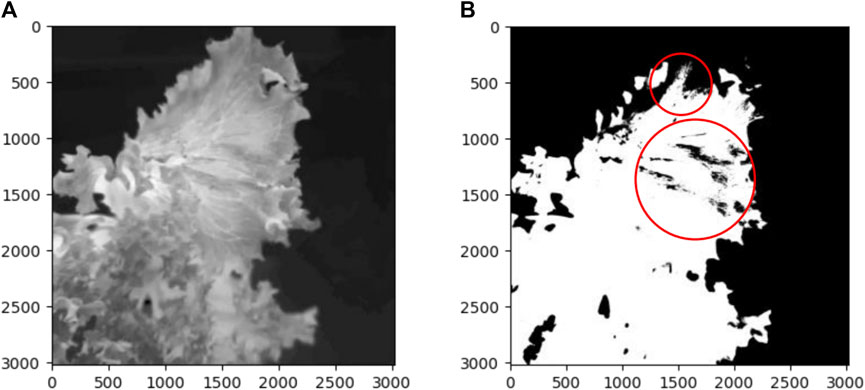
FIGURE 10. Greyscale image (A), and Binary image (B).
Similar to the earlier step of converting the image from RGB to HSV, the white-balanced image is presented as the noise-removed binary image in Figure 11A and it is also converted from the RGB colourspace, specifically the blue-yellow channel, as seen in Figure 11B. The use of multiple channels improves the contrast between the plant and the background of an image.
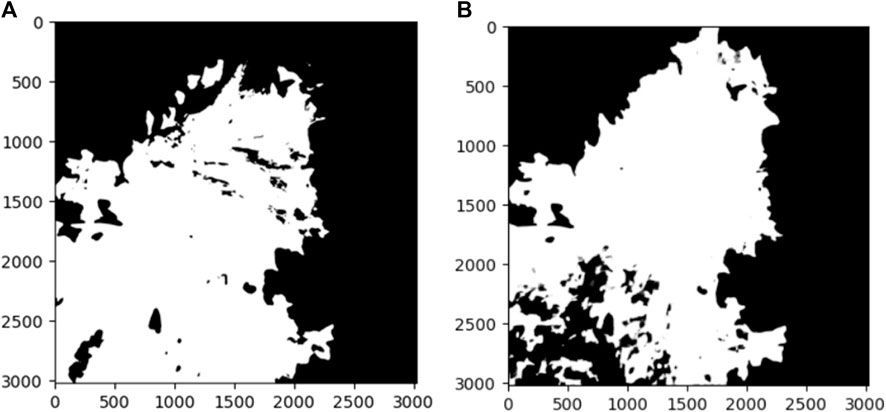
FIGURE 11. Noise-removed Binary image (A), and LAB Binary image (B).
Subsequently, both the noise-removed HSV binary image and LAB binary image are combined using a logical OR operation. The outcome of the final filter can be seen in Figure 12. Finally, this filter is applied to the white-balanced image (shown in Figure 9B) to obtain the image of the plant without the background as shown in Figure 12 (right).
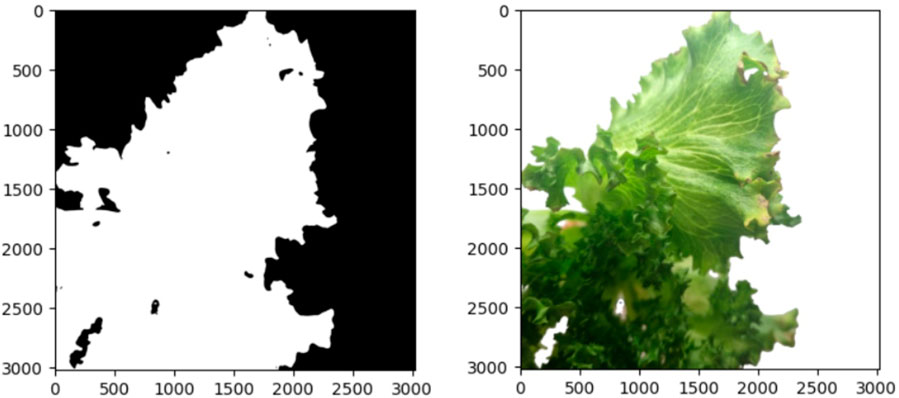
FIGURE 12. Final filter and Background-removed image.
In the last phase, a pixel colour detection algorithm is used to detect chlorosis and tip burn. A yellow to brown hue appears when there is chlorosis, whereas a brown to black hue appears when there is tip burn present. This range of hues is identified as the area of interest from the images (representing illness of the crop). These highlighted by performing a bitwise AND on the background-removed image with the mask formed from the areas of interest. This resulted in the identification image, e.g., Figure 13 right, that highlights the areas of disease.
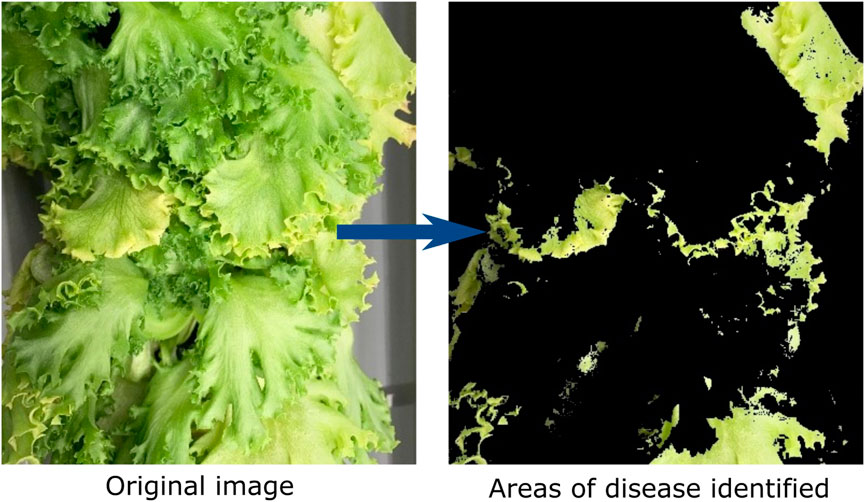
FIGURE 13. Identification of diseases.
The lower and upper bounds for the yellow, brown and black colours were derived from the HSV colour spectrum and further calibrated through empirical analysis of the set of lettuce crop images gathered for initial configuration. These bounds were adjusted over multiple images to produce suitable ranges for the categorization of healthy and unhealthy (diseased) crops. This process is automated to analyze different images that may have slightly different colour tones. By defining a lower and upper bound colour range, the algorithm is able to successfully identify the appropriate coloured pixels for classification. The initial use of this method is to consider both tip burn and chlorosis as disease factors, these areas are combined together for the classification of healthy and unhealthy crops.
Lastly, once the area of interest has been identified, the proportion of healthy crop to diseased areas is quantified, with chlorosis and tip burn again being combined for these calculations. The percentage of disease is calculated by totalling the pixels found in diseased areas of the crop and comparing this with the image of the crop with the background removed.
In this section, we present the results of using the growbox setup and analyse a comparison of the image analytics against an ML approach—using the same dataset.
In contrast to the image analytics approach, a ML approach was employed as a comparison using Teachable Machine (Carney et al., 2020) to train a Tensorflow (Abadi, 2016) model, using a 28-layer convolutional neural network (CNN) O’Shea and Nash. (2015). The purpose of this model was similarly to identify unhealthy lettuce crops in comparison to healthy ones. However, it was also constrained by the same small dataset for the specific growth environment. Therefore, training of the model involved 80 images each of healthy and diseased crops exhibiting chlorosis or tip burn symptoms. The model was designed to provide binary classification of the test data, which consisted of 20 healthy and 20 unhealthy images. The resulting accuracy of the model was calculated to be 92.5%. The confusion matrix for the machine learning approach is shown in Figure 14.
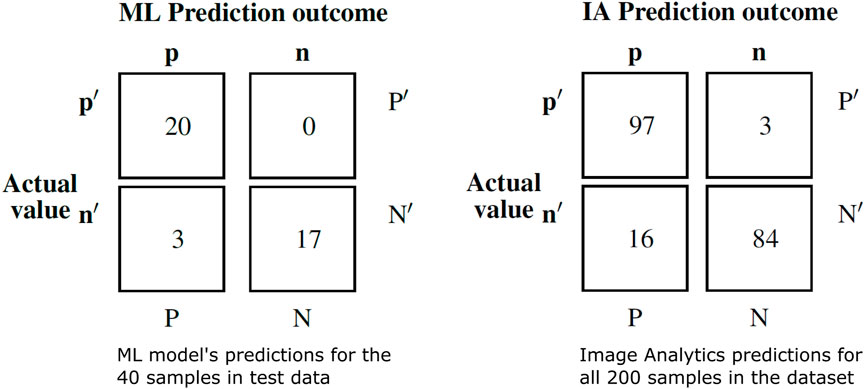
FIGURE 14. Confusion matrices.
The image analytics approach was tested on the same test set of images and achieved a perfect accuracy score of 100%, surpassing the ML approach. Notably, the image analytics approach did not require the acquisition and utilization of training data for model building. Furthermore, the approach was evaluated across the entire combined training and test data, as the training data was not employed in this method. For the analysis of 200 images, the resulting accuracy of the image analytics approach was calculated to be 90.5%. The confusion matrix for the 200 image analysis is shown in Figure 14. It is worth mentioning that the erroneous categorizations occurred in cases where there were minor indications of chlorosis. Ultimately, the disease threshold used in the image analytics approach differed from the initial human classification of the training images, resulting in a slight reduction in accuracy. However, this threshold can be adjusted in future applications to align with the definition of a diseased crop.
The production of this agnostic growbox system helps inform decisions of which sensors are necessary and cost-effective in urban farming environments. Ideally, arriving at fundamental configurations of IoT sensors for automated monitoring and assistance crop growth. This work will be used more broadly to establish and optimize the efficiency of growth conditions to enhance crop health and yields, alongside arriving at a cost-effective and scalable set of IoT devices and software.
In addition to the focus on scalable growbox solutions, this work also considers accessibility. In contrast to commercial growbox products, where fixed sensors and proprietary software are used, the approach presented here considers cheap sensors and actuators alongside open-source software. This provides more affordable solutions. Furthermore, the focus on cost-effective and modular hardware components supports a more customisable growbox solution (plug and play, providing components are configurable to the common MQTT protocol).
Scalability plays a crucial role in an urban farming solution that utilizes IoT sensors, and is a vital step towards achieving sustainability. In urban farming, scalability refers to the ability of the solution to accommodate and handle an increasing number of IoT sensors and data points as the agricultural operation expands. By designing a scalable solution, urban farming systems can easily adapt to larger farming areas, additional crops, and a growing number of sensors, ensuring seamless integration and data management. This scalability allows farmers to efficiently monitor and manage their agricultural operations at a larger scale, optimizing resource allocation, improving productivity, and reducing costs.
Furthermore, developing a robust solution is paramount for sustainability in urban farming. Robustness ensures the solution can withstand various challenges and uncertainties, such as sensor malfunctions and cyber attacks. By anticipating and addressing potential issues through fault-tolerant designs, and authentication and verification mechanisms, a robust urban farming solution can minimize downtime, maintain continuous data collection, and uphold the overall system integrity. This reliability fosters sustainable farming practices by enabling accurate decision-making, timely interventions, and effective resource utilization. Ultimately, the combination of scalability and robustness in an urban farming solution paves the way for long-term sustainability, empowering farmers to optimize their operations, improve yields, and promote environmentally conscious practices.
Additionally, this solution allows the possible profiling of crop characteristics at various stages of growth is beneficial for optimising growbox systems for a given budget or other constraints. Moreover, using automated growboxes facilitates easier and more efficient urban farming.
Regarding disease detection, the image analytics approach presented provides a possible preferential choice for analysis of crop health due to the distinct features of identification, and the ease of which they can be isolated using common image processing libraries.
A primary benefit of the presented image analytics approach is the ability to use it without having to gather hundreds of images to train a model. Creating relevant images to compose the dataset for specific urban farming environments is time consuming in several ways. Firstly, the time needed to capture the images themselves. Secondly, the time required to grow crops to the relevant growth stages—in the specified growth environment. Thirdly, when these models are used to classify disease, there is wastage of otherwise viable crops in order to generate diseased training and test images. The image analytics approach can essentially be carried out with minimal hardware and software requirements, and without the need of growing crops for image capture.
The authors are aware that comparing the accuracy of these approaches may be seen as an unfair comparison due to the relatively few images that the ML model was trained with. It is accepted that this comparison is not fully reflective of the accuracy afforded a more rigorously trained model. However, this study was intentionally working with the type of reduced datasets available in specific urban farming setups. Hence, applying this handicap to both options yields a relevant comparison in this case. Importantly, the preliminary results do indicate many salient benefits to the use of image analytics opposed to a machine learning approach. These findings are to be further explored in future works that incorporate more crop images and additional approach comparisons.
Overall, this manuscript presents a modular system for monitoring environmental factors in urban farming using IoT protocols and embedded controllers. The specific environmental factors monitored were identified through elicitation with the Singaporean urban farmer Archisen, and the system is designed to monitor and regulate these sub-environments for optimal crop growth.
The resulting augmented growbox uses sensors, controllers, and actuators to manage the environment. The sensors and actuators are managed through a web application dashboard. The dashboard uses MERN architecture and presents real-time sensor information from one or many connected growboxes, For the initial setup sensor data includes temperature, humidity, moisture level, and light intensity. The dashboard is designed to be managed by a collection of urban farmers, with a standard user login system and profile management page. Furthermore, the dashboard is dynamic, allowing users to add, update, remove growboxes, manage configurations, and assign tasks through the ticketing system.
The main contribution of this work is the development of a standardized and modular system that can monitor and regulate crop growth in urban farming. In addition to this, the effective detection of crop disease is automated through image analytics. This manuscript has laid out a modular framework which combines embedded controllers and a standard IoT protocol which facilitates heterogeneity. The web application dashboard presented was designed with requirements from the Singaporean urban farming context and allows for real-time monitoring and management of multiple agnostic growboxes.
The feasibility and effectiveness of the proposed approach has been described, with emphasis being placed on its potential to improve efficiency and scalability in urban farming. The scalability and modularity of the system also make it adaptable to various crops and farming environments. Overall, this manuscript contributes to progress in the research discipline by presenting a novel approach to monitoring and regulating the environment in urban farming that addresses current challenges and opens up new opportunities for automation and optimization in the field.
The datasets presented in this article are not readily available because the data generated in this work is constrained by the Research Collaboration Agreement between SIT and Achisen PTE LTD. Requests to access the datasets should be directed to Unlhbi5LaXJ3YW5AU2luZ2Fwb3JlVGVjaC5lZHUuc2c=.
RK: Conceptualization, Data curation, Formal Analysis, Funding acquisition, Investigation, Methodology, Project administration, Resources, Software, Supervision, Writing–original draft, Writing–review and editing. FA: Conceptualization, Data curation, Funding acquisition, Investigation, Methodology, Project administration, Software, Supervision, Writing–original draft, Writing–review and editing. IA: Writing–original draft, Writing–review and editing. AL, Funding acquisition, Investigation, Resources, Software, Supervision, Writing–review and editing. JL: Data curation, Funding acquisition, Investigation, Resources, Supervision, Writing–review and editing. SY: Data curation, Funding acquisition, Resources, Writing–review and editing.
The authors declare financial support was received for the research, authorship, and/or publication of this article. This work is partially funded by Singapore’s Ministry Of Education via SIT’s Ignition grant, code: R-MOE-A405-I009. The work is also partially funded through in-kind contributions from Archisen Pte. Ltd.
Thanks to SIT Ignition grant funding for financially supporting this work. Thankful to Archisen Pte. Ltd. for their co-funding and support with this work. Special mention to Muhammad Syafiq Bin Rapngai and Shirley Tan for their contribution to this work. Special thanks also to SIT ICT students: Puan Jin Yao Daren, Lee Wai Kwong Thomas, Ether Tan Su Wee, Chua Xue Ning Joey, Heng Choon Yuan Gerald, Hun Yew Kwang Brian, Yang Xiao, Jimeno Johanna Charissa Mortel, Lee Wei Jie, Png Han Zheng, Tan Sin Jie, Zuriel Nicholas Ching Fei, and Zaw Wana for their significant contributions to the development of this work.
The author IA declared that they were an editorial board member of Frontiers in Artificial Intelligence at the time of submission. This had no impact on the peer review process and the final decision. Authors JHL and SY are employed by Archisen Ptd Ltd.
The remaining authors declare that the research was conducted in the absence of any commercial or financial relationships that could be construed as a potential conflict of interest.
All claims expressed in this article are solely those of the authors and do not necessarily represent those of their affiliated organizations, or those of the publisher, the editors and the reviewers. Any product that may be evaluated in this article, or claim that may be made by its manufacturer, is not guaranteed or endorsed by the publisher.
Abadi, M. (2016). “Tensorflow: learning functions at scale,” in Proceedings of the 21st ACM SIGPLAN international conference on functional programming, Nara, Japan (New York, NY: ACM).
Archisen Pte Ltd (2021). Home to your urban farm solutions. Available At: https://www.archisen.com/ (Accessed 07 September, 2023).
Behboudian, M., Pickering, A., and Dayan, E. (2016). Deficiency Diseases, Principles. Defic. Dis. Princ. 2016, 219–224. doi:10.1016/B978-0-12-394807-6.00121-0
Carney, M., Webster, B., Alvarado, I., Phillips, K., Howell, N., Griffith, J., et al. (2020). “Teachable machine: approachable web-based tool for exploring machine learning classification,” in Extended abstracts of the 2020 CHI conference on human factors in computing systems, Honolulu, HI (New York, NY: Association for Computing Machinery).
Chia, S., and Lim, M. (2022). “A critical review on the influence of humidity for plant growth forecasting,” in IOP conference series: materials science and engineering (Bristol, England: IOP Publishing).012001
Controlled Environments Limited (2023). Plant growth chambers and rooms. Conviron. Available at: https://www.conviron.com/.
Diaz, C. (2021). Three ways singapore is designing urban farms to create food security. New York: Quartz. Available at: https://qz.com/1985399/3-ways-singapore-is-creating-food-security-with-urban-farms/.
Espressif Systems (2023). Esp32-cam. Available at: https://www.espressif.com/sites/default/files/documentation/esp32_technical_reference_manual_en.pdf.
Gehan, M. A., Fahlgren, N., Abbasi, A., Berry, J. C., Callen, S. T., Chavez, L., et al. (2017). Plantcv v2: image analysis software for high-throughput plant phenotyping. PeerJ 5, e4088. doi:10.7717/peerj.4088
Gozzovelli, R., Franchetti, B., Bekmurat, M., and Pirri, F. (2021). “Tip-burn stress detection of lettuce canopy grown in plant factories,” in 2021 IEEE/CVF International Conference on Computer Vision Workshops (ICCVW), Montreal, BC, Canada, 11-17 October 2021 (IEEE), 1259–1268. doi:10.1109/ICCVW54120.2021.00146
Grant, A. (2023). What is fertigation – how does fertigation work and how to do it. New York: Gardening Know How. Available at: https://www.gardeningknowhow.com/garden-how-to/watering/is-fertigation-good-for-plants.htm.
Hamouda, Y., and Msallam, M. (2020). Variable sampling interval for energy-efficient heterogeneous precision agriculture using wireless sensor networks. J. King Saud University-Computer Inf. Sci. 32, 88–98. doi:10.1016/j.jksuci.2018.04.010
Haris, I., Fasching, A., Punzenberger, L., and Grosu, R. (2019). “Cps/iot ecosystem: indoor vertical farming system,” in 2019 IEEE 23rd International Symposium on Consumer Technologies (ISCT), Ancona, Italy, 19-21 June 2019 (IEEE).
Hegedűs, C., Frankó, A., Varga, P., Gindl, S., and Tauber, M. (2023). “Enabling scalable smart vertical farming with iot and machine learning technologies,” in NOMS 2023-2023 IEEE/IFIP Network Operations and Management Symposium, Miami, FL, USA, 08-12 May 2023 (IEEE), 1–4.
Ian Tiseo (2023). Global atmospheric concentration of carbon dioxide 1990-2023, by month. Available at: https://www.statista.com/statistics/1091999/atmospheric-concentration-of-co2-historic/ (Accessed 26 August, 2023).
Kalera (2022). Kalera singapore. Available at: https://kalera.com/singapore/ (Accessed 02 May, 2023).
Kalman, R. E. (1960). A new approach to linear filtering and prediction problems Trans. ASME, J. Basic Eng. 82 (Series D), 35–45.
Kwon, C. T., Heo, J., Lemmon, Z. H., Capua, Y., Hutton, S. F., Van Eck, J., et al. (2020). Rapid customization of solanaceae fruit crops for urban agriculture. Nat. Biotechnol. 38, 182–188. doi:10.1038/s41587-019-0361-2
Loresco, P., and Dadios, E. (2020). Vision-based lettuce growth stage decision support system using artificial neural networks. Int. J. Mach. Learn. Comput. 10, 534–541. doi:10.18178/ijmlc.2020.10.4.969
M5Stack (2019). M5stickc. Available at: https://docs.m5stack.com/en/core/m5stickc (Accessed 07 July, 2023).
Ma, Z., Rayhana, R., Feng, K., Liu, Z., Xiao, G., Ruan, Y., et al. (2022). A review on sensing technologies for high-throughput plant phenotyping. IEEE Open J. Instrum. Meas. 1, 1–21. doi:10.1109/OJIM.2022.3178468
Maldonado, A. I. L., Reyes, J. M. M., Breceda, H. F., Fuentes, H. R., Contreras, J. A. V., and Maldonado, U. L. (2019). “Automation and robotics used in hydroponic system,” in Urban horticulture-necessity of the future (London: IntechOpen).
Mishra, B. (2018). “Performance evaluation of MQTT broker servers,” in proceedings of the international conference on computational science and its applications (Cham, Switzerland: Springer), 599–609.
Mohd Ali, N., Md Rashid, N. K. A., and Mustafah, Y. M. (2013). Performance comparison between rgb and hsv color segmentations for road signs detection. Appl. Mech. Mater. 393, 550–555. doi:10.4028/www.scientific.net/amm.393.550
MongoDB, I. (2023). Mern stack explained. New York: MERN. Available at: https://www.mongodb.com/languages/mern-stack-tutorial.
Narvios, W. M. O., Cesa, C. K. N., Batayola, F. F., Bolo, K., Verdida, S. M., and Nguyen, Y. (2022). Smart aquaponics system for a small-scale farmer for highly urbanized settler. AIP Conf. Proc. 2502, 050001. doi:10.1063/5.0108728
Node-RED (2023). Node-red. Available at: https://nodered.org/ (Accessed 07 September, 2023.
NP Foods Singapore (2022). Identifying nutrient deficiency in plants. Available at: https://www.nparks.gov.sg/nparksbuzz/oct-issue-2020/gardening/identifying-nutrient-deficiency-in-plants (Accessed 02 May, 2023).
O’Shea, K., and Nash, R. (2015). An introduction to convolutional neural networks. arXiv preprint arXiv:1511.08458.
Percival Scientific Inc (2022). Biological incubators and research chambers. Perry, lowa: Percival Scientific Inc. Available at: https://www.percival-scientific.com/.
Phenospex - Smart Plant Analysis (2022). Planteye f600 multispectral 3d scanner for plants - phenospex. Available at: https://phenospex.com/products/plant-phenotyping/planteye-f600-multispectral-3d-scanner-for-plants/ (Accessed 29 October, 2022).
Prasad, P. V. V. (2003). “Plant Nutrition: iron Chlorosis,” in Encyclopedia of applied plant sciences (London, UK: Elsevier), 649–656. doi:10.1016/B0-12-227050-9/00240-4
Pulli, K., Baksheev, A., Kornyakov, K., and Eruhimov, V. (2012). Real-time computer vision with opencv. Commun. ACM 55, 61–69. doi:10.1145/2184319.2184337
Seedo (2021). Fully automated hydroponic indoor grow box. Bengaluru, Karnataka: LEAF. Available at: http://www.seedolabs.com/index.php.
SharathKumar, M., Heuvelink, E., and Marcelis, L. F. (2020). Vertical farming: moving from genetic to environmental modification. Trends plant Sci. 25, 724–727. doi:10.1016/j.tplants.2020.05.012
Tham, M. (1998). “Dealing with measurement noise. moving average filter,” in Chemical engineering and advanced materials (Newcastle upon Tyne, UK: Newcastle University).
Tibbitts, T. W., and Bottenberg, G. (1976). Growth of lettuce under controlled humidity levels1. J. Am. Soc. Hortic. Sci. 101, 70–73. doi:10.21273/jashs.101.1.70
Wijanarko, A., Nugroho, A., Kusumastuti, A., Dzaky, M., Masithoh, R., Sutiarso, L., et al. (2021). “Mobile mecavision: automatic plant monitoring system as a precision agriculture solution in plant factories,” in IOP Conf. Ser.: Earth Environ. Sci (Malang, Indonesia: IOP Publishing).012026
Wimalasiri, E. M., Jahanshiri, E., Chimonyo, V., Azam-Ali, S. N., and Gregory, P. J. (2021). Crop model ideotyping for agricultural diversification. MethodsX 8, 101420. doi:10.1016/j.mex.2021.101420
Keywords: agritech, IoT, urban farming, smart systems, growbox, image analytics, machine learning, phenotyping
Citation: Kirwan RF, Abbas F, Atmosukarto I, Loo AWY, Lim JH and Yeo S (2023) Scalable agritech growbox architecture. Front. Internet. Things 2:1256163. doi: 10.3389/friot.2023.1256163
Received: 13 July 2023; Accepted: 29 September 2023;
Published: 26 October 2023.
Edited by:
Sye Loong Keoh, University of Glasgow, United KingdomReviewed by:
Yung-Wey Chong, University of Science Malaysia (USM), MalaysiaCopyright © 2023 Kirwan, Abbas, Atmosukarto, Loo, Lim and Yeo. This is an open-access article distributed under the terms of the Creative Commons Attribution License (CC BY). The use, distribution or reproduction in other forums is permitted, provided the original author(s) and the copyright owner(s) are credited and that the original publication in this journal is cited, in accordance with accepted academic practice. No use, distribution or reproduction is permitted which does not comply with these terms.
*Correspondence: R. F. Kirwan, Unlhbi5LaXJ3YW5AU2luZ2Fwb3JldGVjaC5lZHUuc2c=
Disclaimer: All claims expressed in this article are solely those of the authors and do not necessarily represent those of their affiliated organizations, or those of the publisher, the editors and the reviewers. Any product that may be evaluated in this article or claim that may be made by its manufacturer is not guaranteed or endorsed by the publisher.
Research integrity at Frontiers
Learn more about the work of our research integrity team to safeguard the quality of each article we publish.