 Syed Salman Alam
 Muhammad Al-Qurishi
- Research and Innovation Division, Department of Research, Elm Company, Riyadh, Saudi Arabia
The fact that almost every person owns a smartphone device that can be precisely located is both empowering and worrying. If methods for accurate tracking of devices (and their owners) via WiFi probing are developed in a responsible way, they could be applied in many different fields, from data security to urban planning. Numerous approaches to data collection and analysis have been covered, some of which use active sensing equipment, while others rely on passive probing, which takes advantage of nearly universal smartphone usage and WiFi network coverage. In this study, we introduce a system that uses WiFi probing technologies aimed at tracking user locations and understanding individual behavior. We built our own devices to passively capture WiFi request probe packets from smartphones, without the phones being connected to the network. The devices were tested at the headquarters of the research sector of the Elm Company. The results of the analyses carried out to estimate the crowd density in offices and the flows of the crowd from one place to another are promising and illustrate the importance of such solutions in indoor and closed spaces.
1 Introduction
In a world in which a large majority of people carry smart devices everywhere and smart buildings are becoming a new standard, there are far more opportunities to collect spatial data and use it to enhance environments and experiences Lee et al. (2021). By accurately tracking a large number of devices in real time, researchers can gain valuable insights into behavioral patterns and identify hidden trends that would be difficult to recognize without this form of data. WiFi data represent a readily available source that can be easily tapped into, and therefore the development of advanced techniques that ensure efficient capturing with high precision is currently a priority. If successful, the current wave of studies targeting WiFi probing have the potential to radically change digital systems, as we know them today, and unlock the next level of artificial intelligence Sharma et al. (2021); Arasteh et al. (2016).
While studies on sensor-based location probing have only recently commenced, numerous studies from this field exist that deserve attention. Wang et al. (2013); Shuo Li et al. (2020) suggested one of the first systems for the use of WiFi location probing in search and rescue operations, whereas the authors in Handte et al. (2014) experimented with estimating crowd density using similar concepts. Studies by Piccialli et al. (2019); Dogan et al. (2019) attempted to analyze human behavior based on Bluetooth signals from mobile phones with various degrees of success. Another study based on WiFi location probing was also proposed by Lesani and Miranda-Moreno (2018), wherein people were at large events, and Yin and Chi (2021) attempted to track people’s movement in an urban environment. The authors in Kontokosta and Johnson (2017) also relied on WiFi data to analyze the behaviors of city dwellers, demonstrating how this technology can be used in a broader context. More specific applications of WiFi probing include studies by Petre et al. (2017), who analyzed human mobility and tracked crowd behavior during a festival. While all these studies demonstrate the viability of device tracking, there are many unresolved issues that need to be resolved through further studies.
In this study, an instrumental model that deals with the data analysis aspect of WiFi probing is proposed, which introduces methods to compare the trajectories of individual users, discovers trends from their interactions, and enables a more detailed analysis of group behavior. Understanding user journey behavior will help in several domains such as commercial, health, and crowd management. This problem has been previously addressed in several scientific literature Schauer et al. (2014); Bai et al. (2017). The objective of this paper is to present a way to build a scalable platform that can be readily deployed, while at the same time reducing the network traffic as much as possible and thus decreasing the demands from the backend server. The proposed system cannot capture density and flow data with 100% certainty, but it can provide enough information to differentiate between locations based on density. The proposed approach comprises two main components: hardware and software. Wi-Fi probe sensing hardware used in this model involved two custom-made devices, each containing a number of components such as WiFi module, LDO voltage regulator, nano Pi2 with Linux OS, and LED’s. The main difference between them was the mode of network connection, with one device using LAN network and the other connecting to a wireless network. A back-end server supports the system, with MQTT protocol used for communication between the probing devices and the server. Software aspect of the system included two separate layers—locally embedded software within the device serving as the interface, and cloud-based applications that are hosted on the server. The embedded layer consists of a bash script that runs when the system is booted, and Python script that allows the user to control the device. Meanwhile, data collection service connects to the server and archives the incoming data, while density calculation service provides estimations of crowd density in real time using data from the server. Another application uses historical location data to determine people flow and map out user journeys. Finally, data analytics application allows for easy visualization of data and its re-organization through a user-friendly dashboard, and facilitates proactive setting of density limits for a given space.
The remainder of this paper is organized as follows. In Section 2, we provide a brief background of the most important concepts in this field. Section 3 describes the hardware design, Section 4 describes the experiments conducted to understand the behaviors of smart phones, Section 5 describes the embedded software, Section 6 discusses the cloud services, Section 7 describes our density estimation and journey, and Section 8 concludes the study.
2 Preliminaries
In this section, we provide general preliminaries of the different methodologies that can be used for people counting and user-movement tracking tasks.
2.1 People counting approaches
The need to manage indoor crowds is an increasingly important requirement in many fields. This domain is served by a wide range of technologies, including the latest smart tools. Several technologies can be used to track individuals and to count the total number of people in a given area. The most significant approaches include the computer-vision-based and WiFi sensing methods.
2.1.1 Computer-vision-based methodology
Computer vision-based crowd counting has been growing in popularity in recent years, owing to its extraordinary accuracy. The main drawback of this system in practical deployment is its extremely high computing power requirement, which makes it difficult to implement in large areas. An additional complication arises from the fact that face registration and recognition are the preconditions for tracking the flow of the crowd, raising all kinds of privacy-related, financial, and logistical issues.
2.1.2 WiFi and probe packets
WiFi technology allows digital devices to send different types of frames through the WiFi packets. There three main categories are data, control, and management frames. Each frame can have different sub frames. Data frames are primarily used for data transmission, and control frames serve for channel acquisition, carrier sensing maintenance function, and acknowledgments, whereas management frames are used to join or leave a WiFi network and move association from one WiFi network to another WiFi network.
We performed a detailed study of WiFi probe packets classified as management frames. A mobile phone continuously broadcasts WiFi probe request packets to connect to a WiFi access point (AP). These probe packets are sent even if the mobile phone is already connected to a WiFi access point. This enables the device to remain connected to the WiFi network if there is a problem with the internet connectivity of that AP, or if the user moves away from the nearest AP. The WiFi probe packet mechanism allows the device to provide continuous Internet connectivity to the user.
Every mobile phone enabled with WiFi has a unique identifier called the MAC address. The MAC address is unique to each device and is created by the manufacturer to identify each product. Every WiFi probe packet contains the MAC address of the sending device.
2.1.3 Table abbreviations
In this section, we list some of the terms and abbreviations used in the study, as shown in Table 1.
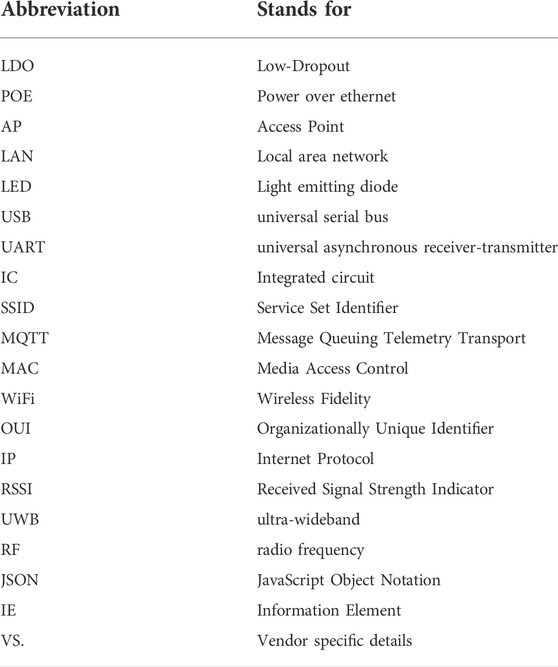
TABLE 1. All used abbreviations.
3 Literature review
Because WiFi probing is used in various contexts in the reviewed literature, many different methodological concepts have been introduced by researchers. The scope and environment of a project drive the selection of methods; for example, studies focused on indoor spaces logically have different requirements, such as large, open-space tracking projects that may cover areas as wide as Riyadh Cheng et al. (2021). However, there is a sequence of operations that is common for most studies from this group, with several clearly defined stages. Data collection is the first task, and researchers choose an indicator such as a probe request to a mobile AP or MAC address randomization to identify the current location of each device or user. Passive and active scanning techniques can be deployed, which can either track requests directed to a specific SSID or capture all AP requests Zhou et al. (2020); Pu et al. (2021); Cheng et al. (2021).
The information collected during this stage can be divided into spatial, temporal, and semantic information, giving researchers many possibilities for interpretation and pattern detection. It is also possible to identify the manufacturer of a mobile device by analyzing its MAC address. After the data are collected, they are typically aggregated to create a dataset for further analysis. In studies focusing on occupancy estimation, aggregated numbers can be verified by manual observation Vattapparamban et al. (2016); Ciftler et al. (2017); Pereira et al. (2019); Azimi and O’Brien (2022). Pre-processing operations also include cleanup of redundant requests and removal of devices that appear stationary, as well as interpolation for time periods. User identities may also be obscured by replacing the actual MAC addresses in the public dataset. The next step involves location detection for specific times, and this step is nearly universal, regardless of the purpose of the study. However, some studies are predominantly concerned with device counting and tracking the number of people in a certain zone or location Li et al. (2018); Singh et al. (2021); Alo et al. (2022).
However, studies aimed at analyzing movement track more complex spatio-temporal patterns indicative of a person’s activity Traunmueller et al. (2018); Gu et al. (2021); Uras et al. (2020); Zhou et al. (2020). Such studies typically create trajectories between WiFi APs, which may require the use of complex statistical operations, such as K-means clustering, density-based clustering, or hidden Markov models. In some cases, graphs can be constructed or trajectories can be superimposed over geographic maps or building floor plans Traunmueller et al. (2018). Another key focus is describing interpersonal interactions, which can be understood through the construction of “social networks” comprising individuals who are regularly meeting in various locations and at various times and might be connected to others in a variable degree of separation Wang et al. (2017). These connections can be deduced based on trajectory similarity and direct overlaps Wang et al. (2017); Li et al. (2021). From this stage, it is possible to conduct data mining and search for intimate relationships between individuals, effectively turning simple location-based information into semantic links that can be used to classify users into different groups Zhou et al. (2020); Redondi and Cesana (2018). Interpretation of WiFi data always requires a contextual understanding of the observed phenomenon; for example, individuals within an educational institution will interact with each other in different ways than people in a public setting, which must be considered when attempting to explain the findings Li et al. (2021). Most methods for WiFi sniffing or probing were tested by their authors to a certain degree. The overall impression is that data collection and analysis techniques based on this concept can be very effective in the correct setting. Capturing the data was generally conducted with ease, and simple tasks such as occupancy detection or crowd estimation were completed very accurately, with over 90% of the devices correctly located within several meters. In such cases, it was often possible to compare findings with the ground truth based on direct observation to obtain accurate estimations. However, studies interested in large-scale group behavior often aimed to capture finer semantic relationships between subjects. Because many of the findings were qualitative, it was more difficult to verify how effectively these methods accomplish their objectives Uras et al. (2020); Yan Li et al. (2020); Retscher (2020).
More complex interactions are typically modeled on small samples of just a few hundred users, and should thus be seen more as demonstrations of the concept’s viability than actual experimental confirmations Li et al. (2021); Yang et al. (2021). Some researchers have attempted to quantify the key elements of their studies, including trajectory inference, which is a crucial step for tracking movement and understanding patterns of social activity Yang et al. (2021). Although the tested methods were shown to be operable and reasonably successful under the test scenario, it is difficult to see any of them as complete and ready for commercial exploitation. Hence, the overall achievements of these studies can be described as intriguing and inspiring, but hardly definitive in any sense.
4 System architecture
The proposed system architecture is illustrated in Figure 1. The system comprises three main components. The first component is the hardware component, which contains all the devices developed and used in this study. Another key element is the cloud service component, which includes online services developed for data collection, analysis, and presentation to the user. Finally, there is an embedded software component, which is concerned with the software that is built into the device and serves to connect the hardware, software, and end user. All three components are described in the following subsections.
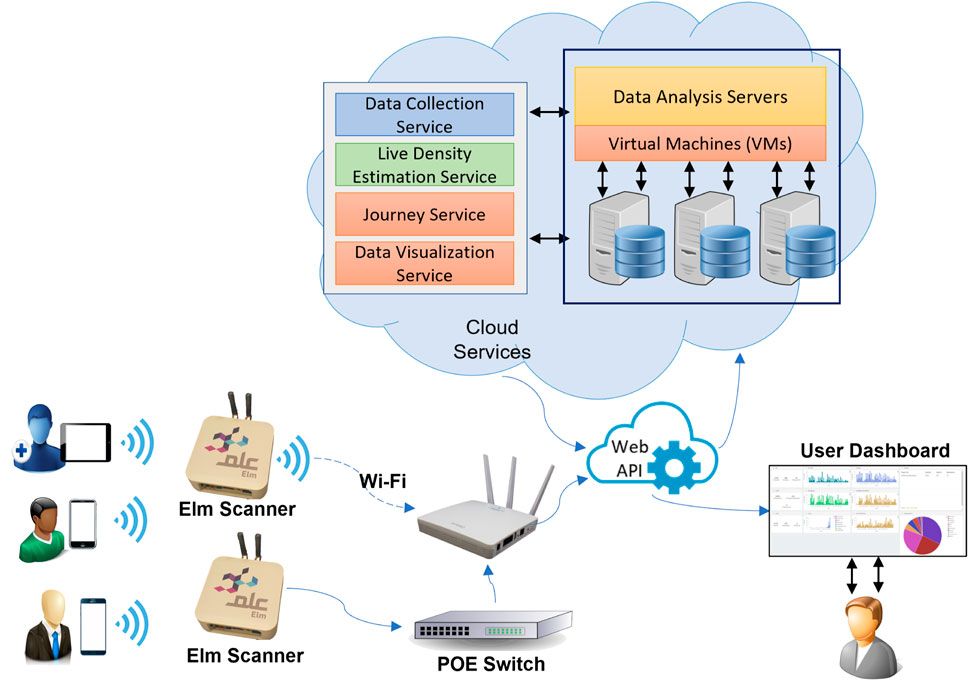
FIGURE 1. Proposed system architecture.
4.1 Hardware component
Owing to the lack of WiFi sensing hardware off the shelf, we decided to develop our own device that would be tailored to our custom needs. Considering the requirements of this device and the expected deployment scenarios, two types of sensing devices were built, as shown in Figure 2. Each device had a dedicated WiFi module, which was used for scanning only. There were two options for Internet connectivity: with one device using a WiFi module and connecting to an AP Figure 2. This device obtained input power from a 5 V wall adapter via a USB cable. The module contained an LDO for the voltage regulator, two WiFi modules, nano Pi2, LEDs, and a USB to UART IC.
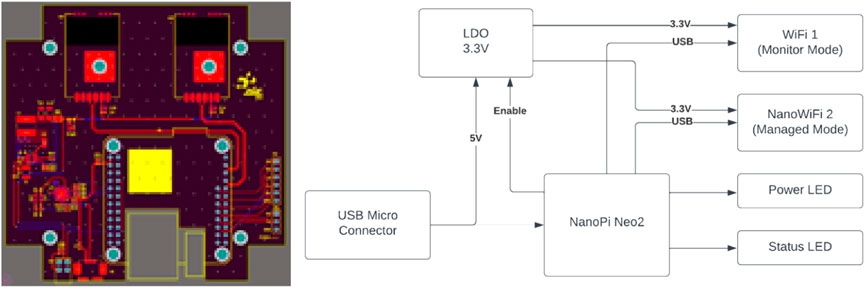
FIGURE 2. Developed hardware device powered by 5 V USB adapter.
The other device used power over ethernet (POE) to connect LAN networks, as shown in Figure 3. This version contained a POE splitter, LDO voltage regulator, WiFi module, nano Pi2, LEDs, and USB-to-UART IC. Nano Pi2 technology supported the Linux operation system at the core of both devices. It had an Allwinnder H5 Quad-core64bit cortex A53 CPU with 512 MB DDR3 RAM, along with other interfaces such as GPIOs and USB. This provided more processing power and the flexibility necessary to perform certain tasks on the edge. Figure 4 shows the assembled WiFi sensing device that contains two WiFi modules.
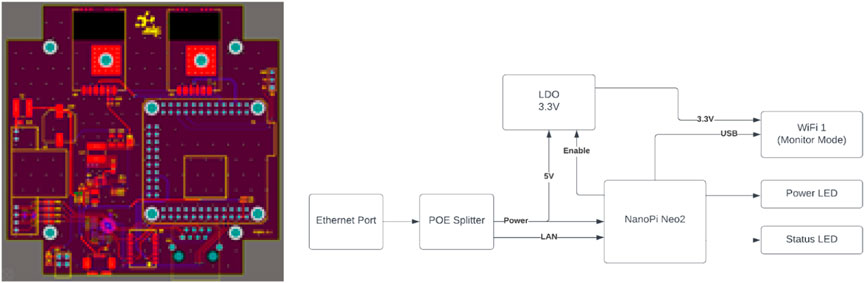
FIGURE 3. Developed hardware device powered by POE.
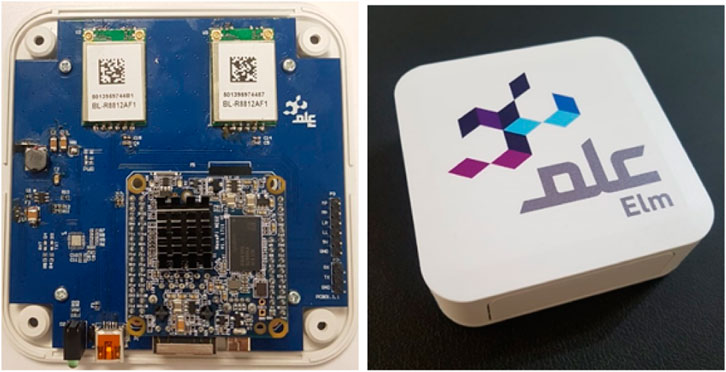
FIGURE 4. Developed and assembled device.
4.1.1 Embedded software
To scan for WiFi probe packets, the WiFi interface needed to be set to the monitor mode. This was accomplished by using a bash script that converted the WiFi mode from managed to monitored. As the mode of the interface was not permanently saved, this script ran every time the system booted. After this script successfully changed the mode, the main Python script that performed the scanning was launched. Immediately after launching, it established a connection to the server through MQTT. Every time it connected with MQTT, it sent a birth packet on a log topic and set the last will packet. This packet was sent to the server, and if the connection with the device was lost, this message was published, indicating that the device had stopped working. All packets contained the MAC address as a unique identifier. The birth packet also contained the version of the software the device was running and its local IP address that was used for maintenance, if required. The initialization process is illustrated in Figure 5.
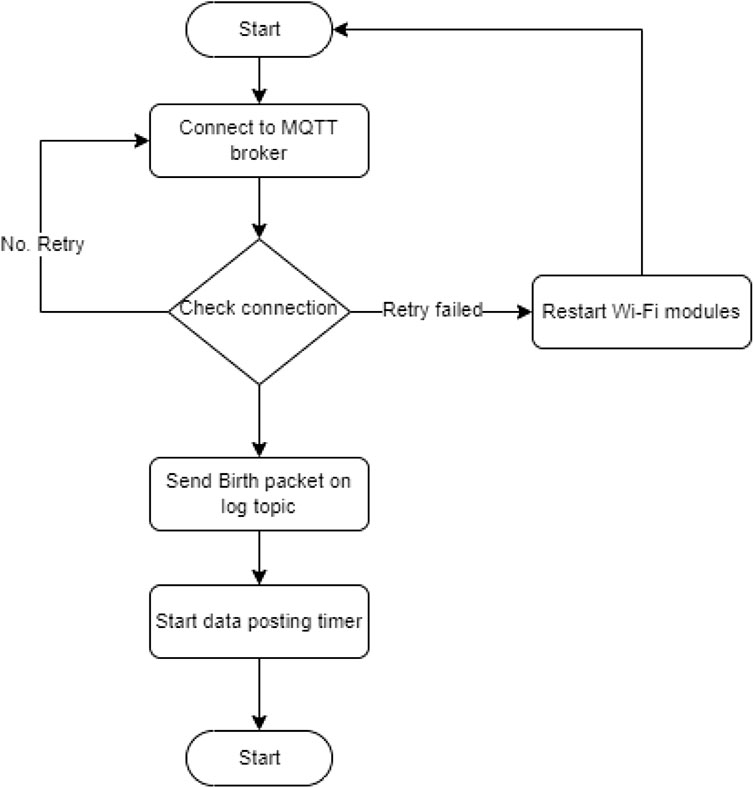
FIGURE 5. Initialization flow chart for the main script.
Once the MQTT connection was successfully established, the device started scanning for the packets. The device scanned only WiFi probe packets and ignored all other packets. A WiFi packet contained the MAC address of the device, the received signal strength, SSIDs of previously connected networks, information elements, and vendor-specific details. With the help of updated organizationally unique identifier (OUI) we learned the manufacturer of the device behind each MAC address. Based on the OUI information, vendors that were not known for manufacturing mobile phones were ignored. This information, along with the time when the packets were received, was temporarily stored inside the device until the packet transmission interval was reached.
Once the data were received, they were preprocessed to reduce the network overhead and optimize the packets, as depicted in Figure 6. Based on the conducted experiments, multiple probe request packets were received for each probe request interval, and most of the time, these packets had very slight changes in content. Small changes were routinely ignored; however, all the major changes were notified. To reduce the packet size, md5 HASH of the information element data and vendor-specific data were generated and stored in the device. The device maintained the stored data until the posting interval. Once the posting interval was reached, the device sent compiled data in JSON format and published it on the MQTT data topic. Table 2 below presents the results before and after the optimization technique is applied: In the first test, three smartphones were placed in a Faraday bag and data was collected continually for 3 h and 14 min. Without optimization there were 120,000 bytes, while with the optimization the total size of the packets was reduced to 11,305 bytes. In test number two data collection was performed in an office room with seating capacity for eight people, with other people entering and exiting at random intervals. The test was conducted for 44 min. The initial data size was 509,183 bytes, but with optimization it was brought down to just 68,251 bytes. Finally, test number three involved data collection in a different office room with seating capacity for seven people, with additional individuals being able to come and leave at various times. In this case, the duration of the test was 2 h 13 min. Without optimization a total of 1,226,903 bytes were collected, and this number was lowered to 249,870 bytes when optimization was used.
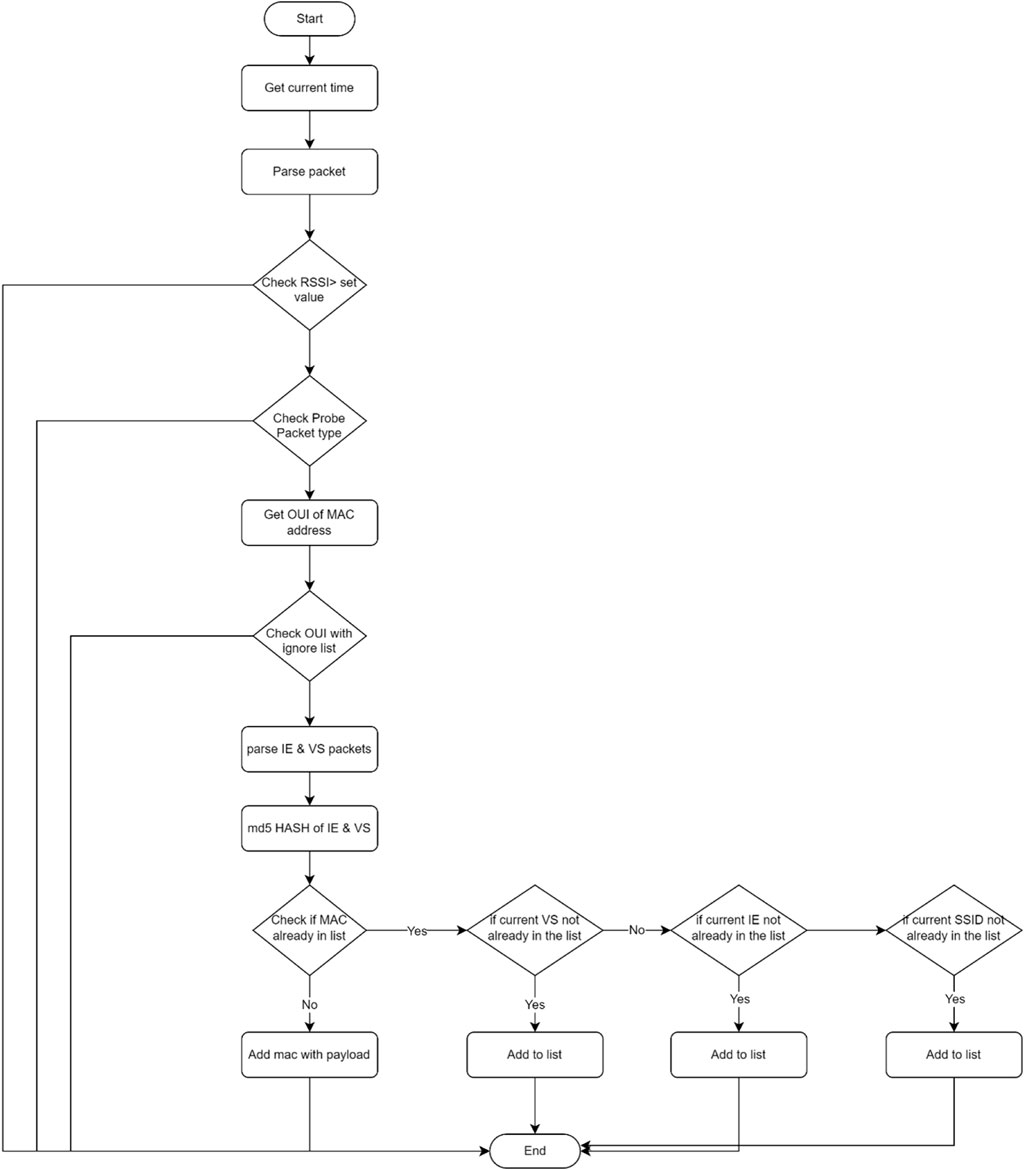
FIGURE 6. Preprocessing the data after receiving the WiFi probe request packet.
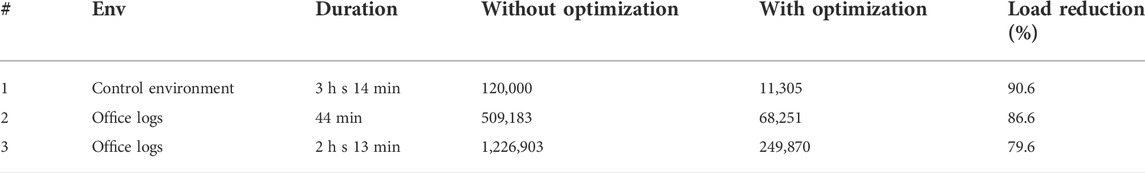
TABLE 2. Test results of reducing the network he load.
4.2 Cloud services component
Several cloud-based services were developed that are useful for tasks such as collecting data from devices, calculating the density in an area at a particular time, monitoring the user’s journey, and performing advanced data analysis and visualization. In addition, the mosquito MQTT server was deployed to communicate with the devices. Details of these services are explained in the following sections.
4.2.1 MQTT server
For the communication of the devices with the backend server, MQTT standard for IoT messaging was used. It is a lightweight messaging protocol. Each client in MQTT connected to the MQTT broker. Clients published messages or data using a topic. Services that needed to use the data subscribed to that topic and received the data in real-time once it was published. This rendered the system scalable and reliable.
4.2.2 Data collection service
A data collection service was used to archive the raw data arriving from the devices. This service connected to the MQTT server, and whenever there were data from the available devices, it was parsed and stored in the database. The stored data contained the date, time, and MAC address or ID of each scanned device. The stored data were used to perform analytic tasks and recalculate the density if there were any updates in the density calculation algorithm. This process is illustrated in Figure 7.
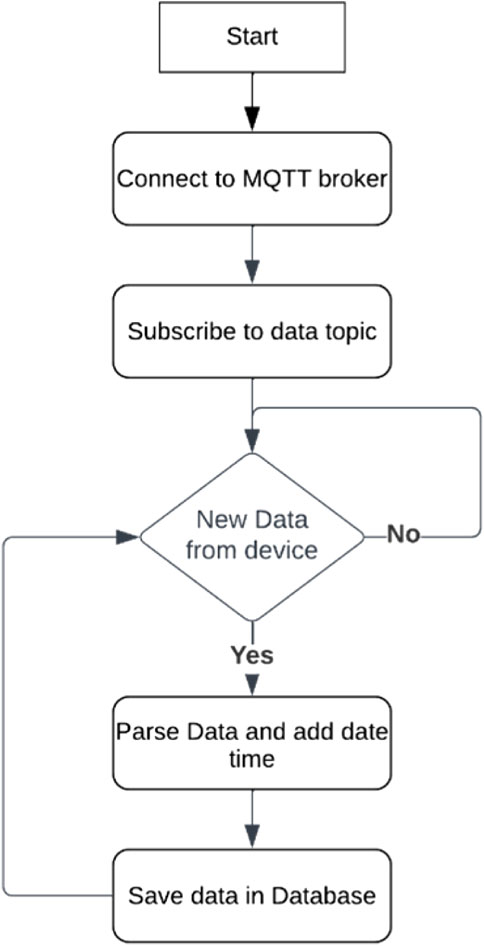
FIGURE 7. Process of receiving data on cloud server and storing it in database.
4.2.3 Density calculation service
The density calculation service worked with sensor data in real-time. The service first connected to a database as shown in Figure 8 and collected user information for a specific company. It then recognized all the buildings associated with a company and all the unique ID scanners in that building. To receive real-time data, it connected to the MQTT broker and subscribed to relevant topics. Each device consolidated the data (as mentioned above) and published them on MQTT within its posting interval.

FIGURE 8. Initialization process of the Density Calculation Service.
Upon receiving the data from the device, a dictionary was maintained for all probe packets with the time when they arrived. The MAC address of the probe request packet was the unique key. Every time a set of probe packets was received from the scanning device, the time the last packet was received was updated. After a configurable interval of 60 s, the time at which the last packets from the MAC were received was compared with the current time. If the time difference was greater than 240 s or 4 min, the packet was removed from the list as depicts in Figure 9. During the experiments, it was observed that, even if the MAC address was randomized, it still sent the same randomized MAC address of that phone in most cases.
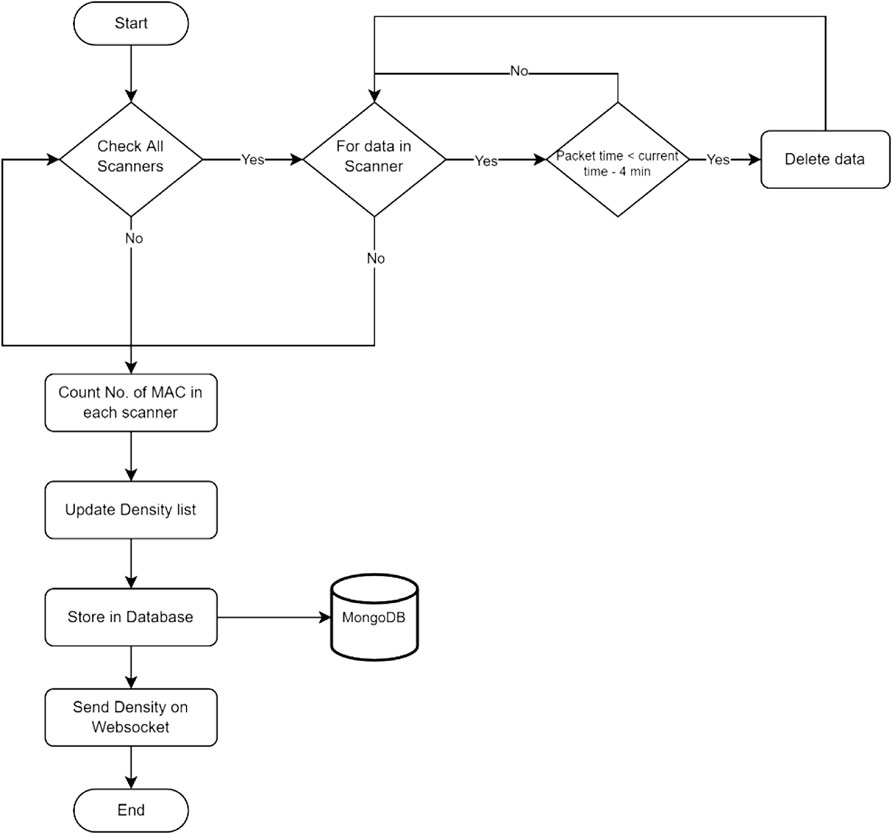
FIGURE 9. Density estimation process.
The total number of leftover MAC addresses was counted for each scanner and sent over WebSocket for real-time updates on the dashboard. The count was also saved in the database for historical records of the number of people in that area. This combination of processing data at the edge and processing the remaining data in the cloud for density calculation provided an approximate count of people in the area near the scanner. Depending on practical concerns, further improvements can be made to the scanning devices to improve their accuracy by adding a directional antenna and setting up the latest RSSI filter.
4.2.4 User journey
To obtain user journey estimations or flow calculations, all non-randomized MAC addresses were analyzed. The system checked all scanners in which the MACs were detected. Time-based detection was then performed to determine the temporal distribution of the input. In this step, the location where a particular MAC was first detected was noted and matched with the detection of that MAC by another scanner, consequently increasing the number of people in that direction. Another technique partially ignored the MAC address and focused on the information elements contained in the probe packets. Even when a mobile phone randomized the MAC address, it sent the same information element, which made it a reliable differentiator. However, there were some instances where smartphone models sent identical information elements, which made it difficult to track the flow/journey of such devices.
4.2.5 Data analysis service
A dashboard was built to visualize and present the data. This dashboard had several components and was designed to consider different users and entities. Only a super admin could create an entity, but anyone with admin rights or even a normal user could add users to that entity. The admin could log in and create buildings, upload the floor map in any image format, place scanners on the map, and define the maximum density for that floor as shown in Figure 10.
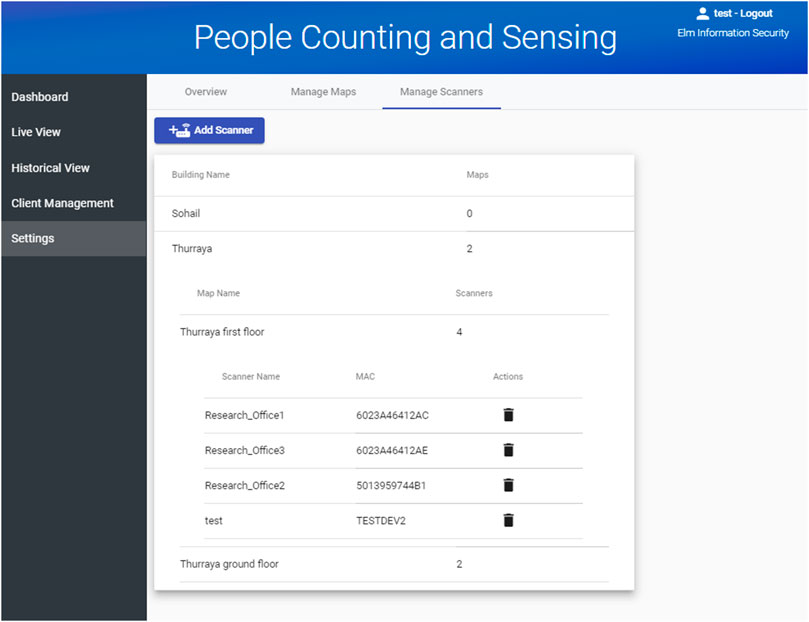
FIGURE 10. Admin portal to add floor map and devices.
On the dashboard, users could view the density of people in the room with scanners in the form of line charts, as shown in Figure 11, or heat-maps, as shown in Figure 11. The user could select a date and view historical data in any of these two formats. Another feature of the dashboard is the journey of the people in the Sankey diagram, as shown in Figure 12.
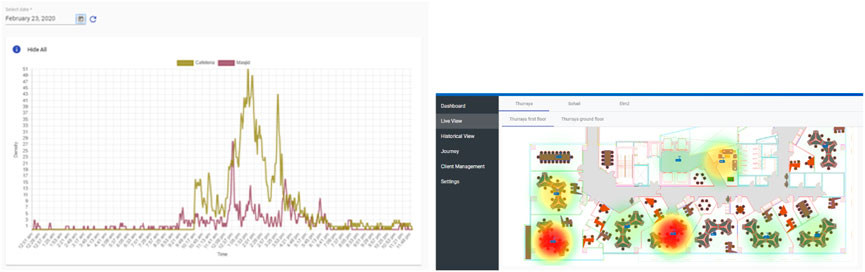
FIGURE 11. User dashboard.
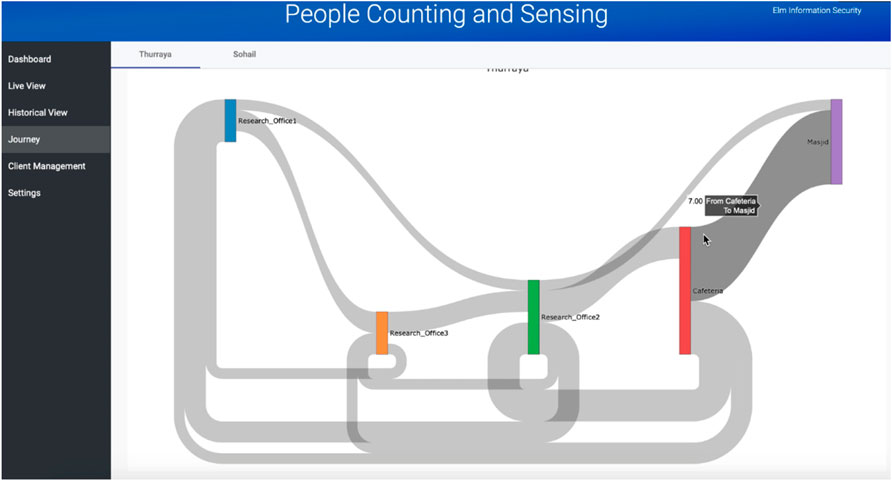
FIGURE 12. Visualizations of user journey.
5 Experiment
To understand the characteristics of probe request packets from various mobile phones, experiments were conducted with different types of devices under isolated conditions. In these experiments, the WiFi USB dongle was connected to the Raspberry Pi, and the WiFi interface operating mode was changed to monitor mode in order to scan the packets. A Python script was created to interface with the WiFi dongle, scanned for all the packets, and then filtered out only WiFi probe request packets.
5.1 Test scenarios
In order to test the system in a controlled environment where there were no other probe packets, the Raspberry Pi was powered by a battery bank, and together with a mobile phone, scanning hardware was placed in a closed Faraday bag for an hour, as shown in Figure 13. The Faraday bag blocked all external RF communication and allowed the scanning hardware to scan only signals originating from the mobile phone kept inside it. To understand the behavior of WiFi on a mobile phone, several scenarios, as listed in Table 3, were tested.
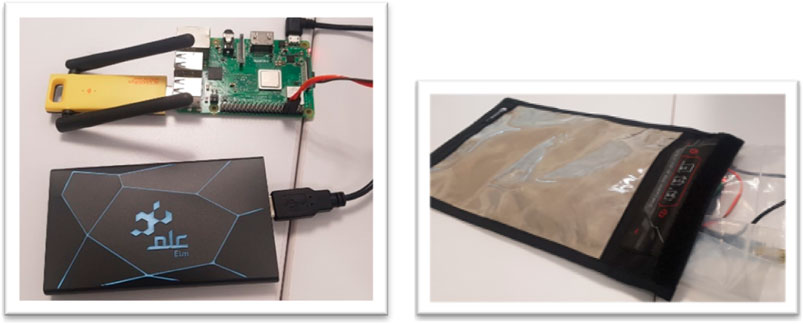
FIGURE 13. Scanning hardware was kept in a Faraday bag and closed for an hour.
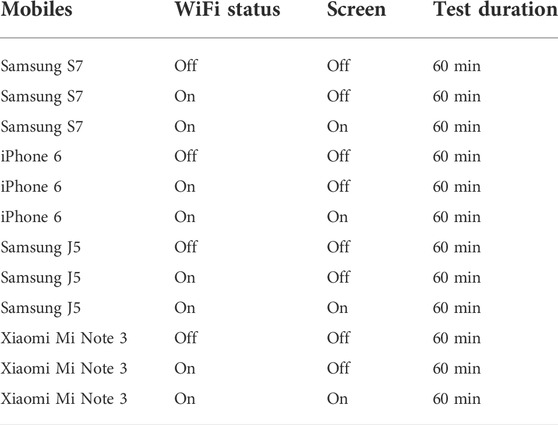
TABLE 3. All used mobile phones.
As shown in Table 3, the mobile phones tested were Samsung S7, iPhone 6, Samsung J5, and Xiaomi Mi Note 3. To understand how each mobile phone acted with and without WiFi access and screen activation, the following scenarios were tested: 1) Mobile phone had WiFi access disabled 2) Mobile phone had WiFi access enabled and its display turned off 3) Mobile phone had WiFi access enabled and its display turned on.
The captured data contained the exact times at which it was captured, MAC address, RSSI value, SSIDs in the information element, information element, and vendor-specific data. All these details were stored in a csv file inside the Raspberry Pi device, which was retrieved and analyzed at the end of the experiment.
5.2 Results
In all the figures below, the x-axis represents the time at which the experiment was conducted. The y-axis on the left shows the number of probe request packets recorded during each probing event. The y-axis on the right tracks the interval between the two probing events. Figure 14 provides a summary of the first scenario for iPhone 6S when the mobile screen was turned off. It was observed that the MAC address of the mobile phone was randomized, and that a total of 10 probing events were received in an hour. Figure 14 illustrates the second scenario for the same mobile phone, but with the screen active. With these parameters there was a significant increase in the frequency of probing events. Almost 54 probe events were received in an hour in total.
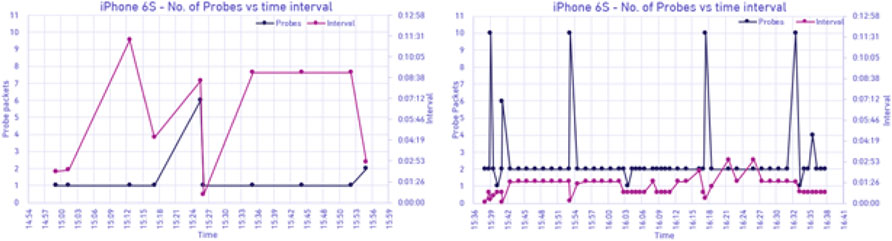
FIGURE 14. Output of the experiment conducted on iPhone 6S
Figure 15 depicts the first scenario for Samsung S7 edge when the mobile screen was off. In this case, the findings included that the MAC address of the mobile phone was randomized, a total of 13 probing events were received in an hour. Figure 15 is for the same mobile phone, but its display was turned on, again yielding an increased number of 54 probing events in an hour. Here it was also observed that the mobile phone was sending probe packets with an almost fixed interval, however MAC randomization was still present. Another key observation was that throughout the duration of the test the information element remained constant even if the phone’s MAC was randomized.
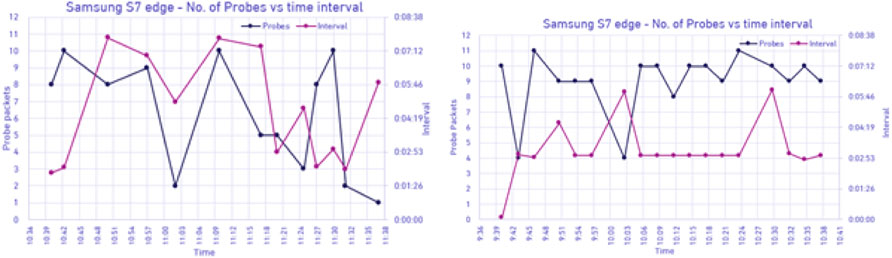
FIGURE 15. Output of the experiment conducted on Samsung S7 edge.
Figure 16 presents data for the scenario #1 for Samsung J5, when the mobile screen was switched off. With this phone, the MAC address was not randomized, and only four probing events occurred within an hour. Figure 16 is dedicated to the second scenario for the same mobile phone with the difference that the screen was active. It was once again found that the number of the probing events spiked dramatically with change in the screen status. Nineteen probe events were received in an hour, a nearly 500% increase, while the interval remained similarly stable as for scenario #1.
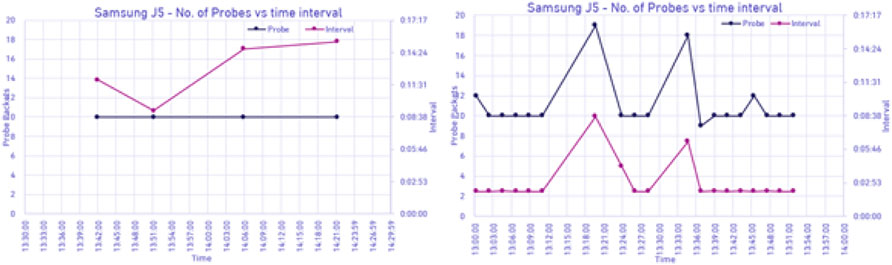
FIGURE 16. Output of our experiment conducted on Samsung J5.
In Figure 17, the results for the first scenario using Xiaomi Mi Note 3 with a turned off display can be observed. This device did not randomize the MAC address and sent a total of 89 probe requests over the course of an hour, which was significantly higher than that for the other mobile phones tested. The sending interval was very regular, with nearly identical times elapsed between the two probes. Figure 17 presents the outcomes of the second scenario for the same mobile phone when the screen was active. Contrary to this trend, a large drop in the number of probing events was observed; however, a solid number of events were tracked compared with other mobile phones, at 24 per hour.
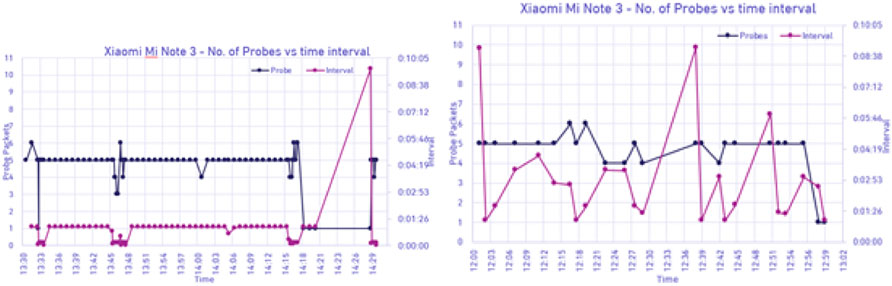
FIGURE 17. Output of our experiment conducted on Xiaomi Mi Note three.
5.3 Discussion
The experiment concluded that no WiFi probe packets were broadcasted when WiFi was disabled and location services were off. Mobile phones broadcasted very few packets when WiFi access was not available but location services were enabled. Some phones have adopted MAC randomization for user privacy purposes; however, the majority of phones have not yet implemented this procedure. The interval between WiFi probe request events is not constant because they are essentially random. When a mobile phone was unlocked and its screen was turned on, it tended to send more probe request packets over the same time period. The transmission power of WiFi probe packets occasionally decreased when the screen was off, although this does not happen with all tested models and depended on the mechanisms implemented by the manufacturer. Probe packets contained SSIDs of previously connected networks, particularly when the SSID of an access point was hidden and had to be added to the phone manually. This happened because an AP with a hidden SSID did not advertise its presence, and therefore the WiFi-enabled devices sent probe request packets and waited for a response to make the connection. A mobile phone generally sends more packets when the screen is turned on. Data inside the information element do not randomize with each probe; however, it does change after a power cycle of enabling or disabling the WiFi interface, as well as a consequence of timing out after a couple of hours. Table 4 provides a summary of the results for all tested mobile devices.
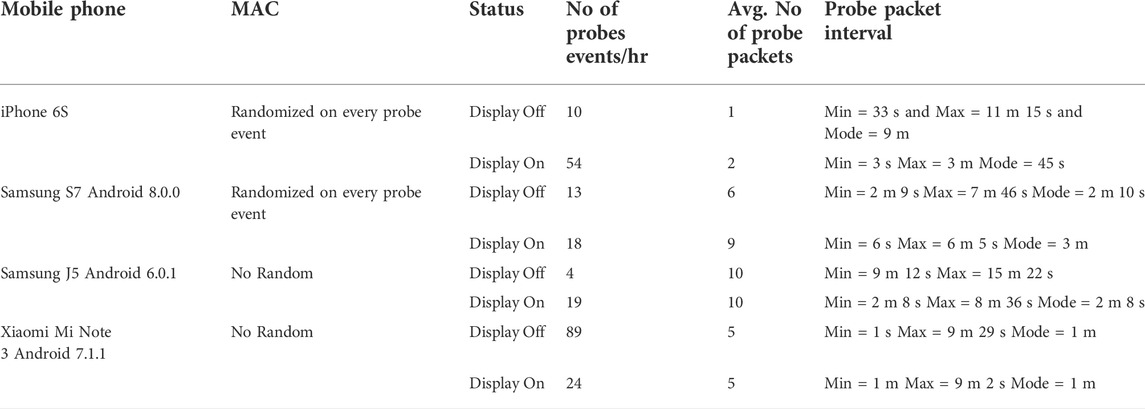
TABLE 4. Summary of the results for all tested mobile devices.
6 Conclusion
Ubiquitous presence of mobile phones opens some new possibilities for developing practical applications that would not be possible just a decade or two ago. This paper describes an innovative WiFi sensing system based on a custom-built hardware configuration that is capable of capturing the WiFi probes containing MAC addresses emitted by smartphones in regular intervals, and sending them to the cloud for processing. The system was tested only under laboratory condition to determine some fundamental trends with probe signal capturing for devices from different manufacturers. In conclusion, we can say that, with the architecture that includes data preprocessing on the edge and the use of a cloud server for the remaining operations reduces the load on the network, as well as the typical packet size. With this complete end-to-end solution, we were able to achieve high accuracy for the task of estimating the number of people carrying mobile phones, with the requirement that the devices do not randomize the MAC address and stay near the point of interest for at least 2–3 min. With devices that randomize MAC addresses, we were able to achieve good accuracy for the same task. However, these results could change over time owing to changes in the design and features of the new smartphone models. Smartphone manufacturers are continuously trying to hide the identity of users by tweaking different WiFi probing mechanics. To upgrade the system, we recommend conducting similar experiments and upgrading the algorithms accordingly.
Data availability statement
The datasets presented in this article are not readily available because the data contains information of original MAC addresses of a public sector company, which might also contain the MAC addresses of laptops and other IT equipment. Requests to access the datasets should be directed tobXVhbHF1cmlzaGlAZW0uc2E=.
Author contributions
Conceptualization, software and hardware development, SA Investigation, validation and writing the original draft, MA-Q Supervision, review and funding acquisition, RS Data curation, final review, visualization and editing, SA and MA-Q All authors have read and agreed to the published version of the manuscript.
Conflict of interest
SA, MA-Q, and RS are employed by the Elm Company.
Publisher’s note
All claims expressed in this article are solely those of the authors and do not necessarily represent those of their affiliated organizations, or those of the publisher, the editors and the reviewers. Any product that may be evaluated in this article, or claim that may be made by its manufacturer, is not guaranteed or endorsed by the publisher.
Supplementary material
The Supplementary Material for this article can be found online at: https://www.frontiersin.org/articles/10.3389/friot.2022.967034/full#supplementary-material
References
Alo, U. R., Nkwo, F. O., Nweke, H. F., Achi, I. I., and Okemiri, H. A. (2022). Non-pharmaceutical interventions against Covid-19 pandemic: Review of contact tracing and social distancing technologies, protocols, apps, security and open research directions. Sensors 22, 280. doi:10.3390/s22010280
Arasteh, H., Hosseinnezhad, V., Loia, V., Tommasetti, A., Troisi, O., Shafie-khah, M., et al. (2016). “Iot-based smart cities: A survey,” in 2016 IEEE 16th International Conference on Environment and Electrical Engineering (EEEIC), Florence, Italy, 07-10 June 2016 (IEEE), 1–6.
Azimi, S., and O’Brien, W. (2022). Fit-for-purpose: Measuring occupancy to support commercial building operations: A review. Build. Environ. 212, 108767. doi:10.1016/j.buildenv.2022.108767
Bai, L., Ireson, N., Mazumdar, S., and Ciravegna, F. (2017). “Lessons learned using Wi-Fi and bluetooth as means to monitor public service usage,” in Proceedings of the 2017 ACM international joint conference on pervasive and ubiquitous computing and proceedings of the 2017 ACM international symposium on wearable computers (New York, NY), 432–440.
Cheng, D., Yue, G., Pei, T., and Wu, M. (2021). Clustering indoor positioning data using e-dbscan. ISPRS Int. J. Geoinf. 10, 669. doi:10.3390/ijgi10100669
Ciftler, B. S., Dikmese, S., Güvenç, İ., Akkaya, K., and Kadri, A. (2017). Occupancy counting with burst and intermittent signals in smart buildings. IEEE Internet Things J. 5, 724–735. doi:10.1109/jiot.2017.2756689
Dogan, O., Bayo-Monton, J.-L., Fernandez-Llatas, C., and Oztaysi, B. (2019). Analyzing of gender behaviors from paths using process mining: A shopping mall application. Sensors 19, 557. doi:10.3390/s19030557
Gu, J., Jiang, Z., Sun, Y., Zhou, M., Liao, S., and Chen, J. (2021). Spatio-temporal trajectory estimation based on incomplete Wi-Fi probe data in urban rail transit network. Knowledge-Based Syst. 211, 106528. doi:10.1016/j.knosys.2020.106528
Handte, M., Iqbal, M. U., Wagner, S., Apolinarski, W., Marrón, P. J., Navarro, E. M. M., et al. (2014). “Crowd density estimation for public transport vehicles,” in EDBT/ICDT workshops (Athens, Greece: Association for Computing Machinery), 315–322.
Kontokosta, C. E., and Johnson, N. (2017). Urban phenology: Toward a real-time census of the city using Wi-Fi data. Comput. Environ. Urban Syst. 64, 144–153. doi:10.1016/j.compenvurbsys.2017.01.011
Lee, J. H., Ostwald, M. J., and Kim, M. J. (2021). Characterizing smart environments as interactive and collective platforms: A review of the key behaviors of responsive architecture. Sensors 21, 3417. doi:10.3390/s21103417
Lesani, A., and Miranda-Moreno, L. (2018). Development and testing of a real-time wifi-bluetooth system for pedestrian network monitoring, classification, and data extrapolation. IEEE Trans. Intell. Transp. Syst. 20, 1484–1496. doi:10.1109/tits.2018.2854895
Li, K., Yuen, C., Kanhere, S. S., Hu, K., Zhang, W., Jiang, F., et al. (2018). An experimental study for tracking crowd in smart cities. IEEE Syst. J. 13, 2966–2977. doi:10.1109/jsyst.2018.2880028
Li, L., Chen, X., Li, Q., Tan, X., Chen, J., Wang, D., et al. (2021). Contextualizing human dynamics: Understanding the semantics of movement trajectories with Wi-Fi data. Travel Behav. Soc. 25, 183–192. doi:10.1016/j.tbs.2021.07.005
Li, S., Guo, T., Mo, R., Zhao, X., Zhou, F., Liu, W., et al. (2020). A rescue-assistance navigation method by using the underground location of wsn after disasters. Sensors 20, 2173. doi:10.3390/s20082173
Li, Y., Barthelemy, J., Sun, S., Perez, P., and Moran, B. (2020). A case study of wifi sniffing performance evaluation. IEEE Access 8, 129224–129235. doi:10.1109/access.2020.3008533
Pereira, F., Lopes, S. I., and Carvalho, N. B. (2019). “Design of a cost-effective multimodal iot edge device for building occupancy estimation,” in 2019 IEEE International Smart Cities Conference (ISC2), Casablanca, Morocco, 14-17 October 2019 (IEEE), 122–128.
Petre, A.-C., Chilipirea, C., Baratchi, M., Dobre, C., and van Steen, M. (2017). “Wifi tracking of pedestrian behavior,” in Smart sensors networks (Academic Press), 309–337.
Piccialli, F., Cuomo, S., di Cola, V. S., and Casolla, G. (2019). A machine learning approach for iot cultural data. J. Ambient. Intell. Humaniz. Comput., 1–12. doi:10.1007/s12652-019-01452-6
Pu, Z., Cui, Z., Tang, J., Wang, S., and Wang, Y. (2021). Multi-modal traffic speed monitoring: A real-time system based on passive Wi-Fi and bluetooth sensing technology. IEEE Internet Things J. 9, 12413–12424. doi:10.1109/jiot.2021.3136031
Redondi, A. E., and Cesana, M. (2018). Building up knowledge through passive wifi probes. Comput. Commun. 117, 1–12. doi:10.1016/j.comcom.2017.12.012
Retscher, G. (2020). Fundamental concepts and evolution of Wi-Fi user localization: An overview based on different case studies. Sensors 20, 5121. doi:10.3390/s20185121
Schauer, L., Werner, M., and Marcus, P. (2014). “Estimating crowd densities and pedestrian flows using Wi-Fi and bluetooth,” in Proceedings of the 11th international conference on mobile and ubiquitous systems: Computing, networking and services (Brussels, Belgium: ICST (Institute for Computer Sciences, Social-Informatics and Telecommunications Engineering) Rue Godecharle), 171–177.
Sharma, H., Haque, A., and Blaabjerg, F. (2021). Machine learning in wireless sensor networks for smart cities: A survey. Electronics 10, 1012. doi:10.3390/electronics10091012
Singh, U., Determe, J.-F., Horlin, F., and De Doncker, P. (2021). Crowd monitoring: State-of-the-art and future directions. IETE Tech. Rev. 38, 578–594. doi:10.1080/02564602.2020.1803152
Traunmueller, M. W., Johnson, N., Malik, A., and Kontokosta, C. E. (2018). Digital footprints: Using wifi probe and locational data to analyze human mobility trajectories in cities. Comput. Environ. Urban Syst. 72, 4–12. doi:10.1016/j.compenvurbsys.2018.07.006
Uras, M., Cossu, R., Ferrara, E., Liotta, A., and Atzori, L. (2020). Pma: A real-world system for people mobility monitoring and analysis based on Wi-Fi probes. J. Clean. Prod. 270, 122084. doi:10.1016/j.jclepro.2020.122084
Vattapparamban, E., Çiftler, B. S., Güvenç, I., Akkaya, K., and Kadri, A. (2016). “Indoor occupancy tracking in smart buildings using passive sniffing of probe requests,” in 2016 IEEE International Conference on Communications Workshops (ICC), Kuala Lumpur, Malaysia, 23-27 May 2016 (IEEE), 38–44.
Wang, F., Zhu, X., and Miao, J. (2017). Semantic trajectories-based social relationships discovery using wifi monitors. Pers. Ubiquitous Comput. 21, 85–96. doi:10.1007/s00779-016-0983-z
Wang, W., Joshi, R., Kulkarni, A., Leong, W. K., and Leong, B. (2013). “Feasibility study of mobile phone wifi detection in aerial search and rescue operations,” in Proceedings of the 4th Asia-Pacific workshop on systems (Singapore: Association for Computing Machinery), 1–6.
Yang, X., He, S., Wang, B., and Tabatabaie, M. (2021). Spatio-temporal graph attention embedding for joint crowd flow and transition predictions: A Wi-Fi-based mobility case study. Proc. ACM Interact. Mob. Wearable Ubiquitous Technol. 5, 1–24. doi:10.1145/3495003
Yin, J., and Chi, G. (2021). Characterizing people’s daily activity patterns in the urban environment: A mobility network approach with geographic context-aware twitter data. Ann. Am. Assoc. Geogr. 111 (7), 1–21. doi:10.1080/24694452.2020.1867498
Keywords: wifi sensor, probe packet, movement behavior, crowd density, indoor crowd
Citation: Alam SS, Al-Qurishi M and Souissi R (2022) Estimating indoor crowd density and movement behavior using WiFi sensing. Front. Internet. Things 1:967034. doi: 10.3389/friot.2022.967034
Received: 12 June 2022; Accepted: 30 September 2022;
Published: 21 October 2022.
Edited by:
Mohammad Mehedi Hassan, King Saud University, Saudi ArabiaReviewed by:
Bilal Abu-Salih, The University of Jordan, JordanKashif Saleem, University of Technology Malaysia, Malaysia
Copyright © 2022 Alam, Al-Qurishi and Souissi. This is an open-access article distributed under the terms of the Creative Commons Attribution License (CC BY). The use, distribution or reproduction in other forums is permitted, provided the original author(s) and the copyright owner(s) are credited and that the original publication in this journal is cited, in accordance with accepted academic practice. No use, distribution or reproduction is permitted which does not comply with these terms.
*Correspondence: Muhammad Al-Qurishi, bXVhbHF1cmlzaGlAZWxtLnNh