


94% of researchers rate our articles as excellent or good
Learn more about the work of our research integrity team to safeguard the quality of each article we publish.
Find out more
METHODS article
Front. Syst. Neurosci. , 17 June 2010
Volume 4 - 2010 | https://doi.org/10.3389/fnsys.2010.00024
This article is part of the Research Topic Resting state brain activity: Implications for systems neuroscience View all 19 articles
In this study, we applied coherence to voxel-wise measurement of regional homogeneity of resting-state functional magnetic resonance imaging (RS-fMRI) signal. We compared the current method, regional homogeneity based on coherence (Cohe-ReHo), with previously proposed method, ReHo based on Kendall’s coefficient of concordance (KCC-ReHo), in terms of correlation and paired t-test in a large sample of healthy participants. We found the two measurements differed mainly in some brain regions where physiological noise is dominant. We also compared the sensitivity of these methods in detecting difference between resting-state conditions [eyes open (EO) vs. eyes closed (EC)] and in detecting abnormal local synchronization between two groups [attention deficit hyperactivity disorder (ADHD) patients vs. normal controls]. Our results indicated that Cohe-ReHo is more sensitive than KCC-ReHo to the difference between two conditions (EO vs. EC) as well as that between ADHD and normal controls. These preliminary results suggest that Cohe-ReHo is superior to KCC-ReHo. A possible reason is that coherence is not susceptible to random noise induced by phase delay among the time courses to be measured. However, further investigation is still needed to elucidate the sensitivity and specificity of these methods.
Biswal et al. (1995) found that during rest, low-frequency (0.01–0.08 Hz) fluctuations in blood oxygenation level-dependent (BOLD) signal are highly synchronous throughout the sensorimotor cortex. Since then, resting-state fMRI (RS-fMRI) has gained increasing popularity, particularly in recent years. In addition to the motor network, a multitude of functional systems have been examined using RS-fMRI approaches, including visual (Lowe et al., 1998 ), auditory (Cordes et al., 2001 ), emotional (Lowe et al., 1998 ), attentional (Fox et al., 2006 ), language (Hampson et al., 2002 ), reading (Koyama et al., 2010 ) and default mode (Greicius et al., 2003 ) networks.
The vast majority of RS-fMRI studies have adopted functional connectivity to examine their data, i.e. investigating temporal relationships between fluctuations observed in spatially distinct brain regions. However, functional connectivity provides little information about local features of spontaneous brain activity observed in individual regions, as the methods employed are typically relational. Several existing local measurements are complementary to functional connectivity approaches. For example, regional homogeneity (ReHo) (Zang et al., 2004 ) measures the similarity or synchronization of timeseries of nearest neighboring voxels (usually 27 voxels). It has been shown that the major regions of DMN have higher ReHo than other brain regions during resting state (Long et al., 2008 ). In addition, ReHo method has been applied to the detection of local abnormality in some brain disorders, e.g., attention deficit hyperactivity disorder (ADHD) (Cao et al., 2006 ), Alzheimer’s disease (He et al., 2007 ), depression (Yuan et al., 2008 ), Parkinson disease (Wu et al., 2009 ), and autism (Paakki et al., 2010 ).
The previous ReHo method uses Kendall’s coefficient of concordance (KCC) (Kendall and Gibbons, 1990 ) (KCC-ReHo) to measure the local synchronization of timeseries. KCC is based on temporal information (particularly rank information) of timeseries. However, the KCC value of timeseries will be reduced if there is time lag among the timeseries even though they share similar shapes. Coherence is a method for measuring synchronization in frequency domain. One characteristic of coherence is that it is insensitive to phase variability across measured timeseries. In an event-related study (Sun et al., 2004 ), coherence was used to measure the functional connectivity between remote brain regions. They proposed that coherence was more suitable when phase difference varied largely across brain regions (Miezin et al., 2000 ; Saad et al., 2001 ), as coherence should be less sensitive to such variability. To the best of our knowledge, coherence has not been used to measure local synchronization of BOLD signal. The aim of the current study was to use coherence-based ReHo (Cohe-ReHo) to measure the local synchronization of RS-fMRI signal. We investigated the consistency between Cohe-ReHo and KCC-ReHo from the following aspects:
(1) It has been reliably shown that the KCC-ReHo was higher in the major regions of DMN than in other brain areas (Long et al., 2008 ). We predicted that Cohe-ReHo value in these regions was also higher than other brain regions;
(2) Since both Cohe-ReHo and KCC-ReHo measure local synchronization, the two measurements would be highly correlated in most brain areas across participants;
(3) However, correlation analysis is not effective enough to characterize the difference between these two methods. Paired t-test was performed between these two measurements to reveal their difference (Zuo et al., 2010 );
(4) Eyes open (EO) and eyes closed (EC) are two resting conditions. A few studies have reported differences between EO and EC in some brain regions including the visual area (Marx et al., 2003 ; Yang et al., 2007 ), the auditory cortex (Marx et al., 2003 ), and DMN (Yan et al., 2009 ). Therefore, we are interested in which of the two measurements is more sensitive to the differences between EO and EC.
(5) To examine which of the two measurements is more sensitive to abnormal local activity, we applied KCC-ReHo and Cohe-ReHo to detect differences between ADHD patients and normal controls.
From our previous large resting-state fMRI dataset 1 (See also Biswal et al., 2010 ), we chose 80 right-handed healthy participants (aged 18–26 years, 40 females). Participants with head motion larger than 3 mm or 3° in any of the 6 parameters were not included (See Data preprocessing). Written informed consent was obtained from each participant. This study was approved by the Institutional Review Board of Beijing Normal University Imaging Center for Brain Research. For validation purpose in the correlation analysis and paired t-test between methods, the 80 participants were randomly divided into two groups (Dataset-1 and Dataset-2), each containing 40 (20 females) participants, matched for their age and IQ. The participants lay supine with the head snugly fixed by straps and foam pads to minimize head movement. A SIEMENS 3T Trio scanner was used. Functional images were obtained using an echo-planar imaging sequence with the following parameters: 33 axial slices, thickness/gap = 3.0/0.6 mm, in-plane resolution = 64 × 64, TR = 2000 ms, TE = 30 ms, flip angle = 90°, FOV = 200 × 200 mm2. During RS-fMRI scanning, participants were instructed to keep as motionless as possible, to keep their eyes closed, not to think of anything in particular, and not to fall asleep. In addition, a T1-weighted sagittal three-dimensional magnetization-prepared rapid gradient echo (MP-RAGE) sequence was acquired, covering the entire brain: 128 slices, TR = 2530 ms, TE = 3.39 ms, slice thickness = 1.33 mm, flip angle = 7°, inversion time = 1100 ms, FOV = 256 × 256 mm2, and in-plane resolution = 256 × 192.
Dataset-3 was from a study of within-group design (Zou et al., 2009 ). Twenty healthy right-handed participants (10 males and 10 females, 18- to 24-years old) underwent two RS-fMRI conditions, eyes open (EO) and eyes closed (EC). The order of the two conditions was counterbalanced across participants (See details in Zou et al., 2009 ). Written informed consent was obtained from each participant. This study was approved by the Institutional Review Board of Beijing Normal University Imaging Center for Brain Research. The participants lay supine with the head snugly fixed by straps and foam pads to minimize head movement. During resting-state scanning, participants were instructed to keep as motionless as possible with eyes closed for EC condition or open (with no fixation) for EO condition, not to think of anything in particular and not to fall asleep. The parameters for functional images and structural images were the same as Dataset-1 and Dataset-2 (Also see Zou et al., 2009 for detailed parameters).
Dataset-4 was from a study of between-group design (Cao et al., 2009 ). Participants included 23 stimulant-naïve boys diagnosed with ADHD and 25 age-matched healthy boys. The participants were 11- to-16-years old. There were 19 participants in the ADHD group and 23 in the control group after excluding those who had excessive head motion (See Data Preprocessing). During resting-state scanning, participants were instructed to keep as motionless as possible with eyes closed, not to think of anything in particular and not to fall asleep. Images were acquired using a SIEMENS TRIO 3-Tesla scanner in the Institute of Biophysics, Chinese Academy of Sciences. The resting-state functional data was acquired using an echo-planar imaging sequence with the following parameters: 30 axial slices, TR = 2000 ms, TE = 30 ms, flip angle = 90°, thickness/skip = 4.5/0.0 mm, FOV = 220 × 220 mm2, in-plane resolution = 64 × 64, 240 volumes. A high resolution T1-weighted anatomical image was acquired in a sagittal orientation using a spoiled gradient-recalled sequence covering the whole brain (See Cao et al., 2009 for detailed parameters).
The first 10 volumes of each session was discarded to make the longitudinal magnetization reach a steady state and for participants to get used to the scanning environment. Then slice timing, head motion correction, and spatial normalization were performed by statistical parametric mapping (SPM5) 2 . Linear trend removing and band-pass (0.01–0.08 Hz) filtering were performed by our built-in-lab software REST 3 .
Cohe-ReHo analysis. The algorithm for calculating Cohe-ReHo included the following three steps:
Step 1: Power spectrum and cross spectrum estimation
For any two timeseries [e.g. x(t) and y(t)] in a given cluster, we used Welch’s modified periodogram averaging methods to estimate their power spectrums and cross spectrum: we divided each timeseries into N (here N = 8) segments of length T (here T = 51 time points, with 50% overlapping for neighboring segments) to make each segment approximately stationary. Because we focused on the low-frequency (0.01–0.08 Hz) components, the length of each segment should be more than 100s (0.01 Hz) to make the frequency resolution of power spectrum is high enough. To reduce the variance of power estimation, timeseries should be divided into as many segments as possible. Therefore we set the number of segments to be eight. Each resulting segment was then mean-centered and weighted by a Hanning window of the same length to reduce spectrum leakage caused by segmentation (Welch, 1967 ). We estimated cross spectrum of timeseries x(t) and y(t):

where  is the discrete Fourier transform of the nth segment of timeseries x(t). Likewise, we can estimate the power spectrums of timeseries x(t) and y(t), respectively:

Step 2: Estimation of coherence across low-frequency band
For timeseries x(t) and y(t) in Step 1, we estimated their coherence across the low-frequency (0.01–0.08 Hz) band with their band-averaged estimates of the cross spectrum and power spectrums (Andrew and Pfurtscheller, 1996 ):
Step 3: Calculation of the Cohe-ReHo within the given cluster
To assess the overall synchronization within that cluster, we averaged the  across all pairs of voxels in that cluster:

where K is the number of voxels within a cluster (here K = 27, one center voxel plus the number of its neighbors), and  is the band-averaged coherence estimated in Step 2. We assigned the averaged coherence coefficient
  of the cluster to its center voxel to represent Cohe-ReHo of the cluster.
An individual Cohe-ReHo map was obtained in a voxel-wise way. The Cohe-ReHo program was coded in MATLAB (The MathWorks, Inc., Natick, MA, USA).
KCC-ReHo analysis. Kendall’s coefficient of concordance (KCC) was calculated to measure the KCC-based ReHo of timeseries of voxels within a cluster,
where W is KCC among timeseries of given voxels, ranging from 0 to 1; Ri is the sum rank of the ith time point;  is the mean of the Ris; K is number of voxels within measured cluster (here K = 27, one center voxel plus the number of its neighbors); n is the number of ranks (here n = 230 time points). The KCC value was assigned to the center voxel of this cluster. The individual KCC-ReHo map was obtained in a voxel-wise way for all dataset groups. The procedures for KCC-ReHo analysis were performed by REST.
Before statistical analysis, an intersection brain mask was made for each dataset by using all individual spatially normalized EPI images of each dataset and an intracranial mask in REST. These intersection masks would be used for standardization purpose (See below) because the 33 axial slices do not cover the whole brain for some of the adult participants. The individual ReHo maps were smoothed with a Gaussian kernel of 6 mm full width at half-maximum (FWHM). In previous studies (e.g., Long et al., 2008 ), the KCC-ReHo value was standardized by being divided by the global mean. This procedure was the same as that in PET studies (Raichle et al., 2001 ). However, it has been recently suggested that transformation into standard Z value (subtracting the global mean, then being divided by standard deviation. See Zuo et al., 2010 ) improved the normality of distribution. Accordingly, we transformed Cohe-ReHo and KCC-ReHo value into Z value for each dataset by using its own intersection mask. The term “global” in the following text will be constrained in each intersection mask. For multiple comparison correction, Monte Carlo simulation was performed by AlphaSim command in AFNI (Cox, 1996 ).
To test which brain areas have significantly higher Cohe-ReHo or KCC-ReHo value than global mean, one-sided one-sample t-tests were performed on the Z maps in Dataset-1 and Dataset-2 separately. Voxels with p value less than 1.0 × 10⁻¹² were considered significant.
To test the similarity of Cohe-ReHo and KCC-ReHo maps, linear correlation analysis was performed in a voxel-wise way across participants. Considering that Z transformation might bias the correlation results, the linear correlation was performed on the original Cohe-ReHo and KCC-ReHo maps in Dataset-1 and Dataset-2.
Linear correlation can only measure the similarity between these two measurements. For a voxel, whether its Cohe-ReHo and KCC-ReHo values are highly correlated or not, the two measurements may have different proportion to their own global mean value. Hence, paired t-test was performed between Z score of Cohe-ReHo and KCC-ReHo maps for Dataset-1 and Dataset-2, respectively.
Paired t-tests were performed on the Z maps to reveal the differences between EO and EC. The clusters with single voxel’s p value less than 0.01 and cluster size greater than 1080 mm3 were considered significantly different between conditions (p < 0.05, corrected). By visual inspection, we could find both consistency and discrepancy between the results of Cohe-ReHo and KCC-ReHo (See Results). To test if there is statistically significant difference in the sensitivity of the two measurements, we calculated the ratio of the two measurements for each participant. Then, paired t-test was performed on the ratio. Multiple comparison correction was constrained within brain areas showing significant differences between EO and EC by either Cohe-ReHo or KCC-ReHo (i.e., conjunction map). For one voxel in the conjunction map, if (1) there was no significant difference in the ratio and (2) both methods detected between-conditions differences, we considered the two measurements were equally sensitive to the between-condition differences in this voxel. However, if the difference was significant, then we further compared the absolute value of t value for the two measurements, particularly, we considered the measurement whose absolute value of t value was larger was more sensitive than the other measurement at the given voxel.
This procedure is almost the same as the between-condition paired t-tests mentioned above, except that two-sample t-tests between ADHD and control groups rather than paired t-tests between two conditions were performed. The clusters with single voxel’s p value less than 0.05 and cluster size greater than 6075 mm3 were considered significantly different between groups (p < 0.05, corrected). Accordingly, two-sample t-test on the ratio of Cohe-ReHo to KCC-ReHo was performed. The corresponding multiple comparison correction was constrained within the brain areas showing significant difference between ADHD and control groups by either Cohe-ReHo or KCC-ReHo (i.e., conjunction map).
Results of one-sample t-tests showed that the major regions of DMN (including posterior cingulate cortex/precuneus, medial prefrontal cortex and bilateral inferior parietal lobule) had higher Cohe-ReHo as well as KCC-ReHo than the global mean (Figure 1 ). The pattern of one-sample t-test results is highly consistent with our previous findings (Long et al., 2008 ). The results of Dataset-1 and Dataset-2 are quite similar.
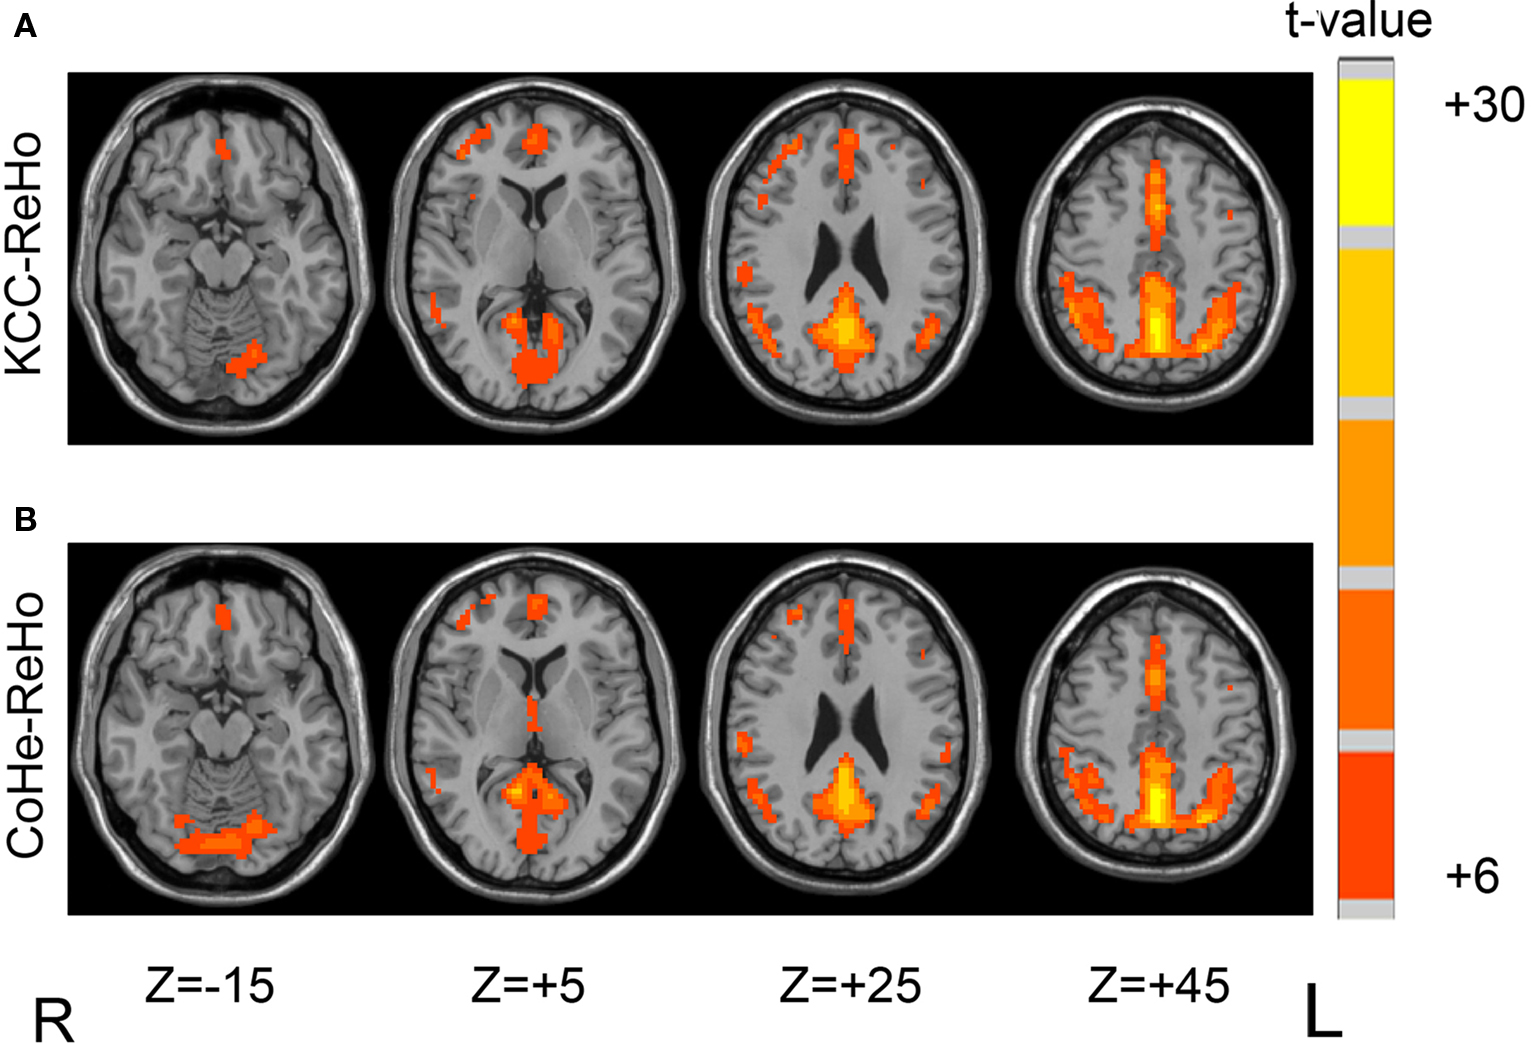
Figure 1. One-sample t-test results of two methods on Dataset-1 showed that major regions of DMN had higher KCC-ReHo (A) and Cohe-ReHo (B) than the global mean. The left side of the image corresponds to the right side of brain.
The DMN is of particular interest because it was found that regions in DMN have significantly higher glucose metabolism than other brain regions (Raichle et al., 2001 ) and these regions show task-independent or task-unspecific deactivation in the goal directed tasks (Shulman et al., 1997 ; Binder et al., 1999 ; Mazoyer et al., 2001 ; McKiernan et al., 2003 ), suggesting these regions may have important function during resting state. The current results suggest that the higher metabolism in the major regions of DMN during resting state is associated with higher local synchronization of spontaneous activity.
The correlation coefficients between Cohe-ReHo and KCC-ReHo were quite high in most part of brain regions, suggesting that the two indices were very similar there (Figure 2 ). In the suprasellar cistern and ventricles, their correlation coefficients were relatively low compared with other brain areas. The two measurements of some voxels in the supersellar cistern even showed negative correlation. The lower correlation between the two measurements indicates that the physiological noise has different effects on different measurements.
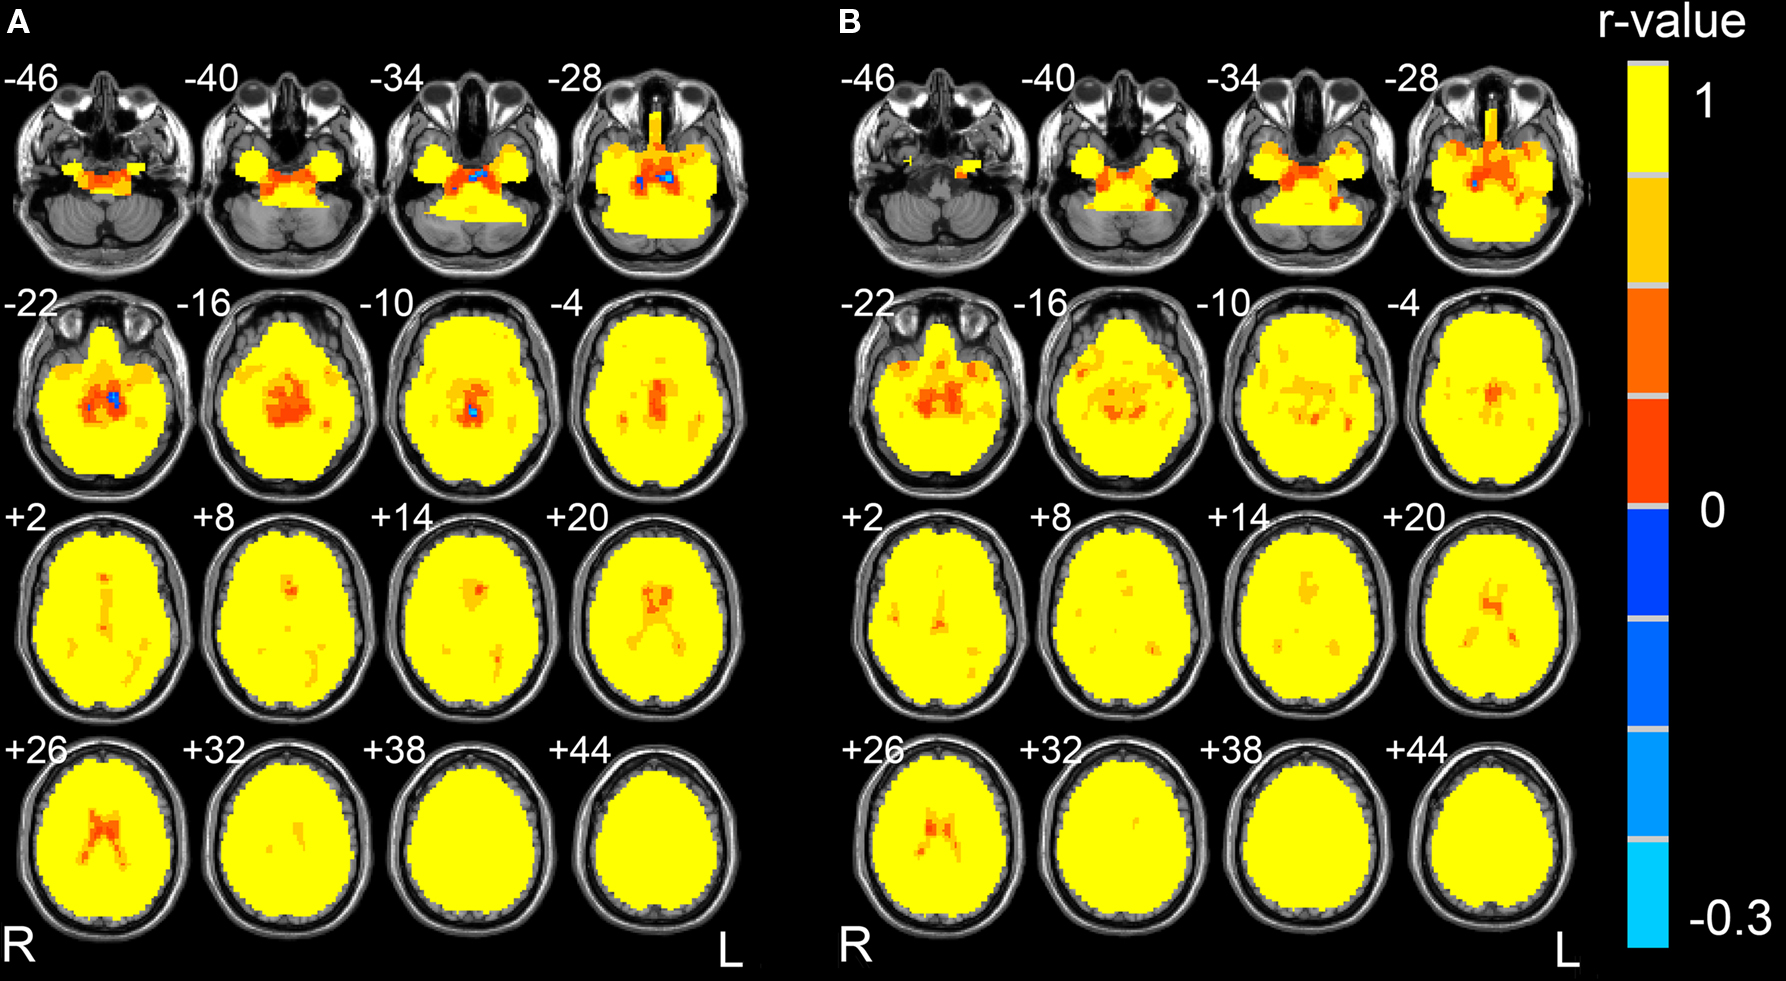
Figure 2. Correlation map between Cohe-ReHo and KCC-ReHo of Dataset-1 (A) and Dataset-2 (B), respectively. The left side of the image corresponds to the right side of brain.
Paired t-test between Cohe-ReHo and KCC-ReHo demonstrated that the Z score of Cohe-ReHo was significantly greater than that of KCC-ReHo in some cisterns and ventricles, as well as a few regions in the white matter (Figure 3 , p < 0.05, corrected). The Z score of Cohe-ReHo was significantly smaller than that of KCC-ReHo in a few regions in the white matter and gray matter. The results were very similar for the two datasets.
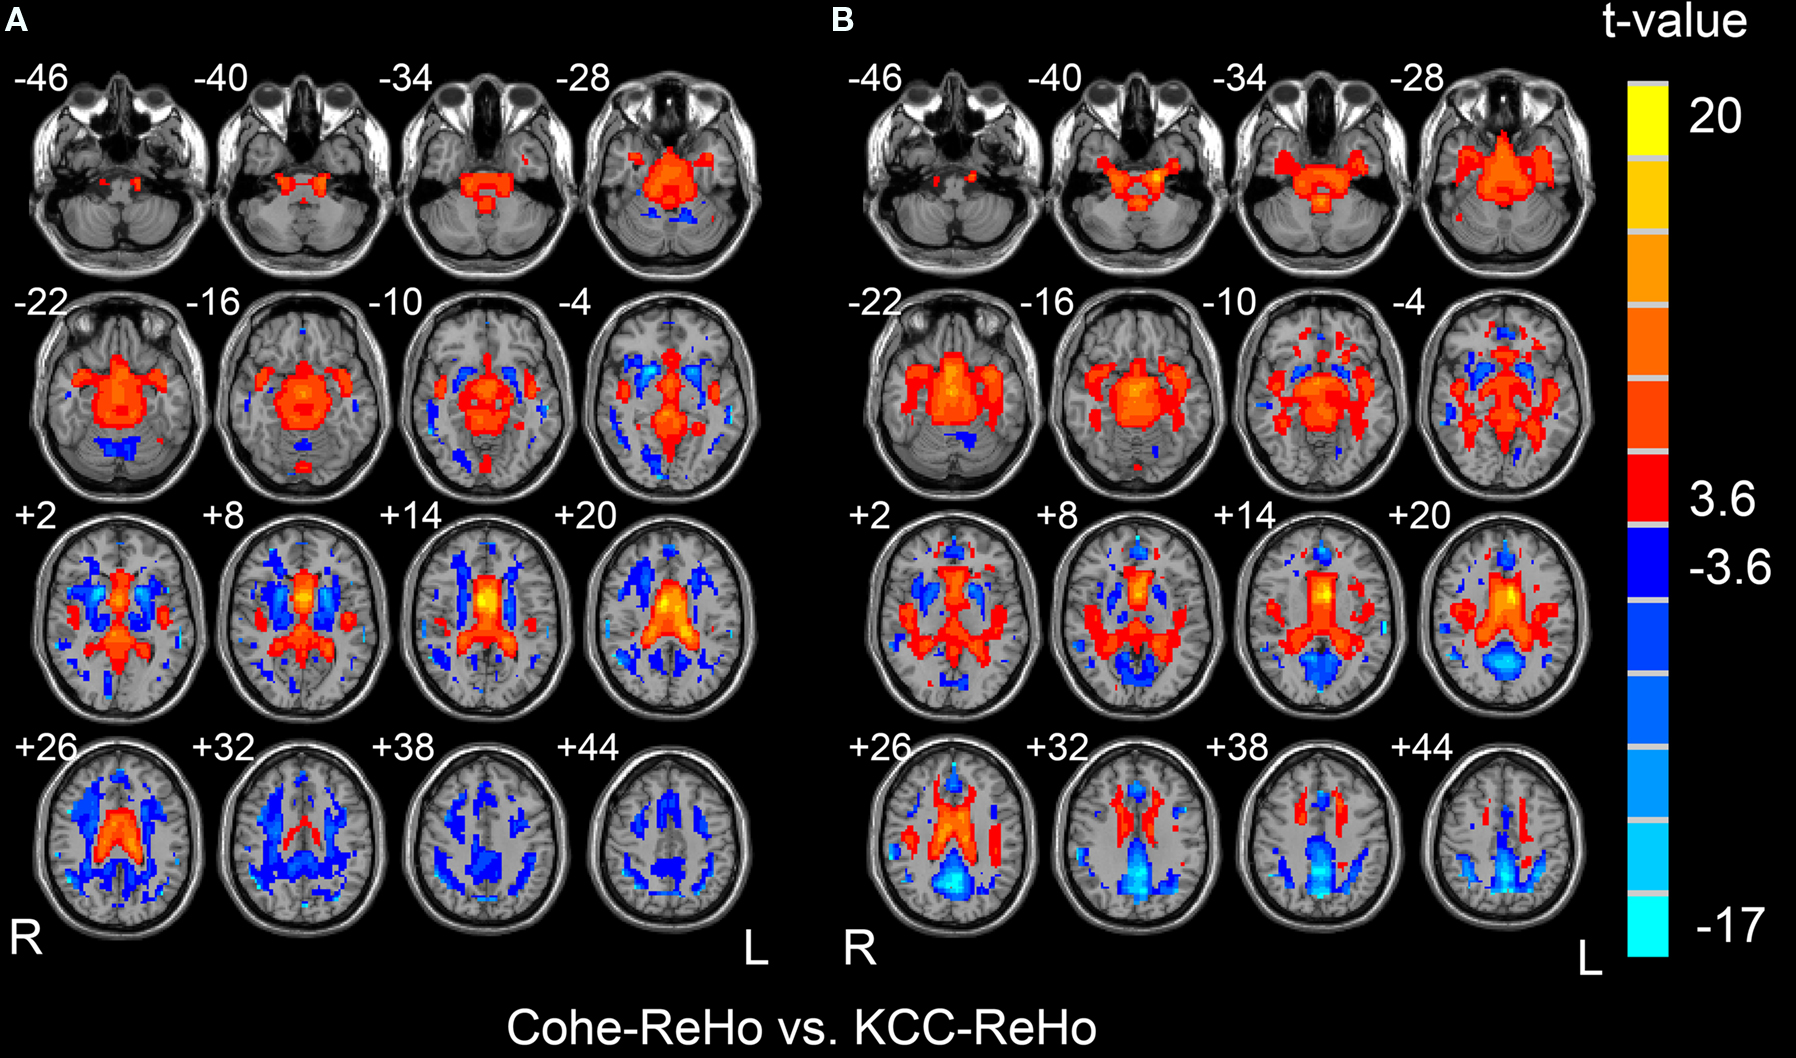
Figure 3. Results of paired t-tests between Z maps of Cohe-ReHo and KCC-ReHo for Dataset-1 (A) and Dataset-2 (B). The left side of the image corresponds to the right side of brain.
In the supersellar cisterns and ventricles, both linear correlation (See Section Correlation analysis) and paired t-test showed that Cohe-ReHo and KCC-ReHo were different from each other. All these results indicated that the physiological noise may have different effects on the measurements. However, paired t-test showed that the two measurements were also significantly different in a few gray matter regions. It should be noted that, for the purpose of direct comparison between two measurements, we performed Z transformation to the two measurements previous to paired t-test. The Z score is a standardized value across brain. The difference shown by paired t-test is difference of the relative value against the global mean. Therefore, the difference found by paired t-test in the gray matter may be due to the fact that Z score is partially biased by the standardization procedure. Nevertheless, from different aspects, linear correlation and paired t-test revealed both similarity and discrepancy between the Cohe-ReHo and KCC-ReHo.
Paired t-test revealed that the Cohe-ReHo was significantly higher in the right middle occipital gyrus, anterior cingulate cortex (ACC), bilateral precuneus, bilateral middle frontal gyrus, bilateral inferior frontal gyrus, bilateral inferior parietal lobule, right superior frontal gyrus, and right caudate in EO resting state than in EC. It also revealed that Cohe-ReHo was significantly lower in the bilateral sensorimotor cortex, bilateral supplementary motor cortex, bilateral superior temporal gyrus, bilateral middle temporal gyrus, and bilateral thalamus in EO resting-state than in EC (Figure 4 , p < 0.05, corrected). Paired t-test on KCC-ReHo maps yielded similar between-condition differences as on the Cohe-ReHo maps by visual inspection.
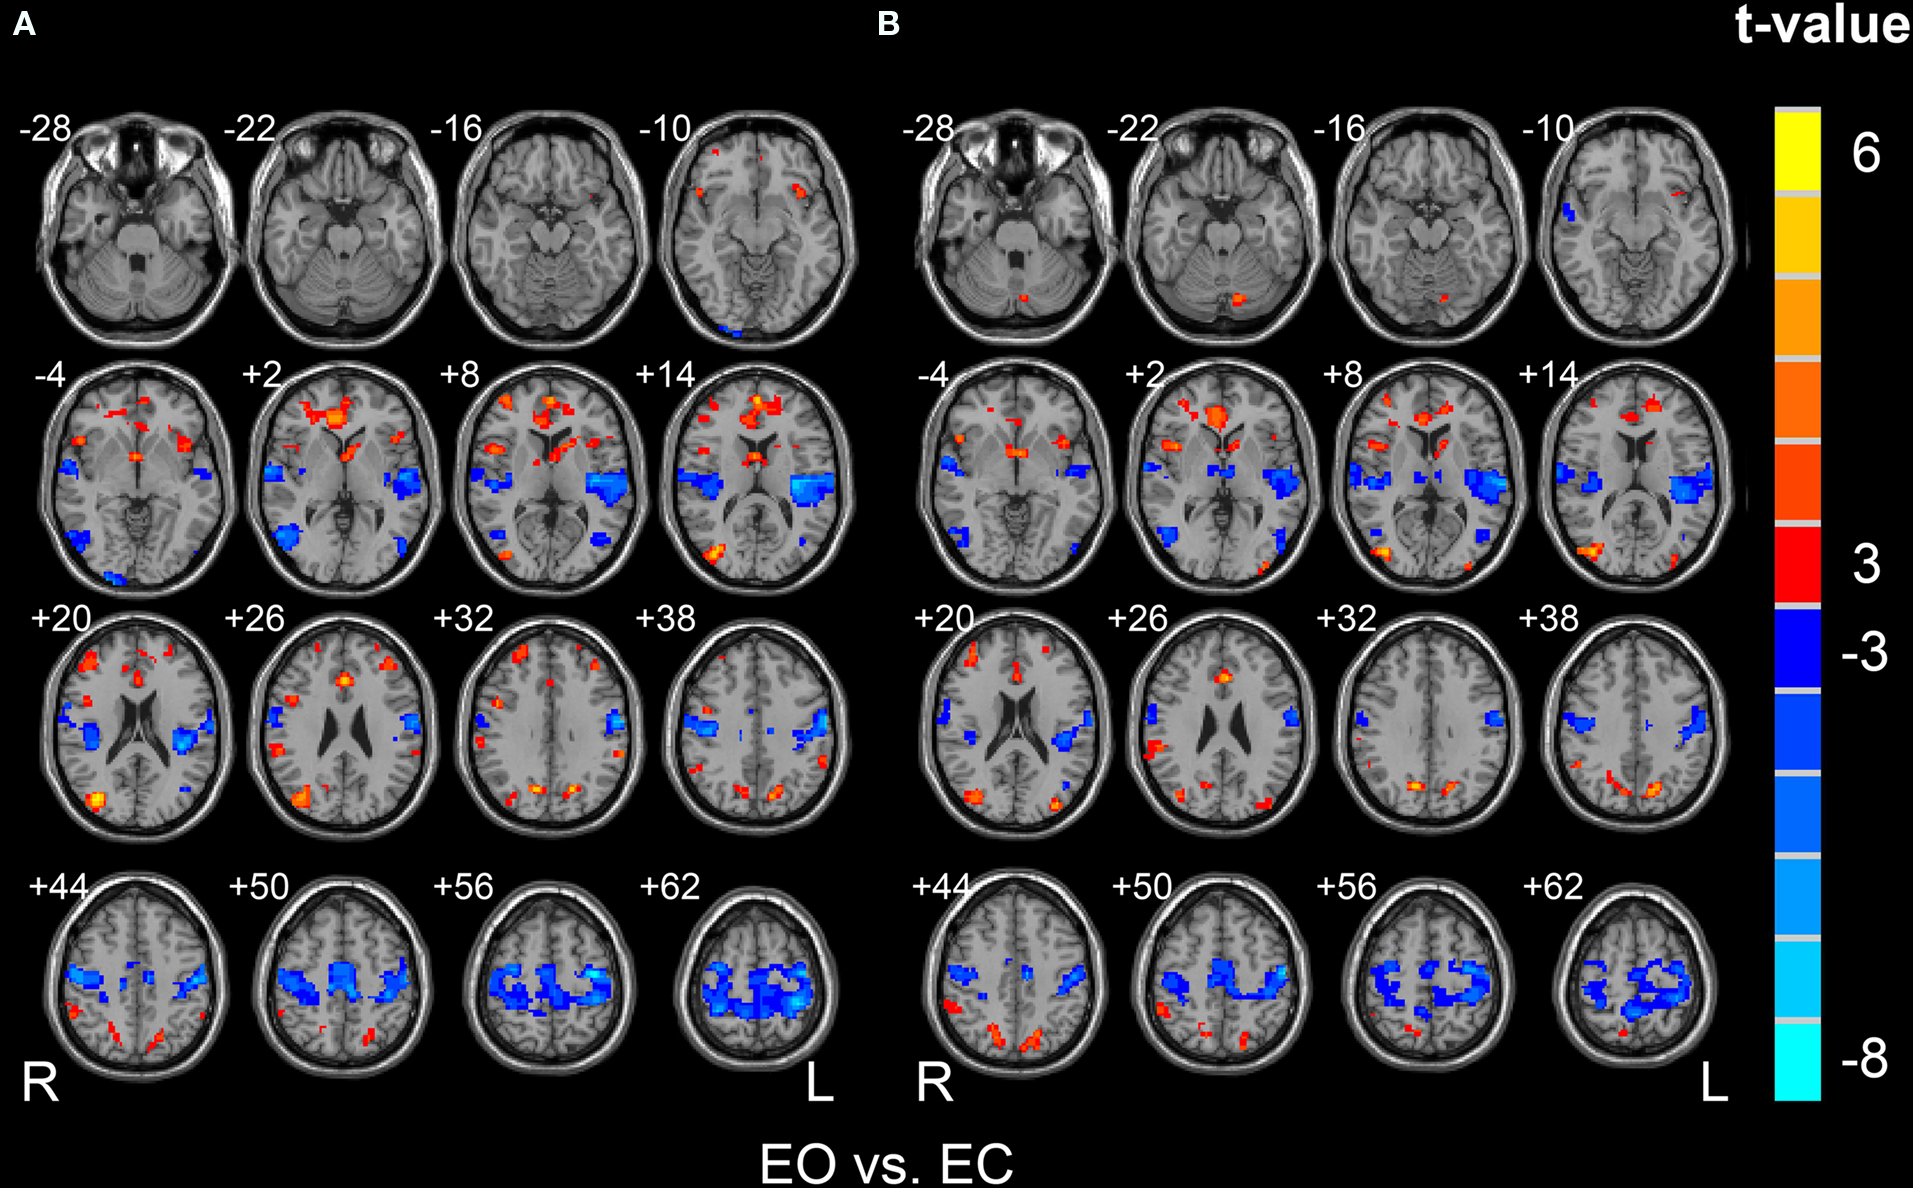
Figure 4. Brain regions showing significantly different Cohe-ReHo (A) and KCC-ReHo (B) between EO and EC resting states. The left side of the image corresponds to the right side of brain.
The brain areas showing significant between-condition differences by either Cohe-ReHo or KCC-ReHo were taken as a mask (i.e., conjunction mask). Then paired t-test was performed within this mask to reveal the differences of the ratio of Cohe-ReHo to KCC-ReHo between EO and EC resting states. Some of the brain areas in the conjunction mask showed significant difference on the ratio (p < 0.05, corrected) (See yellow and green color in Figure 5 ), indicating that the two measurements have significantly different sensitivity in detecting between-conditions differences. Taking paired t-test results by Cohe-ReHo (Figure 4 A) and KCC-ReHo (Figure 4 B) into account, it could be found that most of the areas showing significant difference on the ratio were significantly contributed by Cohe-ReHo (Yellow color in Figure 5 ). It means that, in these areas, the between-condition difference is significantly higher in Cohe-ReHo than in KCC-ReHo. Only a very small proportion was significantly contributed by KCC-ReHo (Green color in Figure 5 ). It could be concluded that Cohe-ReHo may be more sensitive to differences between EO and EC. One possible interpretation is that physiological noise may result in phase delay across time courses of the neighboring voxels in these brain areas. This phase delay may give rise to additional variance or “random noise”, and hence reduce the possibility of difference between EO and EC resting states. However, this interpretation remains speculative and needs further investigation.
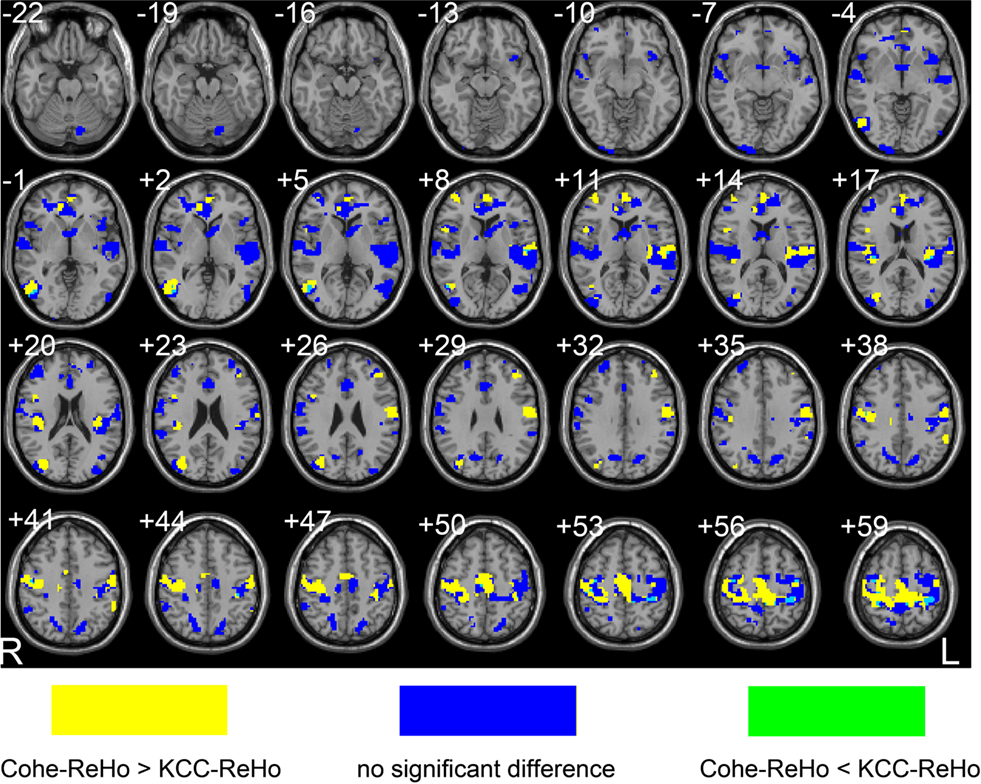
Figure 5. Cohe-ReHo and KCC-ReHo have different sensitivity to the difference of local synchronization between EO and EC resting states. Yellow color means Cohe-ReHo is more sensitive than KCC-ReHo. The green color means the opposite. The blue color means that the two measurements have no significant differences in their sensitivity in detecting differences between EC and EO. The left side of the image corresponds to the right side of brain.
In comparison with normal controls, the ADHD patients displayed significantly increased Cohe-ReHo in the bilateral lingual gyrus and decreased Cohe-ReHo in bilateral cerebellum and ventral ACC. Significantly increased KCC-ReHo was discovered in bilateral lingual gyrus and dorsal ACC and significantly decreased KCC-ReHo was found in bilateral cerebellum (Figure 6 , p < 0.05, corrected). The pattern looks similar for the two measurements by visual inspection.
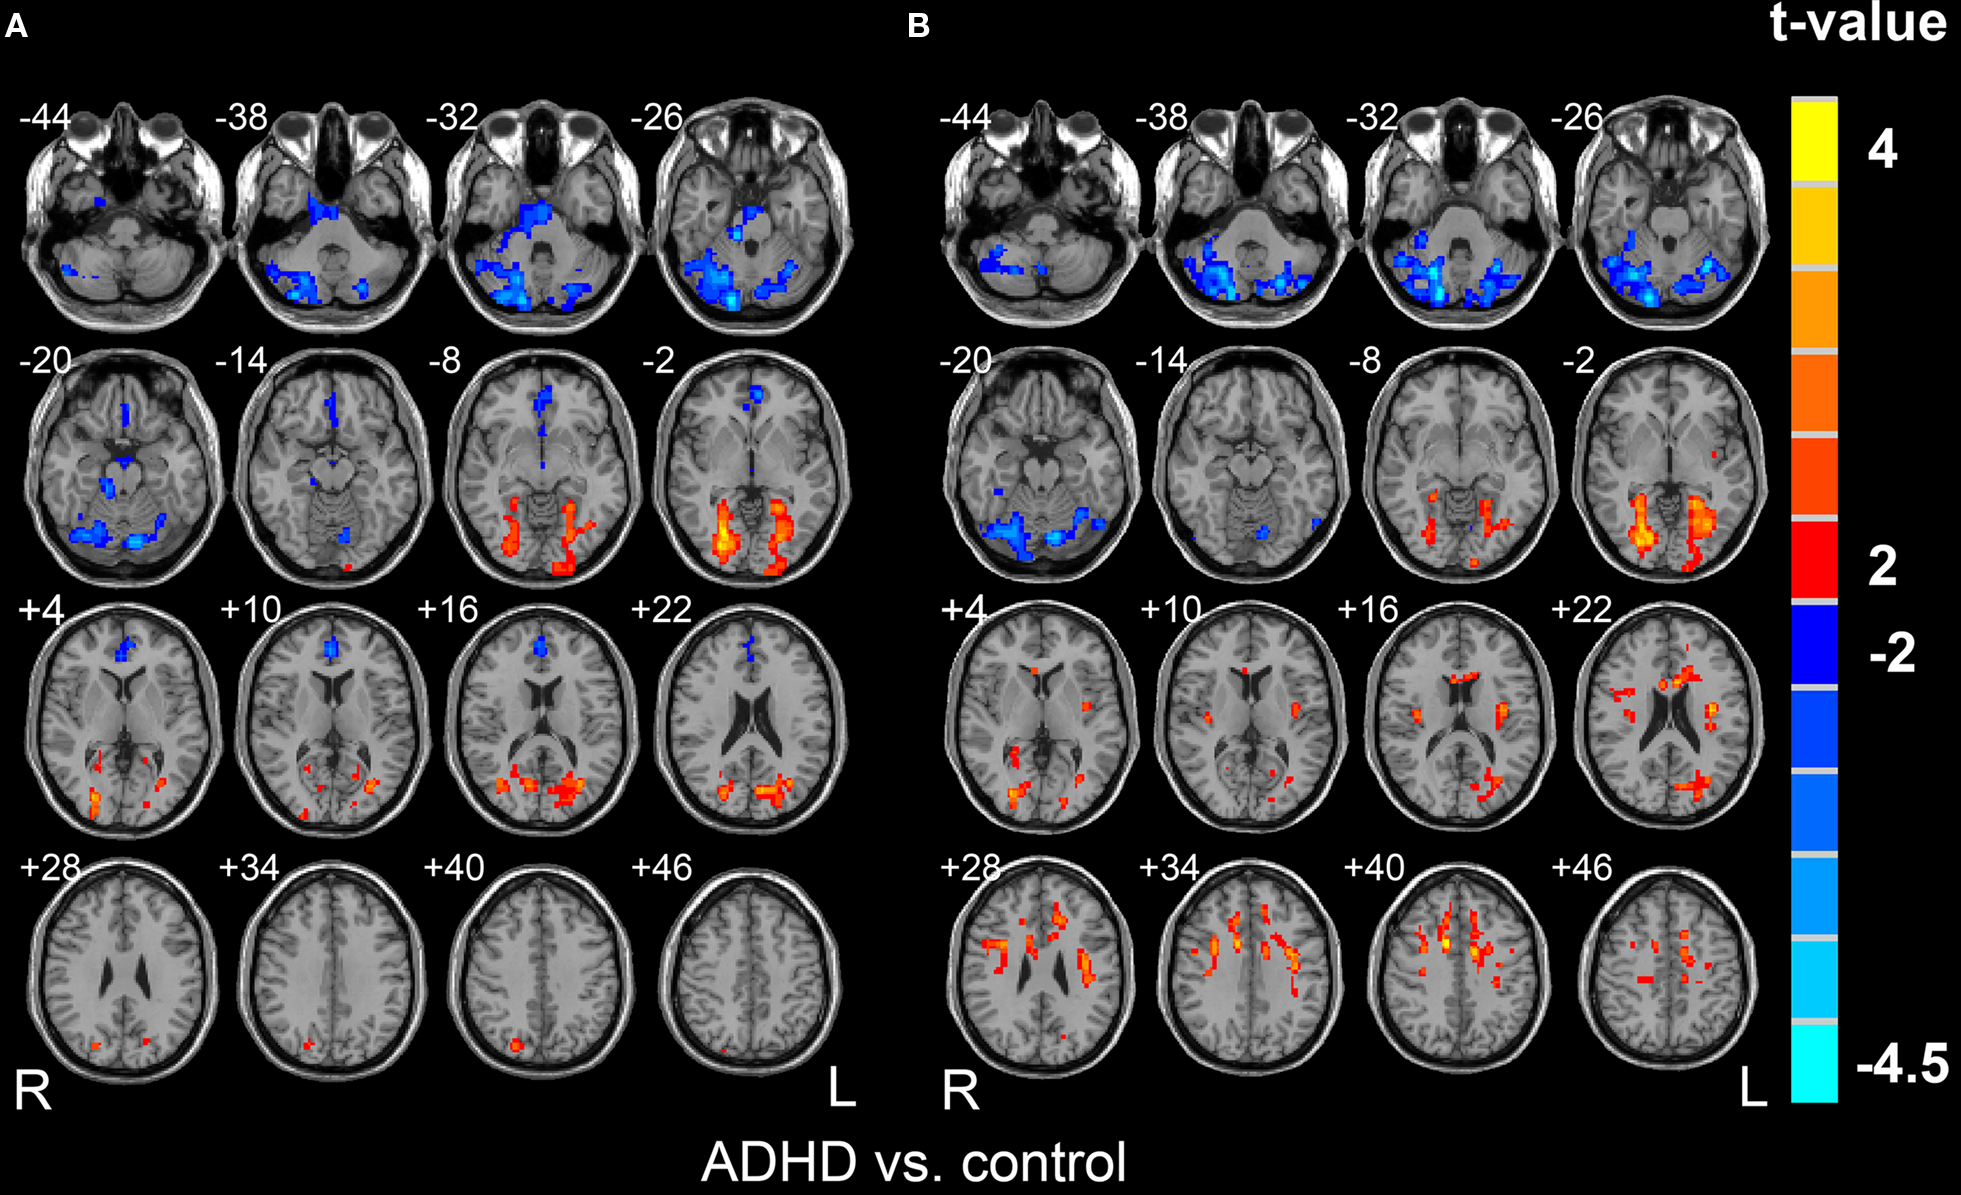
Figure 6. Brain regions showing significantly different Cohe-ReHo (A) and KCC-ReHo (B) between ADHD group and control group (p < 0. 05, corrected). The left side of the image corresponds to the right side of brain.
As did in the above section, to reveal the statistical difference between the sensitivity of these methods in detecting abnormal local synchronization of spontaneous activity, we performed two-sample t-test on the ratio map of Cohe-ReHo to KCC-ReHo. Multiple comparison correction was constrained in the conjunction map where significant differences between ADHD and control groups were found by either Cohe-ReHo or KCC-ReHo. In the right lingual gyrus and ventral ACC, Cohe-ReHo yielded more prominently between-group difference than KCC-ReHo (See yellow color in Figure 7 ). KCC-ReHo yielded almost no higher sensitivity than Cohe-ReHo. Although KCC-ReHo detected significantly between-group difference in the dorsal ACC but not Cohe-ReHo, their sensitivity in detecting abnormal local synchronization was not different enough to reach a significant level.
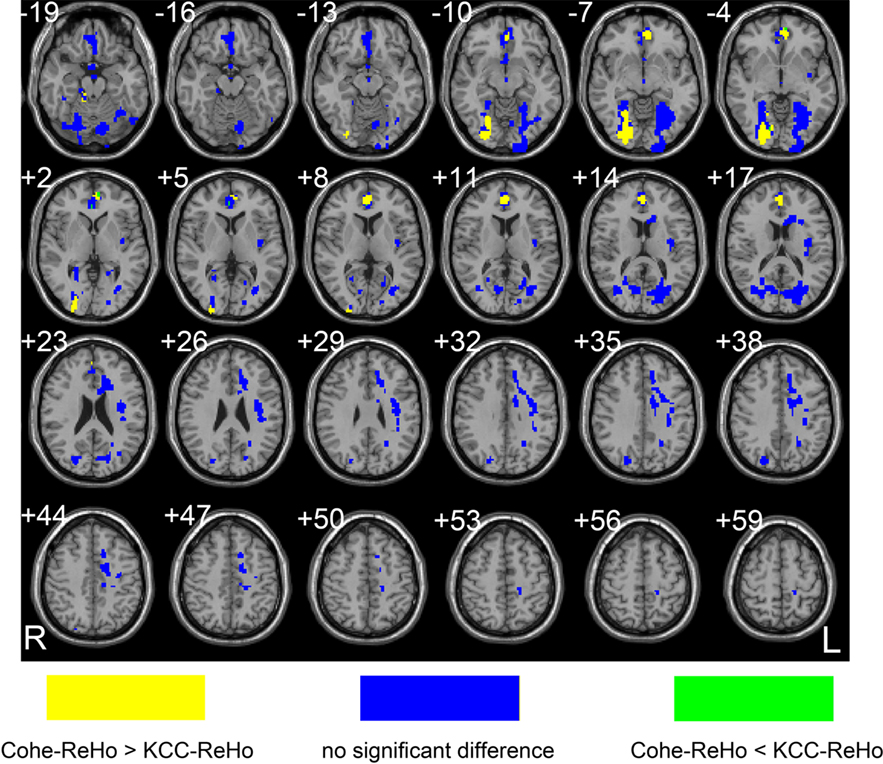
Figure 7. Cohe-ReHo and KCC-ReHo had different sensitivity to the difference in local synchronization between ADHD and control groups. Yellow color means Cohe-ReHo is more sensitive than KCC-ReHo. The green color means the opposite direction. The blue color means that the two measurements have no significant difference in their sensitivity in detecting differences between the two groups. The left side of the image corresponds to the right side of brain.
We applied coherence to measure the regional homogeneity or local synchronization of resting-state fMRI BOLD signal. Cohe-ReHo detected similar pattern of DMN as KCC-ReHo did. Results of correlation analysis and paired t-test between the two measurements indicated that physiological noise might have different effects on them. The results of between-condition paired t-test (EO vs. EC in Dataset 3) and between-group two-sample t-test (ADHD group vs. control group in Dataset 4) showed that Cohe-ReHo and KCC-ReHo yielded similar patterns. However, in-depth statistical comparison on the ratio of Cohe-ReHo to KCC-ReHo indicated that Cohe-ReHo is more sensitive to the differences of spontaneous activity between different conditions (EO vs. EC) and between different groups. One putative interpretation is that Cohe-ReHo is less susceptible to confounds from phase delay among time courses. However, we have not found an index to compare their specificity. Further investigation is necessary to elucidate their sensitivity and specificity.
The authors declare that the research was conducted in the absence of any commercial or financial relationships that could be construed as a potential conflict of interest.
This work was supported by the NSFC (30770594, Chinese-Finnish NEURO Program 30621130074), the National High Technology Program of China (863 Project, No. 2008AA02Z405), and Program for Changjiang Scholars and Innovative Research Team in University (PCSIRT).
Andrew, C., and Pfurtscheller, G. (1996). Event-related coherence as a tool for studying dynamic interaction of brain regions. Electroencephalogr. Clin. Neurophysiol. 98, 144–148.
Binder, J. R., Frost, J. A., Hammeke, T. A., Bellgowan, P. S., Rao, S. M., and Cox, R. W. (1999). Conceptual processing during the conscious resting state. A functional MRI study. J. Cogn. Neurosci. 11, 80–95.
Biswal, B., Yetkin, F. Z., Haughton, V. M., and Hyde, J. S. (1995). Functional connectivity in the motor cortex of resting human brain using echo-planar MRI. Magn. Reson. Med. 34, 537–541.
Biswal, B. B., Mennes, M., Zuo, X. N., Gohel, S., Kelly, C., Smith, S. M., Beckmann, C. F., Adelstein, J. S., Buckner, R. L., Colcombe, S., Dogonowski, A. M., Ernst, M., Fair, D., Hampson, M., Hoptman, M. J., Hyde, J. S., Kiviniemi, V. J., Kötter, R., Li, S. J., Lin, C. P., Lowe, M. J., Mackay, C., Madden, D. J., Madsen, K. H., Margulies, D. S., Mayberg, H. S., McMahon, K., Monk, C. S., Mostofsky, S. H., Nagel, B. J., Pekar, J. J., Peltier, S. J., Petersen, S. E., Riedl, V., Rombouts, S. A., Rypma, B., Schlaggar, B. L., Schmidt, S., Seidler, R. D., Siegle, G. J., Sorg, C., Teng, G. J., Veijola, J., Villringer, A., Walter, M., Wang, L., Weng, X. C., Whitfield-Gabrieli, S., Williamson, P., Windischberger, C., Zang, Y. F., Zhang, H. Y., Castellanos, F. X., and Milham, M. P. (2010). Toward discovery science of human brain function. Proc. Natl. Acad. Sci. U.S.A. 107, 4734–4739.
Cao, Q., Zang, Y., Sun, L., Sui, M., Long, X., Zou, Q., and Wang, Y. (2006). Abnormal neural activity in children with attention deficit hyperactivity disorder: a resting-state functional magnetic resonance imaging study. Neuroreport 17, 1033–1036.
Cao, X., Cao, Q., Long, X., Sun, L., Sui, M., Zhu, C., Zuo, X., Zang, Y., and Wang, Y. (2009). Abnormal resting-state functional connectivity patterns of the putamen in medication-naive children with attention deficit hyperactivity disorder. Brain Res. 1303, 195–206.
Cordes, D., Haughton, V. M., Arfanakis, K., Carew, J. D., Turski, P. A., Moritz, C. H., Quigley, M. A., and Meyerand, M. E. (2001). Frequencies contributing to functional connectivity in the cerebral cortex in “resting-state” data. AJNR Am. J. Neuroradiol. 22, 1326–1333.
Cox, R. W. (1996). AFNI: software for analysis and visualization of functional magnetic resonance neuroimages. Comput. Biomed. Res. 29, 162–173.
Fox, M. D., Corbetta, M., Snyder, A. Z., Vincent, J. L., and Raichle, M. E. (2006). Spontaneous neuronal activity distinguishes human dorsal and ventral attention systems. Proc. Natl. Acad. Sci. U.S.A. 103, 10046–10051.
Greicius, M. D., Krasnow, B., Reiss, A. L., and Menon, V. (2003). Functional connectivity in the resting brain: a network analysis of the default mode hypothesis. Proc. Natl. Acad. Sci. U.S.A. 100, 253–258.
Hampson, M., Peterson, B. S., Skudlarski, P., Gatenby, J. C., and Gore, J. C. (2002). Detection of functional connectivity using temporal correlations in MR images. Hum. Brain Mapp. 15, 247–262.
He, Y., Wang, L., Zang, Y., Tian, L., Zhang, X., Li, K., and Jiang, T. (2007). Regional coherence changes in the early stages of Alzheimer’s disease: a combined structural and resting-state functional MRI study. Neuroimage 35, 488–500.
Koyama, M. S., Kelly, C., Shehzad, Z., Penesetti, D., Castellanos, F. X., and Milham, M. P. (2010). Reading networks at rest. Cereb. cortex. [Epub ahead of print].
Long, X. Y., Zuo, X. N., Kiviniemi, V., Yang, Y., Zou, Q. H., Zhu, C. Z., Jiang, T. Z., Yang, H., Gong, Q. Y., Wang, L., Li, K. C., Xie, S., and Zang, Y. F. (2008). Default mode network as revealed with multiple methods for resting-state functional MRI analysis. J. Neurosci. Methods 171, 349–355.
Lowe, M. J., Mock, B. J., and Sorenson, J. A. (1998). Functional connectivity in single and multislice echoplanar imaging using resting-state fluctuations. Neuroimage 7, 119–132.
Marx, E., Stephan, T., Nolte, A., Deutschlander, A., Seelos, K. C., Dieterich, M., and Brandt, T. (2003). Eye closure in darkness animates sensory systems. Neuroimage 19, 924–934.
Mazoyer, B., Zago, L., Mellet, E., Bricogne, S., Etard, O., Houde, O., Crivello, F., Joliot, M., Petit, L., and Tzourio-Mazoyer, N. (2001). Cortical networks for working memory and executive functions sustain the conscious resting state in man. Brain Res. Bull. 54, 287–298.
McKiernan, K. A., Kaufman, J. N., Kucera-Thompson, J., and Binder, J. R. (2003). A parametric manipulation of factors affecting task-induced deactivation in functional neuroimaging. J. Cogn. Neurosci. 15, 394–408.
Miezin, F. M., Maccotta, L., Ollinger, J. M., Petersen, S. E., and Buckner, R. L. (2000). Characterizing the hemodynamic response: effects of presentation rate, sampling procedure, and the possibility of ordering brain activity based on relative timing. Neuroimage 11, 735–759.
Paakki, J. J., Rahko, J., Long, X., Moilanen, I., Tervonen, O., Nikkinen, J., Starck, T., Remes, J., Hurtig, T., Haapsamo, H., Jussila, K., Kuusikko-Gauffin, S., Mattila, M. L., Zang, Y., and Kiviniemi, V. (2010). Alterations in regional homogeneity of resting-state brain activity in autism spectrum disorders. Brain Res. 1321, 169–179.
Raichle, M. E., MacLeod, A. M., Snyder, A. Z., Powers, W. J., Gusnard, D. A., and Shulman, G. L. (2001). A default mode of brain function. Proc. Natl. Acad. Sci. U.S.A. 98, 676–682.
Saad, Z. S., Ropella, K. M., Cox, R. W., and DeYoe, E. A. (2001). Analysis and use of FMRI response delays. Hum. Brain Mapp. 13, 74–93.
Shulman, G. L., Fiez, J. A., Corbetta, M., Buckner, R. L., Miezin, F. M., Raichle, M. E., and Petersen, S. E. (1997). Common blood flow changes across visual tasks: II. Decrease in cerebral cortex. J. Cogn. Neurosci. 9, 648–663.
Sun, F. T., Miller, L. M., and D’Esposito, M. (2004). Measuring interregional functional connectivity using coherence and partial coherence analyses of fMRI data. Neuroimage 21, 647–658.
Welch, P. D. (1967). The use of fast fourier transform for the estimation of power spectra: a method based on time averaging over short, modified periodograms. IEEE Trans. Audio Electroacoust. AU-15, 70–73.
Wu, T., Long, X., Zang, Y., Wang, L., Hallett, M., Li, K., and Chan, P. (2009). Regional homogeneity changes in patients with Parkinson’s disease. Hum. Brain Mapp. 30, 1502–1510.
Yan, C. G., Liu, D. Q., He, Y., Zou, Q. H., Zhu, C. Z., Zuo, X. N., Long, X. Y., and Zang, Y. F. (2009). Spontaneous brain activity in the default mode network is sensitive to different resting-state conditions with limited cognitive load. PLoS ONE 4, e5743. doi:10.1371/journal.pone.0005743.
Yang, H., Long, X. Y., Yang, Y., Yan, H., Zhu, C. Z., Zhou, X. P., Zang, Y. F., and Gong, Q. Y. (2007). Amplitude of low frequency fluctuation within visual areas revealed by resting-state functional MRI. Neuroimage 36, 144–152.
Yuan, Y., Zhang, Z., Bai, F., Yu, H., Shi, Y., Qian, Y., Liu, W., You, J., Zhang, X., and Liu, Z. (2008). Abnormal neural activity in the patients with remitted geriatric depression: a resting-state functional magnetic resonance imaging study. J. Affect. Disord. 111, 145–152.
Zang, Y., Jiang, T., Lu, Y., He, Y., and Tian, L. (2004). Regional homogeneity approach to fMRI data analysis. Neuroimage 22, 394–400.
Zou, Q. H., Long, X. Y., Zuo, X. N., Yan, C. G., Zhu, C. Z., Yang, Y. H., Liu, D. Q., He. Y., and Zang, Y. F. (2009). Functional connectivity between the thalamus and visual cortex under eyes closed and eyes open conditions: a resting-state fMRI study. Hum. Brain Mapp. 30, 3066–3078.
Keywords: resting-state fMRI, local feature, regional homogeneity, coherence
Citation: Liu D, Yan C, Ren J, Yao L, Kiviniemi VJ and Zang Y (2010) Using coherence to measure regional homogeneity of resting-state fMRI signal. Front. Syst. Neurosci. 4:24. doi: 10.3389/fnsys.2010.00024
Received: 05 February 2010;
Paper pending published: 10 March 2010;
Accepted: 23 May 2010;
Published online: 17 June 2010
Edited by:
Lucina Q. Uddin, Stanford University, USAReviewed by:
Yihong Yang, National Institutes of Health, USACopyright: © 2010 Liu, Yan, Ren, Yao, Kiviniemi and Zang. This is an open-access article subject to an exclusive license agreement between the authors and the Frontiers Research Foundation, which permits unrestricted use, distribution, and reproduction in any medium, provided the original authors and source are credited.
*Correspondence: Yufeng Zang, State Key Laboratory of Cognitive Neuroscience and Learning, Beijing Normal University, Beijing 100875, People’s Republic of China. e-mail:zangyf@bnu.edu.cn
Disclaimer: All claims expressed in this article are solely those of the authors and do not necessarily represent those of their affiliated organizations, or those of the publisher, the editors and the reviewers. Any product that may be evaluated in this article or claim that may be made by its manufacturer is not guaranteed or endorsed by the publisher.
Research integrity at Frontiers
Learn more about the work of our research integrity team to safeguard the quality of each article we publish.