 David Martínez-Méndez
 Carlos Villarreal
 Leonor Huerta
- 1Instituto de Investigaciones Biomédicas, Departamento de Inmunología, Universidad Nacional Autónoma de México, Mexico City, Mexico
- 2Instituto de Física, Universidad Nacional Autónoma de México, Mexico City, Mexico
Background: The regulatory mechanisms guiding CD4 T cell differentiation are complex and are further influenced by intrinsic cell variability along with that of microenvironmental cues, such as cytokine and nutrient availability.
Objective: This study aims to expand our understanding of CD4 T cell differentiation by examining the influence of intrinsic noise on cell fate.
Methodology: A model based on a complex regulatory network of early signaling events involved in CD4 T cell activation and differentiation was described in terms of a set of stochastic differential equation to assess the effect of noise intensity on differentiation efficiency to the Th1, Th2, Th17, Treg, and
Results: The increase of noise intensity decreases differentiation efficiencies. In a microenvironment of Th1-inducing cytokines and optimal nutrient conditions, noise levels of 3
Conclusion: The stochastic CD4 T cell mathematical model presented here demonstrates a noise-dependent modulation of T cell differentiation induced by cytokines and nutrient availability. Modeling results can be explained by the network topology, which assures that the system will arrive at stable states of cell functionality despite variable levels of biological intrinsic noise. Moreover, the model provides insights into the robustness of the T cell differentiation process.
1 Introduction
1.1 Stochastic mathematical models in biology
Biological systems are epitomes of complexity and dynamism, often exhibiting behaviours that are both unpredictable and highly regulated. Emergent biological properties arise from individual interactions among the system components (nodes) leading to system self-organization and function (Anderson, 1972; Glass and Kauffman, 1973; Haken, 1978; Kauffman, 1992). Modeling the intricate interplay of genetic, environmental, and internal fluctuating elements within these systems can be achieved through stochastic mathematical models capturing the inherent randomness and nuances of biological processes. Unlike deterministic models, stochastic models incorporate randomness directly into equations, and iterative analysis produces a range of possible outcomes and their associated probabilities (Elowitz et al., 2002; Swain et al., 2002). The use of stochastic models in biology allows the analysis of the consequences of intrinsic noise on robustness of emergent properties, and thus, system stability despite internal and external fluctuations (Haken, 1978). This property has been extensively explored in the context of biological systems, revealing how they might achieve resilience (Barkai and Leibler, 1997; Kitano, 2007). Moreover, stochastic models have been instrumental in exploring system stability and bifurcation points, where small changes in parameters can lead to drastic shifts in system behavior. This concept is especially relevant in immunology, since the immune system must adapt to a vast array of pathogens and microenvironmental conditions while preventing excessive or insufficient responses. These considerations underscore the importance of mathematical modeling in predicting disease progression by understanding immune system dynamics, and identifying potential therapeutic interventions (Tyson and Novák, 2013).
The adaptive immune system’s response to pathogens relies on the differentiation of CD4 T cells into various effector phenotypes, such as Th1, Th2, Th17, Treg, and
We generalized the previously employed methodology by introducing a set of stochastic differential equations (Langevin equations), allowing the analysis of different levels of noise on cell fate (Villarreal et al., 2012), so that we explore how intrinsic noise influences the robustness and adaptability of the immune response. The regulatory network considered before (Martínez-Méndez et al., 2022) has been expanded here by incorporating the dendritic cell phase of
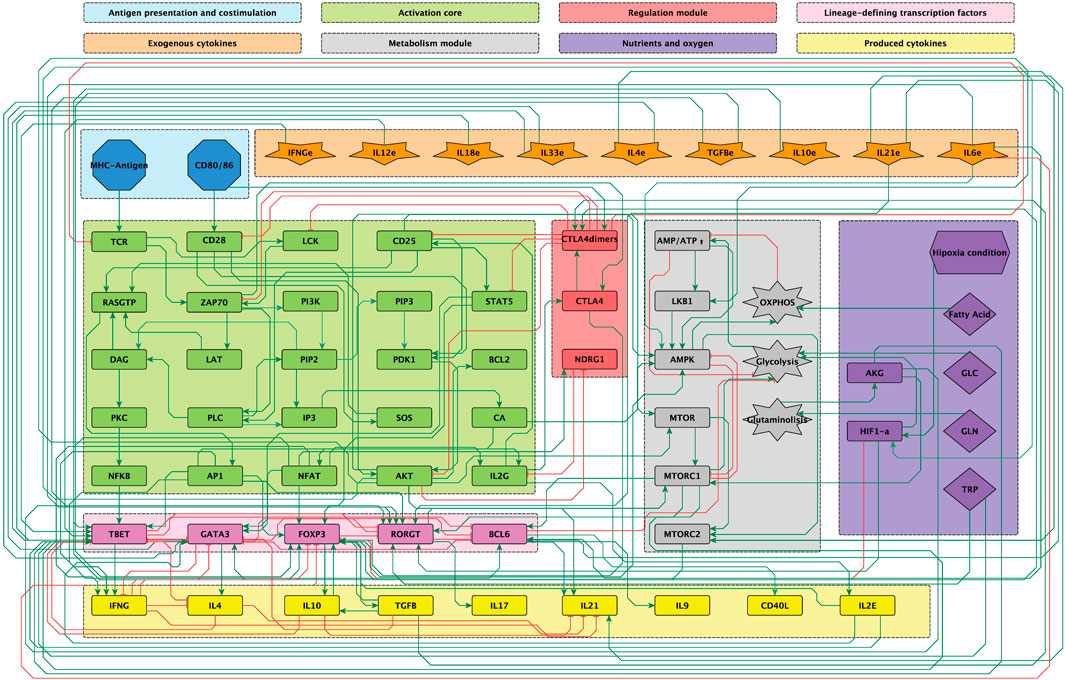
Figure 1. Modular 68-node network of early events in CD
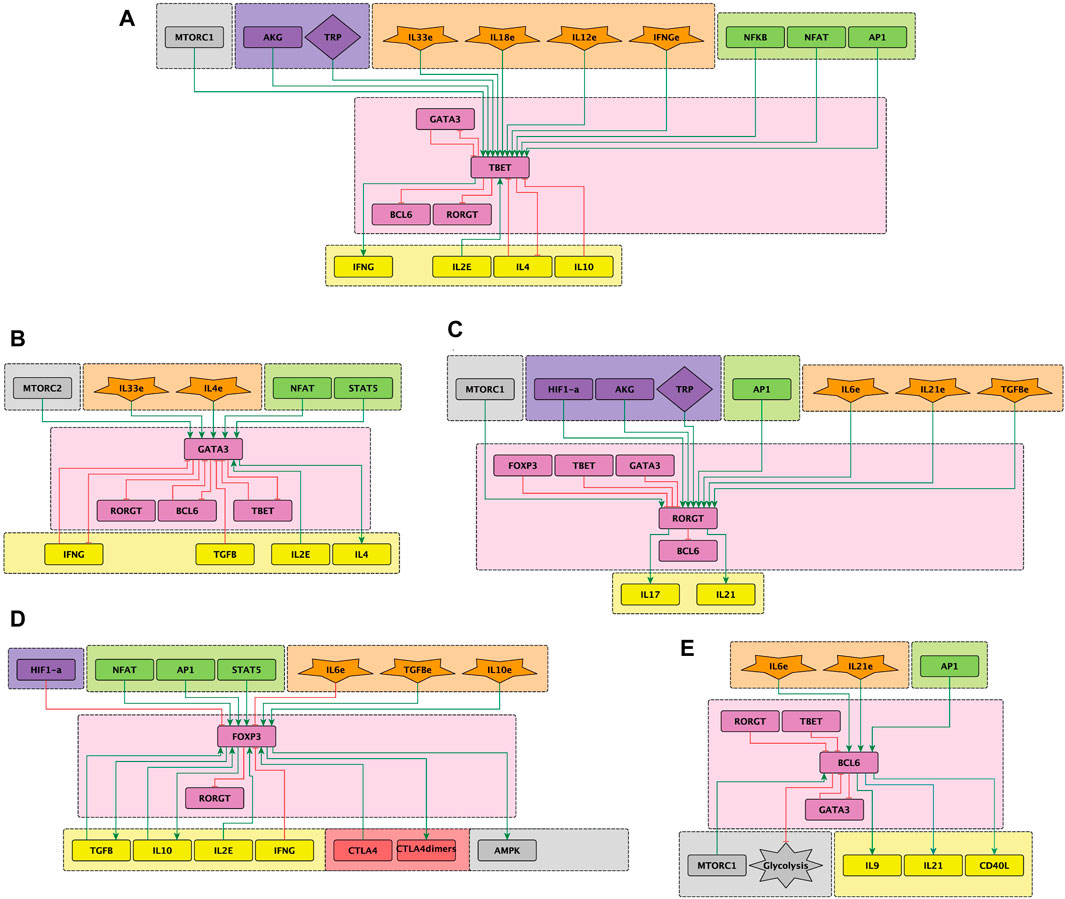
Figure 2. Sub-networks representing the effect of exogenous cytokines (orange) and signaling from transcription factors and metabolism elements (green and grey) on the activity of the lineage-defining transcription factors (LTF’s) (pink) leading to differentiaton of CD4 T cells towards effector phenotypes. (A) T-bet, (B) GATA3, (C) ROR
2 Material and methods
2.1 CD4 T cell signaling network inference and modular organization
Figure 1 shows the signalling network of interactions involved in the activation of CD4 lymphocytes upon binding of TCR-specific antigen and co-stimulatory molecules. It incorporates interactions associated to microenvironmental nutrients (glutamine and tryptophan), hypoxia and anti-inflammatory drugs. The network includes the inducers of CD4 T cell activation leading to differentiation of naïve CD4 T cells into several types of effector cells (inputs): antigenic stimulation, co-stimulation and the activity of cytokines in the microenvironment. Specific exogenous cytokines promote the activity of intracellular lineage-defining transcription factors (LTF’s) directing cell differentiation by, in turn, inducing the production of lymphocyte-derived cytokines. Thus, Th1 effector cells are induced by IL-12 and IFN-
2.2 Stochastic regulatory networks
The formal methodology discussed below has been summarized in the flux diagram depicted in Figure 3. The use of complex networks in Systems Biology allows the construction of a conceptual framework of endogenous and exogenous interactions defining signalling pathways involved in cell function (Albert and Thakar, 2014). A regulatory network is constructed by connected nodes and their inner relations where every node represents a gene, a transcription factor, a cytokine, etc. In its most basic approximation, the expression value of node
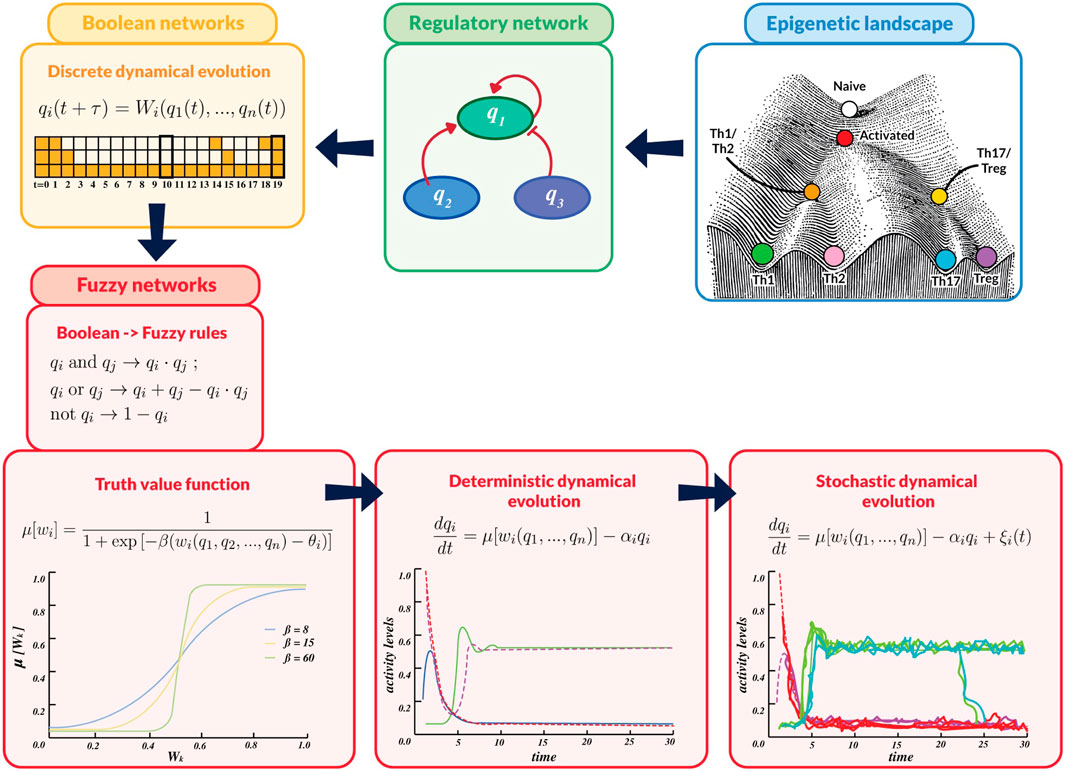
Figure 3. Flux diagram summarizing the mathematical methodology used in this work. An overall assumption is that i) cell processes in developmental biology comply with logical rules that can be described by a network of node interactions, underlying the epigenetic landscape. ii) These rules are expressed in terms of Boolean propositions representing nodes interactions, giving rise to iii) discrete-time dynamics whose steady states define cell phenotypes. The variables, logic rules and dynamic description are then translated into a continuous scheme by iv) introducing fuzzy-logic rules,
In the fuzzy logic scheme, the network interactions are described by continuous logical propositions
For example, the Boolean relation,
The truth value of a fuzzy proposition
where
where
The fuzzy logic methodology allows to construct a conceptual framework concerning the mechanistic underlying the activation and differentiation of T cells. However, this approach considers that the intensity of the network interactions remain invariable under the time evolution of the system, thus representing a deterministic description. However, no biological process works with total certainty since it is always subject to the action of a number of unknown events. Thus, here we investigate the influence of fluctuations in the T cell differentiation process.
The effect of random perturbations on the cell functionality can be visualized by recurring to the metaphor of the epigenetic landscape (EL) proposed by C. Waddington to describe the way in which gene regulation modulates cell development (Waddington, 1957). In this view, cell fate is determined by the successive transit of states defined by EL basins until it reaches a steady state called attractor. This phenomenon can be compared with the pathway of a ball on a landscape where its initial position represents an initial stem cell state, and it moves through transient intermediate basins, until it reaches an equilibrium basin determining the final cell fate. Now, a stochastic EL can be introduced by considering that under the action of noise, the ball suffers random collisions along its epigenetic trajectory; depending on the noise intensity, this process could modify the final cell fate. A formal realization of the stochastic EL can be constructed by introducing a ‘white noise’ characterized by time-dependent random variables,
The effect of noise on the system dynamics can be studied by means of a set of Langevin stochastic differential equations (Chandrasekhar, 1973):
The equilibrium state my be derived by considering the steady-state condition,
We observe that, since
It is worth mentioning that the time evolution of an ensemble may lead to a state of equilibrium, in which the ensemble average do not longer change with time (though individual members of the ensemble keep evolving); this occurs when the ensemble is ergodic, which means that the ensemble average at a fixed time coincides with the time average taken over the dynamical evolution of an individual of it:
2.3 Numerical methods
A Python interactive program was coded to integrate the stochastic differential equation system, also implementing an interactive interface to directly modify the initial conditions using the packages numpy, scipy, matplotlib and ipywidgets. For the computation, the differential equations system were solved using a collection of numerical algorithms for integrating Ito and Stratonovich stochastic ordinary differential equations (SODEs). In this study we used the Euler-Maruyama algorithm for Ito equations. The list of functions, logic rules, stochastic differential equations and diagram files used on this work can be consulted in the GitHub repository https://github.com/DrDavidMM/Stochastic with further instructions for use. For the results, all conditions were iterated 10,000 times. However, for illustrative purposes most plots in the figures were composed considering 10 iterations. The Python source code for the mathematical model presented in this work is available upon request.
3 Results
3.1 Effect of stochastic perturbations on the CD4 T cell differentiation process
The effect of random perturbations of either the cell micro-environment or the intracellular interactions themselves on the network dynamics was analyzed through a set of coupled stochastic differential equations describing the rate of change of the expression level of the network constituents. Different levels of noise were introduced into the equations and 10,000 iterations were performed to obtain an average percentage of differentiated cells under each assayed condition. Differentiation efficiency here refers to the fraction of cells reaching optimal expression levels of phenotype-specific transcription factors and their corresponding cytokines. This parameter is denoted here by
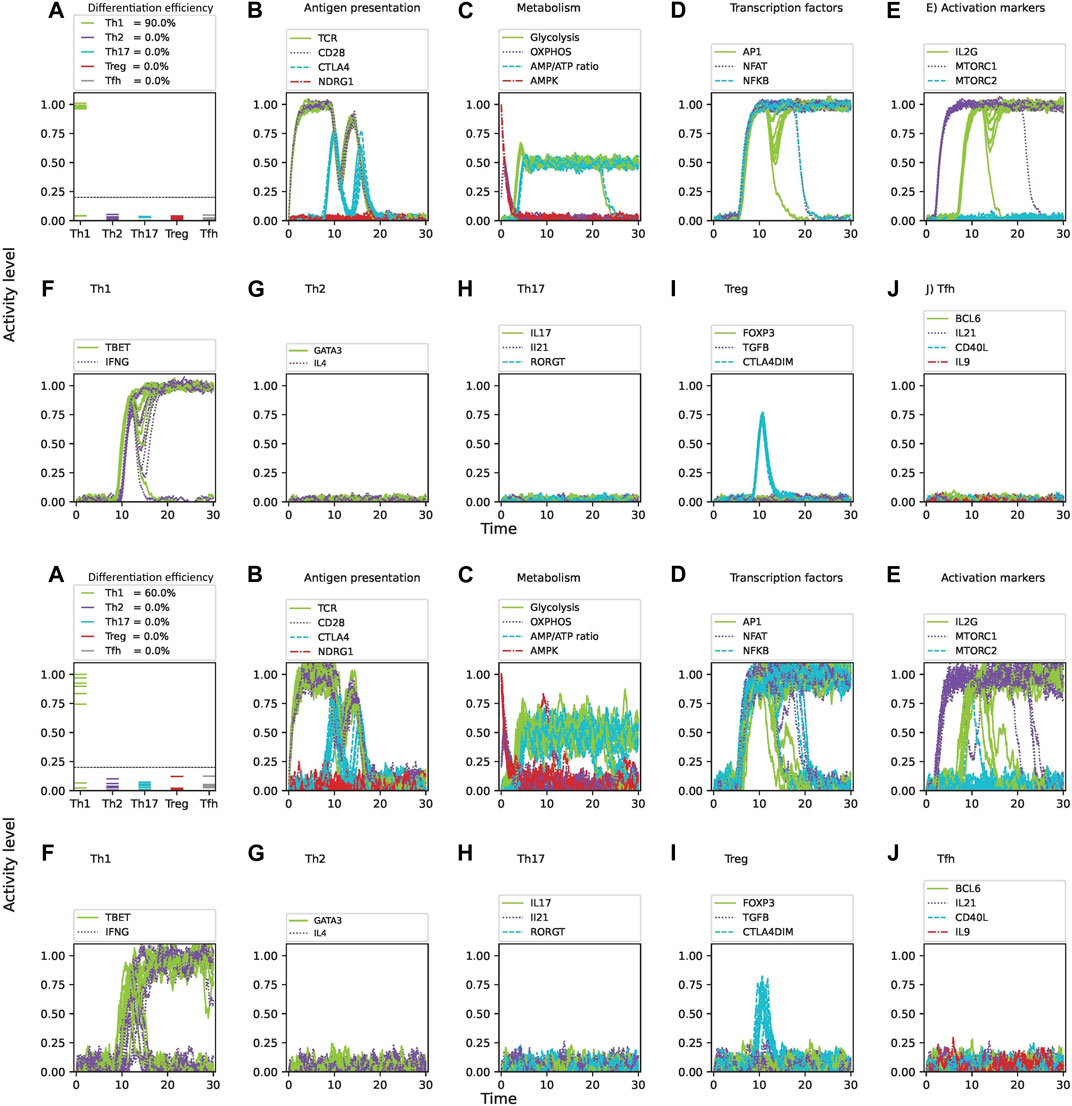
Figure 4. Intrinsic noise significantly affects the differentiation efficiency of CD4 T cells under optimal levels of Th1-inducing cytokines (IFN-
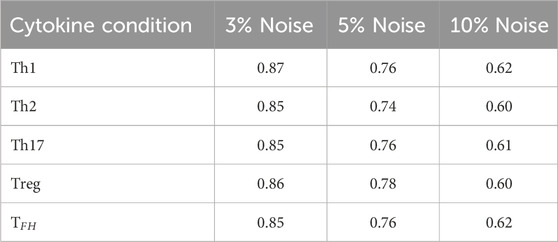
Table 1. Effect of three noise levels on CD4 T cell differentiation. Averages obtained from 10,000 iterations for each case are shown.
In Figure 5 we present the changes induced by different noise levels on the T cell differentiation efficiency under a specific cytokine microenvironment: Th1, Th2, Th17, Tref or
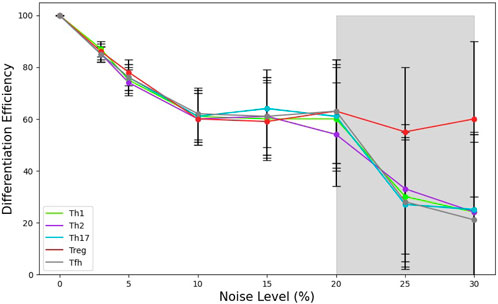
Figure 5. Relationship between the noise level and CD4 T cell differentiation efficiency,
Figure 6 shows the phenotypic profiles generated under phenotype-specific cytokine environments (Th1, Th2, Th17, Treg and
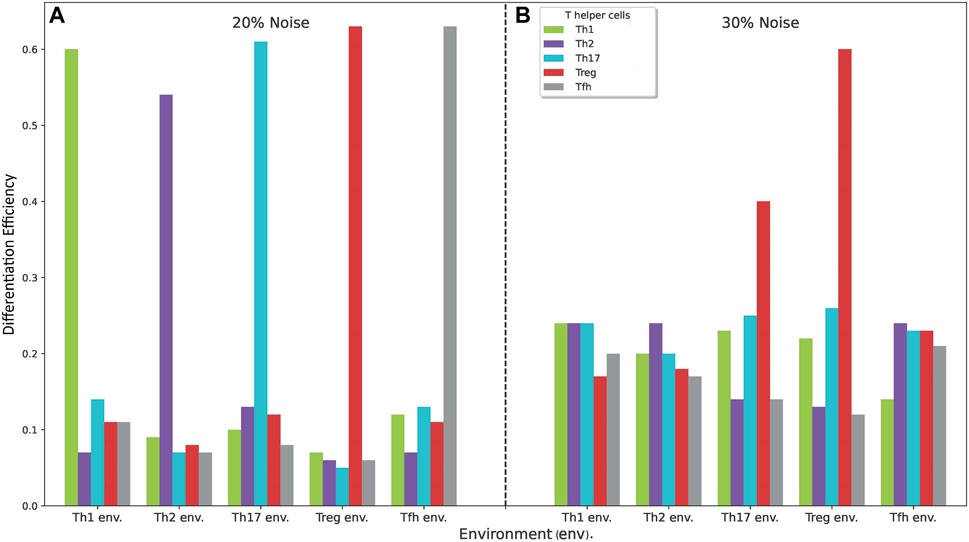
Figure 6. Phenotypic profiles generated under phenotype-specific cytokine environments (Th1, Th2, Th17, Treg and
3.2 Effect of stochastic perturbations under variable nutrient and oxygen conditions
Immunological challenges such as viral infections or autoimmune diseases induce a variety of cytokines that does not necessarily match definite patterns inducing particular effector phenotypes. Rather, the presence of infectious agents, and particularly during their persistence in the host, induces the production of mixtures of cytokines that, in principle, may act in a synergic or antagonistic way in the stimulation of naïve cells (reviewed in (Dupage and Bluestone, 2016). The multiple influences converging on phenotype-defining transcription factors are illustrated in Figure 2. Moreover, availability of nutrients and oxygen has a direct effect on T cell differentiation in sites of proliferation such as inflammation sites and lymph nodes (Tao et al., 2015; Swamy et al., 2016; Tykocinski et al., 2017). Here we analyze the effect of noise on CD4 T cell differentiation under mixtures of environmental cytokines and changing conditions of glutamine, trypthophan and oxygen availability.
Glutamine, when metabolized into alpha-ketoglutarate (AKG), enters the mitochondrial citric acid cycle and upregulates mTORC1, enhancing glycolysis (Swamy et al., 2016). Glutamine is required for CD4 T cell activation and induction of the Th1 phenotype, and can promote the expression of the Th1 transcription factor T-bet (Klysz et al., 2015; Swamy et al., 2016). The effect of glutamine deprivation was examined under conditions simulating a mixture of optimal concentration of Th1/Th2 cytokines, as well as optimal nutrient and oxygen levels, and with 3
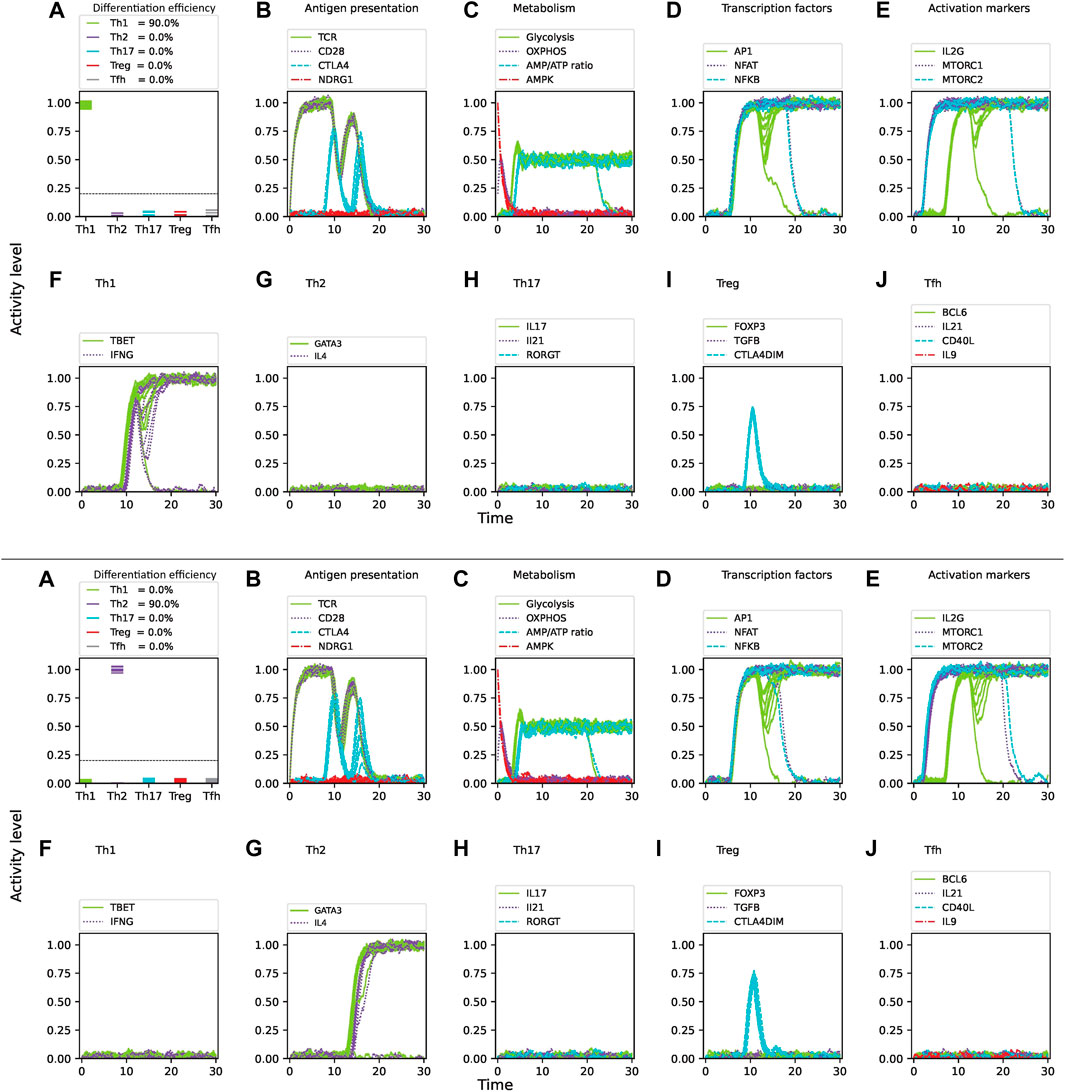
Figure 7. Effect of glutamine deprivation on CD4 T cell activation and differentiation under optimal levels of Th1 (IFN-
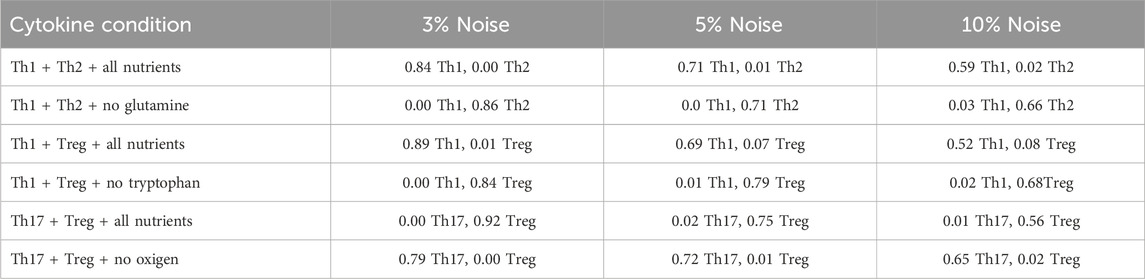
Table 2. Effect of three noise levels on CD4 T cell differentiation under different cytokine and nutrient combinations. Averages obtained from 10,000 iterations for each case are shown.
Tryptophan is an essential amino acid that plays a crucial role in the protein synthesis and proliferation of activated T cells. Notably, studies have shown that tryptophan degradation is used by tumor cells to evade the immune system by depleting its availability for surrounding immune cells, thus hindering their correct differentiation and antitumoral activity (Mellor and Munn, 2004). Tryptophan can activate the ROR
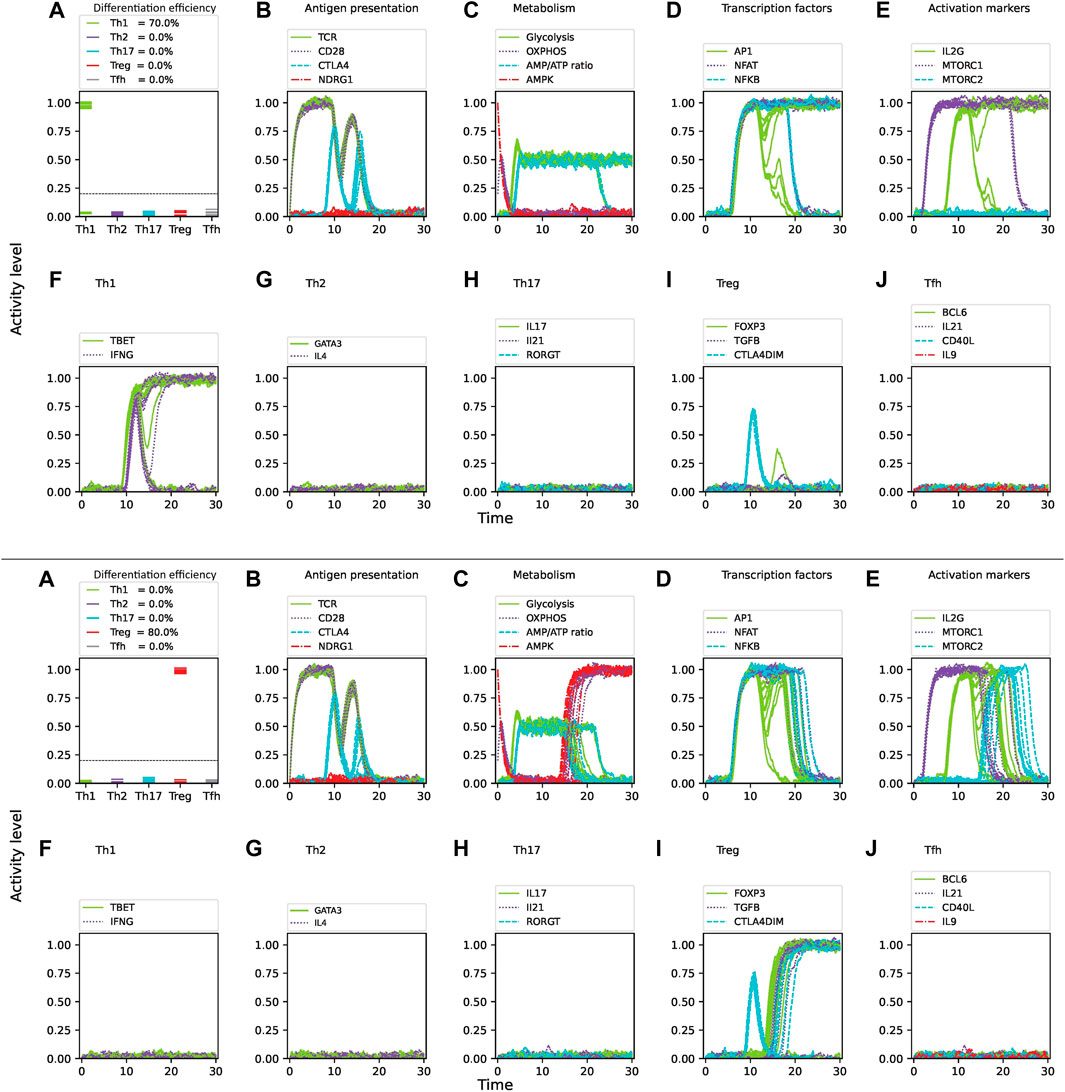
Figure 8. Effect of tryptophan deprivation on CD4 T cell activation and differentiation under optimal levels of Th1 (IFN-
Hypoxia is a common characteristic of proinflammatory environments (Dang et al., 2011). The hypoxia-responsive factor 1-alpha (HIF-1
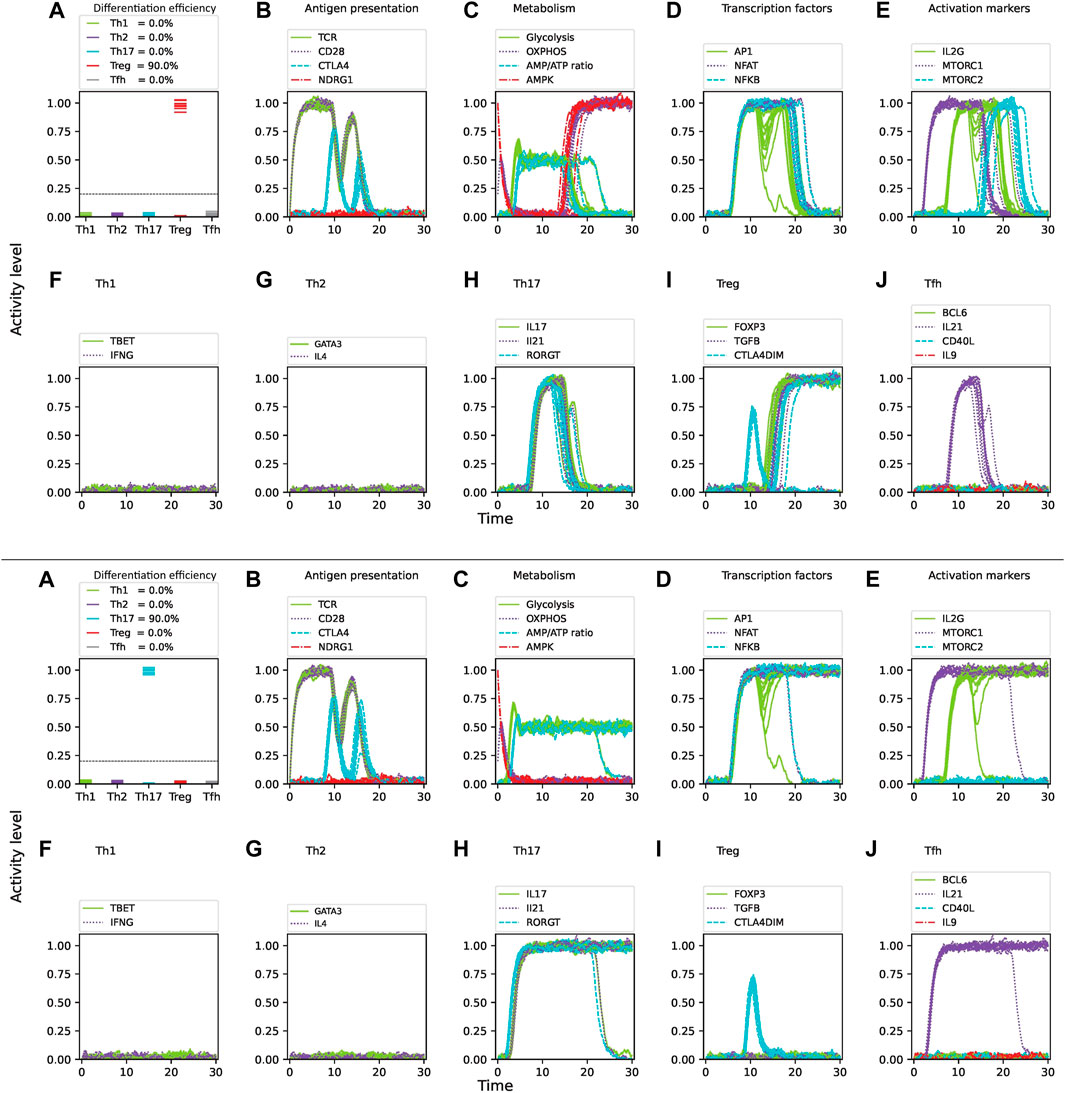
Figure 9. Effect of oxygen deprivation on CD4 T cell activation and differentiation under optimal levels of Th17 (IFN-
4 Discussion
The function of the immune system embraces inherent variability at the cellular level and microenvironmental conditions. This is evidenced by the profile of CD4 T cell populations generated in vitro under controlled polarizing conditions and analyzed flow cytometry, showing that not all cells in a defined population are equally responsive to activation and differentiation stimulus (Espinosa et al., 2020; Siracusa et al., 2021). From a previously characterized continuous deterministic model of CD4 T cell function Martínez-Méndez et al. (2022), here we explored the effect of intrinsic noise on the differentiation efficiency of CD4 T cells into effector phenotypes under defined cytokine and nutrient conditions by translating the deterministic model into a stochastic scheme.
Our results demonstrate that the efficiency of CD4 T cell differentiation is sensitive to intrinsic noise. Increasing noise intensity from 3
In vitro experiments performed using highly purified naïve CD4 T cells activated through the TCR and CD28 in the presence of specific phenotype-inducing cytokines yield evidence on the effect of intrinsic noise on T cell differentiation. Well-controlled settings assured minimal microenvironmental fluctuations besides the intrinsic biological variability of naïve cells. Analysis of the whole cell population in a single-cell basis by flow cytometry allowed to show that differentiation efficiency is far from the ideal value
In microenvironments containing cytokine mixtures increasing levels of noise reduces differentiation efficiency and promotes low amounts of alternative phenotypes (Table 2). Thus, modeling shows that activation of CD4 T cells in the presence of glutamine in a mixed Th1/Th2 cytokine environment leads to Th1 differentiation, whereas removal of glutamine skewed the balance towards Th2. This result agrees with experimental observations showing that glutamine deprivation blocked the expression of T-bet under Th1-polarizing conditions but had no effect on the expression of GATA3 under Th2-polarizing conditions. This change in T-bet expression in glutamine-deprived cells was associated with an almost complete absence of IFN-
Similarly, activation in a medium depleted of tryptophan in a Th1/Treg cytokine environment shifts the differentiation from Th1 mainly towards a Treg phenotype. On the other hand, hypoxia promoted Th17 differentiation while inhibiting Treg in a Th17/Treg cytokine environment. In both cases, noise has a relevant effect on cell differentiation efficiency. Mixed cytokine environments render differentiation efficiencies different from those obtained in phenotype-specific cytokine conditions under the same levels of noise (compare Table 1; Table 2). This could be explained by the combined effect of noise and the multiple positive and negative interactions between nodes (Figure 2). Thus, modeling agrees with a role of glutamine, tryptophan, an oxygen in the maintenance of stable Th1 and Treg phenotypes even under high noise levels (Yan et al., 2010; Shi et al., 2011; Yang et al., 2021). Thus, in conjunction with nutrients, cytokines and oxygen, intrinsic noise has an important role in shaping the immune response.
The accuracy and robustness of computational models are inherently linked to the assumptions and parameters chosen. However, all the relationships between nodes included in the present network are well established facts supported by the literature and have been added step by step in a modular way on the basis of what is currently accepted in the field of the function of the adaptive immune response. The resulting network includes cascade signaling events, redundant rules, positive and negative feedback between nodes, as well as cross-regulation, particularly between nodes representing the lineage-defining transcription factors. All these interactions diversify, reinforce and regulate initial activation and differentiation signals to lead to cell function. Thus, modeling results can be explained by the network topology, which assures that the system will arrive at stable states reflecting cell functionality despite variable levels of biological intrinsic noise. Results are in agreement with experimental observations, indicating that the main assumptions incorporated into the model structure are correct. Further, the model can continue evolving by introducing relevant complementary elements and new discoveries, in order to explore a wider range of hypothetical conditions related to experimental results and clinic observations.
Our approach contributes to validate the utility of computational models in predicting immune cell behavior. Stochastic modeling allows to explore the effect of random perturbations able to alter the topography of the epigenetic landscape leading to functional phenotypic traits.
Data availability statement
Details of the regulatory network considered in this work can be consulted online at https://github.com/DrDavidMM/Stochastic. The interactive model used here can be provided upon request to authors.
Author contributions
DM-M: Writing–review and editing, Writing–original draft, Visualization, Validation, Software, Methodology, Investigation, Formal Analysis, Data curation, Conceptualization. CV: Writing–review and editing, Writing–original draft, Validation, Supervision, Methodology, Investigation, Conceptualization. LH: Methodology, Writing–review and editing, Writing–original draft, Validation, Supervision, Project administration, Funding acquisition, Conceptualization.
Funding
The author(s) declare that financial support was received for the research, authorship, and/or publication of this article. This work was supported by Programa de Apoyo a Proyectos de Investigación e Innovación Tecnológica of the Universidad Nacional Autónoma de México (grant number IG200623 to LH and CV) and a postdoctoral fellowship from CONACYT (CVU number 555239 to DM-M).
Acknowledgments
Figure 3 was design by Lya Naranjo. DM-M acknowledges partial support from Instituto de Investigaciones Biomédicas and DM-M, CV, LH acknowledges support from Centro de Ciencias de la Complejidad (C3), Universidad Nacional Autónoma de México.
Conflict of interest
The authors declare that the research was conducted in the absence of any commercial or financial relationships that could be construed as a potential conflict of interest.
Publisher’s note
All claims expressed in this article are solely those of the authors and do not necessarily represent those of their affiliated organizations, or those of the publisher, the editors and the reviewers. Any product that may be evaluated in this article, or claim that may be made by its manufacturer, is not guaranteed or endorsed by the publisher.
Supplementary material
The Supplementary Material for this article can be found online at: https://www.frontiersin.org/articles/10.3389/fsysb.2024.1412931/full#supplementary-material
References
Albert, R., and Thakar, J. (2014). Boolean modeling: a logic-based dynamic approach for understanding signaling and regulatory networks and for making useful predictions. WIREs Syst. Biol. Med. 6, 353–369. doi:10.1002/wsbm.1273
Barkai, N., and Leibler, S. (1997). Robustness in simple biochemical networks. Nature 387, 913–917. doi:10.1038/43199
Barrera, M., Hiriart, M., Cocho, G., and Villarreal, C. (2020). Type 2 diabetes progression: a regulatory network approach. Chaos 30 (9), 093132. doi:10.1063/5.0011125
Button, E. L., Bersten, D. C., and Whitelaw, M. L. (2017). Hif has biff – crosstalk between hif1a and the family of bhlh/pas proteins. Exp. Cell. Res. 356, 141–145. doi:10.1016/j.yexcr.2017.03.055
Chandrasekhar (1973). Stochastic processes in physics and astronomy. Rev. Mod. Phys. 15, 1–83. doi:10.1103/RevModPhys.15.1
Criado, G., Šimelyte, E., Inglis, J. J., Essex, D., and Williams, R. O. (2009). Indoleamine 2,3 dioxygenase-mediated tryptophan catabolism regulates accumulation of th1/th17 cells in the joint in collagen-induced arthritis. Arthritis Rheumatism 60, 1342–1351. doi:10.1002/art.24446
Dang, E. V., Barbi, J., Yang, H. Y., Jinasena, D., Yu, H., Zheng, Y., et al. (2011). Control of th17/treg balance by hypoxia-inducible factor 1. Cell. 146, 772–784. doi:10.1016/j.cell.2011.07.033
Dupage, M., and Bluestone, J. A. (2016). Harnessing the plasticity of cd4+ t cells to treat immune-mediated disease. Nat. Rev. Immunol. 16, 149–163. doi:10.1038/nri.2015.18
Elowitz, M. B., Levine, A. J., Siggia, E. D., and Swain, P. S. (2002). Stochastic gene expression in a single cell. Science 297, 1183–1186. doi:10.1126/science.1070919
Enciso, J., and Pelayo, R. C. V. (2019). From discrete to continuous modeling of lymphocyte development and plasticity in chronic diseases. Front. Immunol. 10, 1927. doi:10.3389/fimmu.2019.01927
Espinosa, J. R., Wheaton, J. D., and Ciofani, M. (2020). In vitro differentiation of cd4+ t cell effector and regulatory subsets. Methods Mol. Biol. Clift. N.J. 2111, 79–89. doi:10.1007/978-1-0716-0266-9_7
Gargaro, M., Manni, G., Scalisi, G., Puccetti, P., and Fallarino, F. (2021). Tryptophan metabolites at the crossroad of immune-cell interaction via the aryl hydrocarbon receptor: implications for tumor immunotherapy. Int. J. Mol. Sci. 22, 4644. doi:10.3390/ijms22094644
Glass, L., and Kauffman, S. A. (1973). The logical analysis of continuous, non-linear biochemical control networks. J. Theor. Biol. 39, 103–129. doi:10.1016/0022-5193(73)90208-7
Haken, H. (1978) “Synergetics: an introduction nonequilibrium phase transitions and self-organization in physics,” in Chemistry and biology. Berlin: Springer-Verlag.
Kauffman, S. A. (1992). The origins of order: self-organization and selection in evolution. Oxford: Oxford University Press, 61–100. doi:10.1142/9789814415743_0003
Kitano, H. (2007). Towards a theory of biological robustness. Mol. Syst. Biol. 3, 137. doi:10.1038/msb4100179
Klysz, D., Tai, X., Robert, P. A., Craveiro, M., Cretenet, G., Oburoglu, L., et al. (2015). Glutamine-dependent α-ketoglutarate production regulates the balance between T helper 1 cell and regulatory T cell generation. Science Signaling 8 (396), ra97. doi:10.1126/scisignal.aab2610
Martínez-Méndez, D., Huerta, L., and Villarreal, C. (2022). Modeling the effect of environmental cytokines, nutrient conditions and hypoxia on cd4+ t cell differentiation. Front. Immunol. 13, 962175. doi:10.3389/fimmu.2022.962175
Martínez-Méndez, D., Mendoza, L., Villarreal, C., and Huerta, L. (2021). Continuous modeling of t cd4 lymphocyte activation and function. Front. Immunol. 12, 743559. doi:10.3389/fimmu.2021.743559
Martínez-Méndez, D., Villarreal, C., Mendoza, L., and Huerta, L. (2020). An integrative network modeling approach to T CD4 cell activation. Front. Physiology 11, 380. doi:10.3389/fphys.2020.00380
Mellor, A. L., and Munn, D. H. (2004). Ido expression by dendritic cells: tolerance and tryptophan catabolism. Nat. Rev. Immunol. 4, 762–774. doi:10.1038/nri1457
Mendoza, L., and Xenarios, I. (2006). A method for the generation of standardized qualitative dynamical systems of regulatory networks. Theor. Biol. Med. Model. 3, 13–18. doi:10.1186/1742-4682-3-13
Miska, J., Lee-Chang, C., Rashidi, A., Muroski, M. E., Chang, A. L., Lopez-Rosas, A., et al. (2019). Hif-1 is a metabolic switch between glycolytic-driven migration and oxidative phosphorylation-driven immunosuppression of tregs in glioblastoma. Cell. Rep. 27, 226–237. doi:10.1016/j.celrep.2019.03.029
Nakaya, M., Xiao, Y., Zhou, X., Chang, J. H., Chang, M., Cheng, X., et al. (2014). Inflammatory t cell responses rely on amino acid transporter asct2 facilitation of glutamine uptake and mtorc1 kinase activation. Immunity 40, 692–705. doi:10.1016/j.immuni.2014.04.007
Oestreich, K. J., Read, K. A., Gilbertson, S. E., Hough, K. P., Mcdonald, W., Krishnamoorthy, V., et al. (2015). Bcl-6 directly represses the gene program of the glycolysis pathway. pathway 15, 957–964. doi:10.1038/ni.2985
Pearce El, E. L., Poffenberger, M. C., Chang, C. H., and Jones, R. G. (2013). Fueling immunity: insights into metabolism and lymphocyte function. Science 342, 1242454. doi:10.1126/science.1242454
Peyraud, F., Guegan, J. P., Bodet, D., Cousin, S., Bessede, A., and Italiano, A. (2022). Targeting tryptophan catabolism in cancer immunotherapy era: challenges and perspectives. Front. Immunol. 13, 807271. doi:10.3389/fimmu.2022.807271
Semenza, G. L. (2000). Hif-1 and human disease: one highly involved factor. Genes. Dev. 14 (16), 1983–1991. doi:10.1101/gad.14.16.1983
Shi, L. Z., Wang, R., Huang, G., Vogel, P., Neale, G., Green, D. R., et al. (2011). HIF1alpha-dependent glycolytic pathway orchestrates a metabolic checkpoint for the differentiation of TH17 and Treg cells. J. Exp. Med. 208, 1367–1376. doi:10.1084/jem.20110278
Siracusa, F., Muscate, F., and Perez, L. G. (2021). Murine t-helper cell differentiation and plasticity. Methods Mol. Biol. Clift. N.J. 2285, 65–75. doi:10.1007/978-1-0716-1311-5_5
Swain, P. S., Elowitz, M. B., and Siggia, E. D. (2002). Intrinsic and extrinsic contributions to stochasticity in gene expression. Comput. Biol. 99 (20), 12795–12800. doi:10.1073/pnas.162041399
Swamy, M., Pathak, S., Grzes, K. M., Damerow, S., Sinclair, L. V., Aalten, D. M. V., et al. (2016). Glucose and glutamine fuel protein o-glcnacylation to control t cell self-renewal and malignancy. Nat. Immunol. 17, 712–720. doi:10.1038/ni.3439
Tao, J. H., Barbi, J., and Pan, F. (2015). Hypoxia-inducible factors in t lymphocyte differentiation and function. a review in the theme: cellular responses to hypoxia. Am. J. Physiology - Cell. Physiology 309, C580–C589. doi:10.1152/ajpcell.00204.2015
Tykocinski, L. O., Lauffer, A. M., Bohnen, A., Kaul, N. C., Krienke, S., Tretter, T., et al. (2017). Synovial fibroblasts selectively suppress th1 cell responses through Ido1-mediated tryptophan catabolism. J. Immunol. 198, 3109–3117. doi:10.4049/jimmunol.1600600
Tyson, J. J., and Novák, B. (2013). Cell cycle dynamics, bistability and oscillations. New York, NY: Springer New York, 263–270. doi:10.1007/978-1-4419-9863-7_21
Villarreal, C., Padilla-Longoria, P., and Alvarez-Buylla, E. (2012). General theory of genotype to phenotype mapping: derivation of epigenetic landscapes from n-node complex gene regulatory networks. Phys. Rev. Lett. 109, 118102–118105. doi:10.1103/PhysRevLett.109.118102
Wang, G. L., Jiang, B. H., Rue, E. A., and Semenza, G. L. (1995). Hypoxia-inducible factor 1 is a basic-helix-loop-helix-PAS heterodimer regulated by cellular O2 tension. Genetics 92, 5510–5514. doi:10.1073/pnas.92.12.5510
Yan, Y., Zhang, G. X., Gran, B., Fallarino, F., Yu, S., Li, H., et al. (2010). Ido upregulates regulatory t cells via tryptophan catabolite and suppresses encephalitogenic t cell responses in experimental autoimmune encephalomyelitis. J. Immunol. 185, 5953–5961. doi:10.4049/jimmunol.1001628
Yang, G., Xia, Y., and Ren, W. (2021). Glutamine metabolism in th17/treg cell fate: applications in th17 cell-associated diseases. Sci. China Life Sci. 64, 221–233. doi:10.1007/s11427-020-1703-2
Keywords: CD4 T lymphocytes, noise, cytokines, complex network, differentiation, stochastic process, hypoxia, glutamine
Citation: Martínez-Méndez D, Villarreal C and Huerta L (2024) Modeling uncertainty: the impact of noise in T cell differentiation. Front. Syst. Biol. 4:1412931. doi: 10.3389/fsysb.2024.1412931
Received: 06 April 2024; Accepted: 10 July 2024;
Published: 06 August 2024.
Edited by:
Alok Vishnu Joglekar, University of Pittsburgh, United StatesReviewed by:
Matteo Barberis, University of Surrey, United KingdomSong Feng, Pacific Northwest National Laboratory (DOE), United States
Copyright © 2024 Martínez-Méndez, Villarreal and Huerta. This is an open-access article distributed under the terms of the Creative Commons Attribution License (CC BY). The use, distribution or reproduction in other forums is permitted, provided the original author(s) and the copyright owner(s) are credited and that the original publication in this journal is cited, in accordance with accepted academic practice. No use, distribution or reproduction is permitted which does not comply with these terms.
*Correspondence: David Martínez-Méndez, ZGF2aWRtbUBmaXNpY2EudW5hbS5teA==; Leonor Huerta, bGVvbm9yaGhAaWliaW9tZWRpY2FzLnVuYW0ubXg=