 Yasmine Ahmed
 Cheryl A. Telmer
 Gaoxiang Zhou
 Natasa Miskov-Zivanov
- 1Electrical and Computer Engineering Department, University of Pittsburgh, Pittsburgh, PA, United States
- 2Department of Biological Sciences, Carnegie Mellon University, Pittsburgh, PA, United States
- 3Bioengineering, Computational and Systems Biology, University of Pittsburgh, Pittsburgh, PA, United States
New discoveries and knowledge are summarized in thousands of published papers per year per scientific domain, making it incomprehensible for scientists to account for all available knowledge relevant for their studies. In this paper, we present ACCORDION (ACCelerating and Optimizing model RecommenDatIONs), a novel methodology and an expert system that retrieves and selects relevant knowledge from literature and databases to recommend models with correct structure and accurate behavior, enabling mechanistic explanations and predictions, and advancing understanding. ACCORDION introduces an approach that integrates knowledge retrieval, graph algorithms, clustering, simulation, and formal analysis. Here, we focus on biological systems, although the proposed methodology is applicable in other domains. We used ACCORDION in nine benchmark case studies and compared its performance with other previously published tools. We show that ACCORDION is: comprehensive, retrieving relevant knowledge from a range of literature sources through machine reading engines; very effective, reducing the error of the initial baseline model by more than 80%, recommending models that closely recapitulate desired behavior, and outperforming previously published tools; selective, recommending only the most relevant, context-specific, and useful subset (15%–20%) of candidate knowledge in literature; diverse, accounting for several distinct criteria to recommend more than one solution, thus enabling alternative explanations or intervention directions.
1 Introduction
Discoveries, predictions, design of treatments and interventions in biological and many other systems require understanding of system dynamics. To retrieve useful information and create reliable models for studying system dynamics, modelers often survey published papers, search model and interaction databases (e.g., Reactome (Fabregat et al., 2018), STRING (von Mering et al., 2005), KEGG (Aoki and Kanehisa, 2005) etc.), incorporate background and common-sense knowledge of domain experts, and interpret data and observations from wet-lab experiments. Several million new scientific papers are published every year, with thousands in individual scientific domains, making it incomprehensible for scientists to account for all available knowledge relevant to their studies. The time-consuming manual steps make the creation of models a slow, laborious and error-prone process. On the other hand, machine learning and bioinformatics advances have enabled automated inference of network models from data. Although very proficient in identifying associations and correlations between system components, these methods still struggle if tasked with finding directionality of influences and causation (Lecca, 2021), which are necessary in order to study system dynamics, the state changes in the system and its components over time. Inferring large causal models from data requires significant time and computational resources, it is strongly dependent on the quality of the data, and on the applied statistics and machine learning methods (Fisher and Henzinger, 2007). The rapid growth of the amount of biological data in the public domain also aggravates the issues with data inconsistency and fragmentation (Valenzuela-Escárcega et al., 2015). Therefore, to efficiently create interpretable dynamic models, it is necessary to develop novel methods that combine (i) automated retrieval and selection of new, reliable, and useful information about component influences and causality, with (ii) automated recommendation of how to incorporate this information into models. Besides the significant speedup over slow manual steps, this would also expand the current capabilities for retrieval and processing of textual data and information about influences and causality. All the above would in turn result in a consistent, comprehensive, robust, and curated process for creating dynamic models.
In (Ahmed et al., 2021a), we surveyed different methods that we developed to automate extension and recommendation of dynamic models by identifying and selecting relevant information among large sets of causal relationships, usually retrieved from literature (Liang et al., 2017; Sayed et al., 2018b; Ahmed and Miskov-Zivanov, 2021; Ahmed et al., 2021b). While all of our previous efforts, described in (Ahmed et al., 2021a), succeed to some extent in addressing the above-described challenges, each one of them still has drawbacks. They are either not scalable for large amounts of available information (Liang et al., 2017; Sayed et al., 2018b), non-deterministic (provide different solutions when run multiple times) (Sayed et al., 2018b), or attempt to create dynamic models based mainly on the static graph structure, not accounting for the dynamic behavior (Ahmed and Miskov-Zivanov, 2021; Ahmed et al., 2021b).
In this work, we propose ACCORDION (ACCelerating and Optimizing model RecommenDatIONs), a tool that identifies useful and relevant information from published literature and recommends model modifications that lead to closely recapitulating desired system behavior, all in a fully automated manner. Thus, compared to the work in (Ahmed and Miskov-Zivanov, 2021; Ahmed et al., 2021b), ACCORDION also considers the dynamic behavior, and in contrast to (Liang et al., 2017; Sayed et al., 2018b), it focuses on identifying clusters of strongly connected elements in the newly extracted information that can have a measurable impact on the dynamic behavior of the model. ACCORDION is versatile, it can be used to extend any model that has a directed graph as an underlying structure (with the system components as nodes and the influences between components as directed edges), and update functions for elements, allowing studies of system dynamics. These models are often referred to as executable models. To demonstrate the efficiency and utility of the tool, we have selected nine different case studies using models of three systems, namely, the T cell differentiation model (Miskov-Zivanov et al., 2013a), the T cell large granular lymphocyte model (Zhang et al., 2008), and the pancreatic cancer cell model (Telmer et al., 2021), and seven machine reading outputs with varying features.
We show that ACCORDION can automatically recommend new models that significantly reduce baseline model error and recapitulate known or desired system behavior. The contributions of the work presented here include:
(i) Recommendation of executable dynamic models of cell signaling that satisfy known or desired system properties.
(ii) Integration of information retrieval, graph-based methods, and dynamic system analysis.
(iii) “In-design” validation of dynamic models, i.e., during their creation (instead of typical “post-design” approach, i.e., after models are created).
(iv) Rapid exploration of redundancies and the discovery of alternative pathways of regulation.
(v) Execution of thousands of in silico experiments in at most a few hours, which would take days, or months, or would be impractical to conduct in vivo or in vitro.
(vi) Open access ACCORDION tool, that includes novel approaches and methods ((i)-(v) above), available on GitHub, with detailed documentation.
2 Methods
Here, we first describe inputs to ACCORDION, followed by the description of the novel methodology within ACCORDION for processing these inputs to generate the output. Input and output examples and the flow chart of the entire approach are provided in Figure 1.
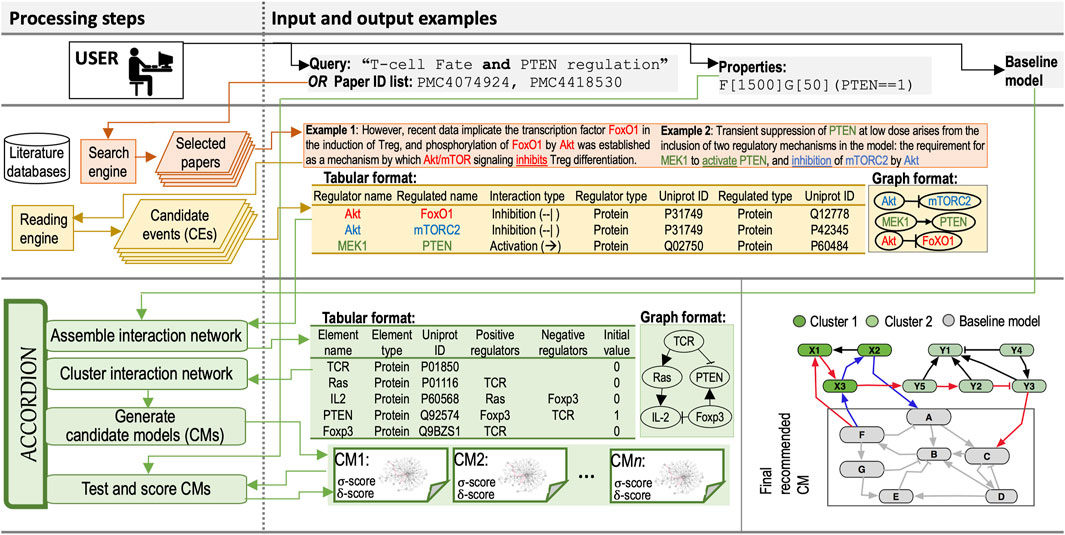
Figure 1. Processing steps column: The diagram of the flow and steps for information retrieval and processing, and model recommendation, including a user (Top), components of information retrieval from databases (Middle), and ACCORDION components (Bottom). Input and output examples column: (Top) Example query used to select relevant papers and example property in Bounded Linear Temporal Logic (BLTL) format. (Middle) Two example sentences with highlighted entities and events extracted by machine readers. Tabular outputs from REACH engine with Example 1 and Example 2 sentences as input. Graphical representation of REACH outputs. (Bottom) Tabular representation of several elements and their influence sets (positive and negative regulators) in BioRECIPE format (Sayed et al., 2018a; Holtzapple et al., 2023) and the graphical representation of elements and influence sets. A toy example graph (Gnew) consisting of a baseline model and connected extension clusters: gray nodes belong to the baseline model, light and dark green nodes belong to the CE set obtained from machine reading, blue edges highlight a return path within one cluster, and red edges show a return path connecting two clusters. The multi-cluster path starts at Baseline model, continues through Cluster 1, then through Cluster 2, and ends in Baseline model.
2.1 Network and model inputs
2.1.1 Baseline model
One of the inputs to ACCORDION is a baseline model, the starting initial or seed model that is to be extended, setting the context for other inputs and for the analysis. The baseline model can be created manually, with expert input, inferred automatically from data, or adopted from models published in literature (Zhang et al., 2008; Bianconi et al., 2012; Miskov-Zivanov et al., 2013a; Telmer et al., 2021) and in model databases (Aoki and Kanehisa, 2005; Pillich et al., 2017; Fabregat et al., 2018). To allow for studying dynamics, ACCORDION works with discrete models written in the BioRECIPE format (Sayed et al., 2018a; Holtzapple et al., 2023; Holtzapple et al., 2024), that have a directed graph structure,
We refer to the set of regulators of an element as its influence set, distinguishing between positive and negative regulators. ACCORDION assigns to each element
2.1.2 Candidate event set
Another input to ACCORDION is a set of candidate events (CEs), which can be represented as a set of directed edges
To create a CE set, we use machine reading engines such as REACH (Valenzuela-Escárcega et al., 2018) to read the published literature. These engines can output large event sets, and therefore, allow for a high throughput processing of available information. We use INDRA (Integrated Network and Dynamical Reasoning Assembler) (Gyori et al., 2017) software to access the machine reading engines. INDRA collects and scores new information extracted either from the textual evidence by machine readers or from structured pathway databases such as SIGNOR (Licata et al., 2020). To select the most valuable and high-quality statements, INDRA computes an overall belief score for each statement, defined as the joint probability of correctness implied by the evidence.
The set of relevant papers can be selected either using search tools such as Google or PubMed (Roberts, 2001) or by providing key search terms to reading engines, which then access the search tools to find most relevant papers. Examples of queries, sentences processed by machine readers, and events in the machine reading output are shown in Figure 1.
2.2 Influence network recommendation
2.2.1 Gnew creation and return path definition
From the baseline model graph
(i) both source node
(ii) either the source node or the target node is found in the baseline model:
(iii) neither the source node nor the target node is found in the baseline model:
Adding the entire set of CEs to the baseline model all at once usually does not result in a useful and accurate model due to a very large ratio
We define a path of k connected edges as
2.2.2 Gnew clustering
To find clusters in
MCL simulates random walks on an underlying interaction network (in our case, graph
The probability of a random walk of length
As discussed above, ACCORDION clusters the entire
2.2.3 Assembly of candidate influence networks
In this section, we explain the rationale behind adding a specific new node/edge without removing any node/edge from the baseline model. ACCORDION relies on having a baseline model which is a set of interactions that are well established and trusted and need to be expanded not replaced. Therefore, any contradictions with the baseline model interactions will be removed. Exploring contradictions is not in scope of this paper, as it is an extensive topic, which we have studied as part of our other work (Hansen et al., 2021; Hansen, 2022). On the other hand, all the different versions of models that ACCORDION outputs allow the user to explore different structures of the same model as if they have done several wet-lab experiments.
From the generated clusters and the baseline model, ACCORDION assembles multiple candidate models (CMs) as follows. ACCORDION can add clusters one at a time, or in groups. The more clusters or cluster groups are generated, the number of possible cluster combinations grows, and consequently, ACCORDION needs to assemble and test more models. In addition to that, in most cases
Adding a large number of new nodes and edges to the baseline model at once can significantly change the structure, and consequently, the behavior of the model. Therefore, the default approach in ACCORDION is to evaluate only individual clusters generated as described in previous sub-section, as well as merged clusters
As defined above, the clusters formed from the
2.3 Executable model recommendation
In Section 2.2, we discussed the steps to form
2.3.1 Revising element update rules
When adding new elements and influences to baseline models, ACCORDION uses the information provided in its inputs to update existing or create new element update rules. This information includes element update rules in the baseline model and the sign of influences (positive or negative) in the CE set. Whenever a new element
2.3.2 Model evaluation
The third input to ACCORDION includes a set of properties
To select the CM that allows for most closely reproducing the experimentally observed or desired behavior, and given the randomness in time and the order of events in modeled systems, ACCORDION uses a combination of stochastic simulation and statistical model checking.
The DiSH (discrete stochastic heterogeneous) simulator (Sayed et al., 2017; Andjelkovic and Miskov-Zivanov, 2021) is used to obtain element trajectories, i.e., a sequence of element state values in time, for the baseline model and the CMs. DiSH is a stochastic simulator that can simulate models at different levels of abstraction, information resolution, and uncertainty. This range of simulation schemes is especially valuable when working with diverse information sources and inputs, such as the ones used by ACCORDION. Each simulation run starts with a specified initial model state, where initial values are assigned to all model elements to represent a particular system state (e.g., naïve or not differentiated cell, healthy cell, cancer cell). The initial values for the baseline model elements (nodes in
ACCORDION runs a statistical model checker (Jha et al., 2009; Wang et al., 2016) to verify whether the CMs satisfy a set of desired system properties. The model checker reads properties written using Bounded Linear Temporal Logic (BLTL) (Jha et al., 2009; Tkachev and Abate, 2013). For the example above, this would be F[
2.3.3 Model scoring and recommendation
Generated CMs can be scored in different ways, depending on the goals of the study. Once all created CMs are evaluated on how well they satisfy each given property, ACCORDION can find models that satisfy a particular property
Definition 1. The goal property probability for a property
We note here that, due to randomness of biological systems,
Definition 2. For a given model
Definition 3. For a given model
Definition 4. For a given model
It can be concluded from Definition 4 that the larger the σ-score for a model is the closer the model is to satisfying all desired properties.
Definition 5. For a given model
The parameter
3 Results and discussion
3.1 Benchmarks
In the absence of standardized benchmarks to evaluate ACCORDION, we created nine case studies. These benchmarks are available at (ACCORDION Github, 2024; ACCORDION Jupyter Notebook, 2024). In the Supplement, we provide an overview of the biological background for all studied systems, the details of creating the baseline model, and the steps of selecting literature and creating CE set for each conducted case study. In Figures 2A, B, we list the main characteristics of these nine cases, with models of three biological systems and different sets of CEs for each system. The three models include control circuitry of naïve T cell differentiation (T cell) (Miskov-Zivanov et al., 2013a), T cell large granular lymphocyte (T-LGL) leukemia model (Zhang et al., 2008), and pancreatic cancer cell model (PCC) (Telmer et al., 2021). The studies vary in the size and graph features of baseline models (“BM creation” columns) and the CE sets (“CE set creation” columns), and are named Tcell CEFA, Tcell CESA, Tcell CESM, T-LGL QSm, T-LGL QMed, T-LGL QDet, PCC BMAu, PCC BMAp, and PCC BMPr (see Supplement for details). The size of baseline models varies from several tens to several hundreds of nodes or edges, and the number of interactions in the CE sets varies from half the number of interactions in the baseline model to six times larger (“BM and CE set relationship” columns, Figure 2A). In Figure 2C, we illustrate the overlap and differences between the CE sets in the T cell case studies, to highlight the variability across CE sets that can be obtained in the context of the same baseline model.
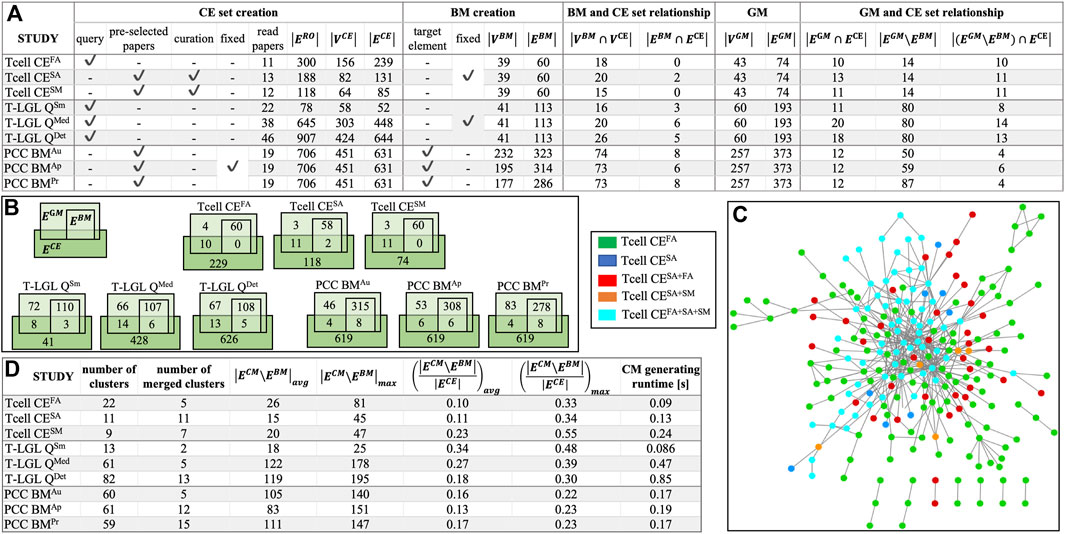
Figure 2. (A) Benchmark characterization: CE set creation procedure–using a query or a preselected set of papers, or manually curating the paper selection, and using a fixed or different CE set across all models for the same biological system;
We also list in Supplementary Table S1 the sets of properties that the real system satisfies, or should satisfy, which are not fully satisfied by baseline models and are used to guide new model assembly for each case study. The properties in Supplementary Table S1 are provided in both natural language descriptions and in machine readable BLTL format, together with their goal probability values (
With the nine case studies, we evaluate ACCORDION’s performance and demonstrate different use cases by: (i) varying the size and contents of the baseline model and the CE set (all nine case studies); (ii) varying the quality of the CE set (Tcell case studies); (iii) varying the level of detail in user selection of literature (Tcell CEFA study and all three T-LGL case studies); (iv) reconstruction of previously published model (all nine case studies).
We summarize in the table in Figure 2D the overall graph characteristics of the CMs obtained by ACCORDION for these nine benchmarks.
3.2 Recommending new models with desired behavior
The results listed in Figure 3 emphasize the importance of using ACCORDION when recommending a new or extended model. Figure 3 shows values for CMs in the case studies for several metrics,
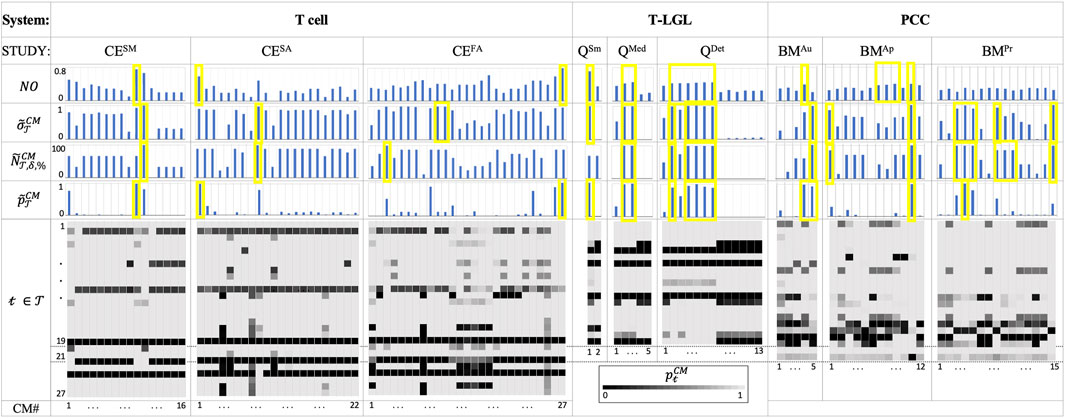
Figure 3. The Tcell, T-LGL and PCC use case results. For each CM (columns in heatmaps and bar charts):
In Figure 4A, we show the
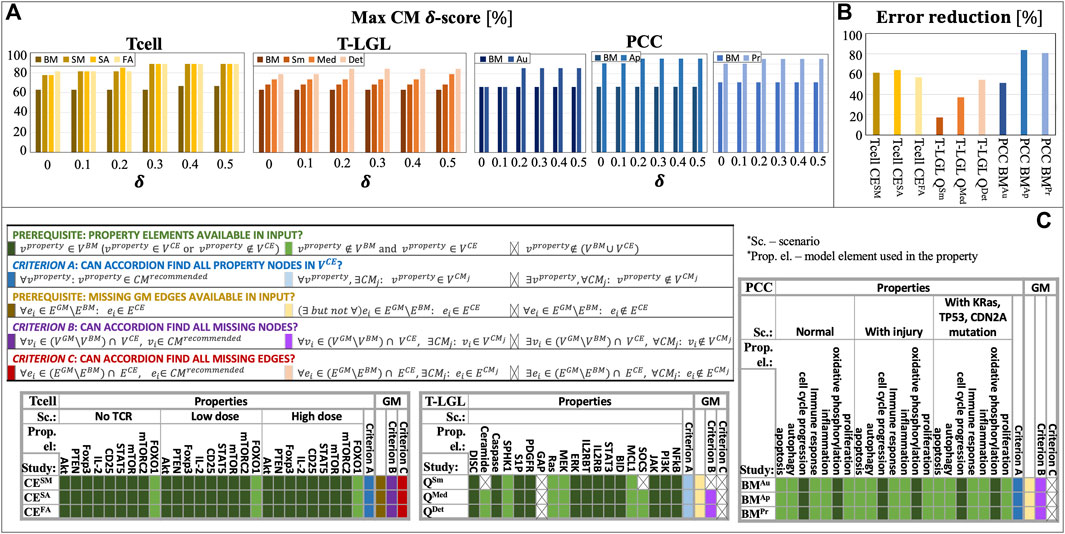
Figure 4. ACCORDION evaluation on nine case studies, Tcell studies SM, SA, FA, T-LGL studies Sm, Med, Det, and PCC studies Au, Ap, Pr: (A) maximum CM δ-score (
Several CE sets did not fulfill the necessary requirement for properties to be used: all elements that are listed in properties (Supplementary Table S1, Supplement) need to be present in at least one of the sets
While it is not reasonable to expect from ACCORDION to find an element that does not exist in its input, it should be able to recover property elements that are not present in
Finally, when ACCORDION recovers all necessary property elements, most often the reason for non-zero model property errors (
3.3 Finding the most relevant set of new interactions
To test the performance of ACCORDION under a range of different conditions, we created the use cases such that the relationship between the number of elements and interactions in baseline models (
Additionally, we created these nine case studies such that they have baseline models with varying level of network connectivity. The baseline model in the T cell studies (Case studies section, Supplement), is a previously published, thus functional, model, while the T-LGL and PCC baseline models were created by removing nodes and interactions from published models. Since by construction the clusters that ACCORDION generates are connected only to a part of the baseline model (Section 2.2), we used the node overlap metric
We investigated the percentage of these interactions selected from the entire CE set that were included in the top recommended CM (Figure 2D). For the Tcell cases, ACCORDION recommended on average 14% of the interactions as candidates for model extension, whereas for T-LGL and PCC cases, ACCORDION identified on average 26% and 15% of such interactions, respectively. These numbers emphasize an important characteristic of ACCORDION: while allowing for comprehensive overview of literature, it significantly reduces the number of selected interactions, such that, if human input is still necessary, the number of interactions to manually review is significantly smaller than the original CE set.
Interestingly, higher
3.4 Identifying alternative networks
As described in Section 3.1, besides baseline models, we also used golden models in our case studies. The purpose of comparison with golden models is to (i) determine how closely ACCORDION can reproduce previously published models (“criterion B”, purple, and “criterion C”, red, in Figure 4C) and (ii) what other models, different from golden models and satisfying the same set of properties, ACCORDION is able to create.
In all 3 T cell case studies, ACCORDION adds all the interactions from the
An important outcome from this exercise is that ACCORDION recommends new CMs, different from golden models, which have high σ-score and
3.5 Assistance in query answering
We also explored the relationship between the design of queries and ACCORDION’s effectiveness, that is, whether the selection of search terms to mine literature affects the usefulness of extensions selected by ACCORDION. For the Tcell CEFA case, we used a search query as an input to PubMed to identify the most relevant papers (Case studies section, Supplement). We investigated the influence of this query on the percentage of interaction in clusters used to create CMs with top scores. In Figure 2D, we show the average and the maximum percentage of selected interactions, i.e.,
For the T-LGL model study, we used three different queries (Case studies section, Supplement). The most elaborate query, in the T-LGL QDet case study, introduced more descriptive search terms, led to selecting more relevant papers, and consequently, extraction of relevant events and element regulators resulting in recommendation of a CM with high σ-score (0.76) and
3.6 Runtime and choice of inflation parameter
In Figure 2D, we list the time that ACCORDION takes to generate clusters when run on a 3.3 GHz Intel Core i5 processor. The time required by ACCORDION to generate clusters increases with larger CE sets. For the PCC case studies, the runtime is same across studies since the same CE set has been used. However, for the T cell and T-LGL case studies, the CE sets have different sizes, and thus, result in different runtime. The runtime of the overall extension algorithm is proportional to the number of properties that we need to test against. In other words, if we have
As we see above, the runtime is dependent on the number of clusters, which in turn is dependent on the cluster granularity and parameter values chosen for the MCL algorithm. The principal handle for changing cluster granularity is the inflation parameter
An increase in
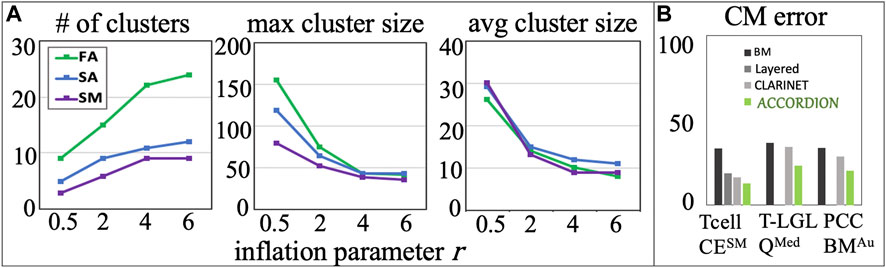
Figure 5. (A) Several cluster characteristics measured as functions of inflation parameter (r), for the Tcell CEFA, Tcell CESA, and Tcell CESM cases (r1 = 0.5, r2 = 2, r3 = 4, r4 = 6). (B) The comparison between BM error and the top model (with minimum CM error,
3.7 Comparison with other methods
We compare here the performance of ACCORDION with other model extension approaches. The method proposed in (Liang et al., 2017) iteratively expands a baseline model, by examining a large machine reading output in each iteration, and automatically selects a subset of interactions (influences) that can be directly connected with the baseline model. The work in (Liang et al., 2017) both expands the model network and tests the dynamics of the newly built model, by comparing it with a set of requirements or desired system states. The main drawback of the method in (Liang et al., 2017) is that it becomes impractical for large models due to adding new interactions in layers, based on their proximity to the existing model. On the other hand, the method proposed in (Sayed et al., 2018b) uses a genetic algorithm to select a set of extensions from machine reading output to create a new model with desired behavior. The two main disadvantages of this approach are issues with scalability and the non-determinism, as the solution may vary across multiple algorithm executions on the same inputs.
In (Ahmed and Miskov-Zivanov, 2021; Ahmed et al., 2021b), the authors proposed a tool and several metrics that rely on interaction occurrences and co-occurrences in published literature, and account for the connectivity of the newly added interactions to the existing models. While it selects new high-confidence interactions that are well supported by published literature and connected to the baseline model, this tool focuses on the static model network and does not consider its dynamic behavior.
We compared ACCORDION’s performance in terms of average model error of the top recommended model
4 Conclusion
In this paper, we have described a novel methodology and a tool, ACCORDION, that can be used to automatically assemble the information extracted from literature into models and to then evaluate multiple candidate models to recommend those that achieve the desired dynamic behavior. Our proposed approach combines machine reading with clustering, simulation, and model checking into an automated framework for rapid model assembly and testing to address biological questions. This unique approach of combining information retrieval with graph-based methods and dynamic system analysis is the first of its kind in the systems biology field and enables the rapid development of models of any system. Furthermore, by automatically extending models with the information published in literature, our methodology allows for efficient collection of the existing information in a consistent and comprehensive way, while also facilitating information reuse and data reproducibility, and often helping replace tedious trial-and-error manual experimentation, thereby increasing the pace of knowledge advancement. The ACCORDION tool reuses knowledge from multiple literature sources and enhances data reproducibility evaluating the knowledge in dynamic models. When compared to the existing tools, ACCORDION also takes into account the dynamic behavior of the studied system which allows it to outperform them. The results we presented here demonstrate different research scenarios where ACCORDION can be used. The benchmark set presented here and the ACCORDION tool are available in a GitHub repository (ACCORDION Github, 2024) and the documentation is available in ReadtheDocs (ACCORDION ReadtheDocs 2024). As our next steps, we are planning to work on parallelizing the tool implementation to improve the runtime when testing large number of properties. Another important component of our future work are modules to infer update rules automatically and testing more complicated properties that capture dynamic behaviors of multiple elements over varying time sequences. As ACCORDION is the first framework that connects multiple steps in an automated pipeline to extend executable network models, we anticipate further improvements in the form of new versions of the software.
Data availability statement
The datasets presented in this study can be found in online repositories. The names of the repository/repositories and accession number(s) can be found below: https://github.com/pitt-miskov-zivanov-lab/ACCORDION/tree/main.
Author contributions
YA: Conceptualization, Data curation, Formal Analysis, Investigation, Methodology, Software, Validation, Writing–original draft, Writing–review and editing. CT: Conceptualization, Data curation, Methodology, Writing–review and editing. GZ: Software, Validation, Writing–review and editing. NM-Z: Conceptualization, Funding acquisition, Investigation, Methodology, Project administration, Resources, Supervision, Visualization, Writing–original draft, Writing–review and editing.
Funding
The author(s) declare that financial support was received for the research, authorship, and/or publication of this article. This work was supported in part by DARPA grant W911NF-17-1-0135 awarded to NM-Z.
Acknowledgments
We would like to thank Kara Bocan, Khaled Sayed and Adam Butchy, members of MeLoDy Lab at the University of Pittsburgh, for useful discussions in early stages of the project.
Conflict of interest
The authors declare that the research was conducted in the absence of any commercial or financial relationships that could be construed as a potential conflict of interest.
Publisher’s note
All claims expressed in this article are solely those of the authors and do not necessarily represent those of their affiliated organizations, or those of the publisher, the editors and the reviewers. Any product that may be evaluated in this article, or claim that may be made by its manufacturer, is not guaranteed or endorsed by the publisher.
Supplementary material
The Supplementary Material for this article can be found online at: https://www.frontiersin.org/articles/10.3389/fsysb.2024.1308292/full#supplementary-material
References
ACCORDION Github (2024). ACCORDION Github. Available at: https://github.com/pitt-miskov-zivanov-lab/ACCORDION/tree/main (Accessed January 31, 2024).
ACCORDION Jupyter Notebook (2024). ACCORDION jupyter notebook. Available at: https://mybinder.org/v2/gh/pitt-miskov-zivanov-lab/ACCORDION/HEAD?labpath=%2Fexamples%2Fuse_ACCORDION.ipynb (Accessed January 31, 2024).
ACCORDION ReadtheDocs (2024). ACCORDION ReadtheDocs. Available at: https://melody-accordion.readthedocs.io/en/latest/.
Ahmed, Y., Butchy, A. A., Sayed, K., Telmer, C., and Miskov-Zivanov, N. (2021a). New advances in the automation of context-aware information selection and guided model assembly. arXiv preprint, Available at: https://doi.org/10.48550/arXiv.2110.10841.
Ahmed, Y., and Miskov-Zivanov, N. (2021). “Guided assembly of cellular network models from knowledge in literature,” in 2021 43rd Annual International Conference of the IEEE Engineering in Medicine and Biology Society (EMBC), Mexico, 01-05 November 2021, 4458–4464.
Ahmed, Y., Telmer, C. A., and Miskov-Zivanov, N. (2021b). CLARINET: efficient learning of dynamic network models from literature. Bioinforma. Adv. 1 (1), vbab006. doi:10.1093/bioadv/vbab006
Andjelkovic, S., and Miskov-Zivanov, N. (2021). “Dish-trend: intervention modeling simulator that accounts for trend influences,” in 2021 Winter Simulation Conference (WSC), Phoenix, AZ, USA, 12-15 December 2021.
Aoki, K. F., and Kanehisa, M. (2005). Using the KEGG database resource. Curr. Protoc. Bioinforma. 11 (1), 12–54. doi:10.1002/0471250953.bi0112s11
Bader, G., and Hogue, C. (2003). An automated method for finding molecular complexes in large protein interaction networks. Bmc Bioinforma. 4, 2. doi:10.1186/1471-2105-4-2
Bianconi, F., Baldelli, E., Ludovini, V., Crino, L., Flacco, A., and Valigi, P. (2012). Computational model of EGFR and IGF1R pathways in lung cancer: a Systems Biology approach for Translational Oncology. Biotechnol. Adv. 30 (1), 142–153. doi:10.1016/j.biotechadv.2011.05.010
Blatt, M., Wiseman, S., and Domany, E. (1996). Superparamagnetic clustering of data. Phys. Rev. Lett. 76 (18), 3251–3254. doi:10.1103/PhysRevLett.76.3251
Brohée, S., and van Helden, J. (2006). Evaluation of clustering algorithms for protein-protein interaction networks. Bmc Bioinforma. 7, 488. doi:10.1186/1471-2105-7-488
Enright, A. J., Van Dongen, S., and Ouzounis, C. A. (2002). An efficient algorithm for large-scale detection of protein families. Nucleic Acids Res. 30 (7), 1575–1584. doi:10.1093/nar/30.7.1575
Fabregat, A., Jupe, S., Matthews, L., Sidiropoulos, K., Gillespie, M., Garapati, P., et al. (2018). The reactome pathway knowledgebase. Nucleic Acids Res. 46 (D1), D649–D655. doi:10.1093/nar/gkx1132
Fisher, J., and Henzinger, T. (2007). Executable cell biology. Nat. Biotechnol. 25 (11), 1239–1249. doi:10.1038/nbt1356
Frey, B., and Dueck, D. (2007). Clustering by passing messages between data points. Science 315 (5814), 972–976. doi:10.1126/science.1136800
Gagniuc, P. A. (2017). Markov chains: from theory to implementation and experimentation. John Wiley and Sons.
Gu, L., Han, Y., Wang, C., Chen, W., Jiao, J., and Yuan, X. (2019). Module overlapping structure detection in PPI using an improved link similarity-based Markov clustering algorithm. Neural Comput. Appl. 31 (5), 1481–1490. doi:10.1007/s00521-018-3508-z
Gyori, B., Bachman, J., Subramanian, K., Muhlich, J., Galescu, L., and Sorger, P. (2017). From word models to executable models of signaling networks using automated assembly. Mol. Syst. Biol. 13 (11), 954. doi:10.15252/msb.20177651
Hansen, C., Kisslinger, J., Krishna, N., Holtzapple, E., Ahmed, Y., and Miskov-Zivanov, N. (2021). Classifying literature extracted events for automated model extension. bioRxiv, Available at: https://doi.org/10.1101/2021.09.30.462421.
Hansen, C. E. (2022). Classification and representation of biological interactions in the context of a baseline model. Pittsburgh: University of Pittsburgh.
Hawse, W. F., Sheehan, R. P., Miskov-Zivanov, N., Menk, A. V., Kane, L. P., Faeder, J. R., et al. (2015). Cutting edge: differential regulation of PTEN by TCR, Akt, and FoxO1 controls CD4+ T cell fate Decisions. J. Immunol. 194 (10), 4615–4619. doi:10.4049/jimmunol.1402554
Holtzapple, E., Luo, H., Tang, D., Zhou, G., Arazkhani, N., Hansen, C., et al. (2024). The BioRECIPE knowledge representation format. biorxiv. Available at: https://doi.org/10.1101/2024.02.12.579694.
Holtzapple, E., Telmer, C. A., and Miskov-Zivanov, N. (2020). FLUTE: fast and reliable knowledge retrieval from biomedical literature. Database 2020, baaa056. doi:10.1093/database/baaa056
Holtzapple, E., Zhou, G., Telmer, C. A., Hansen, C., Tang, D., Luo, H., et al. (2023). The BioRECIPE representation format.
Jha, S. K., Clarke, E. M., Langmead, C. J., Legay, A., Platzer, A., Zuliani, P., et al. (2009). “A bayesian approach to model checking biological systems,” in Computational Methods in Systems Biology: 7th International Conference, CMSB, Bologna, Italy, August 31–September 1, 2009 (Berlin Heidelberg: Springer), 218–234. doi:10.1007/978-3-642-03845-7_15
King, A., Przulj, N., and Jurisica, I. (2004). Protein complex prediction via cost-based clustering. Bioinformatics 20 (17), 3013–3020. doi:10.1093/bioinformatics/bth351
Lecca, P. (2021). Machine learning for causal inference in biological networks: perspectives of this challenge. Front. Bioinforma. 1, 746712. doi:10.3389/fbinf.2021.746712
Lei, X., Wang, F., Wu, F., Zhang, A., and Pedrycz, W. (2016). Protein complex identification through Markov clustering with firefly algorithm on dynamic protein-protein interaction networks. Inf. Sci. 329, 303–316. doi:10.1016/j.ins.2015.09.028
Liang, K.-W., Wang, Q., Telmer, C., Ravichandran, D., Spirtes, P., Miskov-Zivanov, N., et al. (2017). Methods to expand cell signaling models using automated reading and model checking. Comput. Methods Syst. Biol. 10545, 145–159. doi:10.1007/978-3-319-67471-1_9
Licata, L., Lo Surdo, P., Iannuccelli, M., Palma, A., Micarelli, E., Perfetto, L., et al. (2020). SIGNOR 2.0, the SIGnaling network open resource 2.0: 2019 update. Nucleic Acids Res. 48 (D1), D504–D510. doi:10.1093/nar/gkz949
Miskov-Zivanov, N., Turner, M., Kane, L., Morel, P., and Faeder, J. (2013a). The duration of T cell stimulation is a critical determinant of cell fate and plasticity. Sci. Signal. 6 (300), ra97. doi:10.1126/scisignal.2004217
Miskov-Zivanov, N., Zuliani, P., Clarke, E. M., and Faeder, J. R. (2013b). “Studies of biological networks with statistical model checking: application to immune system cells,” in Proceedings of the International Conference on Bioinformatics, Computational Biology and Biomedical Informatics, Wshington DC, USA, September 22 - 25, 2013.
Miskov-Zivanov, N., Zuliani, P., Wang, Q., Clarke, E. M., and Faeder, J. R. (2016). “High-level modeling and verification of cellular signaling,” in IEEE International High Level Design Validation and Test Workshop (HLDVT), Santa Cruz, CA, USA, 07-08 October 2016, 162–169.
Mountasser, I., Ouhbi, B., and Frikh, B. (2017). “Parallel Markov-based clustering strategy for large-scale ontology partitioning,” in Proceedings of the 9th International Joint Conference on Knowledge Discovery, Knowledge Engineering and Knowledge Management. KEOD, 195–202.
Pillich, R. T., Chen, J., Rynkov, V., Welker, D., Pratt, D., Wu, C., et al. (2017). NDEx: a community resource for sharing and publishing of biological networks. Methods Mol. Biol. 1558, 271–301. doi:10.1007/978-1-4939-6783-4_13
Roberts, R. (2001). PubMed central: the GenBank of the published literature. Proc. Natl. Acad. Sci. U. S. A. 98 (2), 381–382. doi:10.1073/pnas.98.2.381
Sayed, K., Bocan, K. N., and Miskov-Zivanov, N. (2018b). “Automated extension of cell signaling models with genetic algorithm,” in 2018 40th Annual International Conference of the IEEE Engineering in Medicine and Biology Society (EMBC), Honolulu, HI, USA, 18-21 July 2018, 5030–5033.
Sayed, K., Telmer, C. A., Butchy, A. A., and Miskov-Zivanov, N. (2018a). “Recipes for translating big data machine reading to executable cellular signaling models,” in Machine learning, optimization, and big data. MOD 2017. Lecture notes in computer science (Cham: Springer).
Sayed, K., Yu-Hsin, K., Anuva, K., and Natasa, M.-Z. (2017). “DiSH simulator: capturing dynamics of cellular signaling with heterogeneous knowledge,” in 2017 Winter Simulation Conference (WSC),, Las Vegas, NV, USA, 03-06 December 2017.
Telmer, C. A., Sayed, K., Butchy, A. A., Bocan, K., Kaltenmeier, C., Lotze, M., et al. (2021). Computational modeling of cell signaling and mutations in pancreatic cancer. bioRxiv preprint, Available at: https://doi.org/10.1101/2021.06.08.447557.
Tkachev, I., and Abate, A. (2013). “Formula-free finite abstractions for linear temporal verification of stochastic hybrid systems,” in Proceedings of the 16th international conference on Hybrid systems: computation and control, Pennsylvania, Philadelphia, USA, April 8 - 11, 2013, 283–292.
Valenzuela-Escárcega, M., Babur, Ö., Hahn-Powell, G., Bell, D., Hicks, T., Noriega-Atala, E., et al. (2018). Large-scale automated machine reading discovers new cancer-driving mechanisms. Database (Oxford) 2018, bay098. doi:10.1093/database/bay098
Valenzuela-Escárcega, M. A., Hahn-Powell, G., Surdeanu, M., and Hicks, T. (2015). “A domain-independent rule-based framework for event extraction,” in Proceedings of ACL-IJCNLP 2015 system demonstrations, Beijing, China, 127–132.
von Mering, C., Jensen, L., Snel, B., Hooper, S., Krupp, M., Foglierini, M., et al. (2005). STRING: known and predicted protein-protein associations, integrated and transferred across organisms. Nucleic Acids Res. 33, D433–D437. doi:10.1093/nar/gki005
Wang, Q., Natasa, M.-Z., Bing, L., Faeder, R. J., Michael, L., and Clarke, M. E. (2016). “Formal modeling and analysis of pancreatic cancer microenvironment,” in International conference on computational methods in systems biology (Cham: Springer International Publishing).
Keywords: graphs and networks, model recommendation, clustering, model checking, natural language processing, signaling pathways, data mining
Citation: Ahmed Y, Telmer CA, Zhou G and Miskov-Zivanov N (2024) Context-aware knowledge selection and reliable model recommendation with ACCORDION. Front. Syst. Biol. 4:1308292. doi: 10.3389/fsysb.2024.1308292
Received: 06 October 2023; Accepted: 13 March 2024;
Published: 18 April 2024.
Edited by:
Edoardo Saccenti, Wageningen University and Research, NetherlandsReviewed by:
Marco Anteghini, Wageningen University and Research, NetherlandsLucian Galescu, Independent Researcher, Bridgewater, NJ, United States
Michael Blinov, UCONN Health, United States
Copyright © 2024 Ahmed, Telmer, Zhou and Miskov-Zivanov. This is an open-access article distributed under the terms of the Creative Commons Attribution License (CC BY). The use, distribution or reproduction in other forums is permitted, provided the original author(s) and the copyright owner(s) are credited and that the original publication in this journal is cited, in accordance with accepted academic practice. No use, distribution or reproduction is permitted which does not comply with these terms.
*Correspondence: Natasa Miskov-Zivanov, bm16aXZhbm92QHBpdHQuZWR1