 Alexis Saldivar
 Patricia Ruiz-Ruiz
 Sergio Revah
 Cristal Zuñiga
- 1Departamento de Procesos y Tecnología, Universidad Autónoma Metropolitana-Cuajimalpa, Ciudad de Mexico, DF, Mexico
- 2Department of Biology, San Diego State University, San Diego, CA, United States
Members of the genus Methylacidiphilum are thermoacidophile methanotrophs with optimal growth temperatures between 50°C and 60°C, and pH between 1.0 and 3.0. These microorganisms, as well as other extremophile bacteria, offer an attractive platform for environmental and industrial biotechnology because of their robust operating conditions and capacity to grow using low-cost substrates. In this study, we isolated Methylacidiphilum fumariolicum str. Pic from a crater lake located in the state of Chiapas, Mexico. We sequenced the genome and built a genome-scale metabolic model. The manually curated model contains 667 metabolites, 729 reactions, and 473 genes. Predicted flux distributions using flux balance analysis identified changes in redox trade-offs under methanotrophic and autotrophic conditions (H2+CO2). This was also predicted under heterotrophic conditions (acetone, isopropanol, and propane). Model validation was performed by testing the capacity of the strains to grow using four substrates: CH4, acetone, isopropanol, and LP-Gas. The results suggest that the metabolism of M. fumariolicum str. Pic is limited by the regeneration of redox equivalents such as NAD(P)H and reduced cytochromes.
1 Introduction
Extremophile bacteria such as Methylacidiphilum fumariolicum are an attractive platform for industrial and environmental biotechnology. Their broad growth capabilities offer an opportunity to reduce manufacturing costs through processes without sterilization or using low-cost substrates (Ye et al., 2023). Between 2007 and 2008, a new clade of methanotrophic bacteria in the Phylum Verrucomicrobia was isolated from geothermal or volcanic environments (Dunfield et al., 2007; Pol et al., 2007; Islam et al., 2008). These strains currently belong to the genus Methylacidiphilum and are aerobic thermoacidophilic methanotrophs with optimal growth temperatures between 50°C and 60°C and an optimal pH between 2.0 and 3.0 (Schmitz et al., 2021). To date, three species have been identified (Hou et al., 2008; Anvar et al., 2014; Kruse et al., 2019) and three unclassified strains have been isolated (Erikstad et al., 2019; Awala et al., 2021). In addition, five complete genomes and 14 draft assemblies are available in the NCBI genome database (Hou et al., 2008; Anvar et al., 2014; Erikstad et al., 2019; Kruse et al., 2019; Awala et al., 2021).
Because of the recent discovery of the Verrucomicrobia methanotrophic clade, there is limited knowledge about their broad metabolic capabilities and their further biotechnological applications. For example, the M. fumariolicum str. SolV has been proven to grow heterotrophically on C2 and C3 compounds such as ethane, and propane (Picone et al., 2020), as well as autotrophically, using H2 as an electron source and CO2 as the only carbon source (Mohammadi et al., 2017). The pathway for the oxidation of propane, isopropanol, and acetone was also elucidated in a recently isolated Methylacidiphilum sp. IT6 (Awala et al., 2021). Moreover, it has been shown that the strain SolV can convert methanethiol (Schmitz et al., 2022) to H2S, and oxidize H2S to elemental sulfur (Schmitz et al., 2023). Their metabolic capabilities and resilience to harsh conditions make these bacteria excellent candidates for use in biofilters that treat H2S-contaminated gaseous streams or as biomining agents recovering Rare Earth Elements (REEs) from low-grade sources (Singer et al., 2023). Additionally, Verrucomicrobia methanotrophs can be a source of novel thermostable enzymes for the chemical and pharmaceutical industries (Gevaert et al., 2019; Schmitz et al., 2020). For example, heterologous expression of PmoD from Methylacidiphilum sp. IT6 enabled the construction of a whole-cell biocatalyst in the Type I methanotroph Methylomonas sp. DH1 used for the production of acetol from acetone (Chau et al., 2022). We expect that the range of biotechnological applications of Verrucomicrobia methanotrophs will further diversify as more strains are isolated from different environments.
Genome-scale metabolic models (M-models) can be used as a knowledge base to concentrate the available biochemical, genomic, metabolic, and physiological information of a target microorganisms (Thiele and Palsson, 2010; Monk et al., 2017). The genome functions are translated into a set of metabolic reactions encoded in a mathematical representation as a set of linear equations and constraints (Orth et al., 2010). The relationship between genotype and phenotype can be investigated from the solutions of M-models using Flux Balance Analysis (FBA) (Feist et al., 2007). Moreover, M-models enable the integration of multi-omic datasets into a single comprehensive analysis workflow (Noor et al., 2019; Arnolds et al., 2021; Passi et al., 2022). In methanotrophs, M-models have been used to study the mechanisms of electron transfer to the periplasmic methane monooxygenase (PMMO) (Lieven et al., 2018), one-carbon metabolism (Nguyen A. D. et al., 2020), metabolic adaptations to high salinity conditions (Bordel et al., 2020b), nitrate-dependent methane oxidation (Versantvoort et al., 2019), etc.
In this study, we isolated and sequenced the genome of Methylacidiphilum fumariolicum str. Pic. Then, we collected experimental growth phenotypes using four substrates and used this information to validate our reconstructed M-model. The model, also referred to as iAS473, was manually curated to comply with the most recent community standards (Laibe and Le Novère, 2007; Waltemath et al., 2011; Carey et al., 2020). This knowledgebase compiles with the latest bibliomic findings of the genus Methylacidiphilum, specifically the metabolism of M. fumariolicum. To our knowledge, this is the first manually curated genome-scale metabolic reconstruction for any methanotrophic Verrucomicrobia.
2 Results
2.1 Isolation and genome characterization
Taxonomic analysis of the raw sequencing data indicated that 96% of the sequences were classified as Methylacidiphilum (Supplementary Figure S1). Based on this result, a two-step assembly process was used to improve the contiguity of the recovered genome (see Methods Section 4.9). The final genome assembly had a total length of 2.4 Mb and an average GC composition of 41.31%, which are comparable to those of other genomes reported for this species by clade (Supplementary Table S2). It contains a full set of ribosomal and transfer RNA genes (3 and 47, respectively), and 469 of 471 BUSCO gene markers for Verrucomicrobia bacteria (Simão et al., 2015), including 2 fragmented and zero duplicated genes. Other assembly statistics are listed in Supplementary Table S2.
The Average Nucleotide Identity (gANI) values (Varghese et al., 2015) were calculated from orthologous gene clusters identified between this assembly and 11 genomes available for the Methylacidiphilum genus (see Methods Section 4.10). The genome assembly of our isolate had a gANI above 97% with all M. fumariolicum genomes, which exceeded the suggested cut-off of 96% for species affiliation (Sant’Anna et al., 2019). Therefore, subsequent phylogenomic analyses were conducted using five available genome assemblies for M. fumariolicum. The phylogenetic tree, reconstructed from the 117 top-ranking phylogenetic markers (see Methods Section 4.10), indicates that the assembly reported in this study clusters together with strain SolV in the same branch (Figure 1A). Together, the gANI values and phylogenomic analysis indicate that the recovered genome represents a novel strain of the M. fumariolicum species, for which the name Methylacidiphilum fumariolicum strain Pic is proposed, where Pic stands for the name of the municipality in which the volcanic lake is located (Pichucalco).
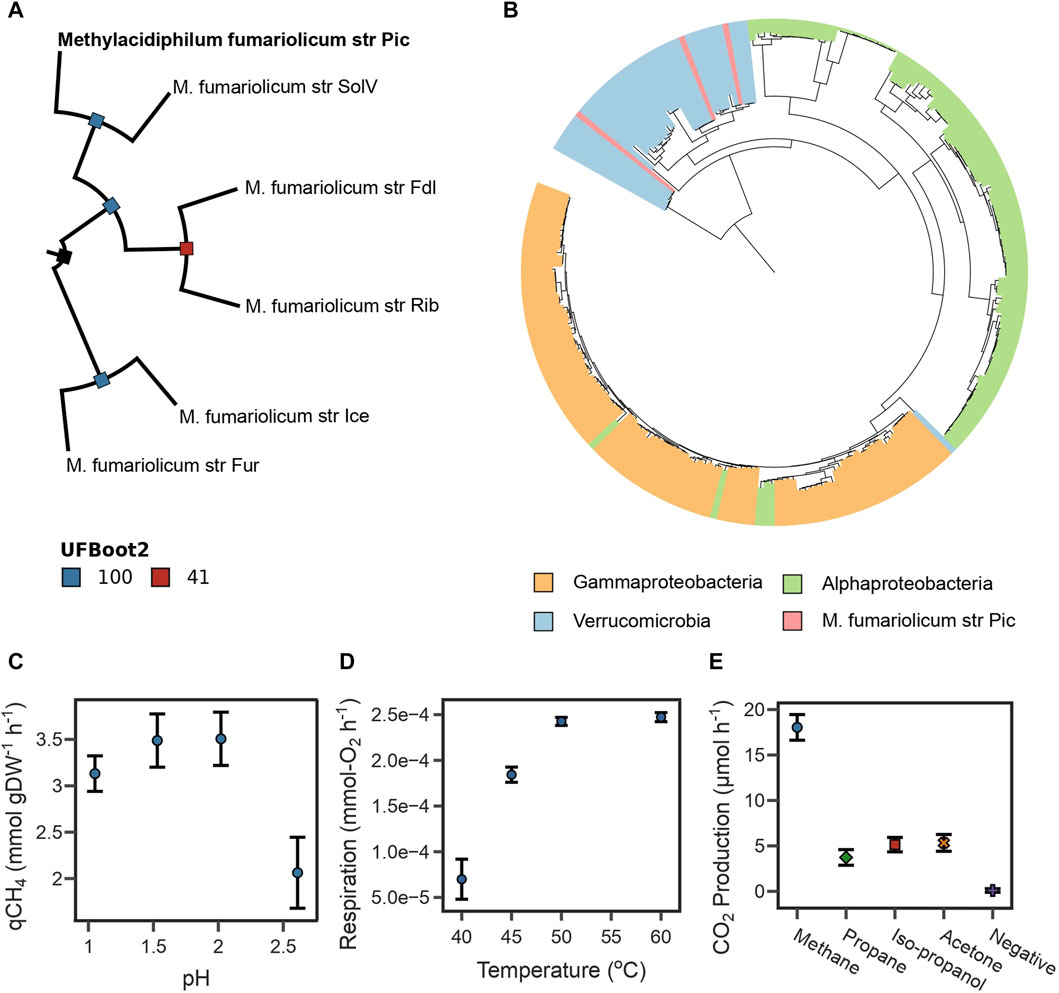
FIGURE 1. (A) Maximum likelihood phylogenetic tree reconstructed from the top 117 phylogenetic markers identified for Methylacidiphilum species. Bootstrap values were estimated using 25,000 replicates. The tree is rooted at midpoint. (B) Maximum likelihood phylogenetic tree for periplasmic methane monooxygenase subunit A. The sequence of strain Pic clusters with sequences of other Verrucomicrobia methanotrophs. (C) The highest specific CH4 oxidation rate from strain Pic was determined between pH 1.5 and 2.0. (D) The highest O2 respiration rate from strain Pic was determined between 50°C and 60°C. (E) CO2 production rates from strain Pic growing in four different substrates. Results show that strain Pic oxidizes C3 substrates isopropanol and acetone.
Furthermore, the taxonomic affiliation was predicted from the periplasmic methane monooxygenase subunit A (PmoA), which is often used as a molecular marker of methanotrophic microorganisms (Knief, 2015; Hogendoorn et al., 2021). Our genome assembly contained three complete pmoCAB operons (Supplementary Table S5). A maximum-likelihood phylogenetic tree was constructed using PmoA sequences spanning the three phyla known to have methanotrophs (Verrucomicrobia, Gammaproteobacteria, and Alphaproteobacteria). The tree indicates that all PmoA sequences from the assembly reported in this study clustered with other Verrucomicrobia methanotrophs (Figure 1B). Interestingly, most Verrucomicrobia methanotrophs encode more than one copy of the pmoCAB operon (Schmitz et al., 2021); therefore, phylogenetic analyses of a single subunit such as PmoA are inadequate for determining species-level taxonomic affiliations (Supplementary Figure S2).
2.2 Physiological characterization under methanotrophic and heterotrophic conditions
A key physiological characteristic of M. fumariolicum str. Pic is its capability to achieve high growth rates at temperatures above 50°C. Here we used the oxygen consumption rate as a response variable linked to biomass growth using a respirometry chamber. We found that the optimal growth temperatures of strain Pic were between 50°C and 60°C (Figure 1D).
We also assayed the optimal growth pH by measuring specific CH4 oxidation rates in experiments ranging from 1.0 to 3.0 at 50°C. As shown in Figure 1C, oxidation rates were higher between pH 1.5 and 2.0, sharply decrease after pH 2.5, and become undetectable at pH 3.0. The pH range in which strain Pic oxidizes CH4 is narrow in comparison to other M. fumariolicum strains, which can grow at pH as high as 6.0 (Pol et al., 2007). Growth rates and yields (Table 1) were determined at 50°C and pH 2.0. The CH4:O2 ratio was typical for Methylacidiphilum strains (1:1.6); however, the CH4:CO2 ratio of 1:0.93 was much higher than that expected for these methanotrophs (1:0.65) (Pol et al., 2007).
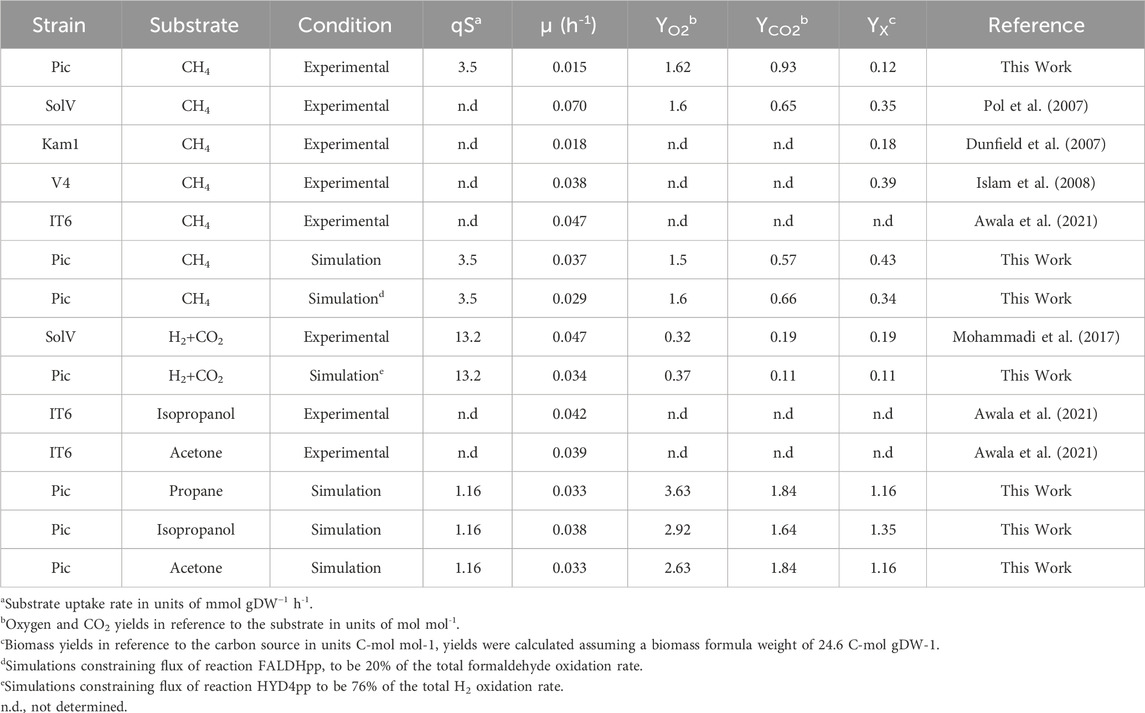
TABLE 1. Comparison of growth characteristics between Methylacidiphilum strains and model iAS473 simulations.
Three pmoCAB operons (Supplementary Table S4) were identified in the Pic genome. Interestingly, the strains SolV and IT6 also have three pmoCAB operons and they have been proven to oxidize C3 substrates (e.g., IT6 can grow on isopropanol, acetone, and acetol as carbon source) (Picone et al., 2020; Awala et al., 2021). The high sequence homology between the pmoA3 of strain IT6 and strain Pic (Supplementary Table S4) provided computational evidence that strain Pic could potentially grow on C3 compounds using operon pmoCAB3 (Supplementary Figure S2). Therefore, the capacity of strain Pic to oxidize C3 compounds was evaluated by independent incubations with 50 mM acetone, 50 mM isopropanol, and 10% LP-Gas (∼90% propane and ∼10% of a mix of propylene, butylene, isobutane, and n-butane). Figure 1E shows that the CO2 production rates of cultures with the three substrates were higher than the negative control, but lower than cultures incubated with 10% CH4.
2.3 Genome-scale metabolic network reconstruction
2.3.1 Metabolic network properties
The genome-scale metabolic reconstruction of M. fumariolicum str. Pic was generated using a semi-automatic methodology (see Methods Section 4.12.1). The initial draft reconstruction contained 603 genes, 1,604 reactions, and 1,555 metabolites. Out of all reactions, 492 (31.2%) had no gene association. The missing genes for these reactions were filled by manual queries (Camacho et al., 2009) against protein sequences in the KEGG pathway map for M. infernorum (Hou et al., 2008) or MetaCyc database (Caspi et al., 2014). Using this method, gene associations for 79 reactions were identified, while the remaining 415 reactions were removed from the model, along with 390 metabolites associated with those reactions. Furthermore, 37 stoichiometric duplicate reactions were removed, and 43 reactions that represented sub-reactions or reaction mechanisms were replaced by a lumped reaction. Of the remaining metabolites and reactions, 618 and 581 could not be annotated across databases and were removed from the model. Next, to allow the production of all biomass precursor metabolites, 101 reactions were manually gap-filled and an additional 43 were added to complete hydroxylamine oxidation metabolism, C3 substrates oxidation, autotrophic metabolism, and acid resistance mechanisms. Subsequently, reaction identifiers were translated into BiGG namespace (King et al., 2016), and 96 new reaction identifiers, associated with 79 genes, were created for non-existent reactions in this database (Supplementary Table S7).
The final reconstruction comprised 667 metabolites, 729 reactions, and 473 genes (Figure 2A). Out of the total number of reactions 162 did not have a gene association. The reconstruction was named iAS473 following community standards. Standardized quality analysis with MEMOTE (Lieven et al., 2020) indicated that the model is stoichiometrically consistent, and without erroneous generation of energy metabolites (Gevorgyan et al., 2008; Lieven et al., 2020). Moreover, an annotation consistency score of 92% indicated that the model is of high quality. A detailed description of MEMOTE results may be found in the GitHub repository (see Data Availability Statement). The Model is available in SBML Level 3 version 1, with the FBC package enabled (Hucka et al., 2003; Olivier and Bergmann, 2018).
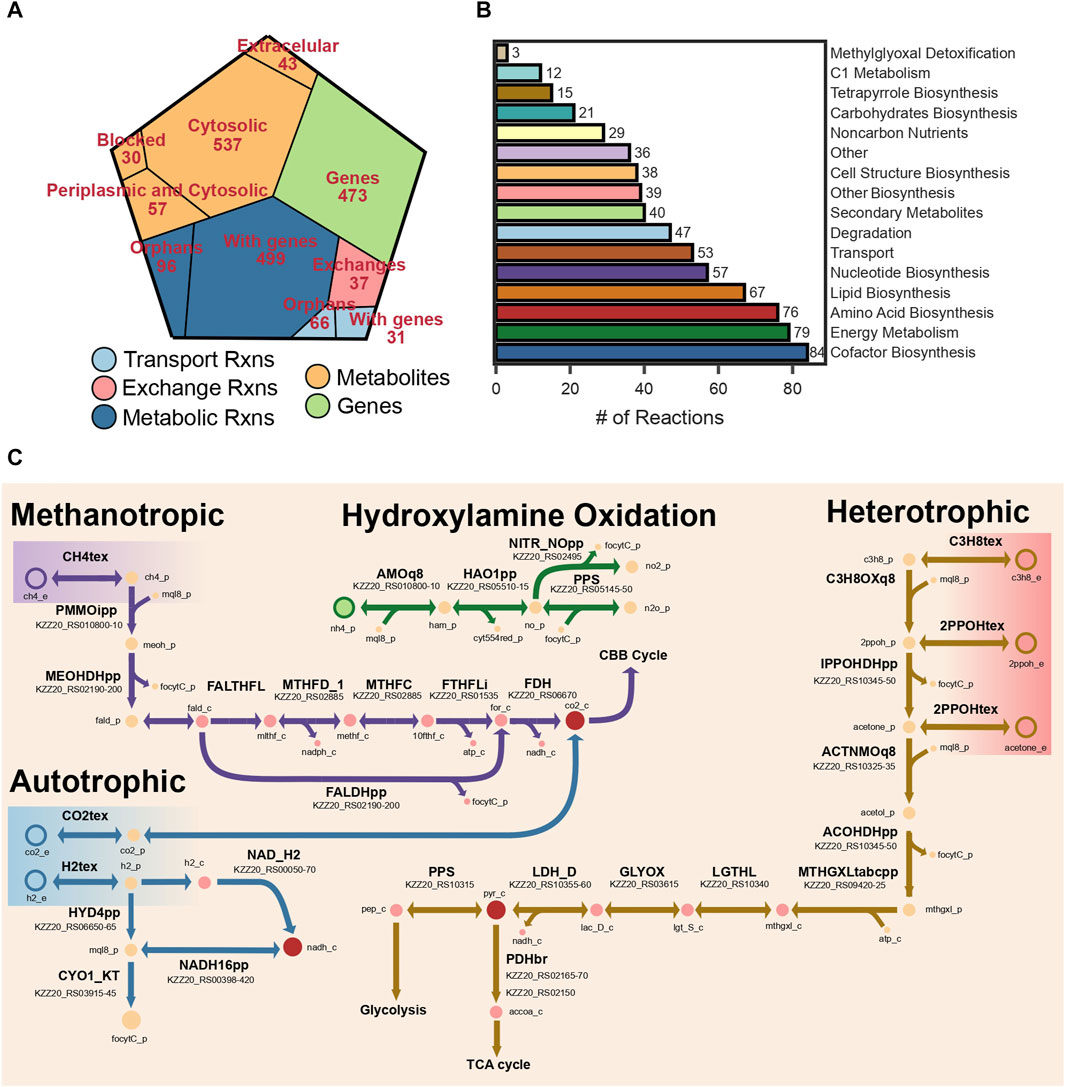
FIGURE 2. (A) Voronoi tree map showing the distribution of reactions, metabolites, and genes. (B) Bar plot showing the number of reactions grouped by pathway. (C) Metabolic map of the different metabolic modules represented in the model.
2.3.2 Manual curation and biomass constraints
2.3.2.1 Electron transport chain
The electron transport chain (ETC.) and energy conservation mechanisms are active in bacteria using quinones. These molecules are lipophilic compounds of the cytoplasmic membrane. Bacteria contain up to three types of quinones: ubiquinones, menaquinones, and demethylmenaquinones (Meganathan, 2001). Verrucomicrobia methanotrophs are known for producing menaquinone through a recently identified pathway using futalosine as an intermediate (Hiratsuka et al., 2008). Interestingly, the genome sequence of our strain does not encode for any of the genes necessary to produce ubiquinol. As a result, all reactions in iAS473 have been manually curated to use menaquinones as electron transporters.
All components of the, ETC, necessary for energy conservation (complex I-V) are encoded in the genome of strain Pic (Figure 2C), including the Alternative Complex III (ACIII) known to act as a cytochrome-menaquinol reductase in all Verrucomicrobia methanotrophs (Schmitz et al., 2021). Unfortunately, it is unclear whether ACIII contributes to the proton motive force (pmf) by translocating electrons across the membrane (Sousa et al., 2018; Sun et al., 2018). Because of the uncertainty in the stoichiometry of this complex, cytochrome-ubiquinol reductase activity was modeled by reaction CYO1_KT in which two protons are translocated across the membrane. The stoichiometry of the remaining components of the, ETC, was modeled by assuming a P/O ratio of 2.5 (Bordel et al., 2019a).
2.3.2.2 Carbon metabolism
The pathway for CH4 assimilation begins with its oxidation to methanol by the enzyme methane monooxygenase (MMO) enzyme. Our model contains the PMMO which is present in the cell wall. Although the mechanisms of electron transfer to this enzyme are still under debate, previous modeling studies have suggested that electrons for CH4 oxidation originate from the quinone pool (Bordel et al., 2019a). In our model, menaquinones were used as electron donors in the PMMOipp reaction (Figure 2C). Gene protein reaction rule (GPR) for this reaction was set to operons pmoCAB1 and pmoCAB2 because those have the highest sequence similarity to those expressed in the presence of CH4 from strain IT6 (Supplementary Table S4).
Subsequently, methanol is oxidized to formaldehyde by a methanol dehydrogenase (MDH). We found that our strain encodes the lanthanide-dependent MDH XoxF, together with the periplasmic substrate-binding protein XoxJ and the cytochrome C XoxG (Supplementary Table S5), as well as the gene cluster pqqBCDE and pqqA required to produce the cofactor pyrroloquinoline used by periplasmic dehydrogenases, comprising a total of seven genes. Protein homology and experimental evidence for strain SolV showed that the cytochrome CGJ can donate electrons to a secondary cytochrome, suggesting electron transfer to a terminal oxidase (Versantvoort et al., 2019). We included those details in iAS473.
Methanotrophic Verrucomicrobia have been shown to exclusively use CO2 as a carbon source via the Calvin-Benson-Basham (CBB) cycle (Khadem et al., 2011). Because of this, the pathways for formaldehyde oxidation become highly relevant to provide electron equivalents and most of the CO2 used in the CBB cycle. Formaldehyde oxidation to formate proceeds via pathways involving methylene derivates of the cofactor tetrahydrofolate (THF), or the archaea-like cofactor tetrahydromethanopterin (THMP) (Chistoserdova et al., 2009). In methanotrophic Verrucomicrobia, formaldehyde could bind spontaneously or enzymatically to THF to form methylene-THF (Vorholt et al., 2000; Chistoserdova et al., 2009; He et al., 2020), and be converted to formyl-THF by the bifunctional dehydrogenase/cyclohydrolase FolD (Schmitz et al., 2021). Subsequently, formyl-THF could be converted to formate by a formate-THF-ligase accompanied by the production of ATP (Marx et al., 2003). Alternatively, formaldehyde could be oxidized directly to formate by the MDH-XoxF (Pol et al., 2014). Finally, a cytosolic formate dehydrogenase could oxidize formate to CO2 using NADH as an electron acceptor (Figure 2C). Genomic evidence for our strain showed that all the enzymes necessary to operate the CBB cycle and regeneration of glyoxylate (e.g., phosphoglycolate phosphatase, glycolate oxidase) are present in strain Pic (Supplementary Table S5).
Additionally, we included all reactions necessary to enable C3 metabolism in our model. We found previous genomic and transcriptomic evidence of this functions in Methylacidiphilum sp. IT6 while growing on propane, isopropanol, and acetone (Awala et al., 2021). In this pathway (Figure 2C; Supplementary Table S4), propane could be oxidized to isopropanol by a PMMO; however, transcriptome analyses could not resolve whether this reaction is catalyzed by PMMO3 or PMMO1 (Picone et al., 2020; Awala et al., 2021). Then, isopropanol could be converted to acetone by a glucose-methanol-choline (GMC) oxidoreductase, and acetone oxidized to acetol by PMMO3. Operon pmoCAB3 contains the gene pmoD, which was recently shown to be necessary for the oxidation of acetone (Chau et al., 2022). Finally, acetol could be converted to methylglyoxal by the same GMC oxidoreductase, and methylglyoxal assimilated into pyruvate via a three-step pathway. In the model, all reactions between propane oxidation and methylglyoxal production take place in the periplasm (Figure 2C) and use menaquinones as electron transporters (Takahashi et al., 2015). Those reactions are associated with 10 genes total in our model.
2.3.2.3 Autotrophic metabolism
To date, two Methylacidiphilum strains (SolV and RTK17.1) have been reported to grow autotrophically using H2 and CO2 under microaerobic conditions (O2 saturation <2%) (Carere et al., 2017; Mohammadi et al., 2017). Our genomic evidence shows that our strain contains three hydrogenase operons, as well as the gene cluster hypBFCDE/hypA, which encodes chaperone proteins necessary for the assembly of hydrogenases (Supplementary Table S5).
The three hydrogenases belong to Groups 1d, 1h and Group 3b (see Methods Section 4.9). Group 1d hydrogenases are uptake hydrogenases that use a b-type cytochrome to transfer electrons to the respiratory chain via the quinone pool (Mohammadi et al., 2017). Group 1h hydrogenases are high-affinity membrane-bound uptake enzymes (Schmitz et al., 2020), for which the electron transfer pathway has not been elucidated yet. Finally, Group 3b hydrogenases are cytosolic enzymes which catalyze the reversible oxidation of H2 coupled to the reduction of NADH. We added reactions HYD4pp and NAD_H2 to the model, which represent periplasmic and cytosolic hydrogenases, respectively (Figure 2C). It is important to note that microorganisms growing on substrates with a higher redox potential than NAD(P)H produce electron equivalents via energy-driven reverse electron flow (Aleem et al., 1963; Ingledew, 1982; Poughon et al., 2001; Sapra et al., 2003; Ferguson and Ingledew, 2008). Considering this, the reaction NADH16pp (complex I) was set to be reversible (Häger and Bothe, 1987) in simulations under autotrophic conditions. Onward, we will refer to this as the reverse electron flow hypothesis.
2.3.2.4 Biomass reaction
The composition of the biomass reaction was imported from the model of the gram negative methanotroph Methylomicrobium buryatense 5G (B1) (de la Torre et al., 2015) into the first draft of our model. This reaction was updated for M. fumariolicum Pic by adding experimental measurements of amino acids (see Methods Section 4.12.1). Additionally, coefficients of the biomass precursors were rescaled so that the biomass had a molecular weight of 1 g mmol-1 (Chan et al., 2017). The growth-associated ATP maintenance consumption (GAM) was calculated from experimental CH4:O2 ratios, and a coefficient of 10.86 mmol ATP gDW–1 h-1 was added to the biomass reaction. Supplementary Table S9 provides a detailed breakdown of biomass components.
Before gap-filling, the production of 13 biomass precursors was blocked. After extensive manual curation we added and connected reactions to produce all these components. However, we could not identify the genomic evidence necessary to produce L-homocysteine and, in consequence, L-methionine. Overall, we included the necessary orphan reactions for the two L-homocysteine production pathways described in bacteria (Belfaiza et al., 1998; Vermeij and Kertesz, 1999; Hwang et al., 2002)
2.4 Model validation and applications of flux balance analysis
Our model was validated by comparing predicted growth rates and growth stoichiometries with bibliomic and our experimental data for four carbon sources (CH4, propane, isopropanol, and acetone). Under all conditions, NH4 was used as the nitrogen source. Overall, model predictions were within the same order of magnitude as that of the bibliomic data (Table 1).
2.4.1 Calculation of redox trade-offs in methanotrophic metabolism
To validate the model, we performed a sensitivity analysis of the growth rate while varying Growth Associated Maintenance (GAM) and Non-GAM while using CH4 as only carbon source. The sensitivity was calculated as the slope of the curve of growth rate vs. GAM/NGAM and has units of Δµ ΔGAM-1 or Δµ ΔNGAM-1. Supplementary Figure S3A shows that the model is largely insensitive to changes in the GAM, showing constant growth predictions for GAM values below 32 mmol ATP gDW–1 h-1. However, the slope changed to 1.2 × 10⁻⁴ for values between 32 and 100 mmol ATP gDW–1 h-1. In contrast, changes in NGAM had a substantially larger effect on the predicted growth rates, decreasing from 0.036 to less than 0.001 h-1 (Supplementary Figure S3B). Although the growth rate is constant below NGAM values of 4.2, from that value onward it decays with a slope of 4.5 × 10⁻³, becoming infeasible for all NGAM values above 12 mmol ATP gDW–1 h-1. The value of NGAM used for all subsequent simulations was 3.5, which was obtained from a previous model (Bordel et al., 2019b).
Additionally, we evaluated the possible effects of formaldehyde oxidation by the XoxF-MDH (reaction FALDHpp). Since this enzyme uses cytochrome C as the electron acceptor, the direct oxidation of formaldehyde to formate by XoxF-MDH prevents the production of NAD(P)H and ATP in the THF-dependent pathway (Figure 2C). Therefore, simulations showed an increased flux through this reaction. We found that it reduces the growth rate by limiting the NAD(P)H available for the CBB cycle and anabolic reactions. (Supplementary Figure S4A). Using O2 yields as constraint, we determined that the model showed the highest agreement with the bibliomic data when 20% of the total formaldehyde flux was oxidized in reaction FALDHpp (Table 1). Therefore, this ratio was used as a constraint in all the subsequent simulations using CH4.
Finally, the predicted correlation between O2 uptake rates/CO2 production rates, and CH4 uptake rates was compared with the experimental growth data from strain Pic (Figures 3A, B). For both components, the slope of the model was in good agreement with the slope of the line of best-fit of the experimental data (Table 2). This indicates that the model can accurately predict metabolic changes under varying environmental conditions. However, for CO2, the intercepts of the model and the fit were different (Table 2) because of a remarkable higher yield of CO2 in our strain. Those results suggest that the difference in the intercepts is caused by physiological differences in strain Pic.
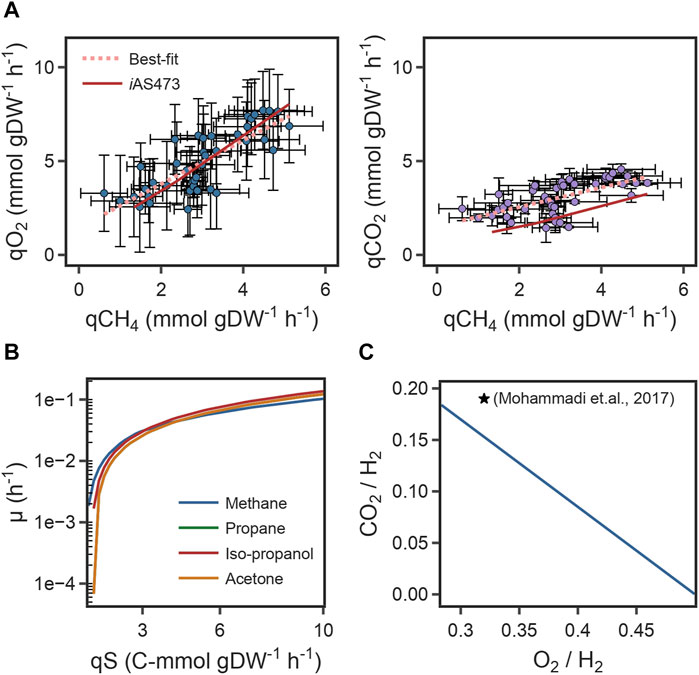
FIGURE 3. (A) Scatter plot of specific O2 uptake rates (left), CO2 production rates (right) as a function of specific CH4 consumption rates and its comparison to model predictions. (B) Growth rates with four different substrates as a function of carbon uptake rate. (C) Comparison of the predicted O2 and CO2 yields to bibliomic data under autotrophic conditions. Yields are referenced to 1 mol of H2.
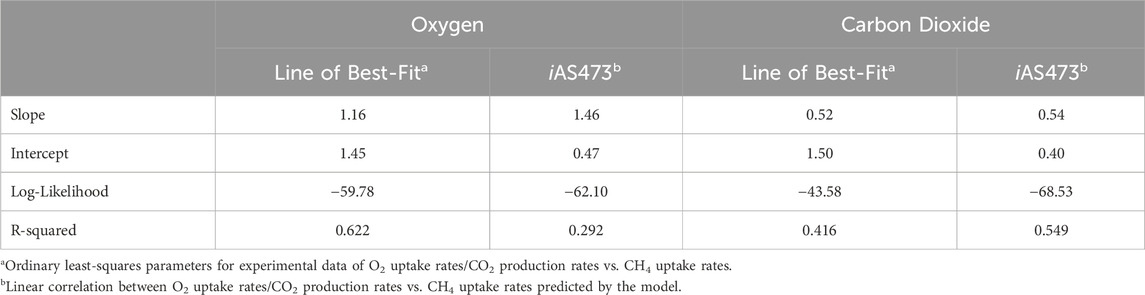
TABLE 2. Comparison between growth phenotypic data from strain Pic and model simulations.
2.4.2 Calculation of redox trade-offs in autotrophic metabolism
We used the model to investigate whether stoichiometric constraints support growth under the reverse electron flow hypothesis. Under this hypothesis, when H2 is oxidized by the periplasmic hydrogenase (HYD4pp), NADH is produced by the reverse activity of complex I in the respiratory chain (NADH16pp) at the expense of pmf. Phase plane analysis revealed a trade-off between this phenomenon and growth rate (Figure 4A). Similar to the results for reaction FALDHpp, as a higher fraction of H2 is oxidized through HYD4pp, NADH regeneration becomes a rate-limiting step in the metabolism, thereby decreasing the maximum growth rate achievable (Figures 4C, D). Additionally, pmf consumption reduces the achievable ATP production rate, as shown by a reduction of 55% in the flux through ATP synthase reaction (Figure 4D). Model predictions indicate that growth under the reverse electron flow hypothesis is only feasible if the total H2 uptake rate is higher than 3.4 mmol H2 gDW–1 h-1, and simulations indicated that reverse electron flow becomes necessary if approximately 76% of the H2 flux is oxidized through HYD4pp (Figure 4B), showing good agreement with bibliomic data (Table 1; Figure 3C).
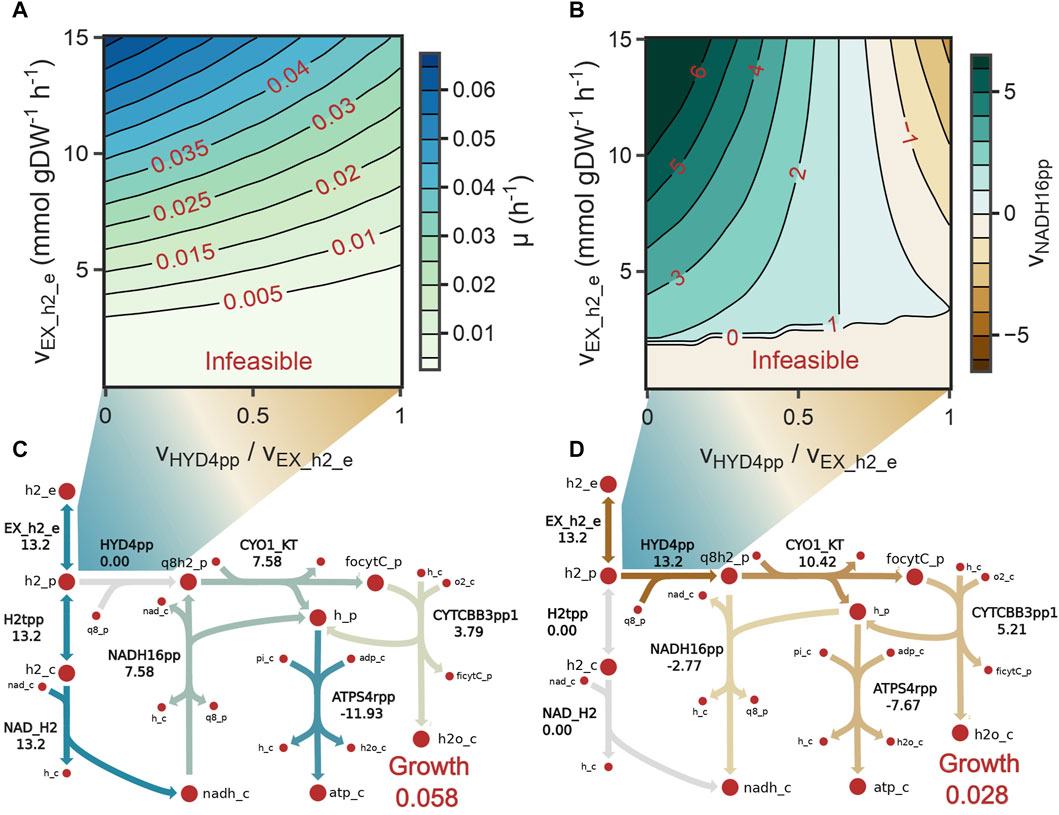
FIGURE 4. (A) Contour plot showing the monotonic decrease in growth rate as the fraction of H2 oxidized by the periplasmic hydrogenases increases (HYD4pp). (B) Contour plot showing the directionality of complex I (NADH16pp) as the fraction of H2 oxidized by HYD4pp increases. NADH16pp changes its directionality when HYD4pp oxidizes 76% of the total H2 flux. (C, D) Metabolic flux distributions of reactions in the electron transport chain when the fraction of H2 oxidized by HYD4pp is 0 (C) or 1 (D). Activity of HYD4pp constraints the maximum growth rate because the proton motive force needs to be diverted from ATP production to NADH regeneration.
2.4.3 Heterotrophic metabolism is limited by redox reactions
Growth under heterotrophic metabolism was simulated for three different substrates: propane, isopropanol, and acetone. To make the simulations comparable between conditions, the substrate uptake rate was normalized to an equivalent carbon uptake rate of 3.5 C-mmol gDW–1 h-1, which is the carbon uptake rate measured from experiments with CH4. With this constraint, the predicted growth rates in C3 substrates were consistent with bibliomic data from strain IT6 (Table 1). Interestingly, the growth rate in isopropanol was remarkably higher (isopropanol = 0.038 h-1; propane, acetone = 0.033 h-1). This occurred because the conversion of isopropanol to acetone by GMC-oxidoreductases produces two extra redox equivalents in the form of protons that can potentially be supplied to the, ETC. On the other hand, when propane or acetone are used as substrates, electrons generated by GMC-oxidoreductases are consumed in the oxygenation reactions of the PMMO. The consequence is that flux of CYTCBB3pp1 (cytochrome oxidase) was 23.6% higher in isopropanol, thus enabling a higher growth rate.
To further investigate those phenotypes, we sampled the solution space of each condition (total 4) to investigate the key differences between methanotrophic and heterotrophic metabolism. Using optGpSampler (Megchelenbrink et al., 2014), 10,000 flux distributions were simulated for CH4, propane, isopropanol, and acetone. Changes in predicted flux variation of reactions were identified by comparing the median fluxes using the Kolmogorov-Smirnov test static (KS-value) and the log2 fold change (log2FC) using CH4 as the reference condition (see Methods Section 4.13). Overall, the highest differences found were a reduction in the flux through the CCB cycle against an increase in glycolytic reactions and the TCA cycle (Figures 5A–C). Because C3 compounds are assimilated at the level of pyruvate, to produce energy and precursor metabolites carbon flux needs to be divided between the TCA cycle, and glycolytic reactions. The higher carbon content enables an increase in amino acid and nucleotides production (Figures 5A–C), with the consequential increase in growth rates (Table 1). Another key difference was the reduction in flux through the THF-dependent pathway of formaldehyde oxidation. Carbon flux through this pathway provides methylene-THF, which is used in the biosynthesis of pyrimidine deoxyribonucleosides. To compensate for its deactivation, methylene-THF was produced from glycine and serine by the glycine-cleavage-enzyme-complex (GLYCL) and the serine hydroxymethyltransferase (GHMT2r), respectively.
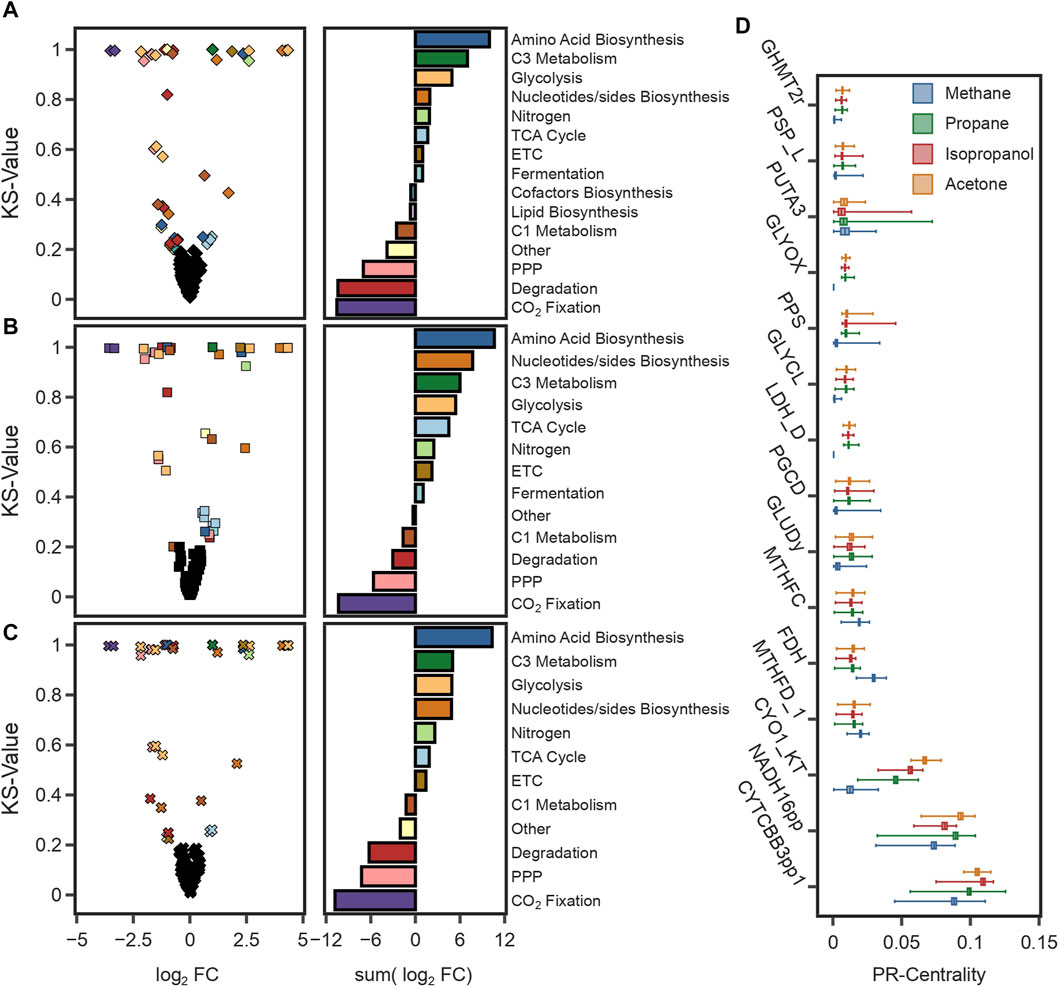
FIGURE 5. (A–C) The graphs on the left are volcano plots showing the median flux differences between simulations using CH4 and (A) propane, (B) isopropanol, and (C) acetone. The plot was generated with the log2 fold change (log2 FC) values from the median of 10,000 simulations and the value of the Kolmogorov-Smirnov test (KS-value). The cut-offs to identify reactions with significant differences were 0.5 for the log2 FC and 0.2 for the KS-value. The graphs on the right show the total flux change for reactions with significant differences grouped by pathways. (D) Box plot of the PageRank scores of the 17 most central reactions for 10,000 simulations in each substrate. The PageRank score is a measure of the centrality or importance of a reaction, and it is higher for reactions with a higher connectivity or reactions with a higher mass flux.
Furthermore, Mass Flow Graphs (MFGs) (Beguerisse-Díaz et al., 2018) were constructed for each sample to rank reactions based on their centrality, which was calculated as the PageRank value (Gleich, 2015). MFGs are weighted, directed graphs with reactions as nodes, edges that represent supplier-consumer relationships between reactions, and weights given by the mass flow between connected reactions. In all conditions, the highest-ranking reactions corresponded to those in the, ETC (Figure 5D), highlighting the energetic constraints that redox balance has on the metabolism of these microorganisms. Notably, formate dehydrogenase (FDH) was a recurring reaction in all simulations (Figure 5D). During the growth using C3 compounds, formate is a product of fermentative metabolism. Activation of fermentative reactions suggests that catabolic pathways, such as the TCA cycle, cannot meet the energy requirements on their own. Overall, these findings suggest that growth under heterotrophic conditions is limited by the production rate of redox equivalents, a result consistent with findings under methanotrophic and autotrophic conditions.
3 Discussion
Extremophile bacteria have the potential to lower biomanufacturing costs by reducing the energy, labor, and capital resources needed for sterilization, agitation, heating, and cooling (Levett et al., 2016; Ye et al., 2023). Moreover, extremophile bacteria are sources of novel and robust industrially relevant compounds (Tao et al., 2016) and proteins (Aulitto et al., 2017). Acidophile methanotrophs have been used for the co-degradation of organochlorine compounds (Choi et al., 2021), whereas halotolerant methanotrophs have been successfully used to produce ectoine (Cantera et al., 2017; Cho et al., 2022).
M-models have been used to study the metabolism of methanotrophs using a systems biology approach (Fu et al., 2019; Nguyen et al., 2020a), and as tools in the rational design of metabolic engineering of methanotrophs (Henard et al., 2019; Nguyen et al., 2020b). Recently, an M-model was used to study the halotolerance mechanisms of Methylomicrobium alcaliphilum (Bordel et al., 2020b). Although automatic reconstruction tools reduce the labor and time needed to develop M-models, extensive manual curation is still required to improve the predictive capacity (Zuñiga et al., 2020) as well as the consistency of the models with Findability, Accessibility, Interoperability, and Reusability (FAIR) principles (Wilkinson et al., 2016). In this study, we generated a high-quality, manually curated model of M. fumariolicum str. Pic. Although several M-models for proteobacterial methanotrophs have been published (Table 3), to our knowledge, model iAS473 is not only the first model available for methanotrophic Verrucomicrobia but also the first model available for any thermoacidophile methanotroph.
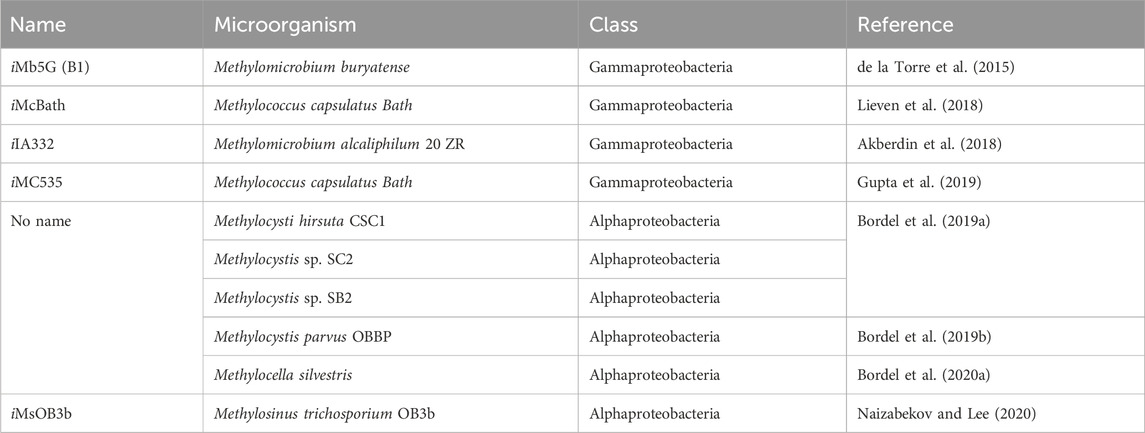
TABLE 3. List of published M-models for methanotrophic bacteria.
Model iAS473 contains 473 out of 647 that were predicted to be related to metabolic reactions in the genome assembly of strain Pic and had a MEMOTE consistency score of 92% (see Supplementary Material S1). In addition, model iAS473 can simulate all the known phenotypic capabilities of the Methylacidiphilum genus, specifically methanotrophic, autotrophic, and heterotrophic. Interestingly, under methanotrophic conditions, oxidation of formaldehyde by the XoxF-MDH prevents the production of NAD(P)H via the THF-dependent pathway. Theoretically, this should exert a negative effect on the metabolism, as the NAD(P)H pool needs to be divided between quinol regeneration, the CBB cycle, and anabolism (Keltjens et al., 2014). Indeed, the model predicts a monotonic decrease in the growth rate as a higher fraction of formaldehyde is oxidized by the XoxF-MDH. However, stoichiometric constraints on NAD(P)H regeneration could be alleviated by alternative electron transfer mechanisms not considered in this study, such as the reverse electron transfer of complexes I and III (Keltjens et al., 2014) or direct electron transfer from cytochrome C to the PMMO (Lieven et al., 2018). Although the formaldehyde oxidation activity of XoxF-MDH has only been detected in vitro (Pol et al., 2014), a similar functional redundancy has been observed between the THF and THMP-dependent pathways (Marx et al., 2005). It is tempting to speculate that XoxF-MDH could play a similar role in alleviating formaldehyde toxicity under transient conditions.
Model iAS473 predicts a similar phenomenon under autotrophic conditions. In vitro activity assays have shown that H2 oxidation in Methylacidiphilum species can mostly be attributed to O2 resistant periplasmic hydrogenases (HYD4pp) (Carere et al., 2017; Schmitz et al., 2020). However, the activity of these enzymes prevents NADH production by the O2 sensitive cytoplasmic hydrogenases. Although NADH could be produced by Group 3b hydrogenases (Hedderich and Forzi, 2005), these enzymes are highly O2 sensitive; therefore, it is not clear if their activity alone is sufficient to supply all electron equivalents required for growth in Methylacidiphilum species.
Simulations under autotrophic conditions showed that an increase in the fraction of H2 oxidized by HYD4pp decreases the growth rate because of the reduction in NADH production (Figure 4A). To compensate for this loss, complex I carries a reversible reaction to produce NADH; however, this activity decreases the available pmf used for ATP production, constraining the growth rate dramatically. Simulations predicted that a reverse electron flow is necessary if at least 76% of the H2 flux is oxidized through HYD4pp (Figure 4B), this result is consistent with activity assays between the membrane and soluble fractions of H2 oxidizing cells from strain SolV, in which approximately 62% of the H2 was oxidized by the membrane fraction (Carere et al., 2017; Schmitz et al., 2020). Since reverse electron flow is a highly endergonic process, the metabolism needs to overcome an energy threshold to make growth feasible (Poughon et al., 2001). Interestingly, model simulations predicted a threshold at 3.4 mmol of H2 gDW-1 h-1; This result needs to be tested experimentally and further validated using advanced modeling methodologies such as metabolism and gene expression models (Tibocha-Bonilla et al., 2022).
The changes in flux patterns between methanotrophic and heterotrophic conditions, as predicted by the model, were consistent with transcriptome analyses of strain IT6 grown in isopropanol. Model simulations indicated that under heterotrophic conditions, carbon assimilation bifurcates in pyruvate: a fraction of the carbon flux is diverted to the TCA cycle for the regeneration of the NAD(P)H pool, while the rest is diverted to glycolysis and the Pentose Phosphate Pathway to produce precursor metabolites. As expected, a significant proportion of the carbon flux was also diverted to formate and later to CO2 through the formate dehydrogenase reaction (FDH), suggesting that this reaction was also necessary to replenish the NAD(P)H pool key for methanotrophic metabolism. In a study by Awala et al. (2021) the authors determined that genes for phosphoenol pyruvate synthase, as well as the three components of the pyruvate dehydrogenase complex, were upregulated in isopropanol-growing cells. Moreover, 11 out of the 32 upregulated genes belonged to enzymes of the TCA cycle.
Overall, the model iAS473 enables a systematic process to compile available biochemical and genetic information, detect possible errors during the annotation process of the genome assembly, and identify knowledge gaps in the metabolism of Methylacidiphilum species. We expect that this model will be a useful tool for researchers to investigate the metabolism of this novel genus.
4 Materials and methods
4.1 Sample collection
In March 2019, we took sediment and water samples of approximately 250 mL samples from the crater-lake in “El Chichonal”, an active volcano located in the state of Chiapas in Mexico (17o21′N, W93 o 41′W; 1100 masl.). After the most recent eruption started in March 1982 three small lakes were created in the crater; by November 1982, one lake occupying an area of 14 ha remained (Armienta et al., 2008). Temperatures in the lake vary between 20°C and 95°C, and the pH varies between 2 and 4. The crater lake has been the source of extremophile bacteria (Ovando-Chacon et al., 2020; Ortiz-Cortés et al., 2021; Ovando-Ovando et al., 2023), and recently proteobacterial methanotrophs were identified in the sediments (Rincón-Molina et al., 2019; Rincón-Molina et al., 2020). Supplementary Table S1 contains the coordinates of the different sites. Sediment samples were collected in sterile plastic containers, and water samples were collected in sterile amber bottles. Immediately after collection, the samples were stored in ice and transported to our laboratory in Mexico City for further genomic studies.
4.2 Culture conditions
Cultures of sediments were incubated in gastight serum bottles of 125 mL, at a temperature of 50°C, agitation speed of 160rpm using Ammonium Mineral Salts (AMS) medium at pH 2 with, with 10% (v/v) of CH4 in the headspace unless otherwise specified. The medium composition is reported in Supplementary Table S3.
4.3 Enrichment and isolation
Approximately 1.3 g of sediments from each site were mixed and diluted with 10 mL of AMS and 10 mL of water sampled from the lake. This mixture was incubated in 125 mL of gastight serum bottles at a temperature of 40°C and an agitation speed of 200 rpm. The concentration of gases in the headspace of the bottle was adjusted to 20% (v/v) of CH4 and 1% (v/v) of CO2 by removing air with a syringe and adding the corresponding volume of each gas. This mixture was incubated until all CH4 in the headspace was depleted. After this, the mixture was used as the inoculum of five 1:10 serial dilutions in 20 mL of AMS. The dilutions were incubated under the same conditions described before, with the only difference being that CO2 was not added to the headspace. For isolation, 2 ml of the lowest dilution with growth were taken to start three rounds of 10–11 extinction culturing dilutions. After the third round, 2 ml of the lowest dilution with growth were transferred to 23 mL of fresh AMS media and incubated for 1 week before DNA extraction.
4.4 DNA extraction and sequencing
DNA was extracted from 25 mL of culture broth. The sample was centrifuged and washed twice in Phosphate Buffer (0.2M, pH 7.4). Then, the Qiagen DNeasy PowerSoil DNA Isolation Kit (QIAGEN Sciences, Germantown, MD, United States) was used following the manufacturer’s instructions. The samples were submitted to Novogene Corporation Inc (Sacramento, CA, United States) for library preparation and sequencing on an Illumina NovaSeq PE150 platform.
4.5 Utilization of respirometry to determine temperature phenotypes
Pre-grown cultures were incubated in 300 mL of AMS in a 1L gas-tight bottle, and 120 mL of CH4 were added daily until an optical density of 0.5 was reached. All respirometry experiments were performed in a custom-made glass chamber (Cabello et al., 2015) using a Clark-type polarographic dissolved oxygen (DO) probe (YSI Incorporated, United States). A data acquisition module (CompactDAQmx, NI, United States) was connected to a computer for data logging every second. Before each temperature tested (40, 45, 50, 60°C), 25 mL of pre-grown bacterial cultures were incubated in gastight serum bottles for 15min with 10% CH4 inside a water bath pre-adjusted to the desired temperature, with an additional 15 min incubation with air alone it the headspace. Maintenance O2 consumption was measured by adding 3 mL of the acclimatized bacterial suspension to the glass chamber and recording DO dynamics for 10 min. Subsequently, 10 µL of a 12M methanol solution were added to the chamber and the dynamics were recorded until DO exhaustion.
4.6 Determination of optimal pH
Pre-grown cultures were incubated in 300 mL of AMS in a 1L gas-tight bottle, and 120 mL of CH4 were added daily until the culture reached an optical density of 0.5. In each pH tested (1.0, 1.5, 2.0, 2.5, and 3.0), 25 mL of pre-grown bacterial cultures were incubated in gas-tight serum bottles with an initial CH4 concentration of 10% in the head space. The pH of each experiment was adjusted with a solution of H3PO4 50% (v/v). The concentrations of CH4, CO2, and O2 were measured every 2 h by injecting 200uL of the headspace into a GOW-MAC gas chromatograph. All experiments were performed in triplicate. The dry biomass weight was measured at the end of the experiment. Data collected was used to fit a linear model and calculate the CH4 uptake rate and CO2 production rate using the python package statsmodels v0.14.0 (Seabold and Perktold, 2010).
4.7 Evaluation of substrate uptake rates and growth rates calculations
We tested growth phenotypes on acetone, isopropanol, and LP-Gas. Pre-grown cultures were incubated in 300 mL of AMS in a 1L gas-tight bottle, and 120 mL of CH4 were added daily until the culture reached an optical density of 0.5. We used 25 mL of pre-grown bacterial cultures with initial concentrations of 50 mM acetone, 50 mM isopropanol and 10% (v/v) LP-Gas. Each substrate was tested in triplicates. The concentrations of O2 and CO2 were monitored for 8 h using a GOW-MAC gas chromatograph, with an interval of 1 h 15 min between each sample. Data collected was used to fit a linear model and calculate the substrate uptake rate using the python package statsmodels v0.14.0 (Seabold and Perktold, 2010). Data collected was used to fit a linear model and calculate the CO2 production rate using the python package statsmodels v0.14.0 (Seabold and Perktold, 2010).
4.8 Analytical methods used to create model constraints
CH4, CO2, and O2 were measured in a GOW-MAC gas chromatograph using a CTR1 column (Alltech, United States). Helium was used as carrier gas at a flow rate of 100 mL min-1. The column, detector, and injector temperatures were set to 40°C, 115°C, and 50°C respectively. The detector current was set to 125 mA. Dry biomass weight was measured by vacuum filtering 25 mL of bacterial culture in pre-weighted cellulose acetate filters (pore diameter 0.2 µm, Sartorius). Filters were dried in an oven at 60°C for 24 h and then transferred to a dehumidifying chamber until constant weight.
To accurately constrain the biomass objective function of iAS473 we determined the amino acids profile using a Hitachi L-8900, an automated cation exchange chromatograph. This commercial amino acid analyzer automatically process biomass samples (Walker and Mills, 1995). Briefly, 4 mg of dry weight biomass samples were hydrolyzed in HCL according to a standard protocol for biological and physiological samples (Rutherfurd and Gilani, 2009). The calibration curve was done using the amino acid standard AAS 18-5 mL of sigma. This data was used as input to adjust the biomass objective function of iAS473 (see Supplementary Table S9).
4.9 Genome assembly and annotation
Illumina adapter sequences were removed from a total of 23,920,586 paired-end reads using trimommatic (Bolger et al., 2014). The quality of the adapter-free sequences was evaluated using FastQC (https://www.bioinformatics.babraham.ac.uk/projects/fastqc/). Primary genome assembly was carried out using the Spades-based (Prjibelski et al., 2020) assembler Unicycler v0.4.9 (Wick et al., 2017) with standard parameters. Subsequently, raw reads were normalized to an average coverage of 75x using BBNorm from the BBTools software suit (https://jgi.doe.gov/data-and-tools/software-tools/bbtools/). Normalized reads were mapped to the primary assembly and the mapped reads were re-assembled with Mira V5rc1 (Chevreux et al., 2004) to increase contiguity (Lui et al., 2021). Completeness of the assembly was evaluated using BUSCO V5.2.1 (Simão et al., 2015) against the subset of verrucomicrobial genes (2019–04–24). Ribosomal and tRNA presence was evaluated using Infernal cmscan v1.1.4 (Nawrocki and Eddy, 2013) against the Rfam database (Kalvari et al., 2021). The final assembly was scaffolded using SSPACE V2.0 (Boetzer et al., 2011), and Pilon (Walker et al., 2014) was used for gap filling of the scaffolds. Assembly statistics were calculated using QUAST v5.0.2 (Gurevich et al., 2013). Bowtie2 and samtools were used for alignment and sorting functions during all steps (Langmead and Salzberg, 2012; Danecek et al., 2021). The assembly was annotated using the online NCBI Prokaryotic Genome Annotation Pipeline v2021-07-01 (Tatusova et al., 2016). Hydrogenases were classified using HydDB (Søndergaard et al., 2016).
4.10 Genome-scale phylogenetic analysis
Genome assemblies available in NCBI for the Methylacidiphilum were evaluated for completeness with CheckM v1.2.2 (Parks et al., 2015). GET_HOMOLOGUES (Contreras-Moreira and Vinuesa, 2013) was used to identify orthologous gene clusters between the genome reported here and eleven genomes with a completeness higher than 90%. Gen clusters were used to calculate average nucleotide identity (gANI) values to define genus and species-level affiliation (Varghese et al., 2015; Sant’Anna et al., 2019). Our assembly had a gANI value above 96% for every M. fumariolicum genome. Therefore, only five genomes for M. fumariolicum were used for subsequent analyses. Orthologous gene clusters were classified into core and pan-genes. The core gene clusters were used as input to GET_PHYLOMARKERS (Vinuesa et al., 2018) to estimate a phylogenetic tree. The run_get_phylomarkers_pipeline shell script was used on core protein sequences with default parameters to identify proteins with optimal characteristics for phylogenetic analysis. This script outputs concatenated alignments of the optimal phylogenetic markers, which were used as input to IQ-TREE v2.2.0.3 (Minh et al., 2020) for tree estimation under the maximum likelihood criteria using UFBoot2 (Hoang et al., 2018) with 25,000 bootstrap replicates. Unrooted trees were estimated using automatic model selection with ModelFinder (Kalyaanamoorthy et al., 2017) and rooted artificially at the midpoint and they are shown in Figure 1A.
4.11 Phylogenetic tree reconstruction of PmoA
For PmoA, reference sequence WP_009059718.1 was used as a query for three BlastP (Camacho et al., 2009) searches against NCBI non-redundant database (Sayers et al., 2022) using taxonomic filters set to Verrucomicrobia, Alphaproteobacteria, and Gammaproteobacteria. The top 100 hits to each search were aligned using COBALT (Papadopoulos and Agarwala, 2007) with standard parameters. Partial sequences were removed from the alignments before using them as input to IQ-TREE v2.2.0.3 (Minh et al., 2020) for tree estimation under the maximum likelihood criteria using UFBoot2 (Hoang et al., 2018) with 25,000 bootstrap replicates. Unrooted trees were estimated using automatic model selection with ModelFinder (Kalyaanamoorthy et al., 2017) and rooted artificially at midpoint. A similar methodology was used to estimate the phylogenetic tree presented in Supplementary Figure S2, with the difference that the BlastP searches were limited to sequences of other Verrucomicrobia bacteria. Sequences from the Methylacidimicrobium genus were used as outgroup.
4.12 Metabolic reconstruction
4.12.1 Draft reconstruction
The metabolic reconstruction was generated using our semi-automatic methodology (Tec-Campos et al., 2023). Initially, a draft-reconstruction was generated by using GenBank files (GCF_019429645.1) as input to PathoLogic in Pathwaytools v25.0 (Karp et al., 2019) and MetaCyc v25.0 (Caspi et al., 2014). Additionally, we used the model of gram negative methanotroph Methylomicrobium buryatense 5G (B1) as a reference (de la Torre et al., 2015). Pathologic was run with standard parameters and disabling taxonomic pruning. Subsequently, the draft was exported to an xml file and imported into Cobrapy (Ebrahim et al., 2013) for manual curation.
4.12.2 Manual gap-filling
Production of each of the precursor metabolites was tested individually. For those metabolites which could not be produced, reactions were gap filled manually based on supporting information available in Metacyc and KEGG databases. To assign gene associations to reactions without one, protein sequences reported in the M. infernorum pathway map (Hou et al., 2008) from KEGG (Kanehisa and Goto, 2000; Kanehisa et al., 2023) were used as queries in a BLASTp (Camacho et al., 2009) search to the genome assembly reported in this study. For reactions not found in KEGG, protein sequences available in MetaCyc (Caspi et al., 2014) were used as the query. Reactions that still lacked gene associations after this step were removed from the model. Reactions needed to produce all biomass precursors were manually gap-filled following the same methodology.
4.12.3 Model standardization
Annotation cross-references were taken from MetaCyc database and transformed as necessary to be compliant with the identifiers.org compact identifiers. Where possible, missing annotations were complemented using annotations from iML1515 (Monk et al., 2017). Missing information after this step was manually added to the model. To ensure that the reconstruction meets community standards with the minimum information required in the annotation of models (MIRIAM)-compliant cross references (Laibe and Le Novère, 2007), metabolites and reactions that could not be annotated at least in one database other than MetaCyc were removed from the model. Finally, metabolite and reaction identifiers were translated into BiGG namespace (King et al., 2016). Metabolite formulas were taken from MetaCyc database. Where possible, missing formulas were complemented using information from iML1515. Missing metabolite formulas after this step were added manually. If metabolite protonation and charges were available in the databases, these were set to a reference pH of 7.3 for the cytosol compartment, and pH of 2.0 for the periplasm and extracellular compartments. Else, mol files were downloaded from CHEBI (Degtyarenko et al., 2008) or KEGG (Kanehisa and Goto, 2000), and protonation states were predicted using ChemAxon (https://www.chemaxon.com) online Protonation Calculator. Stoichiometry of transport and periplasmic reactions were modified according to the protonation state of each metabolite. Ultimately, the MEMOTE Suite (Lieven et al., 2020) was used for quality analysis of the curated metabolic reconstruction. MEMOTE evaluates the annotation consistency across databases and standards and outputs an annotation score ranging from 0% to 100%.
4.12.4 Stoichiometric balanced cycles for accurate redox estimation
To reduce the possibility of stoichiometrically balanced cycles, we assigned reactions reversibility constraints based on the following methods. First, the equilibrator-API (Noor et al., 2013; Beber et al., 2022) was used to calculate the standard Gibbs potentials of reactions. Gibbs potentials were used to assign directionality constraints if the absolute value of the reaction potential was greater than 1 kJ mol-1 and if the standard deviation was less than 3% of the absolute value. After this, stoichiometric balanced cycles, and erroneous energy generating cycles for 11 energy metabolites were detected and removed using a custom implementation of Algorithm 1 presented in (Gevorgyan et al., 2008). Reversibility constraints for reactions were modified based on information available in the databases.
4.12.5 Biomass objective function
The composition of the biomass reaction was reconstructed from previous published models for Gram-negative methanotrophs (de la Torre et al., 2015; Akberdin et al., 2018; Lieven et al., 2018). The lipid composition was modified based on measurements from Methylacidiphilum species (Op den Camp et al., 2009), whereas the amino acid composition was modified from measurements from M. fumariolicum Pic. Furthermore, the reaction was normalized to a biomass molecular weight of 1 mmol g-1 (Lachance et al., 2019). The growth associated maintenance was calculated from experimental CH4:O2 ratios assuming a P/O ratio of 2.5. The constraints for non-growth associated maintenance were imported from the model of Methylocystis hirsuta CSC1 (Bordel et al., 2019b).
4.13 Model simulations
All simulations were performed in COBRApy (Ebrahim et al., 2013) using Flux Balance Analysis (Orth et al., 2010), with Optlang (Jensen et al., 2017) as an interface to CPLEX 20.1 (Cplex, 2009). CPLEX was used with automatic method selection and numerical tolerance set to 1 × 10⁻⁹. The python package statsmodels v0.14.0 (Seabold and Perktold, 2010) was used to calculate correlation parameters between O2 uptake rates/CO2 production rates and CH4 uptake rates.
Flux sampling was performed using the uniform sampler optGpSampler (Megchelenbrink et al., 2014) with standard parameters and 10,000 replicates. The model was sampled independently in 4 conditions: CH4, propane, isopropanol, and acetone. Differential fluxes in each condition were identified by comparing the median values using the Kolmogorov-Smirnov test static and the log2 fold change, with CH4 as the reference condition. The cut-offs used were 0.2 and 0.5 for the KS-value and the log2 FC, respectively. For each of the 10,000 replicates a Mass Flow Graph (MFG) was constructed using a custom implementation of the methods presented in (Beguerisse-Díaz et al., 2018). MFGs were used to rank reactions according to PageRank Centrality (Gleich, 2015). PageRank Centrality values were calculated using the python package NetworkX (Hagberg et al., 2008). Code used to run simulations and data analysis is available as Jupyter-notebooks (Rule et al., 2019) in the GitHub repository https://github.com/cristalzucsd/Methylacidiphilum_fumariolicum (see Data Availability Statement).
Data availability statement
The datasets presented in this study can be found in online repositories. The names of the repository/repositories and accession number(s) can be found in the article/Supplementary Material.
Author contributions
AS: Data curation, Formal Analysis, Investigation, Methodology, Validation, Visualization, Writing–original draft. PR-R: Data curation, Investigation, Writing–review and editing. SR: Investigation, Conceptualization, Funding acquisition, Supervision, Writing–review and editing. CZ: Conceptualization, Supervision, Writing–review and editing, Project administration, Funding acquisition.
Funding
The author(s) declare financial support was received for the research, authorship, and/or publication of this article. CZ was supported by San Diego State University and the National Science Foundation (Grant No. 2313313). Any opinions, findings and conclusions or recommendations expressed in this material are those of the author(s) and do not necessarily reflect the views of the National Science Foundation. AS, PR-R, and SR were supported by the Mexican Research Council Conahcyt No. PDCPN 2015_241.
Acknowledgments
The authors would like to thank René Francisco Bojórquez Hernández for his assistance during the collection of environmental samples, and Porfirio Meléndez Antonio for his participation during experimental data acquisition.
Conflict of interest
The authors declare that the research was conducted in the absence of any commercial or financial relationships that could be construed as a potential conflict of interest.
The author(s) declared that they were an editorial board member of Frontiers, at the time of submission. This had no impact on the peer review process and the final decision.
Publisher’s note
All claims expressed in this article are solely those of the authors and do not necessarily represent those of their affiliated organizations, or those of the publisher, the editors and the reviewers. Any product that may be evaluated in this article, or claim that may be made by its manufacturer, is not guaranteed or endorsed by the publisher.
Supplementary material
The Supplementary Material for this article can be found online at: https://www.frontiersin.org/articles/10.3389/fsysb.2024.1291612/full#supplementary-material
References
Akberdin, I. R., Thompson, M., Hamilton, R., Desai, N., Alexander, D., Henard, C. A., et al. (2018). Methane utilization in Methylomicrobium alcaliphilum 20ZR: a systems approach. Sci. Rep. 8, 2512. doi:10.1038/s41598-018-20574-z
Aleem, M. I. H., Lees, H., and Nicholas, D. J. D. (1963). Adenosine triphosphate-dependent reduction of nicotinamide adenine dinucleotide by ferro-cytochrome C in chemoautotrophic bacteria. Nature 200, 759–761. doi:10.1038/200759a0
Anvar, S. Y., Frank, J., Pol, A., Schmitz, A., Kraaijeveld, K., den Dunnen, J. T., et al. (2014). The genomic landscape of the verrucomicrobial methanotroph Methylacidiphilum fumariolicum SolV. BMC Genomics 15, 914. doi:10.1186/1471-2164-15-914
Armienta, M. A., Vilaclara, G., De la Cruz-Reyna, S., Ramos, S., Ceniceros, N., Cruz, O., et al. (2008). Water chemistry of lakes related to active and inactive Mexican volcanoes. J. Volcanol. Geotherm. Res. 178, 249–258. doi:10.1016/j.jvolgeores.2008.06.019
Arnolds, K. L., Dahlin, L. R., Ding, L., Wu, C., Yu, J., Xiong, W., et al. (2021). Biotechnology for secure biocontainment designs in an emerging bioeconomy. Curr. Opin. Biotechnol. 71, 25–31. doi:10.1016/j.copbio.2021.05.004
Aulitto, M., Fusco, S., Fiorentino, G., Limauro, D., Pedone, E., Bartolucci, S., et al. (2017). Thermus thermophilus as source of thermozymes for biotechnological applications: homologous expression and biochemical characterization of an α-galactosidase. Microb. Cell Factories 16, 28. doi:10.1186/s12934-017-0638-4
Awala, S. I., Gwak, J.-H., Kim, Y.-M., Kim, S.-J., Strazzulli, A., Dunfield, P. F., et al. (2021). Verrucomicrobial methanotrophs grow on diverse C3 compounds and use a homolog of particulate methane monooxygenase to oxidize acetone. ISME J. 15, 3636–3647. doi:10.1038/s41396-021-01037-2
Beber, M. E., Gollub, M. G., Mozaffari, D., Shebek, K. M., Flamholz, A. I., Milo, R., et al. (2022). eQuilibrator 3.0: a database solution for thermodynamic constant estimation. Nucleic Acids Res. 50, D603–D609. doi:10.1093/nar/gkab1106
Beguerisse-Díaz, M., Bosque, G., Oyarzún, D., Picó, J., and Barahona, M. (2018). Flux-dependent graphs for metabolic networks. NPJ Syst. Biol. Appl. 4, 32–14. doi:10.1038/s41540-018-0067-y
Belfaiza, J., Martel, A., Margarita, D., and Saint Girons, I. (1998). Direct sulfhydrylation for methionine biosynthesis in leptospira meyeri. J. Bacteriol. 180, 250–255. doi:10.1128/jb.180.2.250-255.1998
Boetzer, M., Henkel, C. V., Jansen, H. J., Butler, D., and Pirovano, W. (2011). Scaffolding pre-assembled contigs using SSPACE. Bioinformatics 27, 578–579. doi:10.1093/bioinformatics/btq683
Bolger, A. M., Lohse, M., and Usadel, B. (2014). Trimmomatic: a flexible trimmer for Illumina sequence data. Bioinformatics 30, 2114–2120. doi:10.1093/bioinformatics/btu170
Bordel, S., Crombie, A. T., Muñoz, R., and Murrell, J. C. (2020a). Genome scale metabolic model of the versatile methanotroph methylocella silvestris. Microb. Cell Factories 19, 144. doi:10.1186/s12934-020-01395-0
Bordel, S., Pérez, R., Rodríguez, E., Cantera, S., Fernández-González, N., Martínez, M. A., et al. (2020b). Halotolerance mechanisms of the methanotroph Methylomicrobium alcaliphilum. Biotechnol. Bioeng. 117, 3459–3474. doi:10.1002/bit.27506
Bordel, S., Rodríguez, Y., Hakobyan, A., Rodríguez, E., Lebrero, R., and Muñoz, R. (2019a). Genome scale metabolic modeling reveals the metabolic potential of three Type II methanotrophs of the genus Methylocystis. Metab. Eng. 54, 191–199. doi:10.1016/j.ymben.2019.04.001
Bordel, S., Rojas, A., and Muñoz, R. (2019b). Reconstruction of a genome scale metabolic model of the polyhydroxybutyrate producing methanotroph methylocystis parvus OBBP. Microb. Cell Factories 18, 104. doi:10.1186/s12934-019-1154-5
Cabello, J., Toledo-Cervantes, A., Sánchez, L., Revah, S., and Morales, M. (2015). Effect of the temperature, pH and irradiance on the photosynthetic activity by Scenedesmus obtusiusculus under nitrogen replete and deplete conditions. Bioresour. Technol. 181, 128–135. doi:10.1016/j.biortech.2015.01.034
Camacho, C., Coulouris, G., Avagyan, V., Ma, N., Papadopoulos, J., Bealer, K., et al. (2009). BLAST+: architecture and applications. BMC Bioinforma. 10, 421. doi:10.1186/1471-2105-10-421
Cantera, S., Lebrero, R., Rodríguez, E., García-Encina, P. A., and Muñoz, R. (2017). Continuous abatement of methane coupled with ectoine production by Methylomicrobium alcaliphilum 20Z in stirred tank reactors: a step further towards greenhouse gas biorefineries. J. Clean. Prod. 152, 134–141. doi:10.1016/j.jclepro.2017.03.123
Carere, C. R., Hards, K., Houghton, K. M., Power, J. F., McDonald, B., Collet, C., et al. (2017). Mixotrophy drives niche expansion of verrucomicrobial methanotrophs. ISME J. 11, 2599–2610. doi:10.1038/ismej.2017.112
Carey, M. A., Dräger, A., Beber, M. E., Papin, J. A., and Yurkovich, J. T. (2020). Community standards to facilitate development and address challenges in metabolic modeling. Mol. Syst. Biol. 16, e9235. doi:10.15252/msb.20199235
Caspi, R., Altman, T., Billington, R., Dreher, K., Foerster, H., Fulcher, C. A., et al. (2014). The MetaCyc database of metabolic pathways and enzymes and the BioCyc collection of Pathway/Genome Databases. Nucleic Acids Res. 42, D459–D471. doi:10.1093/nar/gkt1103
Chan, S. H. J., Cai, J., Wang, L., Simons-Senftle, M. N., and Maranas, C. D. (2017). Standardizing biomass reactions and ensuring complete mass balance in genome-scale metabolic models. Bioinformatics 33, 3603–3609. doi:10.1093/bioinformatics/btx453
Chau, T. H. T., Nguyen, A. D., and Lee, E. Y. (2022). Boosting the acetol production in methanotrophic biocatalyst Methylomonas sp. DH-1 by the coupling activity of heteroexpressed novel protein PmoD with endogenous particulate methane monooxygenase. Biotechnol. Biofuels Bioprod. 15, 7. doi:10.1186/s13068-022-02105-1
Chevreux, B., Pfisterer, T., Drescher, B., Driesel, A. J., Müller, W. E. G., Wetter, T., et al. (2004). Using the miraEST assembler for reliable and automated mRNA transcript assembly and SNP detection in sequenced ESTs. Genome Res. 14, 1147–1159. doi:10.1101/gr.1917404
Chistoserdova, L., Kalyuzhnaya, M. G., and Lidstrom, M. E. (2009). The expanding world of methylotrophic metabolism. Annu. Rev. Microbiol. 63, 477–499. doi:10.1146/annurev.micro.091208.073600
Cho, S., Lee, Y. S., Chai, H., Lim, S. E., Na, J. G., and Lee, J. (2022). Enhanced production of ectoine from methane using metabolically engineered Methylomicrobium alcaliphilum 20Z. Biotechnol. Biofuels Bioprod. 15, 5. doi:10.1186/s13068-022-02104-2
Choi, M., Yun, T., Song, M. J., Kim, J., Lee, B.-H., Löffler, F. E., et al. (2021). Cometabolic vinyl chloride degradation at acidic pH catalyzed by acidophilic methanotrophs isolated from alpine peat bogs. Environ. Sci. Technol. 55, 5959–5969. doi:10.1021/acs.est.0c08766
Contreras-Moreira, B., and Vinuesa, P. (2013). GET_HOMOLOGUES, a versatile software package for scalable and robust microbial pangenome analysis. Appl. Environ. Microbiol. 79, 7696–7701. doi:10.1128/AEM.02411-13
Danecek, P., Bonfield, J. K., Liddle, J., Marshall, J., Ohan, V., Pollard, M. O., et al. (2021). Twelve years of SAMtools and BCFtools. GigaScience 10, giab008. doi:10.1093/gigascience/giab008
Degtyarenko, K., de Matos, P., Ennis, M., Hastings, J., Zbinden, M., McNaught, A., et al. (2008). ChEBI: a database and ontology for chemical entities of biological interest. Nucleic Acids Res. 36, D344–D350. doi:10.1093/nar/gkm791
de la Torre, A., Metivier, A., Chu, F., Laurens, L. M. L., Beck, D. A. C., Pienkos, P. T., et al. (2015). Genome-scale metabolic reconstructions and theoretical investigation of methane conversion in Methylomicrobium buryatense strain 5G(B1). Microb. Cell Factories 14, 188. doi:10.1186/s12934-015-0377-3
Dunfield, P. F., Yuryev, A., Senin, P., Smirnova, A. V., Stott, M. B., Hou, S., et al. (2007). Methane oxidation by an extremely acidophilic bacterium of the phylum Verrucomicrobia. Nature 450, 879–882. doi:10.1038/nature06411
Ebrahim, A., Lerman, J. A., Palsson, B. O., and Hyduke, D. R. (2013). COBRApy: COnstraints-based reconstruction and analysis for Python. BMC Syst. Biol. 7, 74. doi:10.1186/1752-0509-7-74
Erikstad, H.-A., Ceballos, R. M., Smestad, N. B., and Birkeland, N.-K. (2019). Global biogeographic distribution patterns of thermoacidophilic Verrucomicrobia methanotrophs suggest allopatric evolution. Front. Microbiol. 10, 1129. doi:10.3389/fmicb.2019.01129
Feist, A. M., Henry, C. S., Reed, J. L., Krummenacker, M., Joyce, A. R., Karp, P. D., et al. (2007). A genome-scale metabolic reconstruction for Escherichia coli K-12 MG1655 that accounts for 1260 ORFs and thermodynamic information. Mol. Syst. Biol. 3, 121. doi:10.1038/msb4100155
Ferguson, S. J., and Ingledew, W. J. (2008). Energetic problems faced by micro-organisms growing or surviving on parsimonious energy sources and at acidic pH: I. Acidithiobacillus ferrooxidans as a paradigm. Biochimica Biophysica Acta (BBA) - Bioenergetics 1777, 1471–1479. doi:10.1016/j.bbabio.2008.08.012
Fu, Y., He, L., Reeve, J., Beck, D. A. C., and Lidstrom, M. E. (2019). Core metabolism shifts during growth on methanol versus methane in the methanotroph Methylomicrobium buryatense 5GB1. mBio 10, e00406-19. doi:10.1128/mbio.00406-19
Gevaert, O., Van Overtveldt, S., Beerens, K., and Desmet, T. (2019). Characterization of the first bacterial and thermostable GDP-mannose 3,5-epimerase. Int. J. Mol. Sci. 20, 3530. doi:10.3390/ijms20143530
Gevorgyan, A., Poolman, M. G., and Fell, D. A. (2008). Detection of stoichiometric inconsistencies in biomolecular models. Bioinformatics 24, 2245–2251. doi:10.1093/bioinformatics/btn425
Gupta, A., Ahmad, A., Chothwe, D., Madhu, M. K., Srivastava, S., and Sharma, V. K. (2019). Genome-scale metabolic reconstruction and metabolic versatility of an obligate methanotroph Methylococcus capsulatus str. Bath. PeerJ 7, e6685. doi:10.7717/peerj.6685
Gurevich, A., Saveliev, V., Vyahhi, N., and Tesler, G. (2013). QUAST: quality assessment tool for genome assemblies. Bioinformatics 29, 1072–1075. doi:10.1093/bioinformatics/btt086
Hagberg, A. A., Schult, D. A., and Swart, P. J. (2008). “Exploring network structure, dynamics, and function using NetworkX,” in Proceedings of the 7th Python in science conference. Editors G. Varoquaux, T. Vaught, and J. Millman (Pasadena, CA USA: US Department of Energy), 11–15.
Häger, K.-P., and Bothe, H. (1987). Reduction of NAD+ by the reversed respiratory electron flow in Azotobacter vinelandii. Biochimica Biophysica Acta (BBA) - Bioenergetics 892, 213–223. doi:10.1016/0005-2728(87)90177-0
He, H., Noor, E., Ramos-Parra, P. A., García-Valencia, L. E., Patterson, J. A., Díaz de la Garza, R. I., et al. (2020). In vivo rate of formaldehyde condensation with tetrahydrofolate. Metabolites 10, 65. doi:10.3390/metabo10020065
Hedderich, R., and Forzi, L. (2005). Energy-converting [NiFe] hydrogenases: more than just H2 activation. J. Mol. Microbiol. Biotechnol. 10, 92–104. doi:10.1159/000091557
Henard, C. A., Akberdin, I. R., Kalyuzhnaya, M. G., and Guarnieri, M. T. (2019). Muconic acid production from methane using rationally-engineered methanotrophic biocatalysts. Green Chem. 21, 6731–6737. doi:10.1039/C9GC03722E
Hiratsuka, T., Furihata, K., Ishikawa, J., Yamashita, H., Itoh, N., Seto, H., et al. (2008). An alternative menaquinone biosynthetic pathway operating in microorganisms. Science 321, 1670–1673. doi:10.1126/science.1160446
Hoang, D. T., Chernomor, O., von Haeseler, A., Minh, B. Q., and Vinh, L. S. (2018). UFBoot2: improving the ultrafast bootstrap approximation. Mol. Biol. Evol. 35, 518–522. doi:10.1093/molbev/msx281
Hogendoorn, C., Picone, N., van Hout, F., Vijverberg, S., Poghosyan, L., van Alen, T. A., et al. (2021). Draft genome of a novel methanotrophic Methylobacter sp. from the volcanic soils of Pantelleria Island. Antonie Leeuwenhoek 114, 313–324. doi:10.1007/s10482-021-01525-7
Hou, S., Makarova, K. S., Saw, J. H., Senin, P., Ly, B. V., Zhou, Z., et al. (2008). Complete genome sequence of the extremely acidophilic methanotroph isolate V4, Methylacidiphilum infernorum, a representative of the bacterial phylum Verrucomicrobia. Biol. Direct 3, 26. doi:10.1186/1745-6150-3-26
Hucka, M., Finney, A., Sauro, H. M., Bolouri, H., Doyle, J. C., Kitano, H., et al. (2003). The systems biology markup language (SBML): a medium for representation and exchange of biochemical network models. Bioinformatics 19, 524–531. doi:10.1093/bioinformatics/btg015
Hwang, B.-J., Yeom, H.-J., Kim, Y., and Lee, H.-S. (2002). Corynebacterium glutamicum utilizes both transsulfuration and direct sulfhydrylation pathways for methionine biosynthesis. J. Bacteriol. 184, 1277–1286. doi:10.1128/jb.184.5.1277-1286.2002
Ingledew, W. J. (1982). Thiobacillus Ferrooxidans the bioenergetics of an acidophilic chemolithotroph. Biochimica Biophysica Acta (BBA) - Rev. Bioenergetics 683, 89–117. doi:10.1016/0304-4173(82)90007-6
Islam, T., Jensen, S., Reigstad, L. J., Larsen, Ø., and Birkeland, N.-K. (2008). Methane oxidation at 55 degrees C and pH 2 by a thermoacidophilic bacterium belonging to the Verrucomicrobia phylum. Proc. Natl. Acad. Sci. 105, 300–304. doi:10.1073/pnas.0704162105
Jensen, K., Cardoso, J. G., and Sonnenschein, N. (2017). Optlang: an algebraic modeling language for mathematical optimization. J. Open Source Softw. 2, 139. doi:10.21105/joss.00139
Kalvari, I., Nawrocki, E. P., Ontiveros-Palacios, N., Argasinska, J., Lamkiewicz, K., Marz, M., et al. (2021). Rfam 14: expanded coverage of metagenomic, viral and microRNA families. Nucleic Acids Res. 49, D192–D200. doi:10.1093/nar/gkaa1047
Kalyaanamoorthy, S., Minh, B. Q., Wong, T. K. F., von Haeseler, A., and Jermiin, L. S. (2017). ModelFinder: fast model selection for accurate phylogenetic estimates. Nat. Methods 14, 587–589. doi:10.1038/nmeth.4285
Kanehisa, M., Furumichi, M., Sato, Y., Kawashima, M., and Ishiguro-Watanabe, M. (2023). KEGG for taxonomy-based analysis of pathways and genomes. Nucleic Acids Res. 51, D587–D592. doi:10.1093/nar/gkac963
Kanehisa, M., and Goto, S. (2000). KEGG: kyoto encyclopedia of genes and genomes. Nucleic Acids Res. 28, 27–30. doi:10.1093/nar/28.1.27
Karp, P. D., Midford, P. E., Billington, R., Kothari, A., Krummenacker, M., Latendresse, M., et al. (2019). Pathway Tools version 23.0 update: software for pathway/genome informatics and systems biology. Brief. Bioinform 22, 109–126. doi:10.1093/bib/bbz104
Keltjens, J. T., Pol, A., Reimann, J., and Op den Camp, H. J. M. (2014). PQQ-dependent methanol dehydrogenases: rare-earth elements make a difference. Appl. Microbiol. Biotechnol. 98, 6163–6183. doi:10.1007/s00253-014-5766-8
Khadem, A. F., Pol, A., Wieczorek, A., Mohammadi, S. S., Francoijs, K.-J., Stunnenberg, H. G., et al. (2011). Autotrophic methanotrophy in Verrucomicrobia: Methylacidiphilum fumariolicumSolV uses the calvin-benson-bassham cycle for carbon dioxide fixation. J. Bacteriol. 193, 4438–4446. doi:10.1128/jb.00407-11
King, Z. A., Lu, J., Dräger, A., Miller, P., Federowicz, S., Lerman, J. A., et al. (2016). BiGG Models: a platform for integrating, standardizing and sharing genome-scale models. Nucleic Acids Res. 44, D515–D522. doi:10.1093/nar/gkv1049
Knief, C. (2015). Diversity and habitat preferences of cultivated and uncultivated aerobic methanotrophic bacteria evaluated based on pmoA as molecular marker. Front. Microbiol. 6, 1346. doi:10.3389/fmicb.2015.01346
Kruse, T., Ratnadevi, C. M., Erikstad, H.-A., and Birkeland, N.-K. (2019). Complete genome sequence analysis of the thermoacidophilic verrucomicrobial methanotroph “Candidatus Methylacidiphilum kamchatkense” strain Kam1 and comparison with its closest relatives. BMC Genomics 20, 642. doi:10.1186/s12864-019-5995-4
Lachance, J.-C., Lloyd, C. J., Monk, J. M., Yang, L., Sastry, A. V., Seif, Y., et al. (2019). BOFdat: generating biomass objective functions for genome-scale metabolic models from experimental data. PLOS Comput. Biol. 15, e1006971. doi:10.1371/journal.pcbi.1006971
Laibe, C., and Le Novère, N. (2007). MIRIAM Resources: tools to generate and resolve robust cross-references in Systems Biology. BMC Syst. Biol. 1, 58. doi:10.1186/1752-0509-1-58
Langmead, B., and Salzberg, S. L. (2012). Fast gapped-read alignment with Bowtie 2. Nat. Methods 9, 357–359. doi:10.1038/nmeth.1923
Levett, I., Birkett, G., Davies, N., Bell, A., Langford, A., Laycock, B., et al. (2016). Techno-economic assessment of poly-3-hydroxybutyrate (PHB) production from methane—the case for thermophilic bioprocessing. J. Environ. Chem. Eng. 4, 3724–3733. doi:10.1016/j.jece.2016.07.033
Lieven, C., Beber, M. E., Olivier, B. G., Bergmann, F. T., Ataman, M., Babaei, P., et al. (2020). MEMOTE for standardized genome-scale metabolic model testing. Nat. Biotechnol. 38, 272–276. doi:10.1038/s41587-020-0446-y
Lieven, C., Petersen, L. A. H., Jørgensen, S. B., Gernaey, K. V., Herrgard, M. J., and Sonnenschein, N. (2018). A genome-scale metabolic model for methylococcus capsulatus (bath) suggests reduced efficiency electron transfer to the particulate methane monooxygenase. Front. Microbiol. 9, 2947. doi:10.3389/fmicb.2018.02947
Lui, L. M., Nielsen, T. N., and Arkin, A. P. (2021). A method for achieving complete microbial genomes and improving bins from metagenomics data. PLOS Comput. Biol. 17, e1008972. doi:10.1371/journal.pcbi.1008972
Marx, C. J., Dien, S. J. V., and Lidstrom, M. E. (2005). Flux analysis uncovers key role of functional redundancy in formaldehyde metabolism. PLOS Biol. 3, e16. doi:10.1371/journal.pbio.0030016
Marx, C. J., Laukel, M., Vorholt, J. A., and Lidstrom, M. E. (2003). Purification of the formate-tetrahydrofolate ligasefrom methylobacterium extorquens AM1 and demonstrationof its requirement for MethylotrophicGrowth. J. Bacteriol. 185, 7169–7175. doi:10.1128/jb.185.24.7169-7175.2003
Meganathan, R. (2001). Ubiquinone biosynthesis in microorganisms. FEMS Microbiol. Lett. 203, 131–139. doi:10.1111/j.1574-6968.2001.tb10831.x
Megchelenbrink, W., Huynen, M., and Marchiori, E. (2014). optGpSampler: an improved tool for uniformly sampling the solution-space of genome-scale metabolic networks. PLOS ONE 9, e86587. doi:10.1371/journal.pone.0086587
Minh, B. Q., Schmidt, H. A., Chernomor, O., Schrempf, D., Woodhams, M. D., von Haeseler, A., et al. (2020). IQ-TREE 2: new models and efficient methods for phylogenetic inference in the genomic era. Mol. Biol. Evol. 37, 1530–1534. doi:10.1093/molbev/msaa015
Mohammadi, S., Pol, A., van Alen, T. A., Jetten, M. S., and Op den Camp, H. J. (2017). Methylacidiphilum fumariolicum SolV, a thermoacidophilic ‘Knallgas’ methanotroph with both an oxygen-sensitive and -insensitive hydrogenase. ISME J. 11, 945–958. doi:10.1038/ismej.2016.171
Monk, J. M., Lloyd, C. J., Brunk, E., Mih, N., Sastry, A., King, Z., et al. (2017). iML1515, a knowledgebase that computes Escherichia coli traits. Nat. Biotechnol. 35, 904–908. doi:10.1038/nbt.3956
Naizabekov, S., and Lee, E. Y. (2020). Genome-scale metabolic model reconstruction and in silico investigations of methane metabolism in methylosinus trichosporium OB3b. Microorganisms 8, 437. doi:10.3390/microorganisms8030437
Nawrocki, E. P., and Eddy, S. R. (2013). Infernal 1.1: 100-fold faster RNA homology searches. Bioinformatics 29, 2933–2935. doi:10.1093/bioinformatics/btt509
Nguyen, A. D., Park, J. Y., Hwang, I. Y., Hamilton, R., Kalyuzhnaya, M. G., Kim, D., et al. (2020a). Genome-scale evaluation of core one-carbon metabolism in gammaproteobacterial methanotrophs grown on methane and methanol. Metab. Eng. 57, 1–12. doi:10.1016/j.ymben.2019.10.004
Nguyen, T. T., Lee, O. K., Naizabekov, S., and Lee, E. Y. (2020b). Bioconversion of methane to cadaverine and lysine using an engineered type II methanotroph, Methylosinus trichosporium OB3b. Green Chem. 22, 7803–7811. doi:10.1039/D0GC02232B
Noor, E., Cherkaoui, S., and Sauer, U. (2019). Biological insights through omics data integration. Curr. Opin. Syst. Biol. 15, 39–47. doi:10.1016/j.coisb.2019.03.007
Noor, E., Haraldsdóttir, H. S., Milo, R., and Fleming, R. M. T. (2013). Consistent estimation of Gibbs energy using component contributions. PLOS Comput. Biol. 9, e1003098. doi:10.1371/journal.pcbi.1003098
Olivier, B. G., and Bergmann, F. T. (2018). SBML level 3 package: flux balance constraints version 2. J. Integr. Bioinforma. 15, 20170082. doi:10.1515/jib-2017-0082
Op den Camp, H. J. M., Islam, T., Stott, M. B., Harhangi, H. R., Hynes, A., Schouten, S., et al. (2009). Environmental, genomic and taxonomic perspectives on methanotrophic Verrucomicrobia. Environ. Microbiol. Rep. 1, 293–306. doi:10.1111/j.1758-2229.2009.00022.x
Orth, J. D., Thiele, I., and Palsson, B. Ø. (2010). What is flux balance analysis? Nat. Biotechnol. 28, 245–248. doi:10.1038/nbt.1614
Ortiz-Cortés, L. Y., Ventura-Canseco, L. M. C., Abud-Archila, M., Ruíz-Valdiviezo, V. M., Velázquez-Ríos, I. O., and Alvarez-Gutiérrez, P. E. (2021). Evaluation of temperature, pH and nutrient conditions in bacterial growth and extracellular hydrolytic activities of two Alicyclobacillus spp. strains. Arch. Microbiol. 203, 4557–4570. doi:10.1007/s00203-021-02332-4
Ovando-Chacon, S. L., Tacias-Pascacio, V. G., Ovando-Chacon, G. E., Rosales-Quintero, A., Rodriguez-Leon, A., Ruiz-Valdiviezo, V. M., et al. (2020). Characterization of thermophilic microorganisms in the geothermal water flow of el chichón volcano crater lake. Water 12, 2172. doi:10.3390/w12082172
Ovando-Ovando, C. I., Feregrino-Mondragón, R. D., Rincón-Rosales, R., Jasso-Chávez, R., and Ruíz-Valdiviezo, V. M. (2023). Isolation and identification of arsenic-resistant extremophilic bacteria from the cratercrater-lake volcano “el chichon”, Mexico. Curr. Microbiol. 80, 257. doi:10.1007/s00284-023-03327-8
Papadopoulos, J. S., and Agarwala, R. (2007). COBALT: constraint-based alignment tool for multiple protein sequences. Bioinformatics 23, 1073–1079. doi:10.1093/bioinformatics/btm076
Parks, D. H., Imelfort, M., Skennerton, C. T., Hugenholtz, P., and Tyson, G. W. (2015). CheckM: assessing the quality of microbial genomes recovered from isolates, single cells, and metagenomes. Genome Res. 25, 1043–1055. doi:10.1101/gr.186072.114
Passi, A., Tibocha-Bonilla, J. D., Kumar, M., Tec-Campos, D., Zengler, K., and Zuniga, C. (2022). Genome-scale metabolic modeling enables in-depth understanding of big data. Metabolites 12, 14. doi:10.3390/metabo12010014
Picone, N., Mohammadi, S. S., Waajen, A. C., van Alen, T. A., Jetten, M. S. M., Pol, A., et al. (2020). More than a methanotroph: a broader substrate spectrum for Methylacidiphilum fumariolicum SolV. Front. Microbiol. 11, 604485. doi:10.3389/fmicb.2020.604485
Pol, A., Barends, T. R. M., Dietl, A., Khadem, A. F., Eygensteyn, J., Jetten, M. S. M., et al. (2014). Rare earth metals are essential for methanotrophic life in volcanic mudpots. Environ. Microbiol. 16, 255–264. doi:10.1111/1462-2920.12249
Pol, A., Heijmans, K., Harhangi, H. R., Tedesco, D., Jetten, M. S. M., and Op den Camp, H. J. M. (2007). Methanotrophy below pH 1 by a new Verrucomicrobia species. Nature 450, 874–878. doi:10.1038/nature06222
Poughon, L., Dussap, C.-G., and Gros, J.-B. (2001). Energy model and metabolic flux analysis for autotrophic nitrifiers. Biotechnol. Bioeng. 72, 416–433. doi:10.1002/1097-0290(20000220)72:4<416::AID-BIT1004>3.0.CO;2-D
Prjibelski, A., Antipov, D., Meleshko, D., Lapidus, A., and Korobeynikov, A. (2020). Using SPAdes de novo assembler. Curr. Protoc. Bioinforma. 70, e102. doi:10.1002/cpbi.102
Rincón-Molina, C. I., Hernández-García, J. A., Rincón-Rosales, R., Gutiérrez-Miceli, F. A., Ramírez-Villanueva, D. A., González-Terreros, E., et al. (2019). Structure and diversity of the bacterial communities in the acid and thermophilic crater-lake of the volcano “el chichón”, Mexico. Geomicrobiol. J. 36, 97–109. doi:10.1080/01490451.2018.1509158
Rincón-Molina, C. I., Martínez-Romero, E., Ruiz-Valdiviezo, V. M., Velázquez, E., Ruiz-Lau, N., Rogel-Hernández, M. A., et al. (2020). Plant growth-promoting potential of bacteria associated to pioneer plants from an active volcanic site of Chiapas (Mexico). Appl. Soil Ecol. 146, 103390. doi:10.1016/j.apsoil.2019.103390
Rule, A., Birmingham, A., Zuniga, C., Altintas, I., Huang, S.-C., Knight, R., et al. (2019). Ten simple rules for writing and sharing computational analyses in Jupyter Notebooks. PLOS Comput. Biol. 15, e1007007. doi:10.1371/journal.pcbi.1007007
Rutherfurd, S. M., and Gilani, G. S. (2009). Amino acid analysis. Curr. Protoc. Protein Sci. 58, 11.9.1–11.9.37. doi:10.1002/0471140864.ps1109s58
Sant’Anna, F. H., Bach, E., Porto, R. Z., Guella, F., Sant’Anna, E. H., and Passaglia, L. M. P. (2019). Genomic metrics made easy: what to do and where to go in the new era of bacterial taxonomy. Crit. Rev. Microbiol. 45, 182–200. doi:10.1080/1040841X.2019.1569587
Sapra, R., Bagramyan, K., and Adams, M. W. W. (2003). A simple energy-conserving system: proton reduction coupled to proton translocation. Proc. Natl. Acad. Sci. 100, 7545–7550. doi:10.1073/pnas.1331436100
Sayers, E. W., Bolton, E. E., Brister, J. R., Canese, K., Chan, J., Comeau, D. C., et al. (2022). Database resources of the national center for biotechnology information. Nucleic Acids Res. 50, D20–D26. doi:10.1093/nar/gkab1112
Schmitz, R. A., Mohammadi, S. S., van Erven, T., Berben, T., Jetten, M. S. M., Pol, A., et al. (2022). Methanethiol consumption and hydrogen sulfide production by the thermoacidophilic methanotroph Methylacidiphilum fumariolicum SolV. Front. Microbiol. 13, 857442. doi:10.3389/fmicb.2022.857442
Schmitz, R. A., Peeters, S. H., Mohammadi, S. S., Berben, T., van Erven, T., Iosif, C. A., et al. (2023). Simultaneous sulfide and methane oxidation by an extremophile. Nat. Commun. 14, 2974. doi:10.1038/s41467-023-38699-9
Schmitz, R. A., Peeters, S. H., Versantvoort, W., Picone, N., Pol, A., Jetten, M. S. M., et al. (2021). Verrucomicrobial methanotrophs: ecophysiology of metabolically versatile acidophiles. FEMS Microbiol. Rev. 45, fuab007. doi:10.1093/femsre/fuab007
Schmitz, R. A., Pol, A., Mohammadi, S. S., Hogendoorn, C., van Gelder, A. H., Jetten, M. S. M., et al. (2020). The thermoacidophilic methanotroph Methylacidiphilum fumariolicum SolV oxidizes subatmospheric H2 with a high-affinity, membrane-associated [NiFe] hydrogenase. ISME J. 14, 1223–1232. doi:10.1038/s41396-020-0609-3
Seabold, S., and Perktold, J. (2010). Statsmodels: econometric and statistical modeling with Python. in 9th Python in Science Conference, Austin, Texas, 28 June-3 July, 2010. 92–96. doi:10.25080/Majora-92bf1922-011
Simão, F. A., Waterhouse, R. M., Ioannidis, P., Kriventseva, E. V., and Zdobnov, E. M. (2015). BUSCO: assessing genome assembly and annotation completeness with single-copy orthologs. Bioinformatics 31, 3210–3212. doi:10.1093/bioinformatics/btv351
Singer, H., Steudtner, R., Sottorff, I., Drobot, B., Pol, A., den Camp, H. J. M. O., et al. (2023). Learning from nature: recovery of rare earth elements by the extremophilic bacterium Methylacidiphilum fumariolicum. Chem. Commun. 59, 9066–9069. doi:10.1039/D3CC01341C
Søndergaard, D., Pedersen, C. N. S., and Greening, C. (2016). HydDB: a web tool for hydrogenase classification and analysis. Sci. Rep. 6, 34212. doi:10.1038/srep34212
Sousa, J. S., Calisto, F., Langer, J. D., Mills, D. J., Refojo, P. N., Teixeira, M., et al. (2018). Structural basis for energy transduction by respiratory alternative complex III. Nat. Commun. 9, 1728. doi:10.1038/s41467-018-04141-8
Sun, C., Benlekbir, S., Venkatakrishnan, P., Wang, Y., Hong, S., Hosler, J., et al. (2018). Structure of the alternative complex III in a supercomplex with cytochrome oxidase. Nature 557, 123–126. doi:10.1038/s41586-018-0061-y
Takahashi, K., Hirose, Y., Kamimura, N., Hishiyama, S., Hara, H., Araki, T., et al. (2015). Membrane-associated glucose-methanol-choline oxidoreductase family enzymes PhcC and PhcD are essential for enantioselective catabolism of dehydrodiconiferyl alcohol. Appl. Environ. Microbiol. 81, 8022–8036. doi:10.1128/AEM.02391-15
Tao, P., Li, H., Yu, Y., Gu, J., and Liu, Y. (2016). Ectoine and 5-hydroxyectoine accumulation in the halophile Virgibacillus halodenitrificans PDB-F2 in response to salt stress. Appl. Microbiol. Biotechnol. 100, 6779–6789. doi:10.1007/s00253-016-7549-x
Tatusova, T., DiCuccio, M., Badretdin, A., Chetvernin, V., Nawrocki, E. P., Zaslavsky, L., et al. (2016). NCBI prokaryotic genome annotation pipeline. Nucleic Acids Res. 44, 6614–6624. doi:10.1093/nar/gkw569
Tec-Campos, D., Posadas, C., Tibocha-Bonilla, J. D., Thiruppathy, D., Glonek, N., Zuñiga, C., et al. (2023). The genome-scale metabolic model for the purple non-sulfur bacterium Rhodopseudomonas palustris Bis A53 accurately predicts phenotypes under chemoheterotrophic, chemoautotrophic, photoheterotrophic, and photoautotrophic growth conditions. PLOS Comput. Biol. 19, e1011371. doi:10.1371/journal.pcbi.1011371
Thiele, I., and Palsson, B. Ø. (2010). A protocol for generating a high-quality genome-scale metabolic reconstruction. Nat. Protoc. 5, 93–121. doi:10.1038/nprot.2009.203
Tibocha-Bonilla, J. D., Zuñiga, C., Lekbua, A., Lloyd, C., Rychel, K., Short, K., et al. (2022). Predicting stress response and improved protein overproduction in Bacillus subtilis. NPJ Syst. Biol. Appl. 8, 50–12. doi:10.1038/s41540-022-00259-0
Varghese, N. J., Mukherjee, S., Ivanova, N., Konstantinidis, K. T., Mavrommatis, K., Kyrpides, N. C., et al. (2015). Microbial species delineation using whole genome sequences. Nucleic Acids Res. 43, 6761–6771. doi:10.1093/nar/gkv657
Vermeij, P., and Kertesz, M. A. (1999). Pathways of assimilative sulfur metabolism inPseudomonas putida. J. Bacteriol. 181, 5833–5837. doi:10.1128/jb.181.18.5833-5837.1999
Versantvoort, W., Guerrero-Castillo, S., Wessels, H. J. C. T., van Niftrik, L., Jetten, M. S. M., Brandt, U., et al. (2019). Complexome analysis of the nitrite-dependent methanotroph Methylomirabilis lanthanidiphila. Biochimica Biophysica Acta (BBA) - Bioenergetics 1860, 734–744. doi:10.1016/j.bbabio.2019.07.011
Vinuesa, P., Ochoa-Sánchez, L. E., and Contreras-Moreira, B. (2018). GET_PHYLOMARKERS, a software package to select optimal orthologous clusters for phylogenomics and inferring pan-genome phylogenies, used for a critical geno-taxonomic revision of the genus stenotrophomonas. Front. Microbiol. 9, 771. doi:10.3389/fmicb.2018.00771
Vorholt, J. A., Marx, C. J., Lidstrom, M. E., and Thauer, R. K. (2000). Novel formaldehyde-activating enzyme inMethylobacterium extorquens AM1 required for growth on methanol. J. Bacteriol. 182, 6645–6650. doi:10.1128/jb.182.23.6645-6650.2000
Walker, B. J., Abeel, T., Shea, T., Priest, M., Abouelliel, A., Sakthikumar, S., et al. (2014). Pilon: an integrated tool for comprehensive microbial variant detection and genome assembly improvement. PLOS ONE 9, e112963. doi:10.1371/journal.pone.0112963
Walker, V., and Mills, G. A. (1995). Quantitative methods for amino acid analysis in biological fluids. Ann. Clin. Biochem. 32, 28–57. doi:10.1177/000456329503200103
Waltemath, D., Adams, R., Beard, D. A., Bergmann, F. T., Bhalla, U. S., Britten, R., et al. (2011). Minimum information about a simulation experiment (MIASE). PLOS Comput. Biol. 7, e1001122. doi:10.1371/journal.pcbi.1001122
Wick, R. R., Judd, L. M., Gorrie, C. L., and Holt, K. E. (2017). Unicycler: resolving bacterial genome assemblies from short and long sequencing reads. PLOS Comput. Biol. 13, e1005595. doi:10.1371/journal.pcbi.1005595
Wilkinson, M. D., Dumontier, M., Aalbersberg, Ij. J., Appleton, G., Axton, M., Baak, A., et al. (2016). The FAIR Guiding Principles for scientific data management and stewardship. Sci. Data 3, 160018. doi:10.1038/sdata.2016.18
Ye, J.-W., Lin, Y.-N., Yi, X.-Q., Yu, Z.-X., Liu, X., and Chen, G.-Q. (2023). Synthetic biology of extremophiles: a new wave of biomanufacturing. Trends Biotechnol. 41, 342–357. doi:10.1016/j.tibtech.2022.11.010
Keywords: verrucomicrobia, thermoacidophile, methanotroph, genome-scale metabolic model, flux balance analysis
Citation: Saldivar A, Ruiz-Ruiz P, Revah S and Zuñiga C (2024) Genome-scale flux balance analysis reveals redox trade-offs in the metabolism of the thermoacidophile Methylacidiphilum fumariolicum under auto-, hetero-and methanotrophic conditions. Front. Syst. Biol. 4:1291612. doi: 10.3389/fsysb.2024.1291612
Received: 09 September 2023; Accepted: 04 January 2024;
Published: 29 January 2024.
Edited by:
Agnès Rodrigue, Institut National des Sciences Appliquées de Lyon (INSA Lyon), FranceReviewed by:
R. Adam Thompson, LanzaTech, United StatesMonika Heiner, Brandenburg University of Technology Cottbus-Senftenberg, Germany
Copyright © 2024 Saldivar, Ruiz-Ruiz, Revah and Zuñiga. This is an open-access article distributed under the terms of the Creative Commons Attribution License (CC BY). The use, distribution or reproduction in other forums is permitted, provided the original author(s) and the copyright owner(s) are credited and that the original publication in this journal is cited, in accordance with accepted academic practice. No use, distribution or reproduction is permitted which does not comply with these terms.
*Correspondence: Cristal Zuñiga, Y3p1bmlnYTJAc2RzdS5lZHU=