 Daniela Silva Santurio
 Luciana Rodrigues Carvalho Barros
- 1Computational Modeling Department, Laboratory for Scientific Computation, Petrópolis, Brazil
- 2Center for Translational Research in Oncology, Instituto Do Câncer Do Estado de São Paulo, Hospital Das Clínicas da Faculdade de Medicina Do Universidade de São Paulo, São Paulo, Brazil
CAR-T cell immunotherapy involves genetically reprogrammed T-lymphocytes that interact with cancer cells and activate an anti-tumor immune response. This therapy has been approved for clinical use for hematological cancers, but new challenges have emerged in the treatment of solid tumors. Some of the challenges include the heterogeneity of antigen expression found in solid tumors, including antigen-positive non-tumoral cells, the immune inhibitory molecule expression, and CAR-T cell trafficking difficulty within the tumor microenvironment. We proposed a mathematical model to describe the “on-target” and “off-tumor” effects of CAR-T cell therapy on gliomas, and we investigated which parameters influenced the final outcome using a global sensitivity analysis. Our model highlights the dynamics of CAR-T cell therapy, tumor, and healthy populations (antigen-positive glia, antigen-negative glia, and neurons), and it provides novel insight into the consequences of “on-target” “off-tumor” effects, particularly in the neuronal loss.
1 Introduction
Gliomas are the most common malignant disease ofthe adult central nervous system, with estimated total cases of around 300,000 worldwide (IARC, 2020). In Brazil, central nervous system neoplasms represent approximately 5% of all tumors (5.22% for men, 4.17% for women) according to INCA (Brazilian National Institute of Cancer, estimative for 2020). Glioblastoma is the most common type of glioma. The current standard-of-care treatment for gliomas consists of surgery, radiotherapy, and chemotherapy with temozolomide. Moreover, tumor location makes surgical resection extremely difficult and with the potential to cause severe side effects. The use of immunotherapies for treating cancer greatly impacts patients’ overall survival. A combined adoptive cell transfer and gene therapy, known as Chimeric Antigen Receptor T (CAR T) cells), has been approved by several regulatory agencies for the treatment of hematological malignancies (Elsallab et al., 2020). In this treatment, the patient’s own T-lymphocytes are genetically reprogrammed to recognize antigens expressed by tumor cells, and upon contact, they become activated and kill the target. For hematological cancers (leukemias and lymphomas), this therapy has been successfully applied, but for solid tumors (carcinomas, sarcomas, and melanomas), new challenges have emerged.
Gliomas now have over 50 clinical trials using CAR-T cells registered on clinicaltrials.gov, making them the most common solid malignancy treated with CAR-T cell therapy (Barros et al., 2022). The most common CAR-T cell targets are disialoganglioside GD2, epidermal growth factor receptor (EGFR), HER2, IL-3Rα2, and B7H3 (Elsallab et al., 2020; Prapa et al., 2021). Moreover, another challenge with CAR-T cell therapy is the heterogeneous antigen expression on tumor cells, which can be circumvented by multi-target therapy. In a very recent success of a first-in-human trial using GD2-CAR-T cells by sequential intravenous (IV) and intracerebroventricular (ICV) delivery, safety and early signs of clinical activity were observed (NCT04196413) (Prapa et al., 2021; Majzner et al., 2022). Toxicity was observed at the tumor location and the off-tumor effect was not observed, but several neurological symptoms were observed related to an inflammation in the central nervous system, called tumor inflammation-associated neurotoxicity. Four patients received GD2-CAR-T cells and responded to therapy in the following weeks. However, all patients presented an increase in tumor volume after treatment, despite the ICV delivery.
Antigen expression heterogeneity presented by solid tumors, the hostile microenvironment, and the CAR-T cell trafficking between the injection site and the tumor are some of the factors that have been studied to better understand the therapy dynamics (Marofi et al., 2021). Another concern is the antigen target, which is not exclusively expressed by the tumor cells, and the overall off-tumor effects on healthy cell populations are yet to be evaluated. Although “off-tumor” effects are critical in CAR-T cell therapy, pre-clinical studies using human tumor cell lines xenografts on immunodeficient mouse models are not adequate to evaluate this effect, because human protein expression is restricted to the tumor cell line. Even a very small antigen expression can cause serious or fatal adverse events (Morgan et al., 2010; Van Den Berg et al., 2015). Several strategies based on the CAR structure or in combination are taken to avoid severe side effects, but the target antigen is still the key (Safarzadeh Kozani et al., 2021; Sterner and Sterner, 2021). On the other hand, human trials are emerging, and safety is still the primary endpoint, but the “off-tumor” effect is hard to evaluate directly in situ by biopsies. To help address this point, we propose a mathematical model to describe the “on-target” “off-tumor” effect of CAR-T cell therapy for gliomas. Other mathematical models involving gliomas were developed with a distinct focus such as neuron-glia interaction under chemotherapy (Iarosz et al., 2015), predicting the efficacy of surgery (Swanson, Rostomily and Alvord, 2008), or radiotherapy (Rockne et al., 2010). More recently, a mathematical model for CAR-T cell therapy for glioma used in vitro real-time cytotoxicity experiments to parametrize a so-called CARRGO model (Sahoo et al., 2020). This model was extended to assume more than one CAR-T cell binding to the glioma cell (Liu et al., 2021). Also evaluating an off-tumor effect on CD19+ cells, a dual-target CAR-T cells and glioma model was developed to simulate an increase in CAR-T cell expansion in order to overcome the profound suppressive microenvironment (León-Triana et al., 2021).
2 Materials and Methods
We assumed that a single dose of CAR-T cells was introduced into the tumor site as an adoptive therapy. The dynamics of CAR-T cells rely on their ability to expand, to naturally die, the inhibition they undergo due to the existence of tumor cells, and their cytotoxic effect in populations that present the antigen. As we are dealing with a glioblastoma, both the tumor and glial cells can be affected by the treatment. Ideally, the target antigen would be expressed exclusively by the tumor cells. However, as it is not the case for glioma and GD2-CAR-T cells, a small fraction of healthy glial cells could express it. We divide the glial cells into two populations: antigen-positive (sensible to CAR-T cell mediated death) and antigen-negative (not sensible/resistant to CAR-T cell mediated death). All tumor cells were considered sensible to CAR-T cells. Both are logistically growing and compete for nutrients and space with the tumor. The depletion of sensible glial cells will lead to an irreversible neuronal loss, given that the neuronal population depends on glial cells to survive and has no proliferative capacity. Finally, the tumor shows logistic growth and can either be inhibited by a particular type of glia cell—the microglia—or by the CAR-T cells (Figure 1).
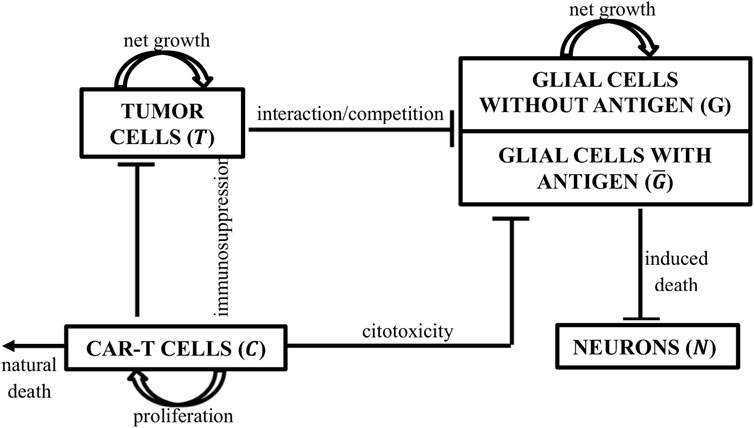
FIGURE 1. Schematic representation of the populations considered in the model and their interactions. CAR-T cells (C) proliferate and have a cytotoxic effect on tumor cells and antigen-positive glial cells (G) (sensible). Tumor cells (T) proliferate, inhibit CAR-T cells, and compete with all glial cell populations. Glial cells were divided into two subpopulations, antigen-positive and -negative populations, according to the CAR-T cell target antigen. Only antigen-positive glial cells are sensitive to CAR-T cell cytotoxicity. All glial cells proliferate, compete with the tumor, and are responsible for neuronal (N) survival.
2.1 Mathematical Model
The mathematical model presented in this paper is comprised of an ODE system that describes the interplay between a tumor population
The first right-hand side term in Eq. 1 corresponds to the CAR-T cell proliferation due to the interaction with antigen-positive populations, which are tumor cells
In Eq. 2, the first term stands for the glioma growth defined by standard logistic law with carrying capacity
In Eq. 3–4 the glial cells also present logistic growth with a net rate
The interaction between all healthy cells, namely the neurons (N) and glial populations (G + G), is presented in Eq. 5. Glial cells are indispensable to neuron elasticity and are required both in vitro and in vivo for neuron survival. (Clarke, Lumsden and McInnes, 2001) demonstrated that the kinetics of neuronal loss in many forms of both inherited and acquired neurodegeneration can be described as an exponential decay. (Clarke and Lumsden, 2005b) show that a stretched exponential is also well suited to the description of neuronal cell death in complex tissues, and (Clarke and Lumsden, 2005a) evaluate different frequency distributions for neuronal death in which the risk factors vary within the population; for example, due to regional heterogeneities in the cellular microenvironment. In order to investigate the impact of CAR-T cell treatment on neuronal loss, our model uses the same approach proposed by (Iarosz et al., 2015), described using Eq. 5, which represents an exponentially decaying function of
which modulates the decrease in the neuron population when the glial concentration decreases and a null contribution if the glial concentration is null or positive.
Thus, the presented model describes the effects of the biological dynamics between tumoral, CAR-T, and healthy populations in the brain. With a set of twelve positive parameters as described in the next section, we used the explicit fourth-order Runge–Kutta method as the numerical procedure to solve the mathematical system of equations. We believe that the proposed model will provide insights into several aspects of population dynamics and can be used to investigate the roles of each individual parameter on therapy outcome. These issues are investigated in the next section.
2.2 Parameter Estimation
This model presents several parameters to be estimated. In some scenarios, numerical ranges could be found in the biological literature. However, when no relevant information was provided, we chose parameter values that allowed the model to behave in a biologically plausible manner. Table 1 provides a summary of the parameter descriptions as well as their numerical values, and we will next describe and detail the data used in the simulations.
2.2.1 CAR-T Cells
Monitoring real-time CAR-T cells in the brain is impractical, and very few studies around the world use this experimental therapy for gliomas. One of the reasons that led us to develop a mathematical model is to investigate system dynamics with existing data, which might guide new experiment designs and provide accurate data for mathematical models. On the other hand, CAR-T cell dynamics for leukemia have been explored in the last 10 years, easily assessable by the blood and bone marrow. The biology of CAR-T cells per se is independent of the tumor diagnosis, as T cells from patients are modified in vitro and maintain the same characteristics.
In Eq. 1,
The CAR-T cells lifespan
2.2.2 GBM Cells
Using only routinely available pre-treatment MRIs to inform the patient-specific proliferation rate for glioblastoma cells, (Rockne et al., 2010) found a range of approximately
2.2.3 Healthy Cells
In Eqs. 3–5, it is assumed that healthy cells proliferate at a slower rate than cancer cells, meaning that
Simulating the interaction of normal and cancer cells in a primary site, (Pinho, Freedman and Nani, 2002) define the ratio between the normal (
In order to be feasible to perform the treatment with CAR-T cells, it is necessary to carefully choose the target antigen which, ideally, the molecule should be overexpressed on tumor tissues, with zero or low expression on normal cells (Wei et al., 2019). Because of competitive advantage of the cancer cells, and through the cancer hypothesis, we consider that
3 Results
3.1 Initial Tumor Burden and CAR-T Dosage Affect the Outcome
Our first study focused on understanding the changes in the population dynamics under different initial conditions of tumor load and CAR-T cell dose. It is worthy to note that a healthy individual would be described by the state variables
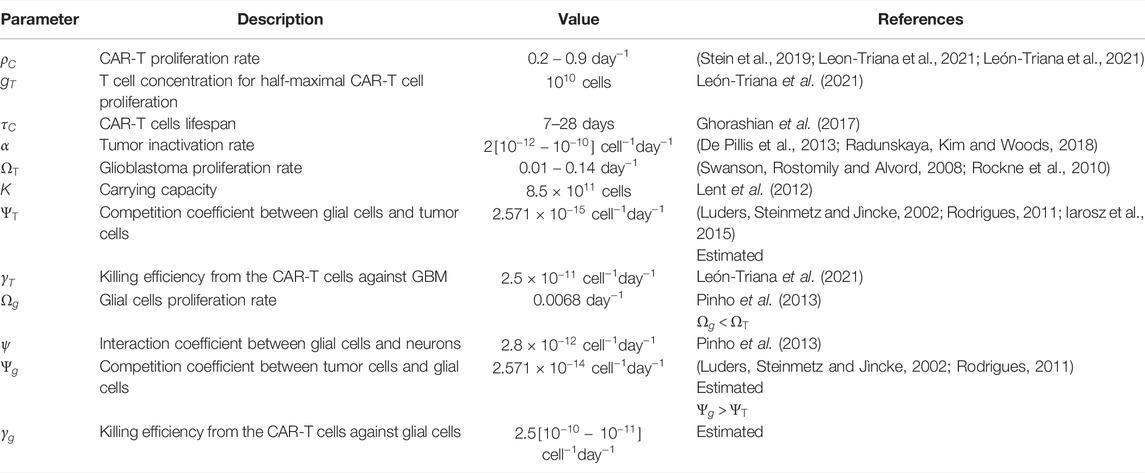
At a starting tumor burden equivalent to 2.5% of the carrying capacity, for CAR-T doses ranging from 5.107 to 5.109 cells, a significant reduction in the tumor cells was observed. The decay phase ends 2–3 weeks after the CAR-T injection, which is a reasonable dynamic, since the CAR-T cell expansion phase peaks around day 20. The therapy was able to control tumor growth in silico for 120 days, which could provide a window of opportunity for other therapies (Figure 2A). CAR-T cell peak and function were dose-dependent (Figure 2C).
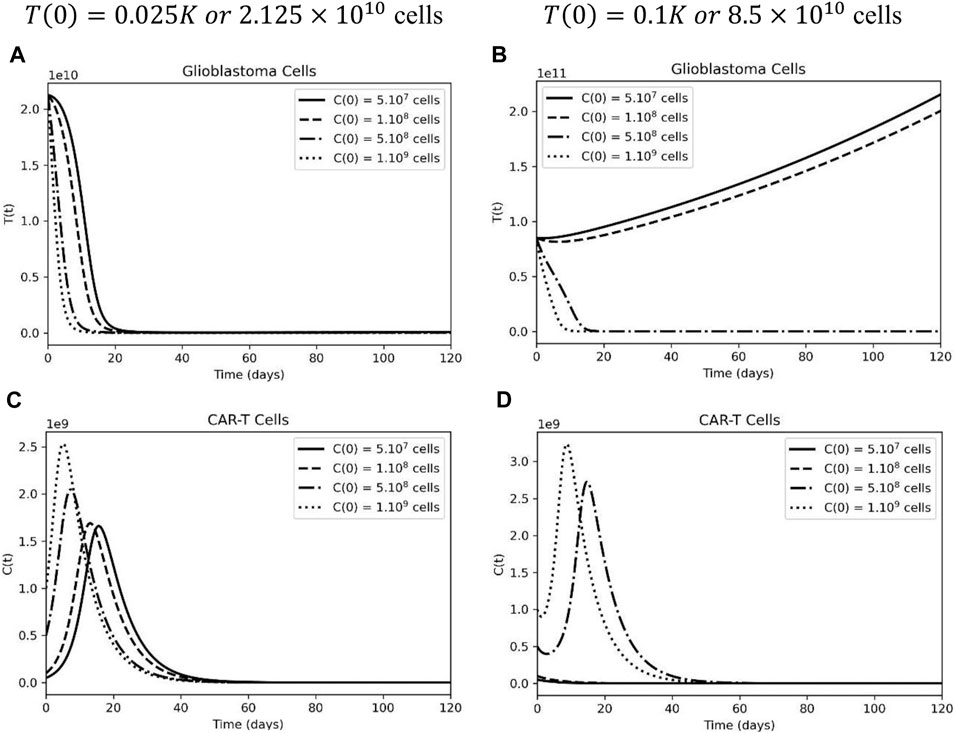
FIGURE 2. Higher CAR-T cell doses are able to control small, but not high, tumor load in glioblastoma. (A) Temporal evolution of glioblastoma cells considering an initial tumor burden representing 2.5% of the carrying capacity: 7(0) = 0.025K. (B) Temporal evolution of glioblastoma cells considering an initial tumor burden representing 10% of the carrying capacity: T(0) = 0.1K. (C) Different dynamics of CAR-T cells, considering a smaller initial tumor burden and (D) a higher tumor burden equivalent to 10% of the carrying capacity. The simulations were performed for the parameters defined in Supplementary Table S1. The curves correspond to different values of CAR-T cells injected, using C(0) = 5×10⁷ cells (solid lines), C(0) 108 cells (dashed lines), C(0) = 5×10⁸ cells (dashed-dotted lines), and C(0) = 109 (dotted lines).
Surgical resection is one of the first lines of treatment for gliomas; however, if the tumor’s location makes the patient inoperable, the initial tumor burden for CAR-T cell treatment will be greater. Figure 2B depicts two types of tumor response dynamics based on the initial dose of CAR-T cells. There is no tumor control under treatment at doses lower than
Considering the highest dose of CART-cells,
3.2 Off-Tumor Activity Increases Neuronal Loss
Next, we used the mathematical model as a tool to tackle the problem of the “on-target” “off-tumor” effect on healthy antigen-positive populations. As a first test, we increased the dose of the CAR-T injection. When compared to tumor cells, antigen-positive glial cells have a similar population dynamic with a low initial tumor burden (Figure 3A). The higher the CAR-T cell dose, the faster these cells are killed, and by day 20 of treatment, the population is completely extinguished. On the other hand, after increasing the initial tumor load, a distinct scenario was observed; CAR-T cells did not expand due to an elevated inhibitory microenvironment, and the depletion of the antigen-positive glial cell population occurred more slowly (Figure 3B) according to our model.
FIGURE 3. High tumor load leads to a decrease in sensitive and resistant glial cells upon CAR-T cell treatment. (A) Sensible glial cells were extinct by CAR-T cells when considering an initial tumor burden representing 2.5% of the carrying capacity: T(0) = 0.025K, but not at a higher tumor burden of T(0) = 0.1K (). (C) Rapid decrease followed by proliferation of resistant glial cells at lower tumor burden. (D) Resistant glial cells also decrease upon CAR-T cell treatment under a higher initial tumor load. The simulations were performed for the parameters defined in Supplementary Table S1. The curves correspond to different values of CAR-T cells injected using C(0) = 5×10⁷ cells (solid lines), C(0) = 108 cells (dashed lines), C(0) = 5×10⁸ cells (dashed-dotted lines), and C(0) = 109 cells (dotted lines)
Furthermore, glial cells that do not display the antigen on their surface are subject only to inter-specific competition with tumor cells. When it was possible to obtain a significant reduction in the tumor mass, the antigen-negative population returned to a proliferative state (Figure 3C), which is not the case when the tumor load was higher (Figure 3D).
Neuronal dynamics are directly correlated with glial cell behavior and, therefore, will also be subject to variations according to the number of injected CAR-T cells and initial tumor size. In Figure 4A, we assume that 90% of the total glial cell population does not express the antigen, and in this scenario, higher doses of CAR-T cells result in less neuronal loss. That is because the treatment causes a rapid and significant decrease in antigen-expressing cells (
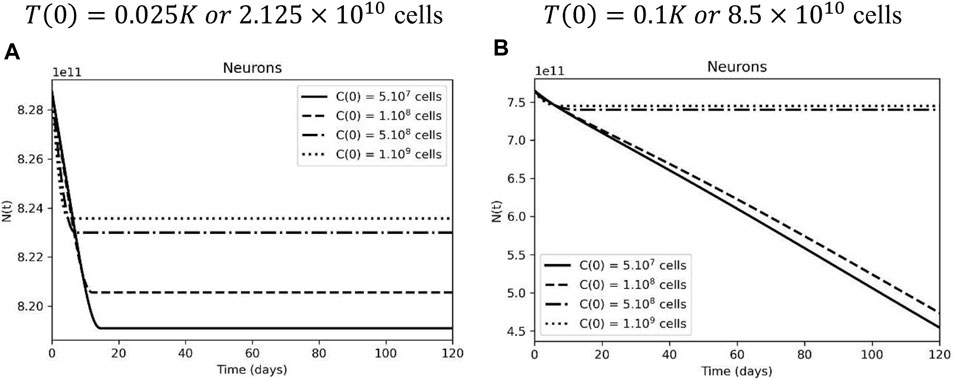
FIGURE 4. Inefficient CAR-T cell therapy leads to more neuronal loss due to glial cell loss. (A) Neurons in the following days after treatment, when glial cell support is compromised by CAR-T cell therapy, considering an initial tumor burden representing 2.5% of the carrying capacity. (B) Neurons are preserved after higher doses of CAR-T cell therapy at a higher initial tumor load, but they are lost when the tumor escapes. The simulations were performed for the parameters defined in Supplementary Table S1. The curves correspond to different values of CAR-T cells injected, using C(0) = 5×10⁷ cells (solid lines), C(0) = 108 cells (dashed lines), C(0) = 5×10⁸ cells (dashed-dotted lines), and 1 C(0) = 109 cells (dotted lines).
To investigate the neuronal loss according to the glial cell population, we fixed the CAR-T cell dose and tested several glial cell support capacities. A higher initial tumor load leads to a higher neuronal loss, especially when the sensible glial cell population is more affected (Figure 5). Again, this result points to a higher tumor burden promoting greater inhibition of glial cells, negatively impacting neuronal dynamics. It is still a difficult task to evaluate whether the degree of this neuronal loss will lead to clinical symptoms since the lesion location and the previous neuron function play an important role and was not included in the developed model and simulations.
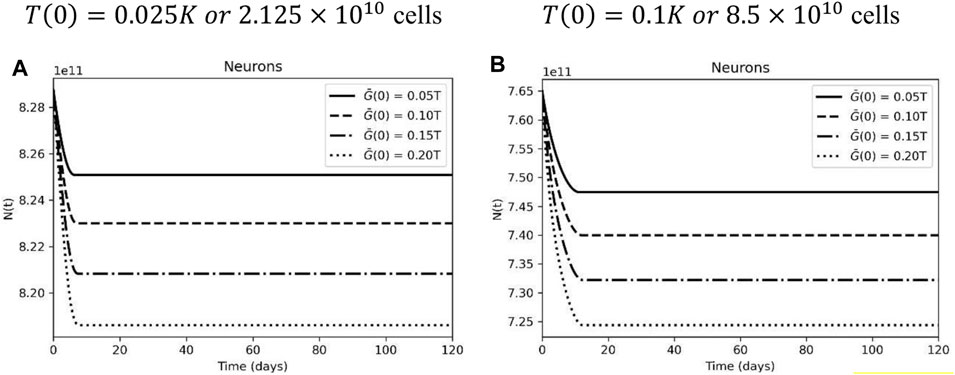
FIGURE 5. Neuronal dynamic according to glial cell carrying capacity. (A) Neuronal loss in the following days after treatment, with different glial cell carrying capacity, considering an initial tumor burden representing 2.5% of the carrying capacity. (B) Neuronal loss after CAR-T cell treatment with a high initial tumor load and different glial cell carrying capacity. CAR-T cell initial dose of C(0) = 5×10⁸ cells. The curves correspond to different levels of antigen expression, using G(0) = 0.1T (0) (solid lines), G(0) = 0.15T (0) (dashed lines), G(0) = 0.2T(0) (dashed-dotted lines), and G(0) = 0.25T (0) (dotted lines). The simulations were performed for the parameters defined in Supplementary Table S1.
3.3 Sensitivity Analysis
In models with several uncertain inputs, it is interesting to know which ones can have a significant impact on the outputs. Indeed, it is well known that, in many cases, only a small number of input variables actually act in the model (Lamboni et al., 2013). With this knowledge in mind, it is possible to identify which mechanisms are most relevant to real system dynamics (Saltelli et al., 2019; Da Silva et al., 2020).
As the initial conditions were already evaluated, we performed a sensitivity analysis on the model in order to identify which are the most sensitive parameters to define the overall response. With such analysis, we aim to increase our understanding of the relationships between input uncertainty and output, identify which parameters drive the model dynamics, find errors in the model if a relationship is not biologically reasonable, and even guide future in vivo experiments.
The analysis was executed by the SALib package (Herman and Usher, 2017), and the range for each parameter was defined accordingly to the values found in the literature (see Supplementary Table S2) and was sampled uniformly using the saltelli.sample (Sobol, 2001; Campolongo, Saltelli and Cariboni, 2011; Herman and Usher, 2017; Owen, 2020). The first-order Sobol indexes were obtained using the delta.analyze routine (Borgonovo, 2007; Plischke, Borgonovo and Smith, 2013). The initial conditions were set as:
After the sensitivity analysis, the most significant parameters were analyzed individually, keeping the same initial conditions and parameters from Table 1, while different values within the testing range were simulated.
3.3.1 Tumor
Based on the analysis, it is clear that three main parameters will have the greatest influence on the outcome: the tumor proliferation rate (
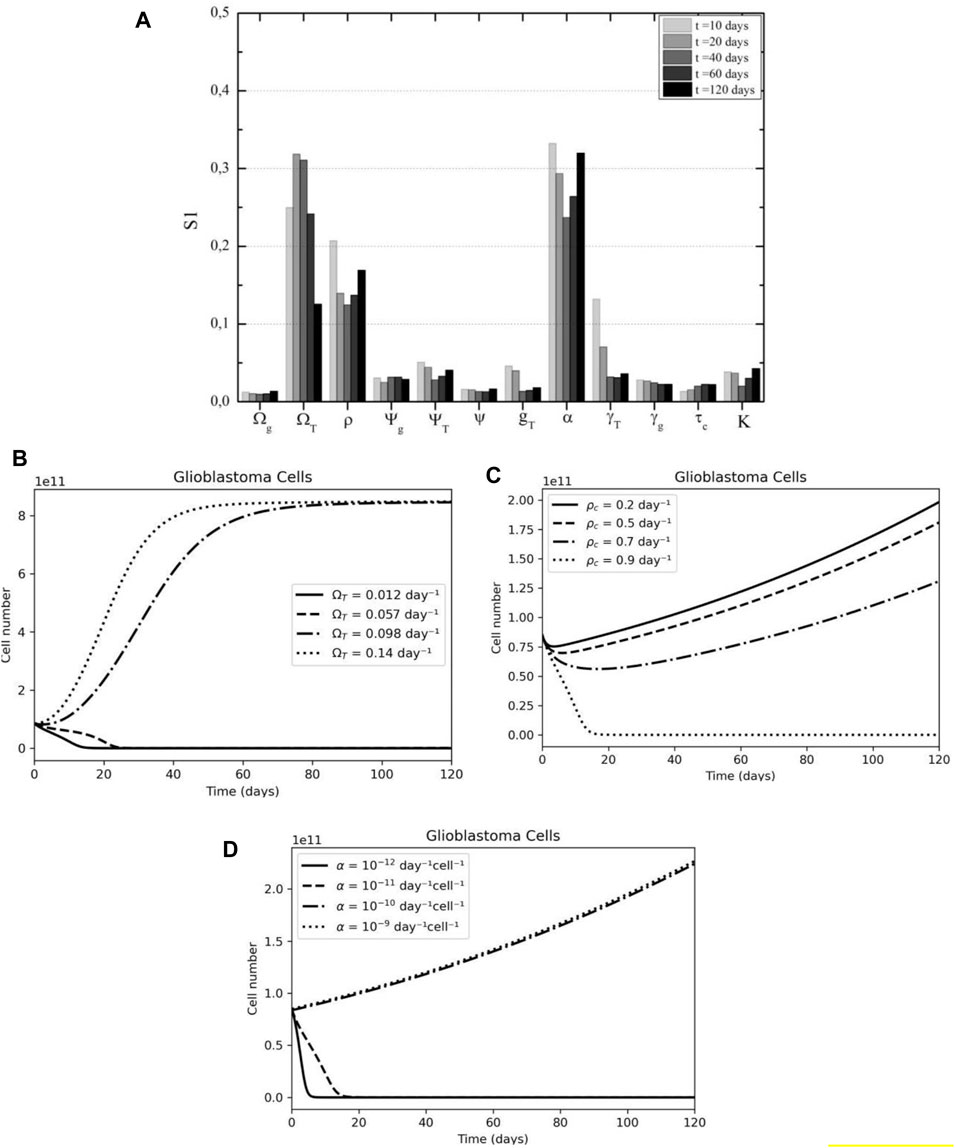
FIGURE 6. Tumor cell sensibility analysis according to time after therapy (A) CAR-T proliferation, tumor proliferation, and CAR-T inhibition by tumor are the main parameters in the overall response according to First Sobol's indices, especially in the first days after treatment. (B) The effect of tumor growth rate (ΩT) variation on tumor dynamics. (C) The effect of CAR-T cell proliferation rate (pC) variation on tumor dynamics. (D) The effect of immunosuppressive rate (α) variation on tumor dynamics.
Examining only the effect of the respective parameters on the model, we found good agreement with the sensitivity analysis results. Firstly, after the first 2 weeks of treatment, the tumor dynamics change significantly depending on the glioblastoma growth rate; either the disease is under control or the tumor already escaped and the carrying capacity has been reached (Figure 6B). The model suggests that the first 20 days are crucial in the response to CAR-T cell therapy.
Secondly, the rate of CAR-T cell proliferation is negatively related to the number of tumor cells; that is, the higher the activation of CAR-T cells, the smaller the tumor mass (Figure 6C). Notably, for the initial conditions and parameters used in this simulation, only a proliferation rate similar to the highest described in the literature would be effective in preventing disease progression. That being said, this is a question that needs to be investigated further for solid tumors, since pre-clinical models’ results showed a lower proliferative capacity than those found in hematological cancers (Liu et al., 2021) (LIU et al., 2021).
Finally, it was observed that the treatment is effective only in the presence of low tumor immunosuppression (Figure 6D). In this case, CAR-T cells are able to overcome the hostile microenvironment and promote a long-lasting tumor response while the tumor continued growing after the therapy. A combination with an immune checkpoint blockade therapy could benefit patients under CAR-T cell therapy for solid tumors.
3.3.2 CAR-T Cells
Assuming the dynamics of CAR-T cells as the quantity of interest, in Figure 7A we observe that four parameters display greater relevance to the model variance. In the first weeks, the proliferation rate (
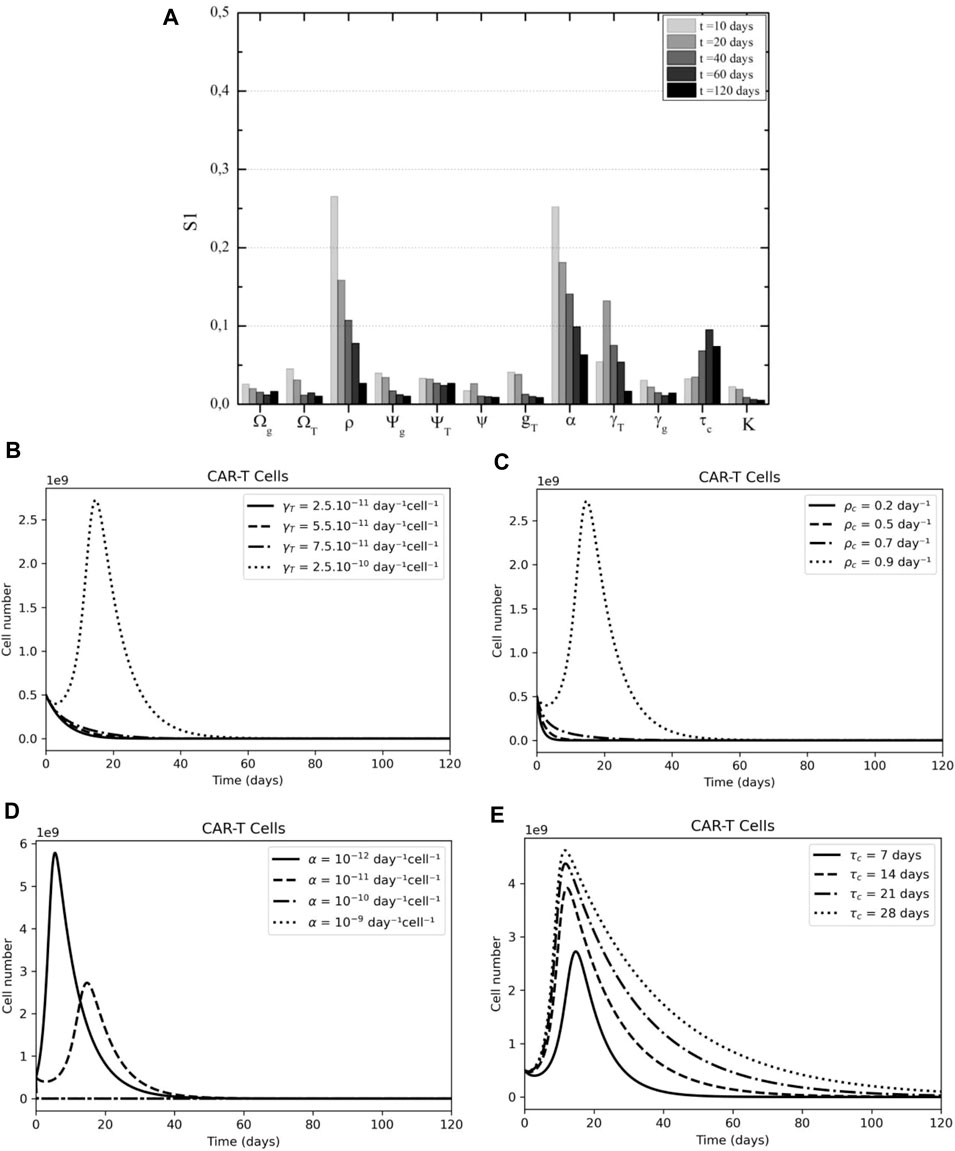
FIGURE 7. CAR-T cell sensibility analysis according to time after therapy. (A) CAR-T cell proliferation, cytotoxicity, and persistence are key to tumor elimination according to First Sobol's indices. (B) The effect of CAR-T killing rate (γT) variation on CAR-T dynamics. (C) The effect of CAR-T cell proliferation rate (pC) variation on CAR-T dynamics. (D) The effect of immunosuppressive rate (α) variation on CAR-T dynamics. (E) The effect of CAR-T lifespan (τC) variation on CAR-T dynamics.
3.3.3 Glial Cells
The proliferation rate of CAR-T cells and tumor immunosuppression are important parameters in the dynamics of both antigen-positive and antigen-negative cells within the glial populations. The cytotoxic effect of CAR-T cells on antigen-positive cells, in particular, has the greatest impact on model variance (Figure 8A), whereas, for those that do not present the antigen, tumor cell carrying capacity and tumor cell proliferation becomes more important (Figure 8B).

FIGURE 8. Glial cells sensitivity analysis according to time after therapy. (A) CAR-T cell cytotoxicity on sensible glial cells is the most important parameter in this population in the first days after CAR-T cell therapy, according to First Sobol's indices for antigen-positive glial cells. (B) Tumor carrying capacity and growth rate are the most impacting parameters on resistant glial cell populations, according to First Sobol's indices for antigen-negative glial cells.
In terms of the mortality rate of antigen-positive cells due to treatment, if tumor cells have a competitive advantage over these glial cells, that is,
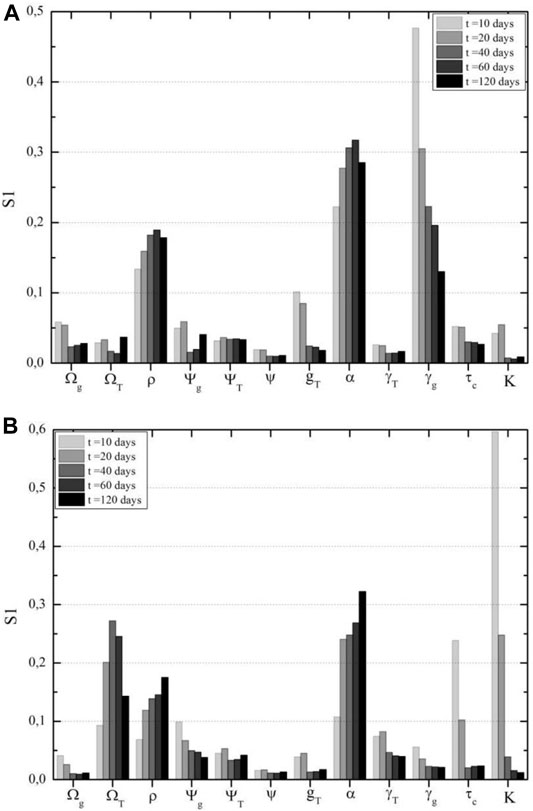
FIGURE 9. Glial cells sensitivity analysis according to time after therapy. (A) CAR-T cell cytotoxicity on sensible glial cells is the most important parameter in this population in the first days after CAR-T cell therapy, according to First Sobol's indices for antigen-positive glial cells. (B) Tumor carrying capacity and growth rate are the most impacting parameters on resistant glial cell populations, according to First Sobol's indices for antigen-negative glial cells.
The tumor’s carrying capacity only at high values generates a change in behavior pattern in the population of resistant glial cells; this is due to the fact the tumor can grow continuously, and the competition with healthy cells becomes more significant (Figure 10A). A higher tumor proliferation rate inhibits the survival of healthy cells through competition (Figure 10B). The higher the tumor inhibition (
FIGURE 10. The effect of CAR-T cell parameters on antigen-negative glial cell dynamics. (A) Variations in the carrying capacity (K) variation on antigen-negative glial cells have a small effect on this population number. (B) Higher tumor growth rate (ΩT) leads to higher competition and elimination of antigen-negative glial cells. (C) A higher immunosuppressive rate (α) leads to a decrease in the antigen-negative glial cells population. (D) A higher CAR-T cell proliferation rate (pc) leads to an increase in the antigen-negative glial cells due to tumor elimination.
3.3.4 Neurons
The sensitivity analysis for neurons reveals that the interaction coefficient with glia cells (
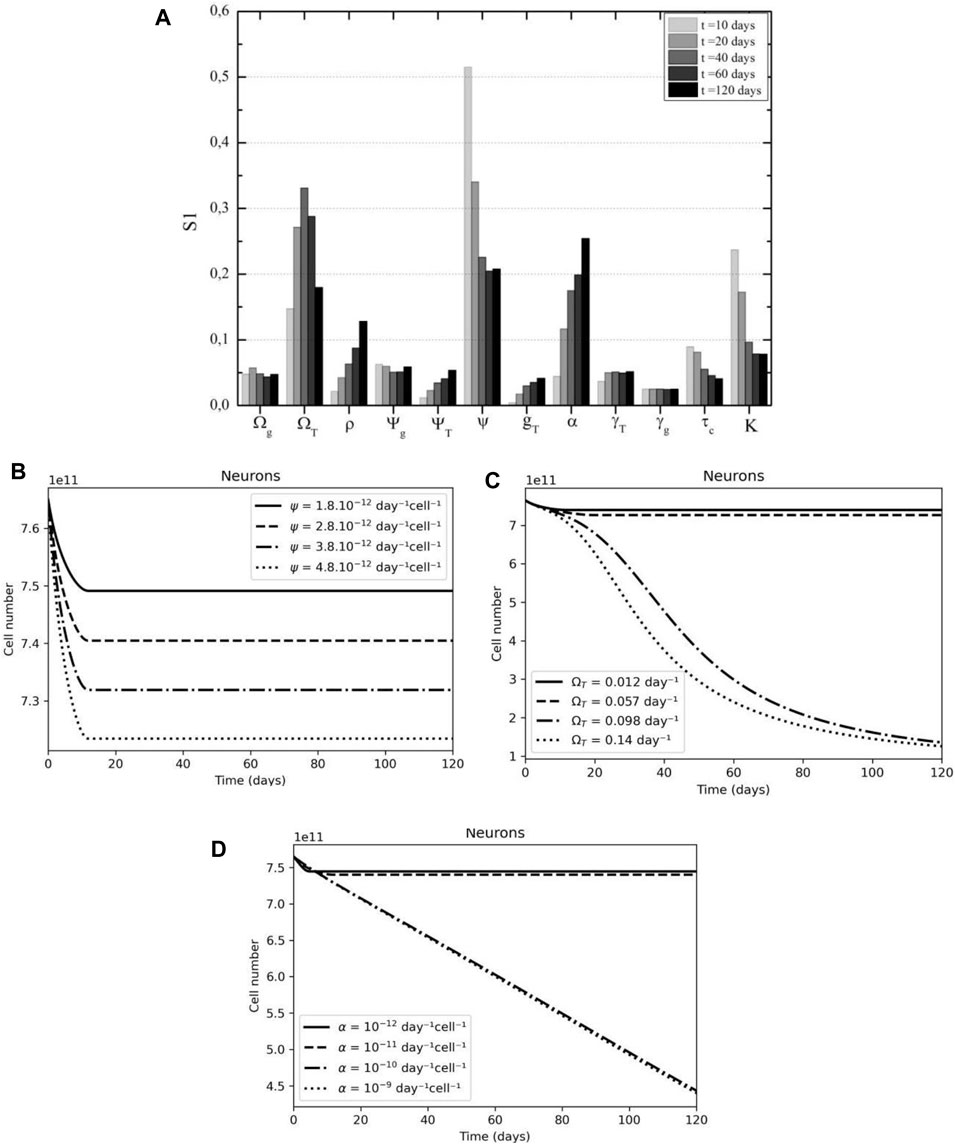
FIGURE 11. Glial cell support and tumor proliferation are key parameters of neuron dynamics. (A) Neuron’s interaction with glial cells is key in the early days after CAR-T cell treatment, followed by tumor proliferation, according to First Sobol's indices. (B) A higher interaction coefficient rate (ψ) results in higher neuron death. (C) A higher tumor growth rate (ΩT) leads to a higher neuronal loss. (D) A higher tumor immunosuppressive rate (α) also leads to a higher on neuronal loss.
An increase in the interaction coefficient between neurons and glia results in a proportional increase in neuronal death (Figure 11B). Figures 11C,11D show analogous behavior for glioblastoma growth rate and immunosuppressive capacity; the higher any of the two parameters, the greater the possibility of tumor escape and, as a result, death of neurons in healthy populations.
4 Discussion
We developed a mathematical model based on an ODE system to simulate five populations: tumor, CAR-T cells, neurons, and two populations of healthy glial cells, which can be sensible or resistant to CAR-T cell therapy. We include, in the simulation as a parameter the immunosuppressive microenvironment, the consequences of an “off-tumor” effect on a third-party, and the analysis of variables to which the phenomenon is more sensitive. One of the major issues of CAR therapy in solid tumors is the selection of a target that maximizes anti-tumor activity while minimizing side effects (Flynn et al., 2017). Because of their lack of specificity in protein expression, most solid tumors demonstrate the potential for significant on-target off-tumor effects (Richman et al., 2018).
Although mathematical models are particularly useful for qualitative analysis of system dynamics, their application has limitations. With this in mind, the proposed model was developed assuming: (i) a given dose of CAR-T cells directly is introduced into the tumor site: for glioblastomas, the trafficking of CAR-T cells into the parenchymal tissue and subsequent penetration into the brain–blood barrier (BBB) is still a challenge that the treatment must overcome (Gatto et al., 2022). However, intracavitary and intraventricular infusion are promising techniques for overcoming the BBB and trying to prevent cell exhaustion before they reach the microenvironment (BROWN et al., 2018). The same approach is being used in ongoing clinical trials (NCT04196413, NCT04385173, and NCT04077866). (ii) CAR-T cells are considered activated T cells and have a cytotoxic effect on any antigen-positive cells; this is a simplified representation of a population comprised of effector and memory phenotypes. For GBM xenografts, (Wang et al., 2018) observed that CD4+ (memory) CAR-T cell effector potency was compromised when coapplied with CD8+ (effector) T cells, and CD4+(memory) CAR-T cells did not improve the CD8+ (effector) CAR-T cell. Though since we intend to analyze the cytotoxic activity of CAR-T cells on different populations in our model, the memory phenotype is not explicit. (iii) The target antigen can be expressed by glial cells. For a human neuroblastoma xenograft in vivo, (Richman et al., 2018) showed that a GD2+CAR-T cell induced an anti-tumor response but was also associated with lethal central nervous system (CNS) toxicity, which included extensive CAR-T-cell infiltration and proliferation within the brain as well as neuronal destruction. To assess the consequences of shared expression of the target antigen between healthy and tumor populations, we assume that a fraction of glial cells are also killed by CAR-T cells. (iv) Neuronal death is caused uniquely by glial cell depletion. (Fricker et al., 2018) reveal that neurons die in at least a dozen ways and that non-neuronal cells also contribute to neuronal death. Since our work proposes to investigate the off-tumor cytotoxic activity of CAR-T cells, it is feasible for the model to associate neuronal death with glia cell depletion. The CNS contains three types of glial cells: astrocytes, oligodendrocytes, and microglia. Astrocytes are the most abundant glial cells, and they play important roles in synapse formation and ion homeostasis. Microglia represent the brain’s immune system and thus act as phagocytes in various injuries and inflammatory diseases. Oligodendrocytes play a role in neuroprotection against degeneration (Chavda et al., 2022). Each of these populations interacts differently with neurons, implying that the interaction coefficient must be coherent with the tumor’s histology.
Our mathematical model’s simulations suggest that for resected tumors, a feasible dose of activated CAR-T cells reduces the initial tumor load, thereby also extinguishing all normal cells that presented the antigen. Despite the tumor’s limited immunosuppressive effect and the target antigen being displayed in glial cells as well as tumor cells, the level of expression is only sufficient for a modest expansion of the CAR-T cells. This scenario is favorable to glial cell survival and, thereby, a small neuronal loss, but it could eventually lead to tumor relapse. These findings corroborated with the work of (León-Triana et al., 2021), who also suggest that addressing this issue may be technically impossible since the number of T cells available to manufacture the CAR product is orders of magnitude lower than the threshold required for therapy success. Also, following infusion, our model was able to capture a transient decrease of CAR-T cells due to tumor inhibition, which affects CAR-T cell proliferation and is in accordance to (Sahoo et al., 2020). We did not consider the number of interactions between CAR-T and tumor cells (Li et al., 2022). The CAR-T cell early distribution phase only lasts for a couple of days and is generally not captured in most clinical trials (Liu et al., 2021). Our work sheds light on CAR-T cell cytotoxicity on tumor cells and also an “on-target” “off-tumor” effect, affecting directly the healthy glial cells which are sensible or resistant to CAR-T cell therapy, and as a consequence, the neuron population decrease.
Data Availability Statement
The original contributions presented in the study are included in the article/Supplementary Material, and further inquiries can be directed to the corresponding author.
Author Contributions
DS designed and performed the experiments and wrote the manuscript. LB works on study conceptualization and wrote and revised the manuscript.
Funding
This research was funded by a scholarship provided by Conselho Nacional de Desenvolvimento Científico e Tecnológico (CNPq).
Conflict of Interest
The authors declare that the research was conducted in the absence of any commercial or financial relationships that could be construed as a potential conflict of interest.
Publisher’s Note
All claims expressed in this article are solely those of the authors and do not necessarily represent those of their affiliated organizations, or those of the publisher, the editors, and the reviewers. Any product that may be evaluated in this article, or claim that may be made by its manufacturer, is not guaranteed or endorsed by the publisher.
Acknowledgments
The authors thank the support granted by CNPq.
Supplementary Material
The Supplementary Material for this article can be found online at: https://www.frontiersin.org/articles/10.3389/fsysb.2022.923085/full#supplementary-material
References
Barros, L. R. C., Couto, S. C. F., da Silva Santurio, D., Paixão, E. A., Cardoso, F., da Silva, V. J., et al. (2022). Systematic Review of Available CAR-T Cell Trials Around the World. Cancer Immunology Research 14 (11), 2667. doi:10.3390/cancers14112667
Barros, L. R. C., Paixão, E. A., Valli, A. M. P., Naozuka, G. T., Fassoni, A. C., and Almeida, R. C. (2021). CARTmath-A Mathematical Model of CAR-T Immunotherapy in Preclinical Studies of Hematological Cancers. Cancers 13 (12), 2941. doi:10.3390/cancers13122941
Borgonovo, E. (2007). A New Uncertainty Importance Measure. Reliab. Eng. Syst. Saf. 92 (6), 771–784. doi:10.1016/j.ress.2006.04.015
Campolongo, F., Saltelli, A., and Cariboni, J. (2011). From Screening to Quantitative Sensitivity Analysis. A Unified Approach. Comput. Phys. Commun. 182 (4), 978–988. doi:10.1016/j.cpc.2010.12.039
Chavda, V., Singh, K., Patel, V., Mishra, M., and Mishra, A. K. (2022). Neuronal Glial Crosstalk: Specific and Shared Mechanisms in Alzheimer's Disease. Brain Sci. 12, 75. doi:10.3390/brainsci12010075
Clarke, G., and Lumsden, C. J. (2005a). Heterogeneous Cellular Environments Modulate One-Hit Neuronal Death Kinetics. Brain Res. Bull. 65 (1), 59–67. doi:10.1016/j.brainresbull.2004.11.009
Clarke, G., Lumsden, C. J., and McInnes, R. R. (2001). Inherited Neurodegenerative Diseases: The One-Hit Model of Neurodegeneration. Hum. Mol. Genet. 10 (20), 2269–2275. doi:10.1093/hmg/10.20.2269
Clarke, G., and Lumsden, C. J. (2005b). Scale-free Neurodegeneration: Cellular Heterogeneity and the Stretched Exponential Kinetics of Cell Death. J. Theor. Biol. 233 (4), 515–525. doi:10.1016/j.jtbi.2004.10.028
Da Silva, F. A. B. (2020). A Tutorial on Sobol’ Global Sensitivity Analysis Applied to Biological Models. Netw. Syst. Biol. 32, 93–118. doi:10.1007/978-3-030-51862-2_6
dePillis, L., Caldwell, T., Sarapata, E., and Williams, H. (2013). “Mathematical Modeling of Regulatory T Cell Effects on Renal Cell Carcinoma Treatment,” in Discrete and Continuous Dynamical Systems - Series B, 18, 915–943. doi:10.3934/dcdsb.2013.18.915
Elsallab, M., Levine, B. L., Wayne, A. S., and Abou-El-Enein, M. (2020). CAR T-Cell Product Performance in Haematological Malignancies before and after Marketing Authorisation. Lancet Oncol. 21 (2), e104–e116. doi:10.1016/S1470-2045(19)30729-6
Flynn, J. P., O’Hara, M. H., and Gandhi, S. J. (2007). Preclinical rationale for combining radiation therapy and immunotherapy beyond checkpoint inhibitors (i.e., CART). Transl. Lung Cancer Res. 6, 159–168. doi:10.21037/tlcr.2017.03.07
Fricker, M., Tolkovsky, A. M., Borutaite, V., Coleman, M., and Brown, G. C. (2018). Neuronal Cell Death. Physiol. Rev. 98, 813–880. doi:10.1152/physrev.00011.2017.-Neuronal
Gatto, L., Di Nunno, V., Franceschi, E., Tosoni, A., Bartolini, S., and Brandes, A. A. (2022). Pharmacotherapeutic Treatment of Glioblastoma: Where Are We to Date? Drugs 82, 491–510. doi:10.1007/s40265-022-01702-6
Ghorashian, S., Kramer, A. M., Albon, S. J., Wright, G., Castro, F., Popova, B., et al. (2017). A Novel Low Affinity CD19CAR Results in Durable Disease Remissions and Prolonged CAR T Cell Persistence without Severe CRS or Neurotoxicity in Patients with Paediatric ALL. Blood 130, 806. doi:10.1182/blood.v130.suppl_1.806.806
Herman, J., and Usher, W. (2017). SALib: An Open-Source Python Library for Sensitivity Analysis. Joss 2 (9), 97. doi:10.21105/joss.00097
Iarosz, K. C., Borges, F. S., Batista, A. M., Baptista, M. S., Siqueira, R. A. N., Viana, R. L., et al. (2015). Mathematical Model of Brain Tumour with Glia-Neuron Interactions and Chemotherapy Treatment. J. Theor. Biol. 368, 113–121. doi:10.1016/j.jtbi.2015.01.006
Kuznetsov, V. A., Kuznetsov, V., Makalkin, I., Taylor, M., and Perelson, A. (1994). Nonlinear Dynamics of Immunogenic Tumors: Parameter Estimation and Global Bifurcation Analysis. Bull. Math. Biol. doi:10.1016/s0092-8240(05)80260-5
Lamboni, M., Iooss, B., Popelin, A.-L., and Gamboa, F. (2013). Derivative-based Global Sensitivity Measures: General Links with Sobol' Indices and Numerical Tests. Math. Comput. Simul. 87, 45–54. doi:10.1016/j.matcom.2013.02.002
Lent, R., Azevedo, F. A. C., Andrade-Moraes, C. H., and Pinto, A. V. O. (2012). How Many Neurons Do You Have? Some Dogmas of Quantitative Neuroscience under Revision. Eur. J. Neurosci. 35 (1), 1–9. doi:10.1111/j.1460-9568.2011.07923.x
León-Triana, O., Pérez-Martínez, A., Ramírez-Orellana, M., and Pérez-García, V. M. (2021). Dual-Target Car-Ts with on- and Off-Tumour Activity May Override Immune Suppression in Solid Cancers: A Mathematical Proof of Concept. Cancers 13 (4), 703. doi:10.20944/preprints202012.0166.v1
León-Triana, O., Sabir, S., Calvo, G. F., Belmonte-Beitia, J., Chulián, S., Martínez-Rubio, Á., et al. (2021). CAR T Cell Therapy in B-Cell Acute Lymphoblastic Leukaemia: Insights from Mathematical Models. Commun. Nonlinear Sci. Numer. Simul. 94, 105570. doi:10.1016/j.cnsns.2020.105570
Li, R., Sahoo, P., Wang, D., Wang, Q., and Brown, C. E. (2022). Modeling Interaction of Glioma Cells and CAR T-Cells Considering Multiple CAR T-Cells Bindings, 1–12. arXiv preprint arXiv:2201.07353.
Liu, C., Ayyar, V. S., Zheng, X., Chen, W., Zheng, S., Mody, H., et al. (2021). Model-Based Cellular Kinetic Analysis of Chimeric Antigen Receptor-T Cells in Humans. Clin. Pharmacol. Ther. 109 (3), 716–727. doi:10.1002/cpt.2040
Lüders, E., Steinmetz, H., and Jäncke, L. (2002). Brain Size and Grey Matter Volume in the Healthy Human Brain. Neuroreport 13 (17), 2371–2374. doi:10.1097/01.wnr.0000049603.85580.da
Majzner, R. G., Ramakrishna, S., Yeom, K. W., Patel, S., Chinnasamy, H., Schultz, L. M., et al. (2022). GD2-CAR T Cell Therapy for H3K27M-Mutated Diffuse Midline Gliomas. Nature 603 (7903), 934–941. doi:10.1038/s41586-022-04489-4
Marofi, F., Motavalli, R., Safonov, V. A., Thangavelu, L., Yumashev, A. V., Alexander, M., et al. (2021). CAR T Cells in Solid Tumors: Challenges and Opportunities. Stem Cell Res. Ther. 12. doi:10.1186/s13287-020-02128-1
Morgan, R. A., Yang, J. C., Kitano, M., Dudley, M. E., Laurencot, C. M., and Rosenberg, S. A. (2010). Case Report of a Serious Adverse Event Following the Administration of T Cells Transduced with a Chimeric Antigen Receptor Recognizing ERBB2. Mol. Ther. 18 (4), 843–851. doi:10.1038/mt.2010.24
Nani, F., and Freedman, H. I. (2000). A Mathematical Model of Cancer Treatment by Immunotherapy. Math. Biosci. 163 (2), 159–199. doi:10.1016/S0025-5564(99)00058-9
Owen, A. B. (2020). ‘On Dropping the First Sobol’ Point’. arXiv preprint arXiv:2008.08051 [Preprint]. Available at: http://arxiv.org/abs/2008.08051.
Pinho, S. T. R., Bacelar, F. S., Andrade, R. F. S., and Freedman, H. I. (2013). A Mathematical Model for the Effect of Anti-angiogenic Therapy in the Treatment of Cancer Tumours by Chemotherapy. Nonlinear Anal. Real World Appl. 14 (1), 815–828. doi:10.1016/j.nonrwa.2012.07.034
Pinho, S. T. R., Freedman, H. I., and Nani, F. (2002). A Chemotherapy Model for the Treatment of Cancer with Metastasis. Math. Comput. Model. 36, 773–803. doi:10.1016/s0895-7177(02)00227-3
Plischke, E., Borgonovo, E., and Smith, C. L. (2013). Global Sensitivity Measures from Given Data. Eur. J. Operational Res. 226 (3), 536–550. doi:10.1016/j.ejor.2012.11.047
Prapa, M., Chiavelli, C., Golinelli, G., Grisendi, G., Bestagno, M., Di Tinco, R., et al. (2021). GD2 CAR T Cells against Human Glioblastoma. npj Precis. Onc. 5 (1), 1–14. doi:10.1038/s41698-021-00233-9
Radunskaya, A., Kim, R., Kim, R., and Woods II, T. (2018). Mathematical Modeling of Tumor Immune Interactions: A Closer Look at the Role of a PD-L1 Inhibitor in Cancer Immunotherapy. Spora 4 (1), 25–41. doi:10.30707/SPORA4.1Radunskaya
Richman, S. A., Nunez-Cruz, S., Moghimi, B., Li, L. Z., Gershenson, Z. T., Mourelatos, Z., et al. (2018). High-Affinity GD2-specific CAR T Cells Induce Fatal Encephalitis in a Preclinical Neuroblastoma Model. Cancer Immunol. Res. 6 (1), 36–46. doi:10.1158/2326-6066.CIR-17-0211
Rockne, R., Rockhill, J. K., Mrugala, M., Spence, A. M., Kalet, I., Hendrickson, K., et al. (2010). Predicting the Efficacy of Radiotherapy in Individual Glioblastoma Patientsin Vivo:a Mathematical Modeling Approach. Phys. Med. Biol. 55 (12), 3271–3285. doi:10.1088/0031-9155/55/12/001
Rodrigues, D. S. (2011). Modelagem Matemática em câncer: dinâmica andiogênica e quimioterapia anti-neoplásica. Master’s Thesis. Botucatu: Instituto de Biociências, UNESP.
Safarzadeh Kozani, P., Rahbarizadeh, F., and Khoshtinat Nikkhoi, S. (2021). Strategies for Dodging the Obstacles in CAR T Cell Therapy. Front. Oncol. 11 (April), 1–20. doi:10.3389/fonc.2021.627549
Sahoo, P., Yang, X., Abler, D., Maestrini, D., Adhikarla, V., Frankhouser, D., et al. (2020). Mathematical Deconvolution of CAR T-Cell Proliferation and Exhaustion from Real-Time Killing Assay Data. J. R. Soc. Interface. 17 (162), 20190734. doi:10.1098/rsif.2019.0734
Saltelli, A., Aleksankina, K., Becker, W., Fennell, P., Ferretti, F., Holst, N., et al. (2019). Why So Many Published Sensitivity Analyses Are False: A Systematic Review of Sensitivity Analysis Practices. Environ. Model. Softw. 114, 29–39. doi:10.1016/j.envsoft.2019.01.012
Sobol, I. M. (2001). Global Sensitivity Indices for Nonlinear Mathematical Models and Their Monte Carlo Estimates. Math. Comput. Simul. doi:10.1016/s0378-4754(00)00270-6
Stein, A. M., Grupp, S. A., Levine, J. E., Laetsch, T. W., Pulsipher, M. A., Boyer, M. W., et al. (2019). Tisagenlecleucel Model-Based Cellular Kinetic Analysis of Chimeric Antigen Receptor-T Cells. CPT Pharmacometrics Syst. Pharmacol. 8 (5), 285–295. doi:10.1002/psp4.12388
Sterner, R. C., and Sterner, R. M. (2021). CAR-T Cell Therapy: Current Limitations and Potential Strategies. Blood Cancer J. 11 (4). doi:10.1038/s41408-021-00459-7
Swanson, K. R., Rostomily, R. C., and Alvord, E. C. (2008). A Mathematical Modelling Tool for Predicting Survival of Individual Patients Following Resection of Glioblastoma: A Proof of Principle. Br. J. Cancer 98 (1), 113–119. doi:10.1038/sj.bjc.6604125
Toma, A., Régnier-Vigouroux, A., Mang, A., Becker, S., Schuetz, T. A., and Buzug, T. M. (2012). In-silico Modelling of Tumour-Immune System Interactions for Glioblastomas. IFAC Proc. Vol. 45 (2), 1237–1242. doi:10.3182/20120215-3-at-3016.00219
Trobia, J., Tian, K., Batista, A. M., Grebogi, C., Ren, H.-P., Santos, M. S., et al. (2021). Mathematical Model of Brain Tumour Growth with Drug Resistance. Commun. Nonlinear Sci. Numer. Simul. 103, 106013. doi:10.1016/j.cnsns.2021.106013
Van Den Berg, J. H., Gomez-Eerland, R., van de Wiel, B., Hulshoff, L., van den Broek, D., Bins, A., et al. (2015). Case Report of a Fatal Serious Adverse Event upon Administration of T Cells Transduced with a MART-1-specific T-Cell Receptor. Mol. Ther. 23 (9), 1541–1550. doi:10.1038/mt.2015.60
Wang, D., Aguilar, B., Starr, R., Alizadeh, D., Brito, A., Sarkissian, A., et al. (2018). Glioblastoma-targeted CD4+ CAR T Cells Mediate Superior Antitumor Activity. JCI insight 3 (10). doi:10.1172/jci.insight.99048
Keywords: CAR-T cell, glioma, mathematical model, global sensitivity analysis, off-tumor effect
Citation: Santurio DS and Barros LRC (2022) A Mathematical Model for On-Target Off-Tumor Effect of CAR-T Cells on Gliomas. Front. Syst. Biol. 2:923085. doi: 10.3389/fsysb.2022.923085
Received: 18 April 2022; Accepted: 31 May 2022;
Published: 14 July 2022.
Edited by:
Russell C. Rockne, Beckman Research Institute, City of Hope, United StatesReviewed by:
Heyrim Cho, University of California, United StatesRamRup Sarkar, National Chemical Laboratory (CSIR), India
Copyright © 2022 Santurio and Barros. This is an open-access article distributed under the terms of the Creative Commons Attribution License (CC BY). The use, distribution or reproduction in other forums is permitted, provided the original author(s) and the copyright owner(s) are credited and that the original publication in this journal is cited, in accordance with accepted academic practice. No use, distribution or reproduction is permitted which does not comply with these terms.
*Correspondence: Luciana Rodrigues Carvalho Barros, bHVjaWFuYS5yY2JhcnJvc0BoYy5mbS51c3AuYnI=