 Abigail Espina
 Eduardo Mendoza1,2,3
 Angelyn Lao
94% of researchers rate our articles as excellent or good
Learn more about the work of our research integrity team to safeguard the quality of each article we publish.
Find out more
ORIGINAL RESEARCH article
Front. Syst. Biol., 23 June 2022
Sec. Data and Model Integration
Volume 2 - 2022 | https://doi.org/10.3389/fsysb.2022.907957
This article is part of the Research TopicSystems Biology, Women in Science 2021/22: Data and Model IntegrationView all 9 articles
Alzheimer’s Disease (AD) is a neurodegenerative disorder that causes drastic structural brain atrophy and affects multiple brain functions. Cerebral glucose hypometabolism, associated with senile plaque density formation, is a pre-symptomatic feature of AD and significantly contributes to AD’s future development and progression. As cerebral glucose metabolism gradually slows down due to advanced aging, a healthy adult brain experiences an 8% decrease in cerebral glucose metabolic rate (CGMR) compared to a decline of 20%–40% CGMR in AD patients. To bridge the increasing brain energy gap caused by glucose hypometabolism, ketone bodies (KBs) are used as a supplementary source of energy as cerebral KB metabolism remains unaffected in AD patients. Ketogenic interventions such as Medium-Chain Triglyceride (MCT)-induced treatment can help augment the brain’s energy source availability and might delay further cognitive decline. With this, we constructed a mathematical model on cerebral glucose and KB metabolism to illustrate the drastic effects of glucose hypometabolism on healthy aging individuals, Mild Cognitive Impairment (MCI) subjects, and AD patients. Through the generated simulations, we have shown that KB concentration levels rise during prolonged starvation, and in consideration of glucose hypometabolism, MCT-induced intervention increases the concentration levels of acetyl-CoA (AC) in MCI/AD patients. Furthermore, MCT-induced supplement helps increase the AC concentration levels in healthy adults under normal conditions.
Ketone bodies are water-soluble lipids that serve as supplementary source of energy when there is insufficient energy supply in extra-hepatic organs such as the brain and heart. They are produced in the liver and are transported to the brain through monocarboxylate transporters, passing through a semi-permeable membrane called the blood-brain barrier (BBB) (Guzmán and Blázquez, 2004; Brady, et al., 2011; McKenna, et al., 2012; Koch et al., 2017; Le Foll and Christelle, 2019). During prolonged starvation, hepatic KB production can rise to 100–185 g/day, providing sufficient energy supply for various brain functions (Cunnane, et al., 2016; Longo, et al., 2019).
To bridge the widening brain energy level gap prompted by degenerating glucose metabolism in certain neurodegenerative diseases such as Mild Cognitive Impairment (MCI) and Alzheimer’s Disease (AD), studies recommend the implementation of ketogenic interventions such as medium-chain triglyceride (MCT)-induced intervention (Henderson, 2008; Nugent et al., 2014; Hertz et al., 2015; Cunnane et al., 2016). MCTs are water-soluble saturated fats that are convertible to ketone bodies through hepatic ketogenesis (Marten et al., 2006; Pizzorno and Murray, 2020). MCT-induced intervention can help increase brain energy levels and delay further neuronal dysfunction caused by AD (Reger et al., 2004; Henderson, 2008; Newport, 2008; Gandotra and Kour, 2014; Swaminathan and Gregory, 2014; VanItallie, 2015; Cunnane, et al., 2016; Ohnuma, et al., 2016; Croteau, et al., 2018).
Energy metabolism is described by a series of biochemical reactions in ATP production, including glycolysis, pyruvate to AC conversion, and TCA cycle. Glucose is the primary substrate in cellular metabolism. In the brain, glucose is transported to the BBB by the glucose transporter Glut1 through facilitated diffusion and is carried into the neurons through the high-capacity glucose transporter Glut3 (Duelli and Kuschinsky, 2001; McKenna, et al., 2012; Benarroch, 2014). Glut1 and Glut3 facilitate over 95% of glucose transport to the brain (Duelli and Kuschinsky, 2001; McKenna, et al., 2012; Benarroch, 2014). Glucose is then metabolized through glycolysis, a catabolic process in cellular respiration that is a prerequisite to the Tricarboxylic Acid (TCA) cycle. As shown in Figure 1, glycolysis is a sequence of 10 irreversible enzymatic reactions which occur in the cytosol of the cell. In the initial phase, two ATP molecules are bound to a magnesium ion to form Adenosine Triphosphate Magnesium (Mg-ATP). Mg-ATP is catalyzed by enzyme hexokinase to phosphorylate glucose, resulting in Glucose-6-phosphate (Glucose-6-P). Glucose-6-P is catalyzed by phosphohexose isomerase to produce Fructose-6-P. Through Phosphofructokinase 1 (PFK1), Fructose-6-P will be converted to Fructose-1, 6-bisphosphate (Fructose-1,6-diP). Along with the remaining enzymatic reactions in the glycolytic pathway, glycolysis yields 2 pyruvate molecules, 2 NADH molecules, and 4 ATP molecules. In Figure 2, pyruvate undergoes decarboxylation and is catalyzed by the enzyme pyruvate dehydrogenase complex to AC. Through the TCA cycle, AC is oxidized to produce ATP (McKenna, et al., 2012; Lenzen, 2014).
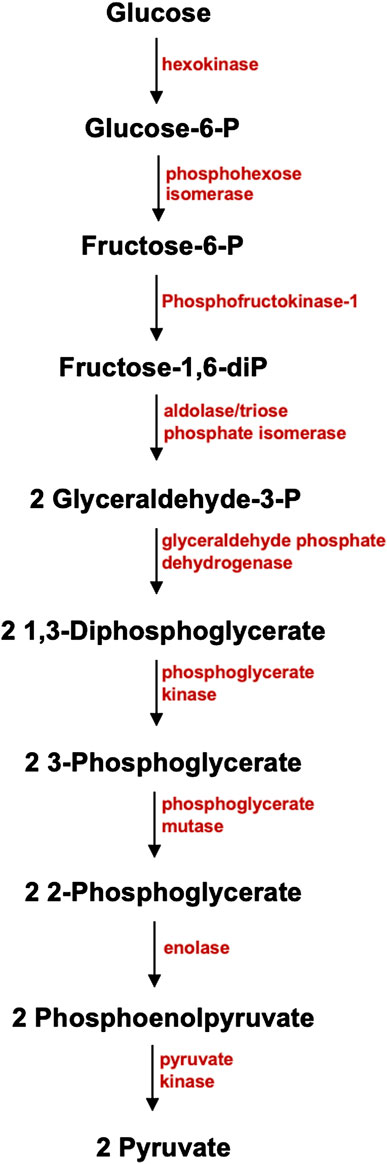
FIGURE 1. Glycolytic Pathway. Glycolysis, one of the main metabolic pathways in cellular respiration that takes place in the cytosol of the cell, involves 10 enzymatic reactions. Glucose, a 6-carbon water-soluble molecule, is carried by a glucose transporter. In the preparatory phase, two ATP molecules are used for the phosphorylation of glucose, which results to Glucose-6-P. Glucose-6-P is catalyzed by phosphohexose isomerase to produce Fructose-6-P. Catalyzed by Phosphofructokinase 1 (PFK1), Fructose-6-P will be converted to Fructose-1, 6-bisphosphate (Fructose-1,6-diP). Along with the other 8 enzymatic reactions, glycolysis will yield 2 Pyruvate molecules, 2 NADH molecules, and 4 ATP molecules as its end results.
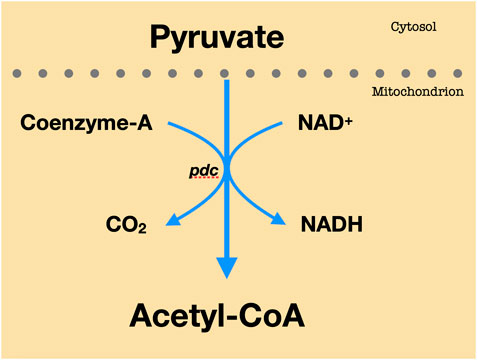
FIGURE 2. Pyruvate to AC conversion. Every molecule of pyruvate loses carbon dioxide. The remaining two carbons are then transported to the enzyme CoA to yield Acetyl-CoA.
An adult brain consumes ∼21–30 μmol ATP/g/min for total energy utilization (Attwell and Laughlin, 2001; McKenna, et al., 2012). The topography of brain metabolism changes as people approach advanced aging (Goyal, et al., 2017). A normal aging human brain experiences metabolic changes, mainly characterized by the loss of brain aerobic glycolysis (Goyal, et al., 2017). In the advanced years, healthy adults experience a 6%–8% decline in their cerebral glucose metabolic rate (CGMR) while patients with AD and Mild Cognitive Impairment (MCI) suffer a significant fall of 20%–40% in local brain regions such as frontal, parietal, and temporal lobes (Hoyer et al., 1988). The deteriorating glucose uptake and metabolism in the brain could lead to a decrease in pyruvate levels, and consequently, to a decline in AC production. Furthermore, the drop in both cerebral pyruvate and AC levels directly affects ATP production.
KBs are produced in the liver through a catabolic process called ketogenesis (Owen, 2005; Marten, et al., 2006; Pizzorno and Murray, 2020). Hepatic ketogenesis refers to the production of ketone bodies in the liver (beta-hydroxybutyrate, acetoacetate, and acetone) through fatty-acid beta-oxidation (Rui, 2014). KBs, particularly beta-hydroxybutyrate and acetoacetate, serve as a subsidiary energy source when there is insufficient glucose supply in the bloodstream. Under normal conditions, the concentration level of KBs is less than 0.1 mmol/L and the use of KBs in the brain is trivial since cerebral processes are dependent on glucose uptake and utilization (Cahill et al., 2003). Owen (2005) mentioned that during prolonged starvation, the concentration levels of KBs exponentially rise and will start to plateau on the 18th day of starvation.
Figure 3 shows the circulating concentrations of β-OHB (X3) and Actl (X4) in obese yet normal adults who fasted for 40 days (Cahill and Veech, 2003). The concentration levels of β-OHB (X3) and Actl (X4) of an adult may rise to 5–8 mmol/L and 1–2 mmol/L, respectively. In the case of diabetic ketoacidosis, the concentration levels of β-OHB (X3) and Actl (X4) may range from 10 to 20 mmol/L and 2.5–5 mmol/L, respectively.
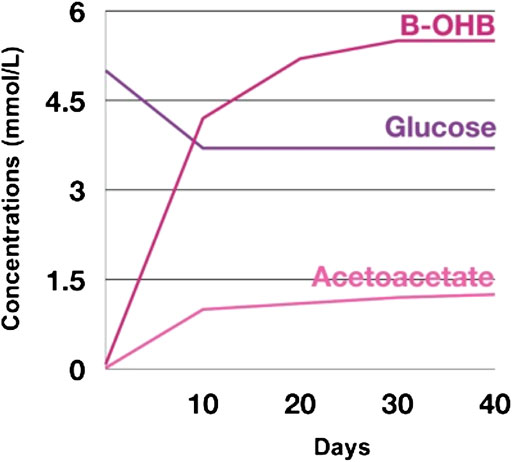
FIGURE 3. Concentrations of β-OHB, glucose, and Actl in human adults under 40 days of fasting.
Since fatty acids cannot pass through the BBB, the brain’s principal auxiliary source of energy is the beta-hydroxybutyrate which is transferred into cerebrospinal fluid with a Km of 2–4 mmol/L during starvation (Cahill and Veech, 2003). Hepatic KBs can be produced at a rate of 100–150 g/day, which can cover up to 70% of the brain’s energy requirement (Cunnane, et al., 2016).
Astrocytes, described as star-shaped glial cells and the most numerous type of cell in the central nervous system, are the main site for fatty acid oxidation (β-oxidation) in the brain (Sofroniew and Harry, 2010; Siracusa, et al., 2019; Souza, et al., 2019). Note that this is the only type of cells in the central nervous system that can utilize fatty acids for oxidative metabolism (Edmond, et al., 1987; Auestad, et al., 1991). AC in the astrocytes is synthesized by β-ketothiolase to form acetoacetyl-CoA. Acetoacetyl-CoA can form acetoacetate in three ways. First is by producing an intermediate metabolite HMG-CoA to form acetoacetate by enzymes β-ketothiolase and HMG- CoA lyase, respectively. The second way is by forming acetoacetate directly from acetoacetyl-CoA by the enzyme acetoacetyl-CoA deacylase. And the last is through a reversible reaction by succinyl-CoA β-ketoacid CoA transferase that produces the by-products succinate and succinyl-CoA. On the other hand, AC interacts with other substrates to initialize the TCA cycle (McKenna, et al., 2012).
Several studies propose the use of ketogenic intervention to better the cognitive performance of AD patients (Reger et al., 2004; Henderson, 2008; Gandotra and Kour, 2014; Swaminathan and Gregory, 2014; VanItallie, 2014; Cunnane, et al., 2016; Ohnuma, et al., 2016; Croteau, et al., 2018). A common ketogenic intervention used in these studies is the administration of MCT-induced treatment (Reger et al., 2004; Farah, 2014; Swaminathan and Gregory, 2014; Cunnane, et al., 2016; Ohnuma, et al., 2016; Croteau, et al., 2018). The Ingested MCT, catalyzed by enzyme lipase, produces β-OHB which in turn will be catalyzed by β-hydroxybutyrate dehydrogenase to form acetoacetate (Lee, et al., 2021) (refer to Figure 3: ketolysis pathway in red). Acetoacetate, together with succinyl-CoA and enzyme succinyl-CoA β-Ketoacid-CoA transferase, will then produce acetoacetyl-CoA and succinate. Then, acetoacetyl-CoA will be catalyzed by enzyme thiolase to produce AC which will then initiate the TCA cycle (McKenna, et al., 2012) (refer to Figure 3: ketolysis pathway in red).
Reger et al. (2004) stated that AD patients with no APOE-e4 allele, a genetic biomarker for AD, showed improved cognitive functions concerning precipitous increase in beta-hydroxybutyrate levels, which is said to escalate to 7.7 fold, more than an hour after the oral dose of the MCT treatment. Furthermore, in a study conducted involving 11 individuals with Type 1 diabetes, it was shown that MCT helped in progressing mental functions such as digit symbol coding and total map searching whilst preventing the decline in immediate and delayed verbal memory and verbal memory recognition during hypoglycemia (Page et al., 2009). Henderson (2008) noted the significant effects of AC-1202, an MCT variant which is consists of caprylic acid and glycerin, in elevating serum beta-hydroxybutyrate levels and improving the cognitive performance of AD patients with APOE-e4. After 3 months of treatment, AD patients with APOE-e4 experienced a 4-point or greater improvement in Alzheimer’s Disease Assessment Scale-Cognitive Subscale (ADAS-Cog) compared to the control group. In 2008, Harvey conducted a study on the effects of MCT- and long-chain triglyceride (LCT)-induced ketogenic diets on 28 individuals. The results showed that the MCT diet caused higher beta-hydroxybutyrate blood concentration levels than those with the LCT diet. Furthermore, nutritional ketosis was achieved faster through the MCT treatment. Cunnane et al. (2016) also noted that there is a direct correlation between the prescribed MCT dose and maximal plasma beta-hydroxybutyrate levels. Furthermore, he mentioned that MCT intake is relatively safe up to 1 g/kg/day, despite the reported gastrointestinal side effects experienced by the participants in the aforementioned studies. However, these studies are only limited to the effects of MCT on elevated KB levels and do not have effects on the more pronounced hallmarks of AD which are the beta-amyloid deposition and tau-tangles formation. Cunnane (2018) claimed that daily administration of 30-g MCT oil to MCI and AD patients can help bridge the escalating brain energy gap, that is, the previous 20%–40% decline in the brain energy requirement can be reduced to 10%–20%. Table 1 shows the regional metabolic rates of triglycerides and ketone bodies in mmol/L before and after the implementation of the MCT-induced ketogenic treatment.
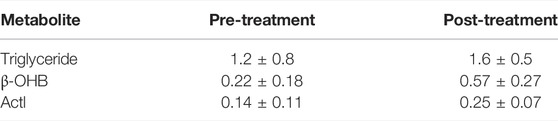
TABLE 1. Pre- and Post-Treatment Regional Metabolic Rates of KBs and Triglycerides (in mmol/L).
Glucose uptake and metabolism in adults fall due to advanced aging and certain neurodegenerative diseases like MCI and AD, leading to reduced brain energy levels (Costantini, et al., 2008; Mosconi, et al., 2008; Daulatzai, 2017). With this, we would like to demonstrate through simulations the effects of cerebral glucose uptake and metabolism on pyruvate and AC levels under healthy and deteriorating conditions. This is also to provide more insight on the presence and significance of KBs in normal and fasted conditions. As studies endorse the use of MCT-induced intervention to increase the brain energy levels of MCI and AD patients, we would like to investigate the effects of MCT on the concentration levels of the different metabolites in the brain under normal conditions and to analyze the advantages and effectiveness of administering MCT-induced ketogenic intervention to prevent or delay MCI and/or AD progression and to improve the brain energy levels in terms of AC concentration levels in MCI and AD patients.
This mathematical model is based on an existing mathematical model on KB metabolism (Mariano, 2013). The constructed model simplified an existing mathematical model and integrated glucose, glycolysis, and MCT to investigate on the effect of glucose hypometabolism and MCT to glucose and AC production. This study applied the Biochemical Systems Theory, particularly the General Mass Action (GMA) and Power Law Formalism to methodically illustrate the impact of the fluxes to the complex energy metabolism process (Savageau and Eberhard, 1987; Savageau, 1988). GMA focuses on the fluxes, that is, every process in the system is approximated and is mapped directly into one power-law term. The simplified mathematical model has 8 dependent variables and 18 independent variables (see Tables 2, 3).
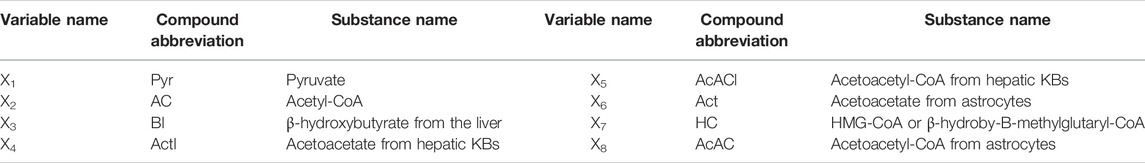
TABLE 2. List of dependent substrates.
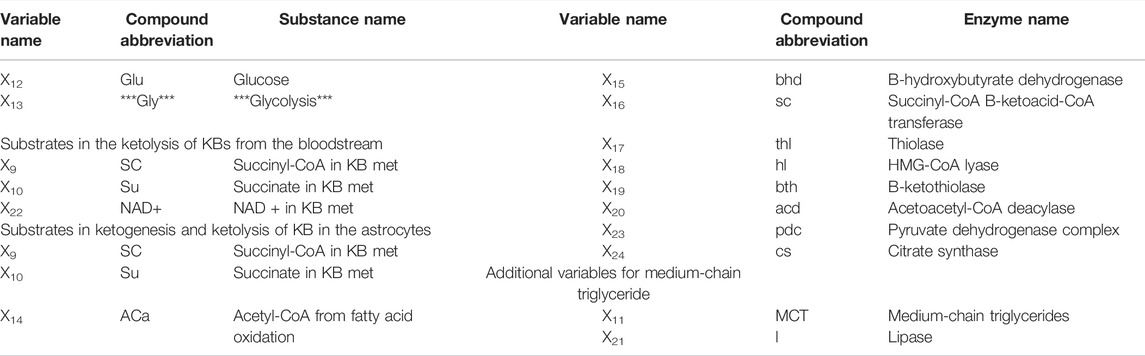
TABLE 3. List of independent substrates.
The dependent metabolites include pyruvate (X1), AC (X2), and the metabolites involved in the ketogenesis such as Act (X6), HC (X7, and AcAC (X8) and ketolysis such as β-OHB (X3), Actl (X4), and AcACl (X5) processes in the brain. Instead of modeling the entire TCA cycle, we opted to simplify the process by considering only up to AC since ATP production is greatly dependent on the availability of AC molecules. To demonstrate the impact of glucose on the pyruvate and AC levels in human adults during the well-fed state and declining conditions, we integrated glucose (X12) and glycolysis (X13) as independent variables. Furthermore, to examine the effects of MCT on the different metabolites in the energy metabolism chain, we included Triglycerides (X11) and lipase (X21), the enzyme that catalyzes triglycerides to yield KBs. The added term
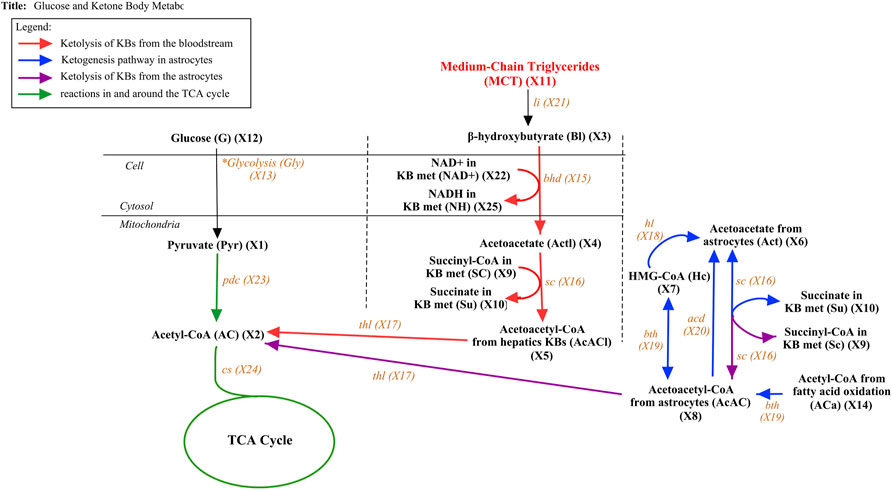
FIGURE 4. Glucose and Ketone Body metabolism with MCT from MCT oil. The figure above presents the pathway of both glucose and ketone body metabolism with additional substrate MCT. The pathway is divided into four components. The ketolysis reactions that take place in the liver are symbolized by red arrows while the ketogenesis and ketolysis reactions that occur in the astrocytes inside the brain are presented by blue and purple arrows, respectively. The reaction in and around the TCA cycle is described by green arrows while the black arrow represents the additional incorporated substrates.
Considering the metabolic pathways illustrated in Figure 4, the following mathematical model is constructed.
The initial concentration values of the metabolites (see Supplementary Table S3) are based on the data given by De Vivo and Darryl, (1978), Hall et al. (1984), Veech (2003), Yugi and Masaru, (2004), and Chalhoub (2007). The kinetic orders, rate constants, and kinetic parameters used in this study are primarily based on the values previously given by Mariano (2013), Shirashi and Savageau (1996), and Yugi and Masaru, (2004) (see Supplementary Table S4). The kinetic parameters of glucose (X12) are approximated based on the data provided by Cahill and Veech (2003). The MatLab code for the constructed model is provided for reproducibility purposes (downloadable from https://github.com/angelynlao/Modelling-the-Effects-of-MCT-on-Cerebral-KB-Metabolism.git).
In this study, we took into consideration two metabolic conditions: well-fed state and prolonged starvation. To equitably compare the concentration levels of the different metabolites under various conditions at steady state, we only considered the data involving human adults since humans of different stages have varying concentration levels of glucose and KBs (Cahill et al., 2003). Also, since we aim to investigate the AC and KB concentration levels of MCI/AD patients, it would be reasonable to compare them with that of healthy human adults and healthy aging adults. With this, we refer to healthy human adults in a well-fed state (normal condition) as the control group.
Considering the established mathematical model presented, Figure 5 shows the concentration levels of the dependent metabolites in a healthy human adult in a well-fed state.
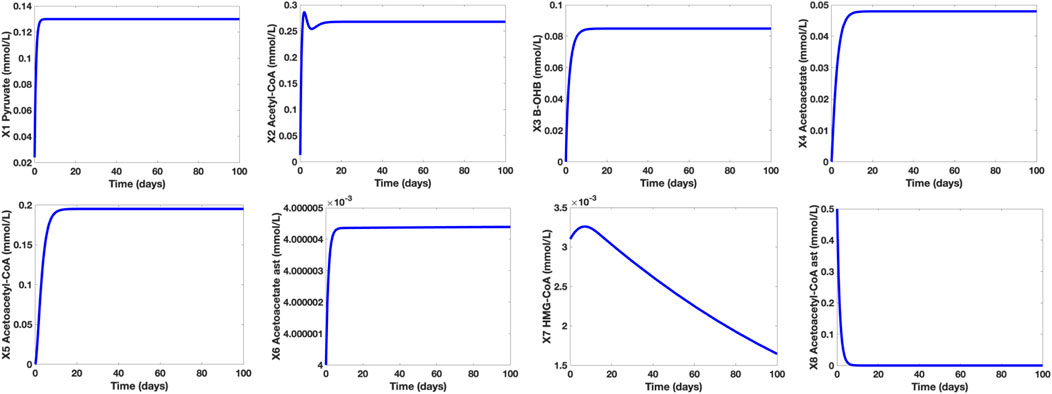
FIGURE 5. Time Plots of the Dependent Metabolites of a Healthy Human Adult in a Well-Fed State. The concentration level of pyruvate (∼0.13 mmol/L) is within the normal range (0.08–0.16 mmol/L) while the concentration levels of the KBs (β-OHB and Actl) are both below 0.1 mmol/L.
It is shown that in a well-fed state (glucose X12 = 7.5 mmol/L), the concentration level of pyruvate is approximately 0.13 mmol/L. On the other hand, the concentration levels of β-OHB and Actl are 0.0849 mmol/L and 0.0479 mmol/L, respectively. These results correspond to the claim of Cahill and Veech (2003) that in normal conditions, the concentration levels of both KBs are lower than 0.1 mmol/L. Furthermore, the computed pyruvate concentration level falls within the normal range of 0.08–0.16 mmol/L. Note that in normal conditions, glucose is the brain’s primary energy source, hence, the glycolytic pathway, pyruvate synthesis, and AC production are all active. Thus, the production of KBs is kept at low levels since there is enough supply of glucose in the bloodstream.
To determine the effect of glucose uptake and metabolism in normal and hypometabolism conditions, we investigated the varying concentration levels of the control group, healthy aging adults group (HAA), and MCI/AD group (M/A). It was mentioned that even healthy aging adults experience an approximately 6%–8% decline in cerebral glucose uptake and metabolism while MCI and AD subjects suffer a huge fall of 20%–40%. With this, we assigned glucose (X12) = 6 mmol/L for healthy aging individuals and glucose (X12) = 4.5 mmol/L for MCI/AD subjects whilst maintaining glucose (X12) = 7.5 mmol/L for the control group. Figure 6 shows the time plots of the concentration levels of the dependent metabolites of the control, HAA, and M/A groups. Based on the simulations, notice that the concentration levels of the metabolites in cerebral KB metabolism remained the same in all groups while the pyruvate and acetyl-CoA concentration levels of HAA and M/A groups are decreased by around 40% as the glucose levels decreased. This may be due to the claim that cerebral KB uptake and metabolism are not affected by the worsening cerebral glucose uptake and metabolism and that the decline in cerebral energy metabolism is mainly specific to glucose (Castellano, et al., 2015; Cunnane, et al., 2016). Furthermore, the generated simulations affirm that lower glycolytic activities lead to lower pyruvate synthesis, and consequently, to lower acetyl-CoA production (Cunnane, et al., 2011).
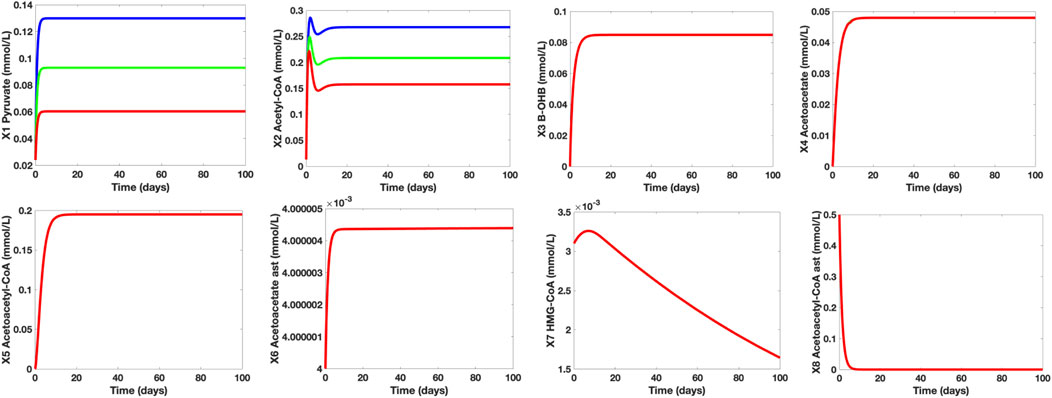
FIGURE 6. Time Plots of the Dependent Metabolites of the Control (blue), HAA (green), and M/A (red) groups. The concentration levels of pyruvate (X1) and AC (X2) fall as glucose (X12) levels also decrease. The time plots of the other independent metabolites are essentially overlapping which indicate that the concentration levels of the remaining metabolites in both neurons and astrocytes remain unaffected by the glucose levels under both normal and hypometabolism conditions.
Table 4 below shows the KB concentration of healthy individuals under prolonged starvation (Hashim and VanItallie, 2014). In this case, we assigned the healthy young adults in a well-fed state as control group 1 and the healthy young adults in starved conditions as control group 2.
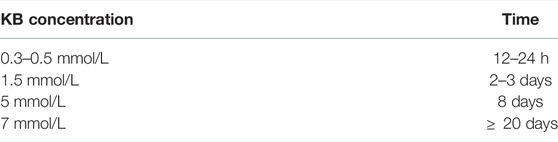
TABLE 4. Plasma KB concentration of healthy adults under prolonged episodes of starvation.
For control group 1, glucose (X12) = 7.5 mmol/L, hepatic β-OHB c1 = 0.08 mmol/L, kinetic order for β-OHB uptake f311 = 0.12, and kinetic order for Actl utilization f44 = 0.5. For control group 2, glucose (X12) = 4.5 mmol/L, hepatic β-OHB c1 = 0.7 mmol/L, kinetic order for β-OHB uptake f311f311 = 0.5, and kinetic order for Actl utilization f44 = 1. The approximated value of hepatic β-OHB (c1) is increased since the hepatic KB production during prolonged starvation also drastically escalated. Furthermore, the rate constants a4 and a5 and kinetic orders for β-OHB uptake f311 and Actl utilization f44 are also modified to imply the significant changes in the heightened KB transport, uptake, and metabolism in the brain.
Hepatic β-OHB c1 is approximated to 0.7 mmol/L to indicate the concentration level of β-OHB after 2–3 days of fasting, which further represents the episode of prolonged starvation. During prolonged fasting or starvation, KBs substitute glucose as the brain’s source of energy. In this case, the liver can produce KBs at the rate of 100–150 g/day (Cunnane, et al., 2016), facilitating elevated KB production, transport, uptake, and metabolism in the brain.
Figure 7 shows the individual time plots of β-OHB (X3) and Actl (X4) in normal (blue line) and prolonged starvation conditions (magenta). Noticeably, there is a significant increase in β-OHB (X3) and Actl (X4) levels during prolonged starvation. After 24 h of fasting, the body’s glycogen reserves start to deplete, prompting the liver to produce more KBs through fatty acid β-oxidation. At this time, the concentration levels of β-OHB and Actl escalate to 0.5mmol/L and 0.12 mmol/L, respectively. In 2–3 days of fasting, the concentration level of β-OHB of the control group ranges from 1.0 to 1.4 mmol/L, and that of Actl is between 0.29 mmol/L and 0.45 mmol/L. After 10 days of continued starvation, β-OHB is around 3.3 mmol/L and Actl is estimated as 1.2 mmol/L. As the interval continues, the concentration levels of β-OHB and Actl reach more than 6 mmol/L and 2 mmol/L, respectively, which relatively mimic the data presented by Cahill and Veech (2003). Note that the approximated values used to generate these simulations were kept at the minimum to ensure that the β-OHB and Actl concentration levels will not exceed 10 mmol/L and 2.5 mmol/L, respectively. This is to prevent the manifestation of diabetic ketoacidosis, a serious complication of diabetes characterized by high KB levels. Ketoacidosis may cause ketonemia (presence of high KB levels in the blood) and ketonuria (presence of high KB levels in urine), and in worst scenarios, it may even lead to mortality.
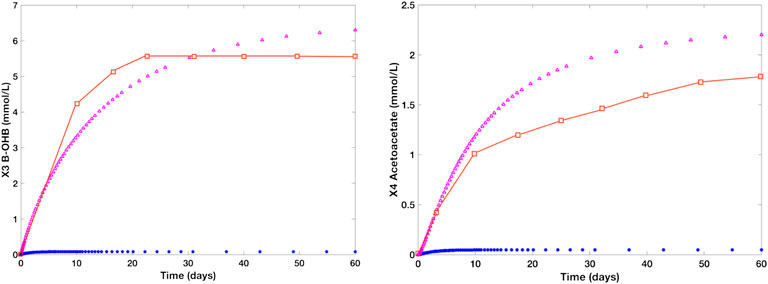
FIGURE 7. Time plots of β-OHB and Actl in the literature (red), normal group (blue), and starved group (magenta). The blue line represents the concentration levels of the control group [glucose (X12) = 7.5 mmol/L, hepatic β-OHB c1 = 0.08 mmol/L, kinetic order for β-OHB uptake f311 = 0.12, and kinetic order for Actl utilization f44 = 0.5] while the magenta line refers to the concentration levels of a human adult in a prolonged starvation episode [glucose (X12) = 4.5 mmol/L, c1 = 0.7 mmol/L, f311 = 0.5, and f44 = 0.8]. During prolonged fasting, the concentration level of β-OHB rises from 0.08 to 6 mmol/L. Likewise, Actl levels escalates to over 2 mmol/L from ∼0.01 mmol/L under normal conditions.
To investigate the effects of MCT-induced treatment on the deteriorating cerebral glucose uptake and metabolism in MCI/AD patients, we used the established mathematical model and parameters to generate the initial simulations of the dependent metabolites in the control group. The time plots shown in Figure 8 are generated to indicate the concentration levels of the dependent metabolites under the following conditions: control group (blue), MCI/AD without MCT-induced treatment group (red), and MCI/AD with MCT-induced treatment group (green). For the control group, glucose (X12) = 7.5 mmol/L and MCT (X11) = 0 mmol/L; for the MCI/AD group without MCT-induced treatment, glucose (X12) = 4.5 mmol/L and MCT (X11) = 0 mmol/L; and for the MCI/AD group with MCT-induced treatment, glucose (X12) = 4.5 mmol/L and MCT (X11) = 1.6 mmol/L. The assigned MCT value is based on the post-treatment regional metabolic rate of triglyceride given by Cunnane (2018). For metabolites pyruvate (X1), β-OHB (X3), Actl (X4), AcACl (X5), Act (X6), HC (X7), and AcAC (X8), the simulations of the control group (blue) and MCI/AD without MCT-induced treatment group (red) overlap since the cerebral KB uptake and metabolism for healthy adults and MCI/AD patients remain unaffected despite the decline in cerebral glucose uptake and metabolism. A significant increase in the concentration levels of β-OHB and Actl can be observed after the implementation of the ketogenic treatment where the previous 0.0848 mmol/L and 0.0479 mmol/L soared up to 0.3079 mmol/L and 0.1742 mmol/L, respectively. The generated simulations for β-OHB and Actl fall within the range 0.57 ± 0.27 mmol/L and 0.25 ± 0.07 mmol/L in the post-treatment observation and support Cunnane et al.’s affirmation (2016) that a 30-g dose of MCT oil can increase the maximal plasma concentration of β-OHB to approximately 0.50 mmol/L. Further, the elevated KB levels elicited by the MCT-induced treatment caused an evident improvement in the AC levels. The AC concentration levels of MCI/AD without MCT-induced treatment group = 0.16 mmol/L escalated to 0.23 mmol/L after the treatment implementation. Comparing these values to the AC level of the control group which is approximately 0.26 mmol/L, it can be observed that the AC level gap between healthy young adults and MCI/AD patients is roughly 62%, which demonstrates a 38% decline in the brain energy requirement. After the treatment, the 38% decline was reduced to 12%. These results ratify Cunnane’s assertion of lowering the brain energy requirement gap from 20%–40% to 10%–20% through ketogenic intervention.
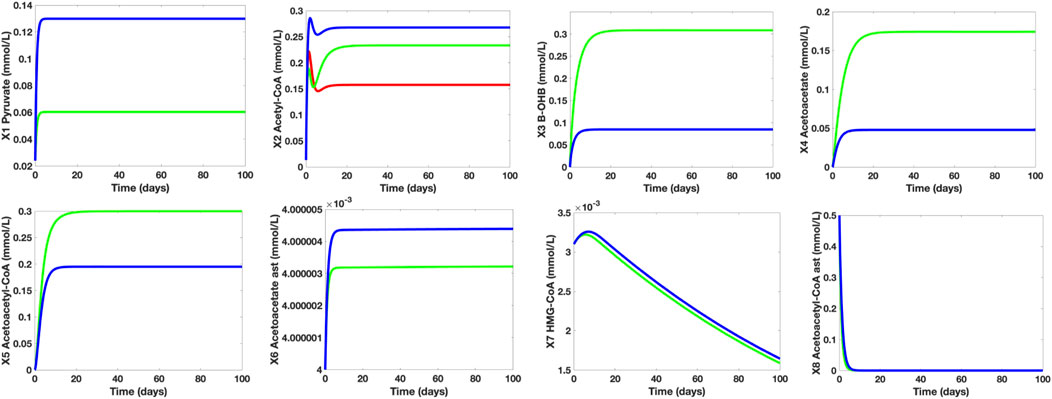
FIGURE 8. Individual Time Plots of Concentration Levels of the Dependent Metabolites on Different Control Groups. The blue line refers to the young and healthy human adult control group, the red line represents the MCI/AD without MCT-induced treatment group, and the green line indicates the MCI/AD with 30 g MCT-induced treatment group. The MCT-induced treatment increases both KB and acetyl-CoA levels of MCI/AD patients. With the MCT-induced treatment, the 38% plunge in acetyl-CoA levels caused by glucose hypometabolism is lowered to 12%. For pyruvate (X1), the simulations for the MCI/AD without MCT-induced treatment group (red) overlapped with that of the MCI/AD with 30 g MCT-induced treatment group (green), which denotes that the pyruvate concentration level of MC/AD patients are unaffected by the presence of MCT in the body. Furthermore, the simulations for β-OHB (X3), Actl (X4), AcACl (X5), Act (X6), HC (X7), and AcAC (X8) of the control group (blue) and the MCI/AD without MCT-induced treatment group (red) coincide since varying glucose levels (normal and hypometabolism conditions) do not have a significant impact on cerebral KB metabolism.
The simulations of the concentration levels of AC and β-OHB of healthy adults who take and who do not take the said supplement are also compared and studied (see Figure 9). Based on the simulations, when a 10-g MCT oil is used as a food supplement by healthy adults with no medical concerns or complications, there is a noticeable increase in both β-OHB and AC levels. Despite an approximate 0.12 mmol/L jump in the β-OHB level, 0.30 mmol/L (= 5.41 mg/dl) is still considered as a small level of KB, hence, the healthy adults who take the 10-g MCT supplement may not suffer from ketonemia nor ketonuria. In addition, these adults have higher AC levels than those who do not take the supplement, hence, a perceivable increase in ATP levels.
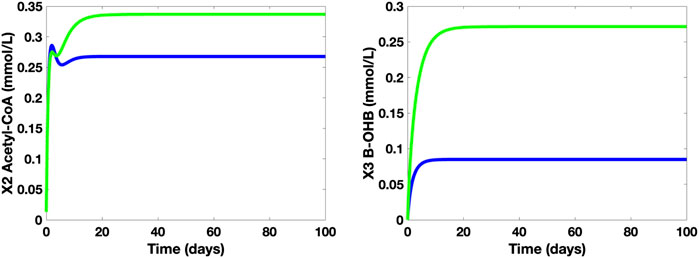
FIGURE 9. Time Plots of AC and β-OHB of healthy adults without (blue) and with 10-g MCT oil supplement (green).
Cerebral glucose metabolism precedes and is strongly related to AD’s distinctive element—senile plaque density formation. Although cerebral glucose metabolism moderately degenerates due to advanced aging, the severe decline in cerebral glucose uptake and metabolism in AD patients is atypical. Since cerebral KB metabolism is insusceptible to glucose hypometabolism in AD patients, KBs are utilized as a substitute energy source to mitigate the stretching gap in brain energy requirements. With this, Medium-Chain Triglyceride (MCT)-induced treatment, a common type of ketogenic intervention, can be administered to boost the brain’s energy source availability. MCT-induced treatment might also help improve the cognitive performance of MCI/AD patients.
We constructed a mathematical model on cerebral glucose and KB metabolism to validate the impact of glucose hypometabolism on healthy aging individuals and MCI/AD patients. Through the generated simulations, we verified that there is an increase in KB concentration levels during prolonged starvation and that MCT-induced intervention elevates the KB and AC levels by around 30%–40% in MCI/AD patients. Also, it is shown that the MCT-induced intervention can minimize the widening 38% difference in AC levels caused by glucose hypometabolism to 12%. More so, the consumption of MCT-induced supplement under normal conditions may elevate the AC concentration levels in healthy adults. The constructed model may be extended by integrating other key substrates such as lactate (which might need to explore on the astrocyte-neuron-lactate shuttle theory), glutamate (an amino acid found in both neurons and astrocytes which serves as a neurotransmitter and is linked to the some neurodegenerative diseases such as AD and Huntington’s disease), and 2-oxoglutarate (a TCA cycle intermediate that plays a vital role in glucose, amino acid, and fatty-acid oxidation). The comprehensive functions of the glycolytic and pentose phosphate pathways (PPP) may also be taken into consideration to investigate on the role of glucose in cerebral energy metabolism.
The original contributions presented in the study are included in the article/Supplementary Material, further inquiries can be directed to the corresponding author.
EM and AL planned the study. AE and AL designed the model. AE performed the simulations. AE and AL analyzed the results and wrote the manuscript. All authors reviewed and approved the final manuscript.
The authors declare that the research was conducted in the absence of any commercial or financial relationships that could be construed as a potential conflict of interest.
All claims expressed in this article are solely those of the authors and do not necessarily represent those of their affiliated organizations, or those of the publisher, the editors and the reviewers. Any product that may be evaluated in this article, or claim that may be made by its manufacturer, is not guaranteed or endorsed by the publisher.
AE acknowledges the support of the Department of Science and Technology-Science Education Institute (DOST-SEI), Philippines for the ASTHRDP-NSC Scholarship grant.
The Supplementary Material for this article can be found online at: https://www.frontiersin.org/articles/10.3389/fsysb.2022.907957/full#supplementary-material
Attwell, D., and Laughlin, S. B. (2001). An Energy Budget for Signaling in the Grey Matter of the Brain. J. Cereb. Blood Flow. Metab. 21 (10), 1133–1145. doi:10.1097/00004647-200110000-00001
Auestad, N., Korsak, R. A., Morrow, J. W., and Edmond, J. (1991). Fatty Acid Oxidation and Ketogenesis by Astrocytes in Primary Culture. J. Neurochem. 56 (4), 1376–1386. doi:10.1111/j.1471-4159.1991.tb11435.x
Benarroch, E. E. (2014). Brain Glucose Transporters: Implications for Neurologic Disease. Neurology 82 (15), 1374–1379. doi:10.1212/wnl.0000000000000328
Brady S.T., George J., Siegel R., Wayne A., and Donald L. (Editors) (2011). Basic Neurochemistry: Principles of Molecular, Cellular, and Medical Neurobiology (Academic Press). Price.
Cahill, , and Veech, R. L. (2003). Ketoacids? Good Medicine? Trans. Am. Clin. Climatol. Assoc. 114, 149–153.
Castellano, C. A., Nugent, S., Paquet, N., Tremblay, S., Bocti, C., Lacombe, G., et al. (2015). Lower Brain 18F-Fluorodeoxyglucose Uptake but Normal 11C-Acetoacetate Metabolism in Mild Alzheimer's Disease Dementia. J. Alzheimers Dis. 43, 1343–1353. doi:10.3233/JAD-141074
Costantini, L. C., Barr, L. J., Vogel, J. L., Vogel, J. L., and Henderson, S. T. (2008). Hypometabolism as a Therapeutic Target in Alzheimer's Disease. BMC Neurosci. 9 Suppl 2 (2), S16–S19. doi:10.1186/1471-2202-9-S2-S16
Croteau, E., Castellano, C. A., Fortier, M., Bocti, C., Fulop, T., Paquet, N., et al. (2018). A Cross-Sectional Comparison of Brain Glucose and Ketone Metabolism in Cognitively Healthy Older Adults, Mild Cognitive Impairment and Early Alzheimer's Disease. Exp. Gerontol. 107, 18–26. doi:10.1016/j.exger.2017.07.004
Cunnane, S. C., Courchesne-Loyer, A., St-Pierre, V., Vandenberghe, C., Pierotti, T., Fortier, M., et al. (2016). Can Ketones Compensate for Deteriorating Brain Glucose Uptake during Aging? Implications for the Risk and Treatment of Alzheimer's Disease. Ann. N.Y. Acad. Sci. 1367 (1), 12–20. doi:10.1111/nyas.12999
Cunnane, S., Nugent, S., Roy, M., Courchesne-Loyer, A., Croteau, E., Tremblay, S., et al. (2011). Brain Fuel Metabolism, Aging, and Alzheimer's Disease. Nutrition 271, 3–20. doi:10.1016/j.nut.2010.07.021
Daulatzai, M. A. (2017). Cerebral Hypoperfusion and Glucose Hypometabolism: Key Pathophysiological Modulators Promote Neurodegeneration, Cognitive Impairment, and Alzheimer's Disease. J. Neurosci. Res. 95 (4), 943–972. doi:10.1002/jnr.23777
De Vivo, D. C., and Darryl, C. (1978). Reye Syndrome: a Metabolic Response to an Acute Mitochondrial Insult. Neurology 28 (2), 105. doi:10.1212/wnl.28.2.105
Duelli, R., and Kuschinsky, W. (2001). Brain Glucose Transporters: Relationship to Local Energy Demand. Physiology 16, 71–76. doi:10.1152/physiologyonline.2001.16.2.71
Edmond, J., Robbins, R. A., Bergstrom, J. D., Cole, R. A., and De Vellis, J. (1987). Capacity for Substrate Utilization in Oxidative Metabolism by Neurons, Astrocytes, and Oligodendrocytes from Developing Brain in Primary Culture. J. Neurosci. Res. 18 (4), 551–561. doi:10.1002/jnr.490180407
Farah, B. A. (2014). Effects of Caprylic Triglyceride on Cognitive Performance and Cerebral Glucose Metabolism in Mild Alzheimerâ€s Disease: A Single-Case Observation. Front. Aging Neurosci. 6, 133. doi:10.3389/fnagi.2014.00133
Gandotra, S., and Kour, J. (2014). Efficacy of Adjunctive Extra Virgin Coconut Oil Use in Moderate to Severe Alzheimer’s Disease. Int. J. Sch. Cog Psychol. 1 (108), 2.
Goyal, M. S., Vlassenko, A. G., Blazey, T. M., Su, Y., Couture, L. E., Bateman, R. J., et al. (2017). Loss of Brain Aerobic Glycolysis in Normal Human Aging. Cell. Metab. 26 (no. 2), 353–e3. doi:10.1016/j.cmet.2017.07.010
Guzmán, M., and Blázquez, C. (2004). Ketone Body Synthesis in the Brain: Possible Neuroprotective Effects. Prostagl. Leukot. Essent. Fat. acids 703, 287–292.
Hall, S., Wastney, M., Bolton, T., Braaten, J., and Berman, M. (1984). Ketone Body Kinetics in Humans: the Effects of Insulin-dependent Diabetes, Obesity, and Starvation. J. Lipid Res. 25, 1184–1194. doi:10.1016/s0022-2275(20)34462-x
Hashim, S. A., and VanItallie., T. B. (2014). Ketone Body Therapy: from the Ketogenic Diet to the Oral Administration of Ketone Ester. J. lipid Res. 55 (9), 1818–1826. doi:10.1194/jlr.r046599
Henderson, S. T. (2008). Ketone Bodies as a Therapeutic for Alzheimer's Disease. Neurotherapeutics 5 (3), 470–480. doi:10.1016/j.nurt.2008.05.004
Hertz, L., Chen, Y., Waagepetersen, H. S., and Waagepetersen, (2015). Effects of Ketone Bodies in Alzheimer's Disease in Relation to Neural Hypometabolism, β-amyloid Toxicity, and Astrocyte Function. J. Neurochem. 134 (1), 7–20. doi:10.1111/jnc.13107
Hoyer, S., Oesterreich, K., and Wagner, O. (1988). Glucose Metabolism as the Site of the Primary Abnormality in Early-Onset Dementia of Alzheimer Type? J. Neurol. 235 (3), 143–148. doi:10.1007/bf00314304
Koch, K., Berressem, D., Konietzka, J., Thinnes, A., Eckert, G. P., and Klein, J. (2017). Hepatic Ketogenesis Induced by Middle Cerebral Artery Occlusion in Mice. J. Am. Heart Assoc. 6, e005556–4. doi:10.1161/JAHA.117.005556
Le Foll, C., and Christelle, (2019). Hypothalamic Fatty Acids and Ketone Bodies Sensing and Role of FAT/CD36 in the Regulation of Food Intake. Front. Physiol. 10, 1036. doi:10.3389/fphys.2019.01036
Lee, Y-Y., Teck-Kim, T., Chan, E-S., Phuah, E-T., Lai, O-M., Tan, C-P., et al. (2021). Nur Azwani Ab Karim, Noorlida Habi Mat Dian, and Joo Shun Tan. "Medium Chain Triglyceride and Medium-And Long Chain Triglyceride: Metabolism, Production, Health Impacts and its Applications–A Review. Crit. Rev. food Sci. Nutr., 1–17. doi:10.1080/10408398.2021.1873729
Lenzen, S. (2014). A Fresh View of Glycolysis and Glucokinase Regulation: History and Current Status. J. Biol. Chem. 289 (18), 12189–12194. doi:10.1074/jbc.r114.557314
Longo, R., Peri, C., Cricrì, D., Coppi, L., Caruso, D., Mitro, N., et al. (2019). Ketogenic Diet: a New Light Shining on Old but Gold Biochemistry. Nutrients 11, 2497–2510. doi:10.3390/nu11102497
Marten, B., Pfeuffer, M., and Schrezenmeir, J. (2006). Medium-chain Triglycerides. Int. Dairy J. 16 (11), 1374–1382. doi:10.1016/j.idairyj.2006.06.015
McKenna, M. C., Dienel, G. A., Sonnewald, U., Waagepetersen, H. S., and Schousboe, A. (2012). “Energy Metabolism of the Brain,” in Basic Neurochemistry (Academic Press), 200–231. doi:10.1016/b978-0-12-374947-5.00011-0
Mosconi, L., Pupi, A., De Leon, M. J., and De Leon, (2008). Brain Glucose Hypometabolism and Oxidative Stress in Preclinical Alzheimer's Disease. Ann. N. Y. Acad. Sci. 1147 (1), 180–195. doi:10.1196/annals.1427.007
Newport (2008). What if There Was a Cure for Alzheimer’s Disease and No One Knew?–A Case Study. Dr. Mary Newport. Mary.
Nugent, S., Tremblay, S., Chen, K. W., Ayutyanont, N., Roontiva, A., Castellano, C.-A., et al. (2014). Brain Glucose and Acetoacetate Metabolism: a Comparison of Young and Older Adults. Neurobiol. aging 35 (6), 1386–1395. doi:10.1016/j.neurobiolaging.2013.11.027
Ohnuma, T., Toda, A., Kimoto, A., Takebayashi, Y., Higashiyama, R., Tagata, Y., et al. (2016). Benefits of Use, and Tolerance of, Medium-Chain Triglyceride Medical Food in the Management of Japanese Patients with Alzheimer’s Disease: A prospective, Open-Label Pilot Study. Cia 11, 29. doi:10.2147/cia.s95362
Owen, O. E. (2005). Ketone Bodies as a Fuel for the Brain during Starvation. Biochem. Mol. Biol. Educ. 33 (4), 246–251. doi:10.1002/bmb.2005.49403304246
Page, K. A., Williamson, A., Yu, N., McNay, E. C., Dzuira, J., McCrimmon, R. J., et al. (2009). Medium-chain Fatty Acids Improve Cognitive Function in Intensively Treated Type 1 Diabetic Patients and Support In Vitro Synaptic Transmission during Acute Hypoglycemia. Diabetes 58 (5), 1237–1244. doi:10.2337/db08-1557
Pizzorno, J. E., and Murray., M. T. (2020). Textbook of Natural Medicine-E-Book. Elsevier Health Sciences.
Reger, M. A., Henderson, S. T., Hale, C., Cholerton, B., Baker, L. D., Watson, G. S., et al. (2004). Effects of β-hydroxybutyrate on Cognition in Memory-Impaired Adults. Neurobiol. aging 25 (3), 311–314. doi:10.1016/s0197-4580(03)00087-3
Rui, L. (2014). Energy Metabolism in the Liver. Compr. Physiol. 4 (1), 177–197. doi:10.1002/cphy.c130024
Savageau, M. A. (1988). Introduction to S-Systems and the Underlying Power-Law Formalism. Math. Comput. Model. 11, 546–551. doi:10.1016/0895-7177(88)90553-5
Savageau, M. A., and Eberhard, O. V. (1987). Recasting Nonlinear Differential Equations as S-Systems: a Canonical Nonlinear Form. Math. Biosci. 87 (no. 1), 83–115. doi:10.1016/0025-5564(87)90035-6
Siracusa, R., Fusco, R., and Cuzzocrea, S. (2019). Astrocytes: Role and Functions in Brain Pathologies. Front. Pharmacol. 10, 1114. doi:10.3389/fphar.2019.01114
Sofroniew, M. V., and Vinters, H. V. (2010). Astrocytes: Biology and Pathology. Acta Neuropathol. 119 (1), 7–35. doi:10.1007/s00401-009-0619-8
Souza, D. G., Almeida, R. F., Souza, D. O., and Zimmer, E. R. (2019). The Astrocyte Biochemistry. Seminars Cell. & Dev. Biol. 95, 142–150. Academic Press. doi:10.1016/j.semcdb.2019.04.002
Swaminathan, A., and Jicha, G. A. (2014). Nutrition and Prevention of Alzheimerâ€s Dementia. Front. Aging Neurosci. 6, 282. doi:10.3389/fnagi.2014.00282
VanItallie, T. B. (2015). Biomarkers, Ketone Bodies, and the Prevention of Alzheimer's Disease. Metabolism 64 (3), S51–S57. doi:10.1016/j.metabol.2014.10.033
Keywords: Alzheimer Disease, modelling, ketone body, medium-chain triglyceride, brain metabolism
Citation: Espina A, Mendoza E and Lao A (2022) Modelling the Effects of Medium-Chain Triglycerides on Cerebral Ketone Body Metabolism. Front. Syst. Biol. 2:907957. doi: 10.3389/fsysb.2022.907957
Received: 30 March 2022; Accepted: 31 May 2022;
Published: 23 June 2022.
Edited by:
Maria Suarez-Diez, Wageningen University and Research, NetherlandsReviewed by:
Agnieszka Wegrzyn, Leiden University, NetherlandsCopyright © 2022 Espina, Mendoza and Lao. This is an open-access article distributed under the terms of the Creative Commons Attribution License (CC BY). The use, distribution or reproduction in other forums is permitted, provided the original author(s) and the copyright owner(s) are credited and that the original publication in this journal is cited, in accordance with accepted academic practice. No use, distribution or reproduction is permitted which does not comply with these terms.
*Correspondence: Angelyn Lao, YW5nZWx5bi5sYW9AZGxzdS5lZHUucGg=
Disclaimer: All claims expressed in this article are solely those of the authors and do not necessarily represent those of their affiliated organizations, or those of the publisher, the editors and the reviewers. Any product that may be evaluated in this article or claim that may be made by its manufacturer is not guaranteed or endorsed by the publisher.
Research integrity at Frontiers
Learn more about the work of our research integrity team to safeguard the quality of each article we publish.