 Erika Taipala
 Jeremiah C. Pfitzer
 Morgan Hellums
 Miranda N. Reed
 Michael W. Gramlich
- 1Department of Physics, Auburn University, Auburn, AL, United States
- 2Harrison School of Pharmacy, Auburn University, Auburn, AL, United States
The molecular pathways that contribute to the onset of symptoms in tauopathy models, including Alzheimer’s disease (AD), are difficult to distinguish because multiple changes can happen simultaneously at different stages of disease progression. Understanding early synaptic alterations and their supporting molecular pathways is essential to develop better pharmacological targets to treat AD. Here, we focus on an early onset rTg(TauP301L)4510 tauopathy mouse model that exhibits hyperexcitability in hippocampal neurons of adult mice that is correlated with presynaptic changes and increased extracellular glutamate levels. However, it is not clear if increased extracellular glutamate is caused by presynaptic changes alone, or if presynaptic changes are a contributing factor among other factors. To determine whether pathogenic tau alters presynaptic function and glutamate release, we studied cultured hippocampal neurons at 14–18 days in vitro (DIV) from animals of both sexes to measure presynaptic changes in tauP301L positive mice. We observed that presynaptic vesicles exhibit increased vesicular glutamate transporter 1 (VGlut1) using immunohistochemistry of fixed cells and an established pH-sensitive green fluorescent protein approach. We show that tauP301L positive neurons exhibit a 40% increase in VGlut1 per vesicle compared to tauP301L negative littermates. Further, we use the extracellular glutamate reporter iGluSnFR to show that increased VGlut1 per vesicle directly translates into a 40% increase in extracellular glutamate. Together, these results show that increased extracellular glutamate levels observed in tauP301L mice are not caused by increased vesicle exocytosis probability but rather are directly related to increased VGlut1 transporters per synaptic vesicle.
Introduction
Pathological hyperphosphorylation and aggregation of tau is a hallmark of neurodegenerative conditions known as tauopathies, including Alzheimer’s disease (AD), Parkinson’s disease (PD), Pick’s disease, and Frontotemporal dementia with Parkinsonism-17 (FTDP-17). While much of the work has focused on the role of pathological tau in disrupting postsynaptic signaling, there is growing interest in the role that pathological tau plays in presynaptic dysfunction (see Wu et al., 2021 for review). Using the rTg(TauP301L)4510 mouse model (hereafter called tauP301L pos), we have previously demonstrated in vivo that P301L tau expression increases glutamate release in the hippocampus, which correlated with memory deficits, at a time when tau pathology was subtle and before readily detectable neuron loss (Hunsberger et al., 2014). This increase in glutamate release was concomitant with a 40% increase in hippocampal levels of the vesicular glutamate transporter VGlut1. Importantly, neither cognitive deficits nor the increase in glutamate release and VGlut1 levels were observed in the rTg(TauWT)21221 mouse model that expresses wild-type 4R0N human tau at concentrations equivalent to P301L human tau in tauP301L pos mice, but without the P301L mutation and associated tau pathology (Hunsberger et al., 2014). This suggests that overexpression of tau per se did not mediate these alterations, which we have also previously demonstrated for postsynaptic alterations associated with P301L tau (Hoover et al., 2010). Moreover, reducing VGlut1 levels and glutamate release rescued cognitive deficits in tauP301L pos mice (Hunsberger et al., 2015), suggesting the increased VGlut1 and/or glutamate release may represent potential therapeutic targets for the treatment of early-stage tauopathies.
Prior studies have also shown VGlut1 expression to be increased in the PS19 tauopathy mouse model in an age-dependent manner (Crescenzi et al., 2017), with levels increasing then decreasing with age. Likewise, while VGlut1 is decreased in AD patients, particularly in the later stages (Kashani et al., 2008), patients with early stages of mild cognitive impairment (MCI) demonstrate increased VGLUT (Bell et al., 2007). Together, these results suggest that the changes in VGlut1 expression may be age- or stage- dependent. This early increase in VGlut1 in MCI patients may help explain the hippocampal hyperexcitability that is predictive of the degree and rate of cognitive decline, as well as the conversion to AD, that has been previously observed in MCI patients (Mackenzie and Miller, 1994) and (see Toniolo et al., 2020 for review).
A major limitation to understanding the mechanisms of tau-mediated changes in presynaptic transmission has been the ability to separately distinguish mechanisms at the single vesicle level in a physiological approach. Prior in vitro cell cultures used immortalized cell lines or transfection of human tau (htau) in primary hippocampal cells (Zhou et al., 2017; McInnes et al., 2018; Siano et al., 2019), and have shown that tau mediates both an increase in VGlut1 expression and a decrease in vesicle exocytosis. In vivo approaches have also been able to measure increased VGlut1 expression and tau mediated reduction in synaptic transmission (Crescenzi et al., 2017), but could not directly measure the presynaptic exocytosis contribution from the post-synaptic response. Separating the consequences of increased VGlut1 from the decrease in synaptic transmission is essential because changes in VGlut1 expression have been shown to increase glutamate concentration per vesicle (Wilson et al., 2005) and changes in release probability (Herman et al., 2014). Thus, tau-mediated decreases in exocytosis and tau-mediated increases in VGlut1 expression levels can have counteracting effects on presynaptic transmission. These limitations have prevented a complete mechanistic understanding of the effect of tau-mediated alterations in VGlut1 levels on presynaptic release of glutamate via single vesicle exocytosis, which we address here.
Another limitation is separating the role of tau-mediated changes in frequency-dependent synaptic transmission. Normal synaptic transmission utilizes a complex train of stimulus from low frequencies (1 Hz) to high frequencies (100 Hz) (Abbott and Regehr, 2004; Klyachko and Stevens, 2006). Multiple studies of tauopathy models have shown hyperexcitable periods of higher frequency activity (>20 Hz) occurring for sustained bouts (Kazim et al., 2017). It is not clear if these periods of hyperexcitability are mediated by changes in a frequency-dependent alteration in presynaptic transmission. If tau mediates frequency-dependent release of glutamate, then this represents an important potential pathway of disease progression, because prior studies have demonstrated a glutamate-mediated exocytosis of tau as a potential mechanism for the trans-synaptic spread of tau pathology (Liu et al., 2012; Pooler et al., 2013; Yamada et al., 2014), and neuronal hyperexcitability represents one potential source for the pathogenesis of tauopathies (see Toniolo et al., 2020 for review). However, no careful study of frequency-dependent presynaptic glutamate release has been explored in cell culture models.
In the present study, we used nanometer fluorescence microscopy and computational analysis techniques to quantitatively explore how presynaptic vesicle VGlut1 is altered in a P301L tauopathy mouse model, as well as the resulting consequences on glutamate release, using primary hippocampal cell cultures of neurons grown on astrocytes. Presynaptic alterations were measured at 14–18 days in vitro (DIV) by isolating presynaptic transmission from postsynaptic response using established postsynaptic AMPA and NMDA receptor blockers during experiments (Voglmaier et al., 2006; Gramlich and Klyachko, 2017; Maschi and Klyachko, 2017; Maschi et al., 2018). We directly imaged single vesicle VGlut1 levels using the pH-sensitive GFP fluorescent protein pHlourin (Voglmaier et al., 2006; Maschi and Klyachko, 2017) and observed a 40% increase in VGlut1-pHluorin intensity per vesicle in tauP301L pos neurons compared to tauP301L neg neurons during stimulation. This increased VGlut1-pHluorin intensity was independent of stimulation frequency or single release probability per stimulation. Further, we imaged extracellular glutamate levels using the GFP fluorescent plasma membrane reporter iGluSnFR (Marvin et al., 2018) and observed that the increase VGlut1 per vesicle correlated with a 40% increase in iGluSnFR glutamate reporter intensity, supporting the hypothesis that increased VGlut1 transporters per vesicle results in extracellular glutamate released during stimulation. Finally, we used our results to computationally model the number of VGlut1 transporters per vesicle.
Results
TauP301L positive neurons exhibit increased VGlut1-pHluorin fluorescence intensity compared to tauP301L negative neurons
To determine if previously observed increased VGlut1 levels (Hunsberger et al., 2014) exists in tauP301L pos hippocampal neurons compared to their transgene negative littermates (hereafter called tauP301L neg), we used the established pH-sensitive fluorescent protein-based indicator VGlut1-pHluorin approach, which results in an increase in pHluorin intensity due to exposure of synaptic vesicles to the neutral pH of the extracellular environment (Figure 1A; Voglmaier et al., 2006; Maschi and Klyachko, 2017; Maschi et al., 2018). We fluorescently imaged transfected cells before, during, and after a single bout of electrical stimulation. We chose a single 10 s bout of electrical stimulation at a constant rate of 40 Hz to model a hyperexcitable state (Kazim et al., 2017) and drive a significant portion of the recycling pool to release. After stimulation, the resulting VGlut1-pHluorin intensity was then quantized for each vesicle released (ΔF/pulse, Figure 1A).
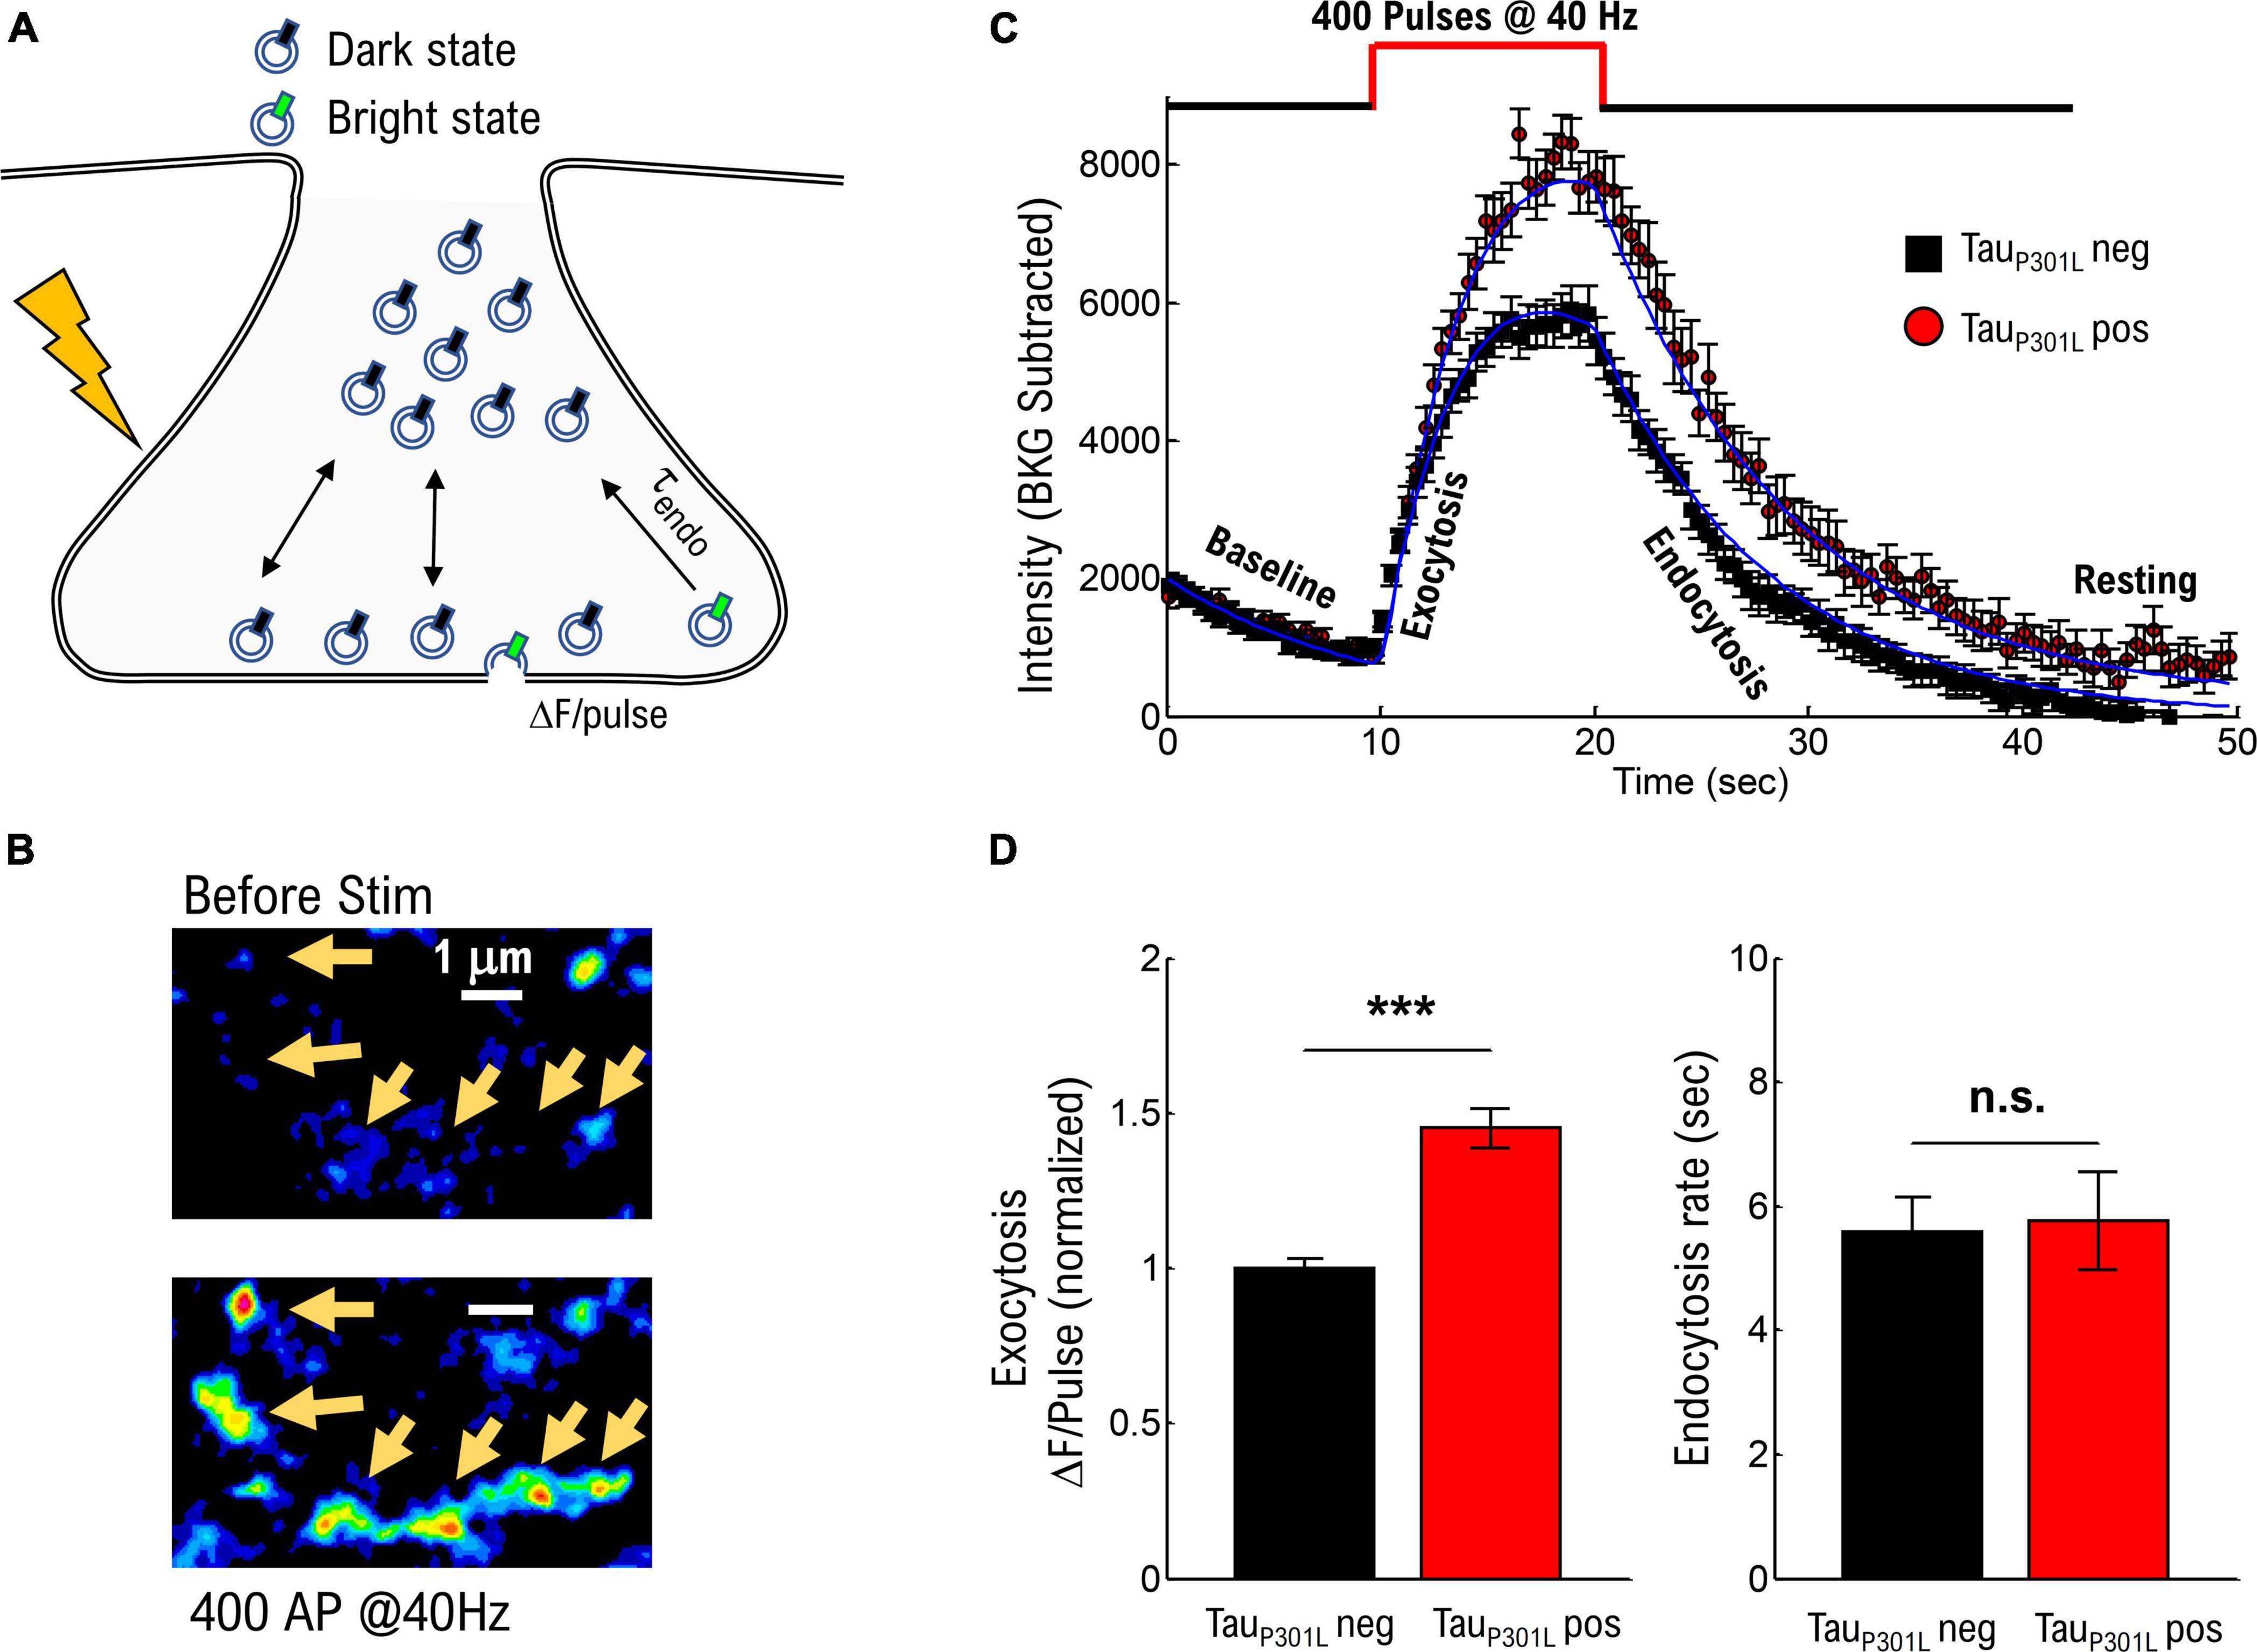
Figure 1. TauP301L pos neurons exhibit increased overall pHluorin-VGLUT1 intensity compared to tauP301L neg neurons. (A) Representation of pHluorin-VGLUT1 intensity observed during presynaptic transmission. (B) Example of raw pHluorin-VGLUT1 data observed before and directly after a single bout of 40 Hz stimulation. (C) Comparison of pHluorin-VGLUT1 intensity before, during, and after 40 Hz stimulation for tauP301L neg (Black) and tauP301L pos (red) neurons. (D) Comparison of intensity/pulse and endocytosis rate for tauP301L neg (Black) and tauP301L pos (red) neurons. tauP301L neg N = 257 presynapses, three samples from 2 litters; tauP301L pos N = 160 presynapses, three samples from 2 litters. ***P < 0.001 for Mann–Whitney U-test. ns, not significant.
The observed VGlut1-pHluorin intensity exhibited an initial increase with stimulation (exocytosis, Figure 1C) followed by a saturation, and then a reduction in VGlut1-pHluorin intensity (endocytosis, Figure 1C), consistent with previous VGlut1-pHluorin studies in hippocampal neurons (Voglmaier et al., 2006; Maschi and Klyachko, 2017; Maschi et al., 2018). However, in this present study, tauP301L pos exhibited an overall increase in VGlut1-pHluorin intensity as compared to tauP301L neg controls (Figure 1C). Importantly, this change is not a consequence of a change in the density or number of presynapses that respond to stimulation as both tauP301L neg and tauP301L pos exhibit the same density, number, and size of presynapses during stimulation (Supplementary Figures 1A–D). Further, the difference in intensity is not a consequence of a different baseline intensity (Baseline Figure 1C) as both tauP301L neg and tauP301L pos exhibit statistically consistent baseline intensities (Supplementary Figure 1E).
Because each exocytosed vesicle immediately begins the endocytosis process, there are two potential contributions from vesicle recycling mechanics that could result in this observed difference in VGlut1-pHluorin intensity: either increasing intensity from exocytosis (ΔF/pulse, Figure 1A) or decreasing intensity from endocytosis (τendo, Figure 1A; Chanaday and Kavalali, 2018). Using a continuum fit function (equation 1 in methods) to delineate the relative contributions, tauP301L pos neurons showed an increase in ΔF/pulse 1.4x that of tauP301L neg controls (p < 0.0001; Figure 1D, left), whereas the endocytosis rate was the same for both tauP301L pos and tauP301L neg neurons (p > 0.4; Figure 1D, right). The increase in intensity per stimulus (ΔF/pulse), but not endocytosis rate, in tauP301L pos neurons suggests either a change in exocytosis mechanics or the amount of VGlut1 per vesicle or both.
To understand how tauP301L pos neurons could exhibit increased VGlut1-pHluorin intensity compared to tauP301L neg neurons, we developed a computational simulation model of the experimental results (Supplementary Figure 2; equation 2, methods). We then tested three possible pathways by which VGlut1-pHluorin intensity for tauP301L pos neurons could be greater than that of tauP301L neg neurons (Supplementary Figures 2C,D):
(i) tauP301L pos presynapses exhibit a frequency-dependent increase (see section “Increased VGlut1-pHluorin intensity in tauP301L pos neurons is independent of stimulation frequency and single release probability”).
(ii) tauP301L pos release sites exhibit an overall 1.4x increase in release-probability (see section “Increased VGlut1-pHluorin intensity in tauP301L pos neurons is independent of stimulation frequency and single release probability”).
(iii) tauP301L pos vesicles exhibit 1.4x VGlut1-pHluorin intensity per vesicle compared to tauP301L neg (see section “TauP301L pos neurons exhibit quantized increase in VGlut1-pHluorin intensity-per-vesicle as compared to tauP301L neg neurons”).
Increased VGlut1-pHluorin intensity in tauP301L pos neurons is independent of stimulation frequency and single release probability
Tau has been implicated in facilitating hyperexcitability in mouse models of AD as well as models of epilepsy (Palop et al., 2007; Roberson et al., 2007, 2011; Ittner et al., 2010; Peters et al., 2020), and it is possible that VGlut1-pHluorin intensity in tauP301L pos mice may change as a function of neuronal stimulation. To establish if any stimulation frequency-dependent increase in vesicle release events exists in tauP301L pos hippocampal neurons [e.g., pathway (i)], we performed VGlut1-pHluorin intensity experiments as a function of stimulus frequency using frequencies that range from moderate (10 Hz) to potential hyperexcitable frequencies (40 Hz). We again observed no difference in the endocytosis rate between any of the stimulation frequency results (ps > 0.35 for all tauP301L neg/tauP301L pos comparisons, Supplementary Figure 3). Surprisingly, we found that ΔF/pulse was consistently higher for tauP301L pos neurons for all stimulation conditions (ps > 0.001; Figures 2A–C), suggesting that the increased VGlut1-pHluorin intensity observed in tauP301L pos neurons is not frequency-dependent. Importantly, different stimulation frequencies were statistically different for the same condition (p < 0.001 for all frequency comparisons for tauP301L neg, and p < 0.001 for all frequency comparisons for tauP301L pos, Mann–Whitney-U tests). While these combined exocytosis and endocytosis results suggest that observed increases in tauP301L pos VGlut1-pHluorin intensity is not a frequency-dependent release effect, the frequency-dependent results do not discount the possibility that tauP301L pos neurons exhibit an overall increase in release probability independent of stimulation frequency.
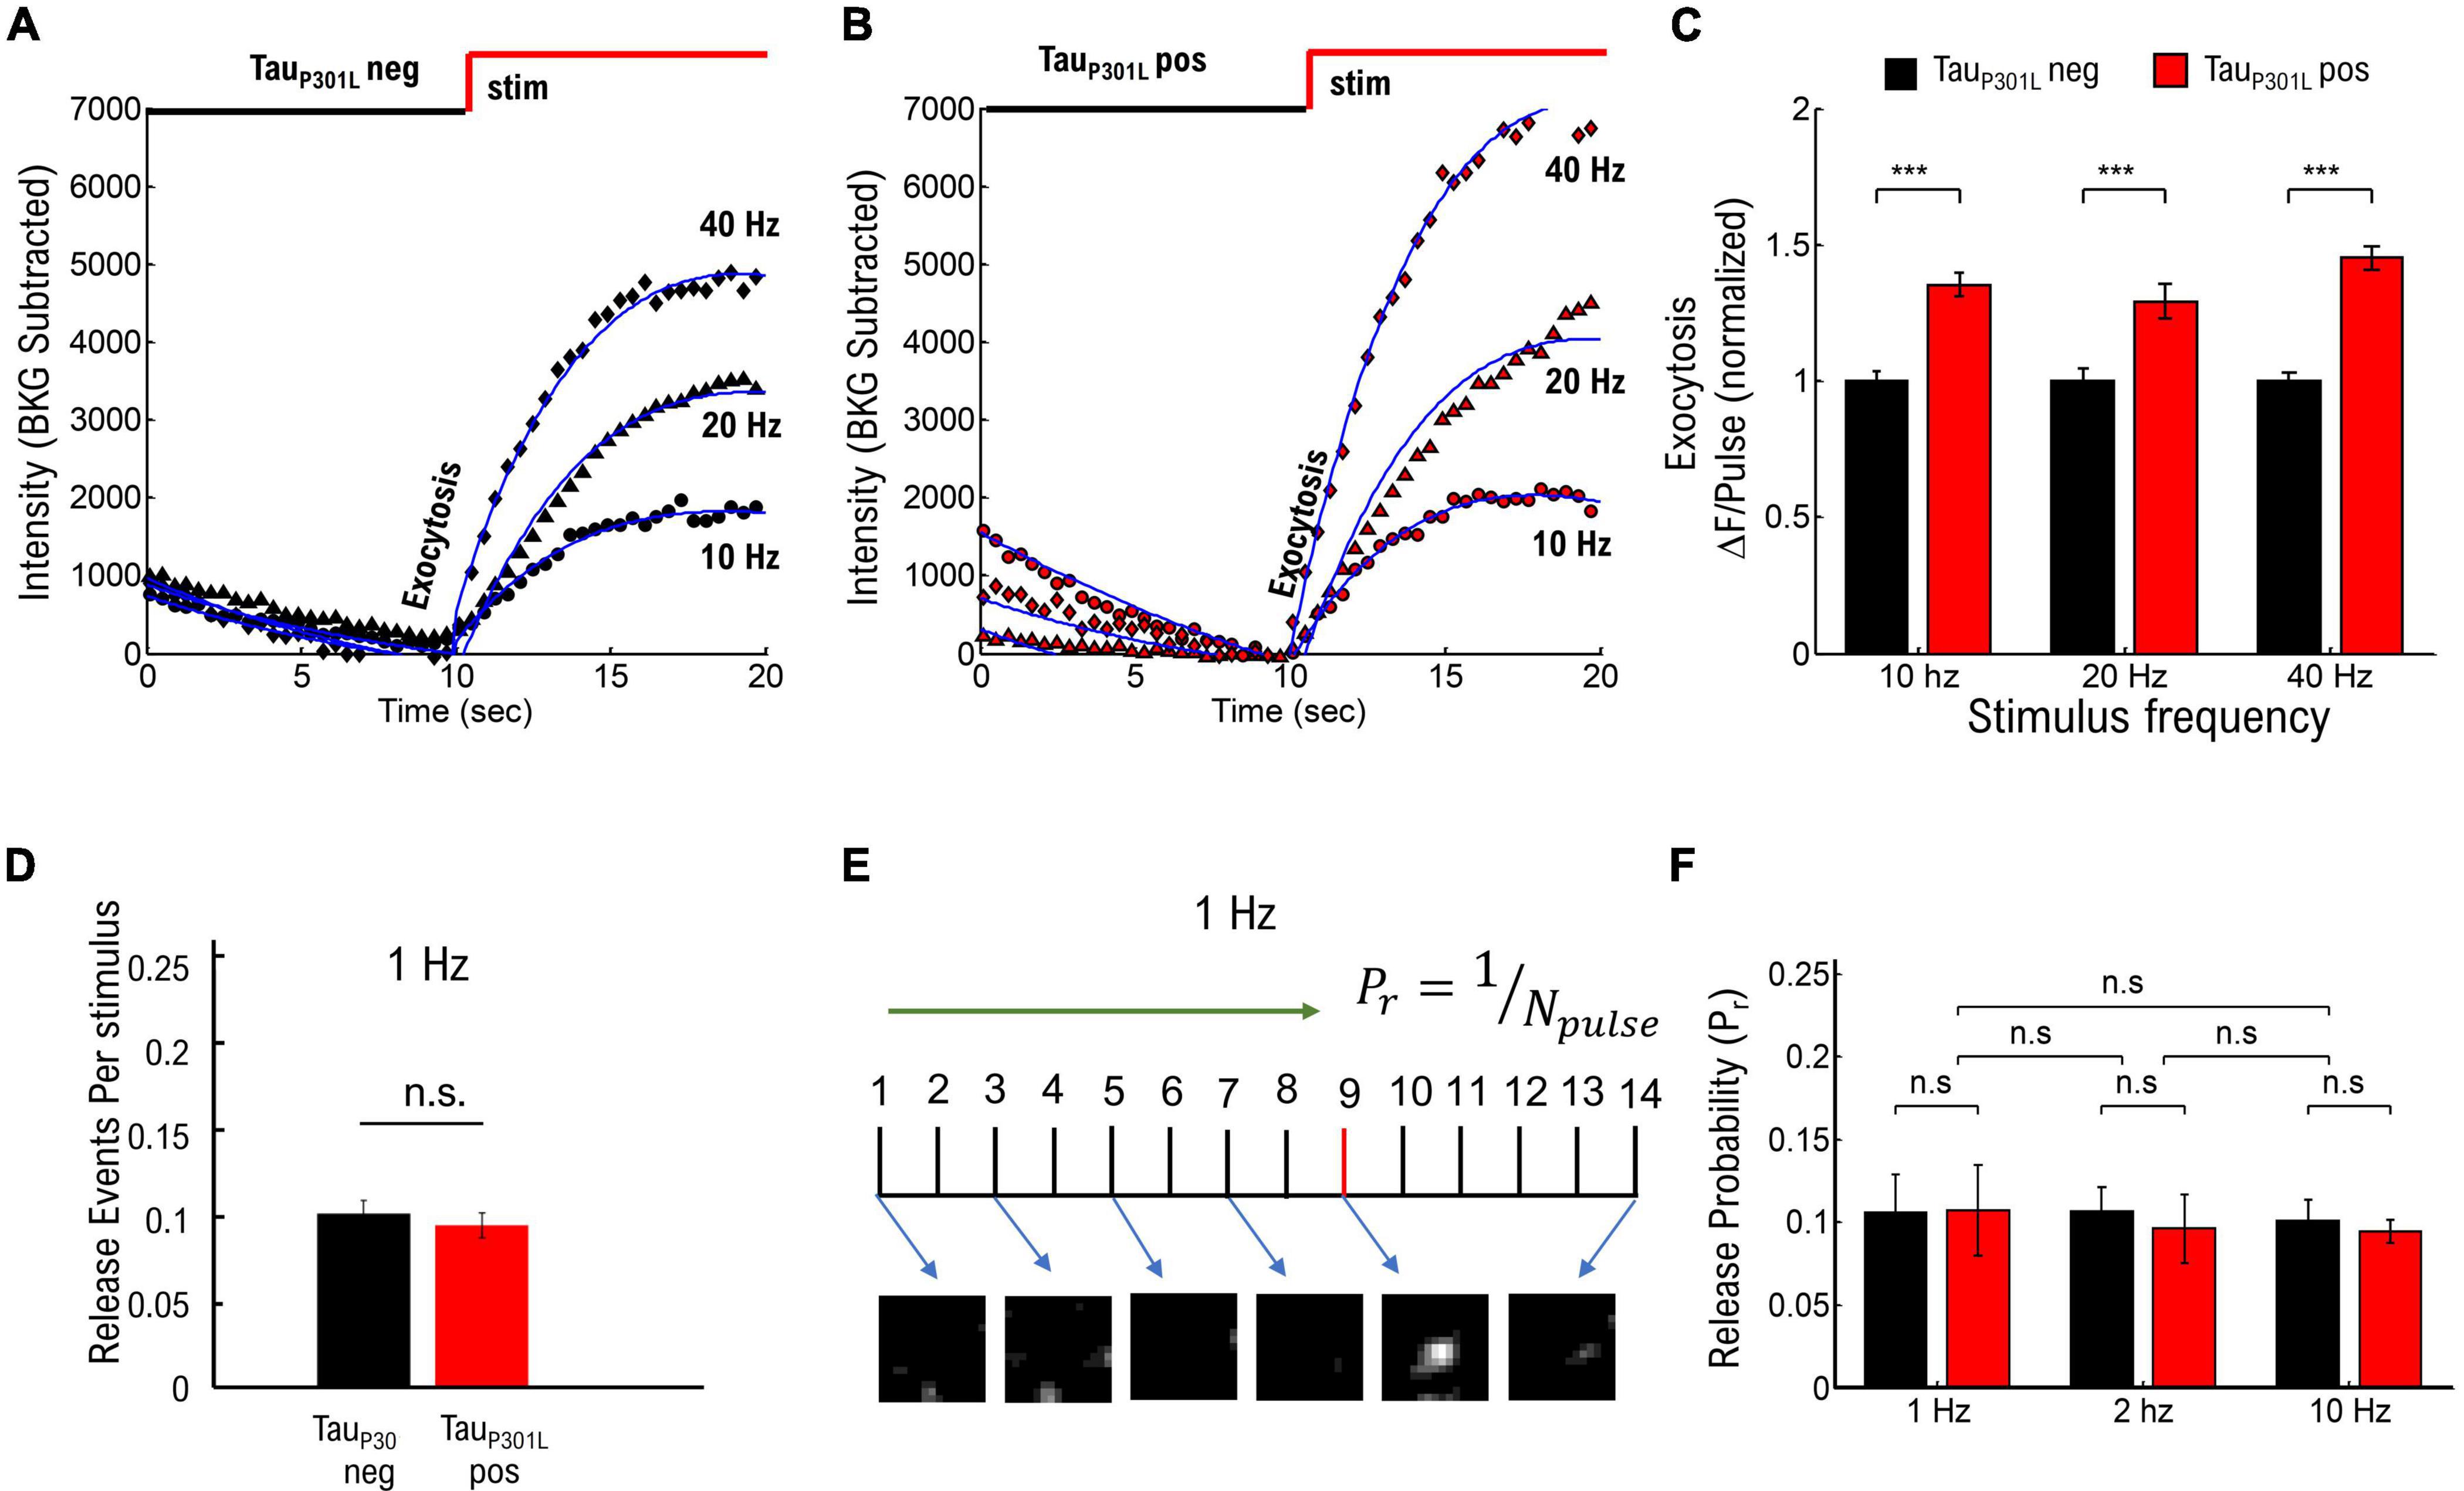
Figure 2. Frequency-dependent stimulation and single vesicle release probability do not contribute to increased tauP301L pos VGLUT1-pHluorin intensity. (A) Comparison of pHluorin-VGLUT1 intensity before (0–10 s) and during (10–20 s) stimulation as a function of stimulation frequency for tauP301L neg neurons. (B) Comparison of pHluorin-VGLUT1 intensity before (0–10 s) and during (10–20 s) stimulation as a function of stimulation frequency for tauP301L pos neurons. (C) ΔF/pulse parameter from eq. 1 fit to data (Blue Lines in A,B). Values at each stimulation frequency are normalized to the tauP301L neg value for that frequency. (D) Number of released vesicles per stimulus pulse at 1 Hz for tauP301L neg (black) and tauP301L pos conditions (red). (E) Single Vesicle Release events as a function of Pulse Number for tauP301L neg and tauP301L pos conditions. (F) Release Probability as a function of stimulation frequency for tauP301L neg (black) and tauP301L pos conditions (red). Errors in (C) are twice the 95% confidence interval value of fits. ***P < 0.01; Statistical results from Mann–Whitney U. 10 Hz: tauP301L neg N = 134 presynapses, one sample from 1 litters; tauP301L pos N = 193 presynapses, two samples from 2 litters. 20 Hz: tauP301L neg N = 615 presynapses, five samples from 3 litters; tauP301L pos N = 151 presynapses, three samples from 2 litters. 40 Hz: tauP301L neg N = 257 presynapses, three samples from 2 litters; tauP301L pos N = 160 presynapses, three samples from 2 litters. 1 Hz: tauP301L neg N = 43 vesicles, two samples from 2 litters; tauP301L pos N = 37 vesicles, two samples from 2 litters. 2 Hz: tauP301L neg N = 42 vesicles, three samples from 2 litters; tauP301L pos N = 27 vesicles, three samples from 2 litters. 10 Hz: tauP301L neg N = 112 vesicles, two samples from 2 litters; tauP301L pos N = 111 vesicles, two samples from 2 litters. Errors in (E) are standard deviation of the mean, and statistical results from student t-Test. Errors in (F) are standard deviation of the mean, and statistical results from two-tailed KS-test of cumulative distributions. 1 Hz: tauP301L neg N = 33 vesicles, two samples from 2 litters; tauP301L pos N = 37 vesicles, three samples from 2 litters. ns, not significant.
We next focused on the hypothesis that single vesicle release probability is increased in tauP301L pos neurons compared to tauP301L neg controls (pathway (ii)) by using single vesicle release events at low stimulation frequencies, as previously published (Leitz and Kavalali, 2011; Maschi and Klyachko, 2017; Chanaday and Kavalali, 2018), to establish if overall tauP301L pos release probabilities were higher than tauP301L neg controls (Supplementary Figure 4). Briefly, we stimulated cultured neurons at a fixed frequency (1, 2, or 10 Hz) for 20–30 s, followed by a 20–40 Hz stimulation for 10 s to identify presynapses, and then quantified changes in VGlut1-pHluorin intensity during stimulation using a thresholding analysis method (see Supplementary Figure 4A). We then used two separate approaches to determine the probability of release for each stimulus pulse:
(i) We followed a previously established approach of measuring release probability with VGlut1-pHluorin (Chanaday and Kavalali, 2018) by counting the number of release events identified during 1 Hz stimulation and dividing by the number of pulses during stimulation (Figure 2D), which minimizes the possibility of false-positive counts due to a potential increase in intensity per vesicle hypothesized for tauP301L pos. We then aggregated the fraction of release events per pulse for all presynapses to determine the release probability (Supplementary Figure 4B).
(ii) We counted the number of pulses until the first release event is observed for low stimulation frequencies, and we took the pulse just before the onset of intensity as the first release event (Figure 2E and Supplementary Figure 4D). We then aggregated the number of pulses before the first release event is observed for each condition to determine the release probability (Supplementary Figure 4E), and we defined the release probability as the inverse of the mean number of pulses until release (Pr = 1/number-of-pulses).
None of the resulting tauP301L pos and tauP301L neg vesicle release probabilities were statistically different from each other for the same frequencies or across frequencies (ps > 0.9, Figures 2E,F), suggesting there is no difference in vesicle release probability in tauP301L pos neurons as compared to in tauP301L neg neurons. Further, both approaches results in the same release probability measurement (Pr = 0.1), which is consistent with previously measured release probabilities using VGlut1-pHluorin (Leitz and Kavalali, 2011; Chanaday and Kavalali, 2018). Thus, the vesicle release probability results show that the increases in VGlut1-pHluorin intensity observed in Figure 1 are not caused by an overall increase in vesicle release probability in tauP301L pos neurons as compared to tauP301L neg controls. Together, these results suggest that neither proposed pathway (i) or (ii) are the mechanism by which tauP301L pos VGlut1-pHluorin intensity is larger than tauP301L neg.
TauP301L pos neurons exhibit quantized increase in VGlut1-pHluorin intensity-per-vesicle as compared to tauP301L neg neurons
If single vesicle VGlut1-pHluorin intensity alone reproduces observed differences between tauP301L neg and tauP301L pos neurons, as proposed in pathway (iii), then single vesicle release event intensities should be ∼1.4x the VGlut1-pHluorin intensity per tauP301L neg vesicle. Before establishing intensity per vesicle, we sought to establish that only a single vesicle is released during a stimulus event since previous VGlut1-pHluorin experiments have established that presynapses can exhibit multiple vesicle release (Maschi and Klyachko, 2017; Maschi et al., 2018, 2021), which may also increase observed VGlut1-pHluorin intensities. We observed that the average width per release event, a measure of MVR, was the same for both tauP301L pos and tauP301L neg (Supplementary Figures 5A–C; p = 0.91), indicating that the increase in intensity in tauP301L pos compared to tauP301L neg is not due to an increase in multiple vesicle release.
We next determined if the average VGlut1-pHluorin intensity per vesicle alone could explain observed increases in tauP301L pos VGlut1-pHluorin intensity compared to tauP301L neg. To determine single vesicle intensity, we used established integrated intensity of presynapses during low-stimulation frequencies (Leitz and Kavalali, 2011; Maschi and Klyachko, 2017; Chanaday and Kavalali, 2018), in combination with simple thresholding analysis to determine release events (Supplementary Figure 4A). Briefly, we used an integrated intensity box around single release events (Dotted Box, Figure 3A), and plotted the integrated intensity as a function of time (Figure 3B). We then quantified the difference between the background intensity and the average intensity after release (ΔF in Figure 3B). We note that our observed release events have the same rise-time (∼500 ms), dwell time (∼2 s, Supplementary Figure 4C), and decay time as previously observed in VGlut1-pHluorin measurements (Leitz and Kavalali, 2011; Chanaday and Kavalali, 2018).
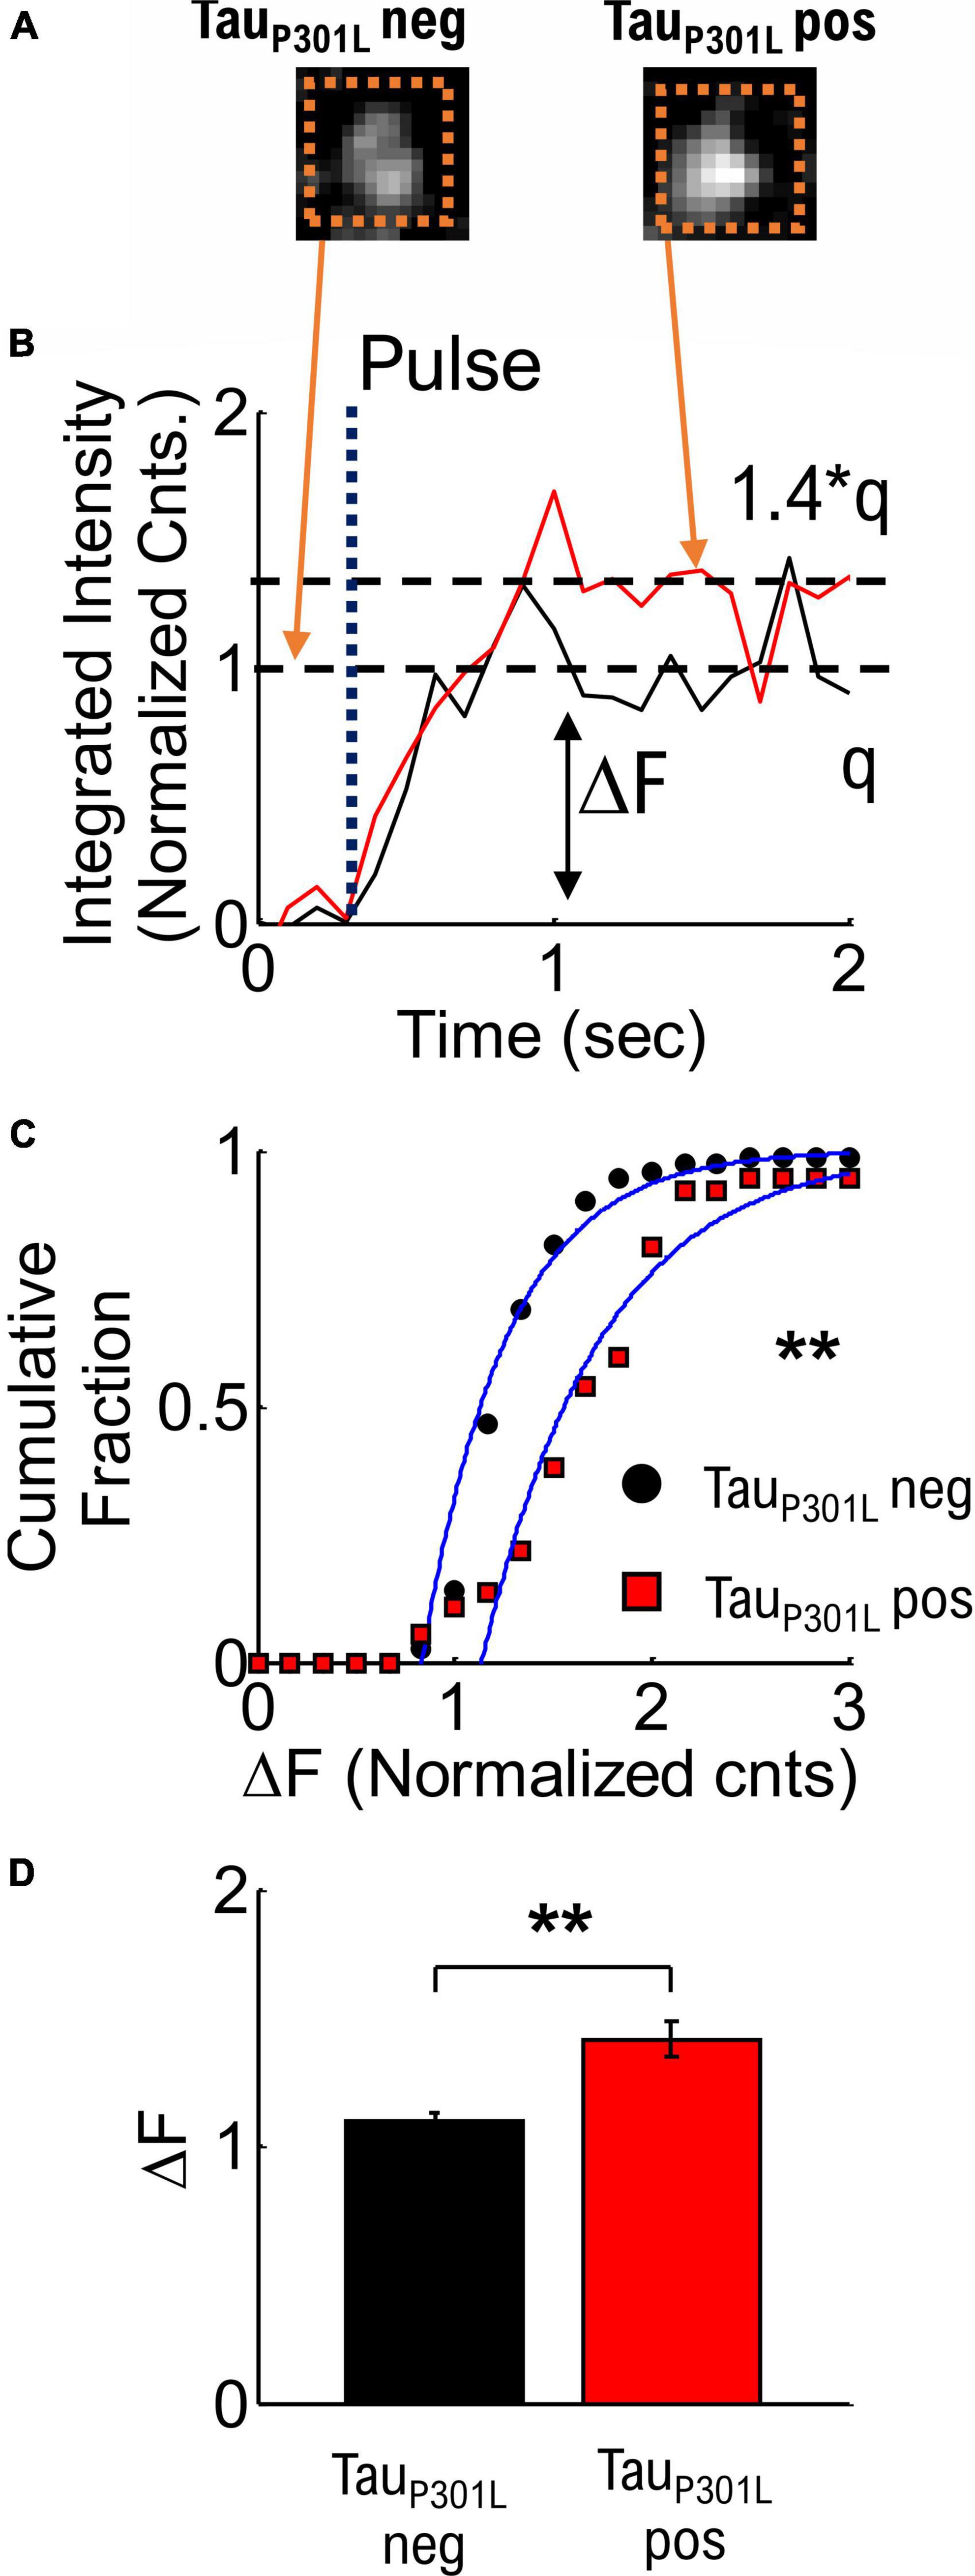
Figure 3. Quantized single vesicle pHlluorin-VGLUT1 intensity accounts for overall increased tauP301L pos pHluorin intensity compared to tauP301L neg neurons. (A) Example single vesicle events and integrated intensity analysis (Dashed Orange Boxes) for tauP301L neg and tauP301L pos neurons. (B) Sample integrated intensities traces for tauP301L neg (Black line) and tauP301L pos (Red Line) background subtracted and normalized to the average tauP301L neg intensity. Single release events are observed after a stimulus pulse (Dotted Line labeled Pulse). TauP301L pos neurons exhibit larger intensity (ΔF) increase (1.4*q) than tauP301L neg (q). (C) Cumulative fraction of aggregate single vesicle intensity [t] (ΔF) after stimulus (1 or 2 Hz) relative to background. All data normalized to average tauP301L neg intensity. Both curves fit with a cumulative fit function (Blue solid lines). (D) Mean ± SEM intensity per single vesicle release event for tauP301L neg and tauP301L pos from cumulative fractions in (C). tauP301L neg N = 70 vesicles, five samples from 4 litters; tauP301L pos N = 56 vesicles, five samples from 4 litters. **P < 0.01, KS two-tailed test.
To compare tauP301L pos and tauP301L neg single vesicle release event VGlut1-pHluroin intensity, we next aggregated the quantized integrated intensities (Figure 3C). The mean intensity for tauP301L pos neurons was ∼1.4x times the tauP301L neg intensity (p = 0.0046, Figure 3D). This result supports the hypothesis that the increase in VGlut1-pHluorin intensity in tauP301L pos compared to tauP301L neg is due exclusively to increased single vesicle VGlut1-pHluorin intensity. Further, since VGlut1-pHluorin intensity comes from a single fluorophore per VGlut1 transport, the increase in single vesicle VGlut1-pHluorin intensity is caused by an increase in the number of VGlut1 transporters per vesicle.
TauP301L positive neurons exhibit increased VGlut1 expression compared to tauP301L negative neurons
To establish if tauP301L pos neurons exhibit increased VGlut1 expression at 14–18 DIV cultures, we used immunostaining of synaptophysin and VGlut1 in cultured neurons (Figure 4) from tauP301L pos and tauP301L neg littermates. We then imaged puncta of synaptophysin intensity (Figure 4A), VGlut1 puncta intensity (Figure 4B), and accepted only co-localized puncta peaks to quantify relative puncta intensity (Figure 4C).
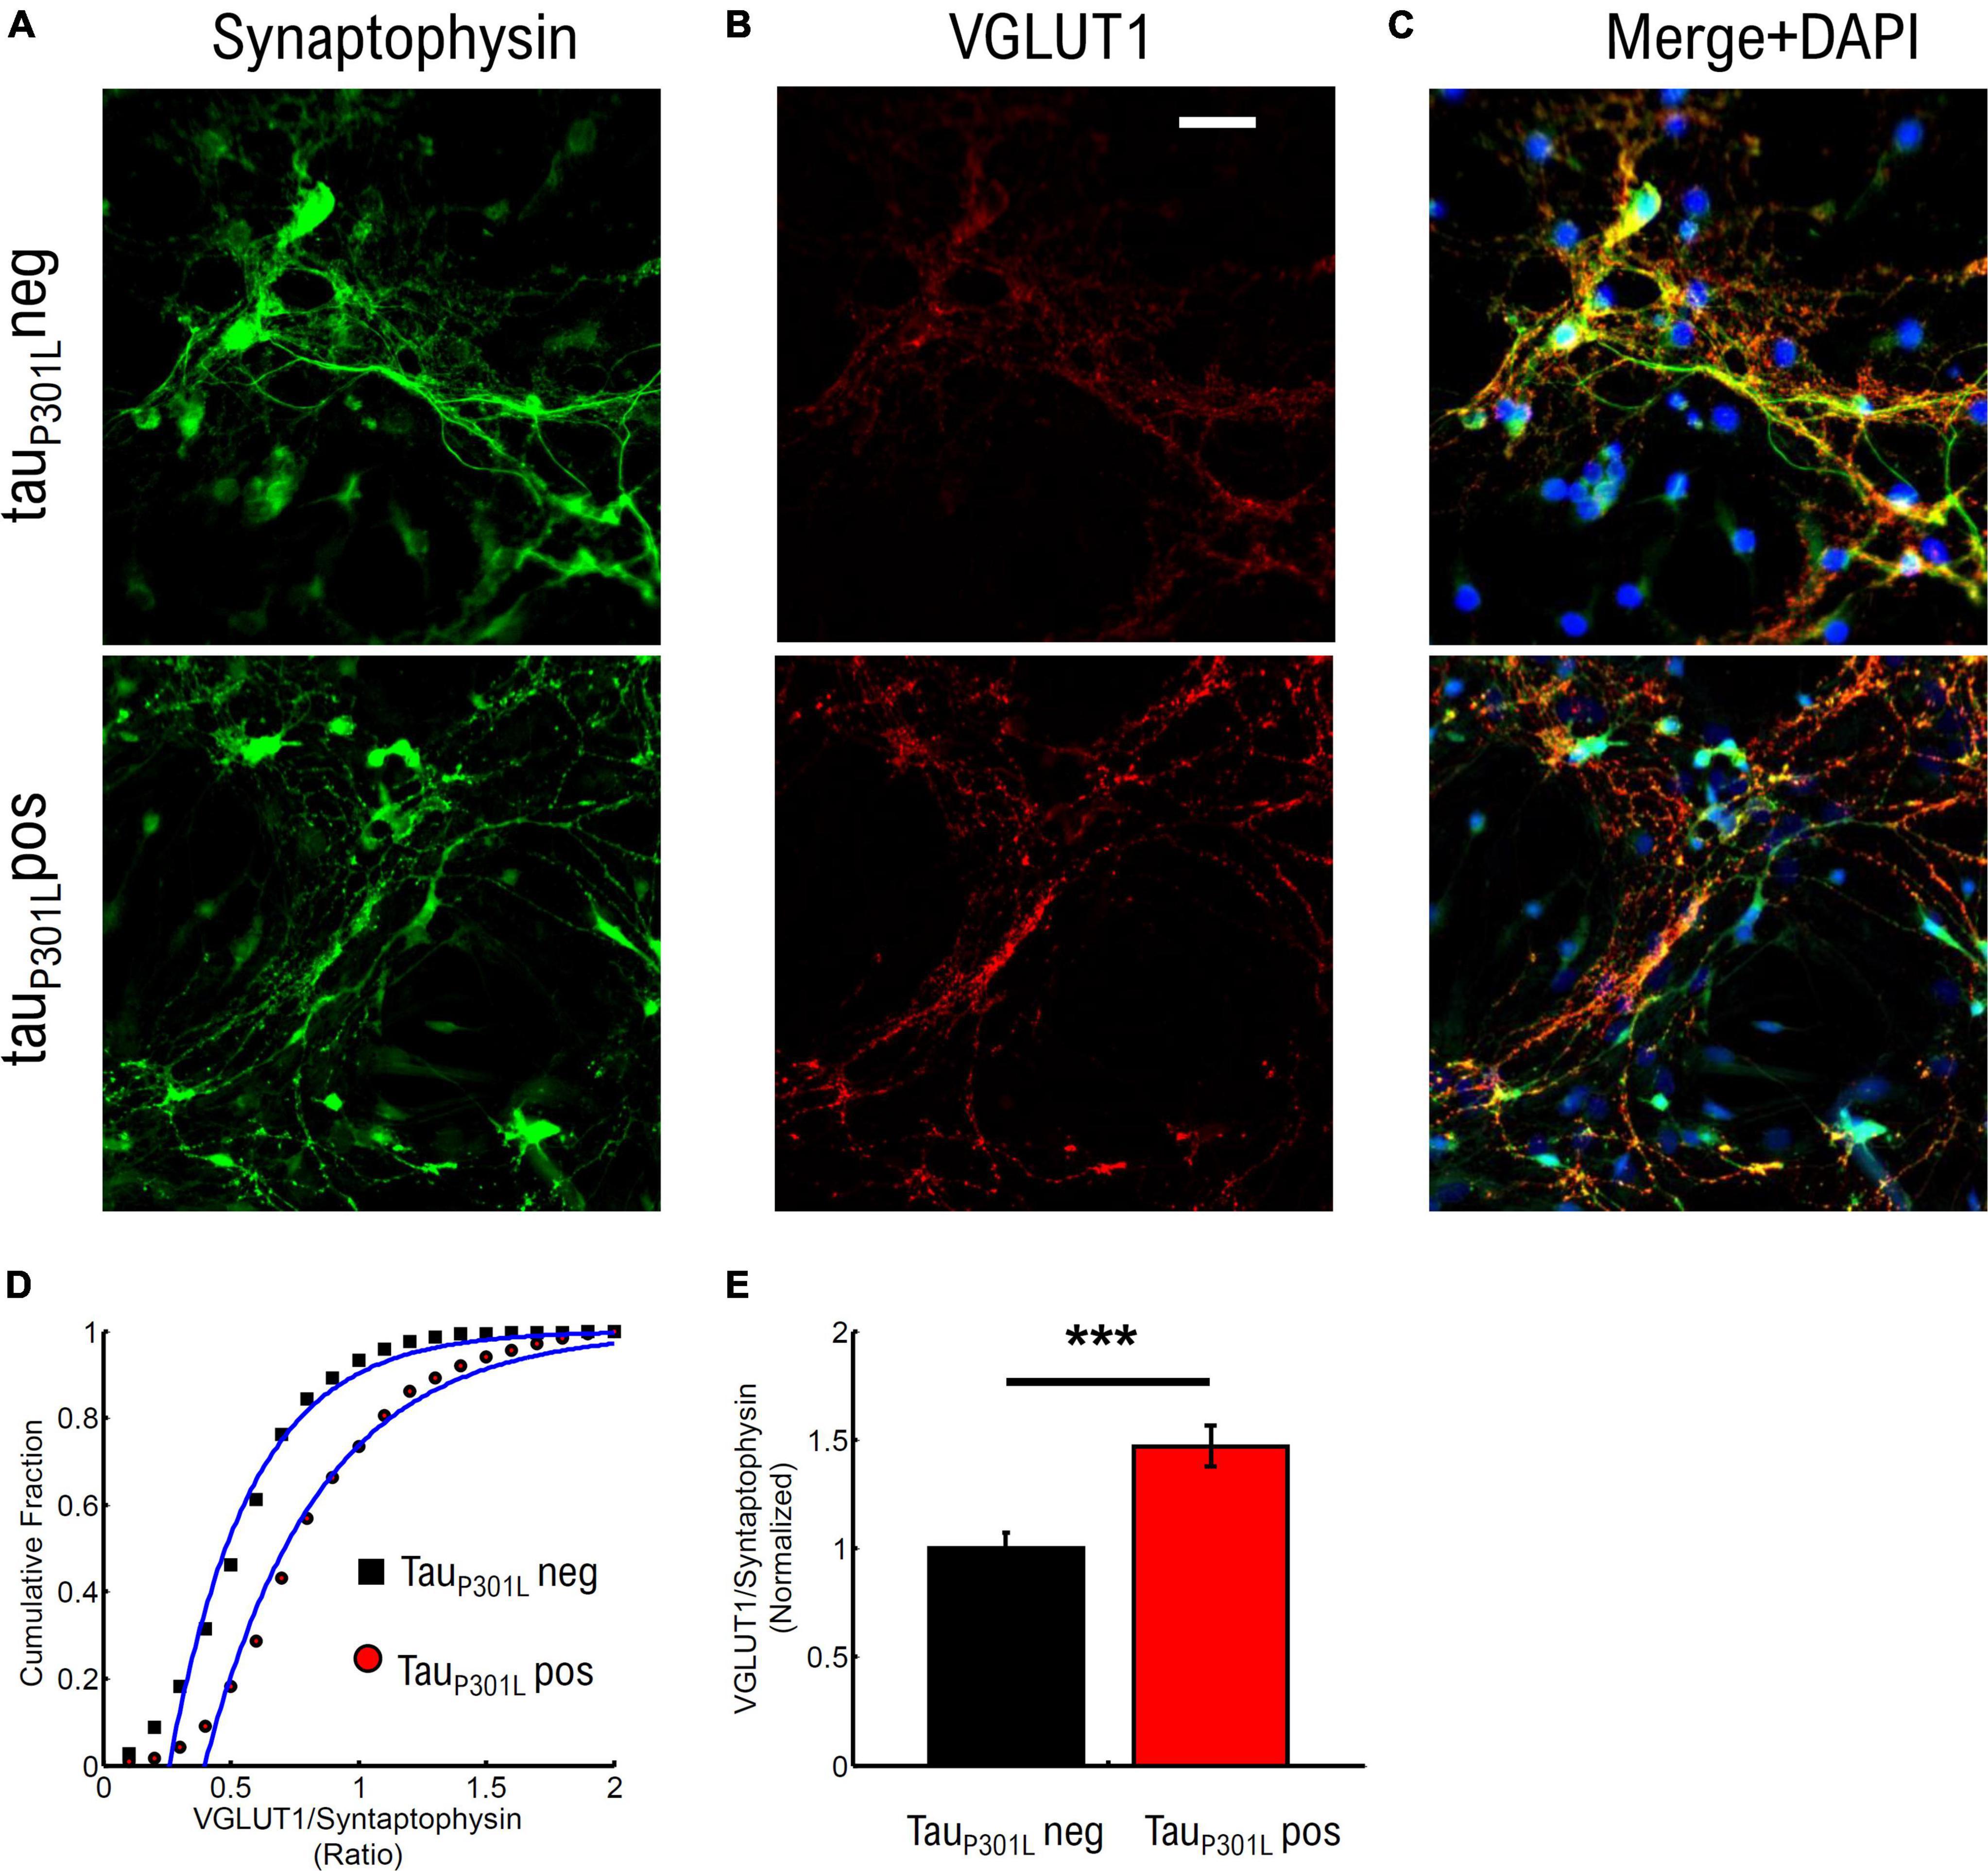
Figure 4. TauP301L pos neurons exhibit increased overall VGLUT1 expression compared to tauP301L neg neurons. (A) Stained Synaptophysin intensity for tauP301L neg (top), tauP301L pos (bottom). (B) Stained VGLUT1 intensity for tauP301L neg (top), tauP301L pos (bottom). (C) Merged Synaptophysin (Green), VGLUT1 (Red), and DAPI (Blue) for tauP301L neg (top), tauP301L pos (bottom). (D) Cumulative distribution of VGLUT1/Synaptophysin intensity ratio for tauP301L neg (black) and tauP301L pos (red). (E) Mean ratio of VGLUT1/Synaptophysin intensity from fits in (D) and normalized to tauP301L neg. Error-bars are errors of fit to data in (D). ***P < 0.001, two-tailed student t-Test. tauP301L neg N = 780, five samples from 3 litters; tauP301L pos N = 1132, five samples from 3 litter.
We compared the ratio of VGlut1/synaptophysin intensities to determine if an increase in VGlut1 is observed. The cumulative distribution of intensity ratios showed a clear increase in VGlut1 relative to synaptophysin for tauP301L pos neurons compared to tauP301L neg littermates (Figure 4D). To determine the relative increase in VGlut1, we then compared the fit mean values (Blue Lines Figure 4D) and observed a relative increase in VGlut1 of ∼1.48x (p < 0.001) in tauP301L pos neurons (Figure 4E). We note that the synaptophysin intensity distribution varied less than 4% between samples of the same litter and across litters for both tauP301L pos neurons compared to tauP301L neg (Supplementary Figure 6).
These results show that VGlut1 expression is increased in tauP301L pos mice compared to tauP301L neg mice in cultured hippocampal neurons at 14–18 DIV. Further, the 40–50% increase in VGlut1 observed here is consistent with the 40% increase in VGlut1 levels previously observed in adult tauP301L pos mice (Hunsberger et al., 2014, 2015).
TauP301L pos neurons exhibit increased glutamate release as compared to tauP301L neg neurons
The concentration of glutamate per vesicle has been shown to be proportional to the number of VGlut1 transporters on the vesicle (Wilson et al., 2005). Increased glutamate concentration per vesicle would, in turn, result in an increased glutamate concentration in the synaptic cleft upon release. To establish the consequences of increased VGlut1 transporters per vesicle in tauP301L pos neurons, we measured extracellular glutamate release using the established glutamate reporter iGluSnFR (Marvin et al., 2018) in which a membrane-bound GFP fluorescent protein fluoresces when glutamate exocytosed and binds the reporter (Figure 5A). Thus, the intensity of this reporter is proportional to the amount of glutamate released during synaptic transmission (Marvin et al., 2018).
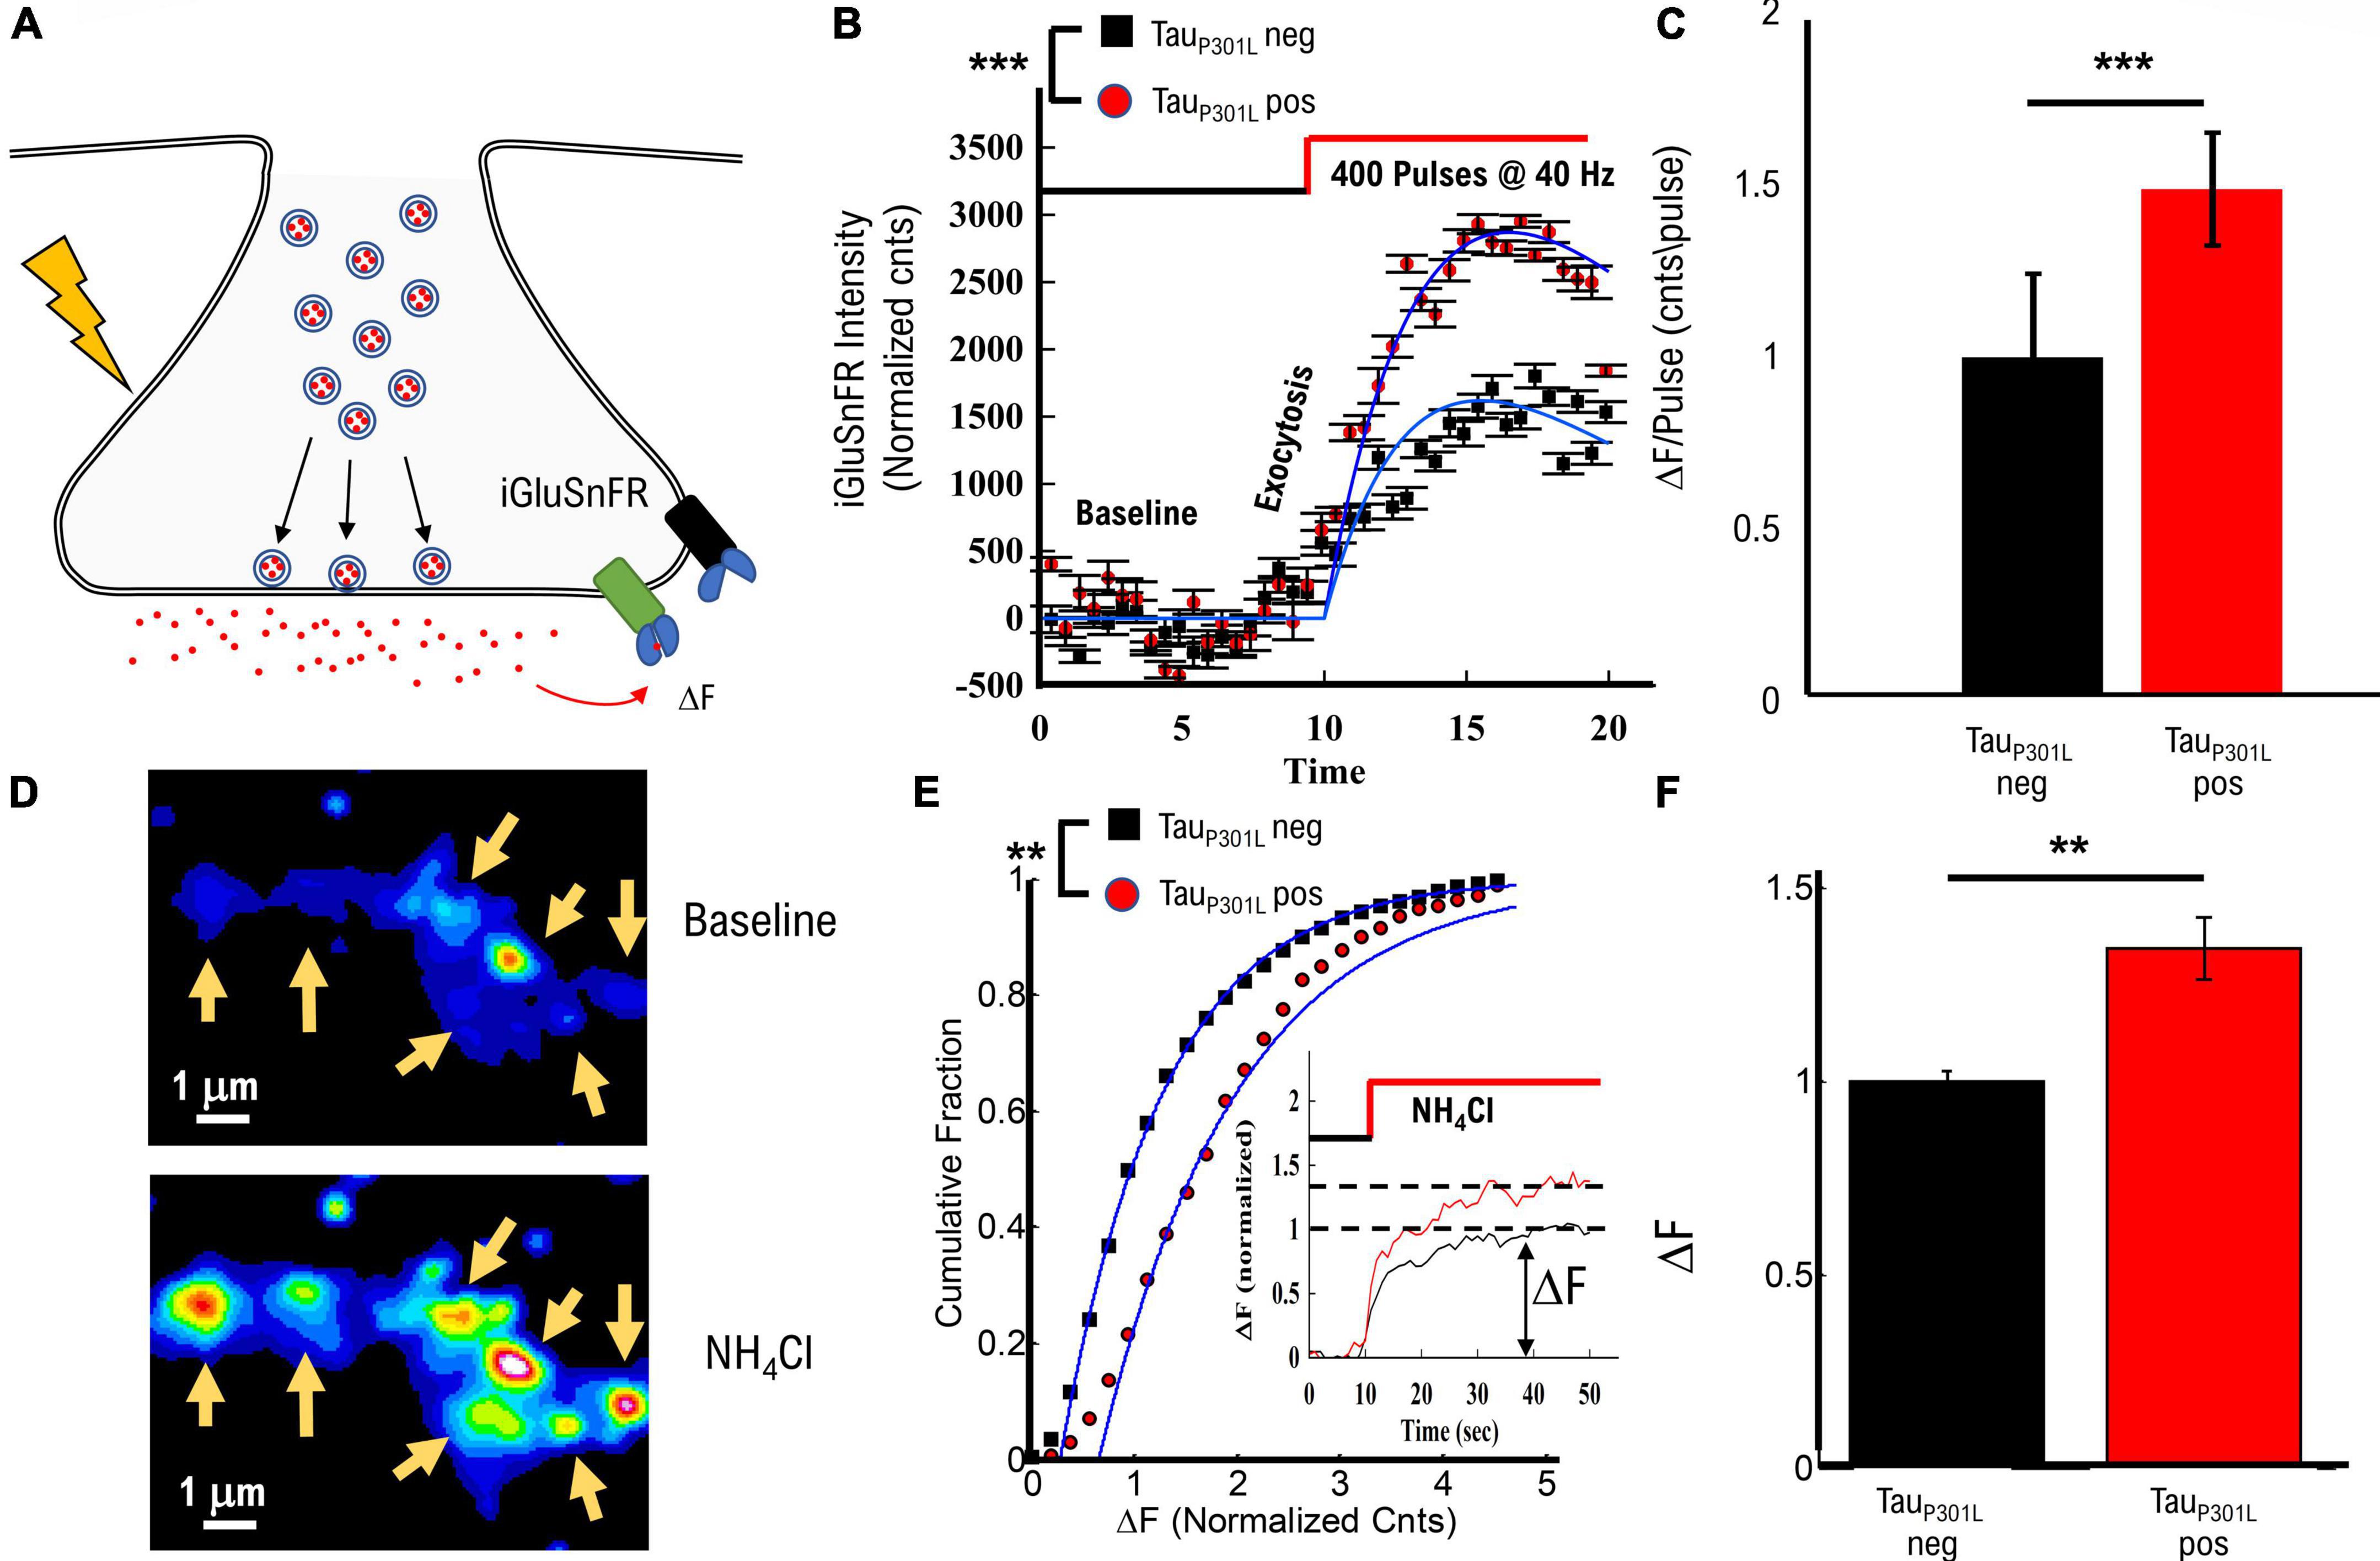
Figure 5. TauP301L pos exhibit increased overall iGluSnFR intensity compared to tauP301L neg controls. (A) Representation of iGluSnFR fluorescence observed during presynaptic transmission. (B) Example of raw iGluSnFR data observed before and directly after presynapse unloading induced by NH4Cl. (C) Comparison of iGluSnFR intensity before, during 40 Hz stimulation for tauP301L neg (Black) and tauP301L pos (red) neurons. (D) Comparison of intensity/pulse for tauP301L neg (Black) and tauP301L pos (red) neurons. (E) Quantitative comparison of NH4Cl induced iGluSnFR intensity. Inset shows example traces during exposure to NH4Cl. (F) Comparison of mean iGluSnFR intensity increase for tauP301L neg (Black) and tauP301L pos (red). 40 Hz: tauP301L neg N = 49 presynapses, from two samples; P301L N = 60 presynapses, from two samples; NH4Cl: tauP301L neg N = 375 presynapses, from two samples; P301L N = 526 presynapses, from two samples; ***P < 0.001, from Mann–Whitney U; **P < 0.01 for two-tailed t-Test. Error-bars are error of fits.
To determine the effects of increased VGlut1 on stimulated release of extracellular glutamate per synapse, we used the same single bout of 40 Hz stimulation approach for Vglut1-pHluorin as used in Figure 1. Intensity increased during 40 Hz stimulation for both tauP301L neg and tauP301L pos (Figure 5B), but tauP301L pos exhibited a significantly greater overall intensity consistent with observed changes in VGlut1-pHluorin (Figure 1C). We then used the same continuum model fit used for VGlut1-pHluorin (eq. 1) to quantify the difference observed in the iGluSnFR intensity. We found that tauP301L pos neurons exhibited a similar increase in iGlSnFR intensity compared to tauP301L neg (p < 0.001, Figure 5C).
To determine the effects of increased VGlut1 on overall extracellular glutamate release per synapse and support our 40 Hz stimulated results, we applied NH4Cl in the bath solution during imaging, which has been shown to alkalinize internal presynaptic compartments, release internal Ca2+, partially de-polarize the membrane and drive vesicles to exocytose at the membrane (Figure 5D; Ganguly et al., 2015; Lazarenko et al., 2017; Chanaday and Kavalali, 2018) resulting in a significant increase in iGluSnFR intensity (Figure 5D). Importantly, the overall spatial scale of intensity increase is the same as observed in VGlut1-pHluorin intensity (Figure 1B), which supports that our glutamate measurement is localized to the presynaptic regions, consistent with previous iGluSnFR studies in hippocampal cell cultures (Marvin et al., 2018). We quantitatively compared intensity increase for iGluSnFR over the same spatial range surrounding identified presynapse locations as used in pHluorin to proportionally compare any changes.
We observed a significant increase in iGluSnFR intensity in tauP301L pos as compared to tauP301L neg controls (Figure 5E). Mean tauP301L pos intensity increased by ∼1.4x compared to tauP301L neg controls (p = 0.0025; Figure 5F). This increased iGluSnFR intensity is proportional to both the overall increase in pHluorin intensity during stimulation (Figure 1 and Supplementary Figures 1C,D) and increased single vesicle intensity (Figure 3). Thus, the iGluSnFR results support the hypothesis [pathway (iii)] that increased VGlut1 transporters per vesicle result in an increased extracellular glutamate release into the synaptic cleft.
Estimated increase in number of VGlut1 transporters per vesicle
The results from this study provide key insights into presynaptic changes that may support observed cognitive changes during disease progression. The results here show that the number of vesicles released during synaptic transmission do not change in tauP301L pos neurons, but the number of VGlut1 transporters is increased. We can now use these results to estimate how many VGlut1 transporters per vesicle exist in tauP301L pos and how many vesicles are released during synaptic transmission, which can then be used to better model changes that occur later in disease progression.
Since single vesicle VGlut1-pHluorin intensity is caused by the intensity per VGlut1 transporter, it is not physically possible for tauP301L pos single vesicles to have 1.4x the number of VGlut1 transporters as they must be whole integers. We can then use the single vesicle intensity distributions to estimate the number of VGlut1 transporters per vesicle in both tauP301L neg and tauP301L pos. We first consider that the integer number of VGlut1 transporters per vesicle in tauP301L neg (N, Figure 6A) results in the mean single vesicle intensity observed, and the distribution of number of VGlut1 transporters equals the variance in observed intensity (σ, Figure 6A). The observed increase in the tauP301L pos Gaussian distribution of intensity must then be constrained to an integer number (1.4*N, Figure 6B), with an integer variance in the number per vesicle (σ, Figure 6B). These constraints leave a limited number of potential options for the number of VGlut1 channels that satisfy both the tauP301L neg and tauP301L pos distributions (Table 1).
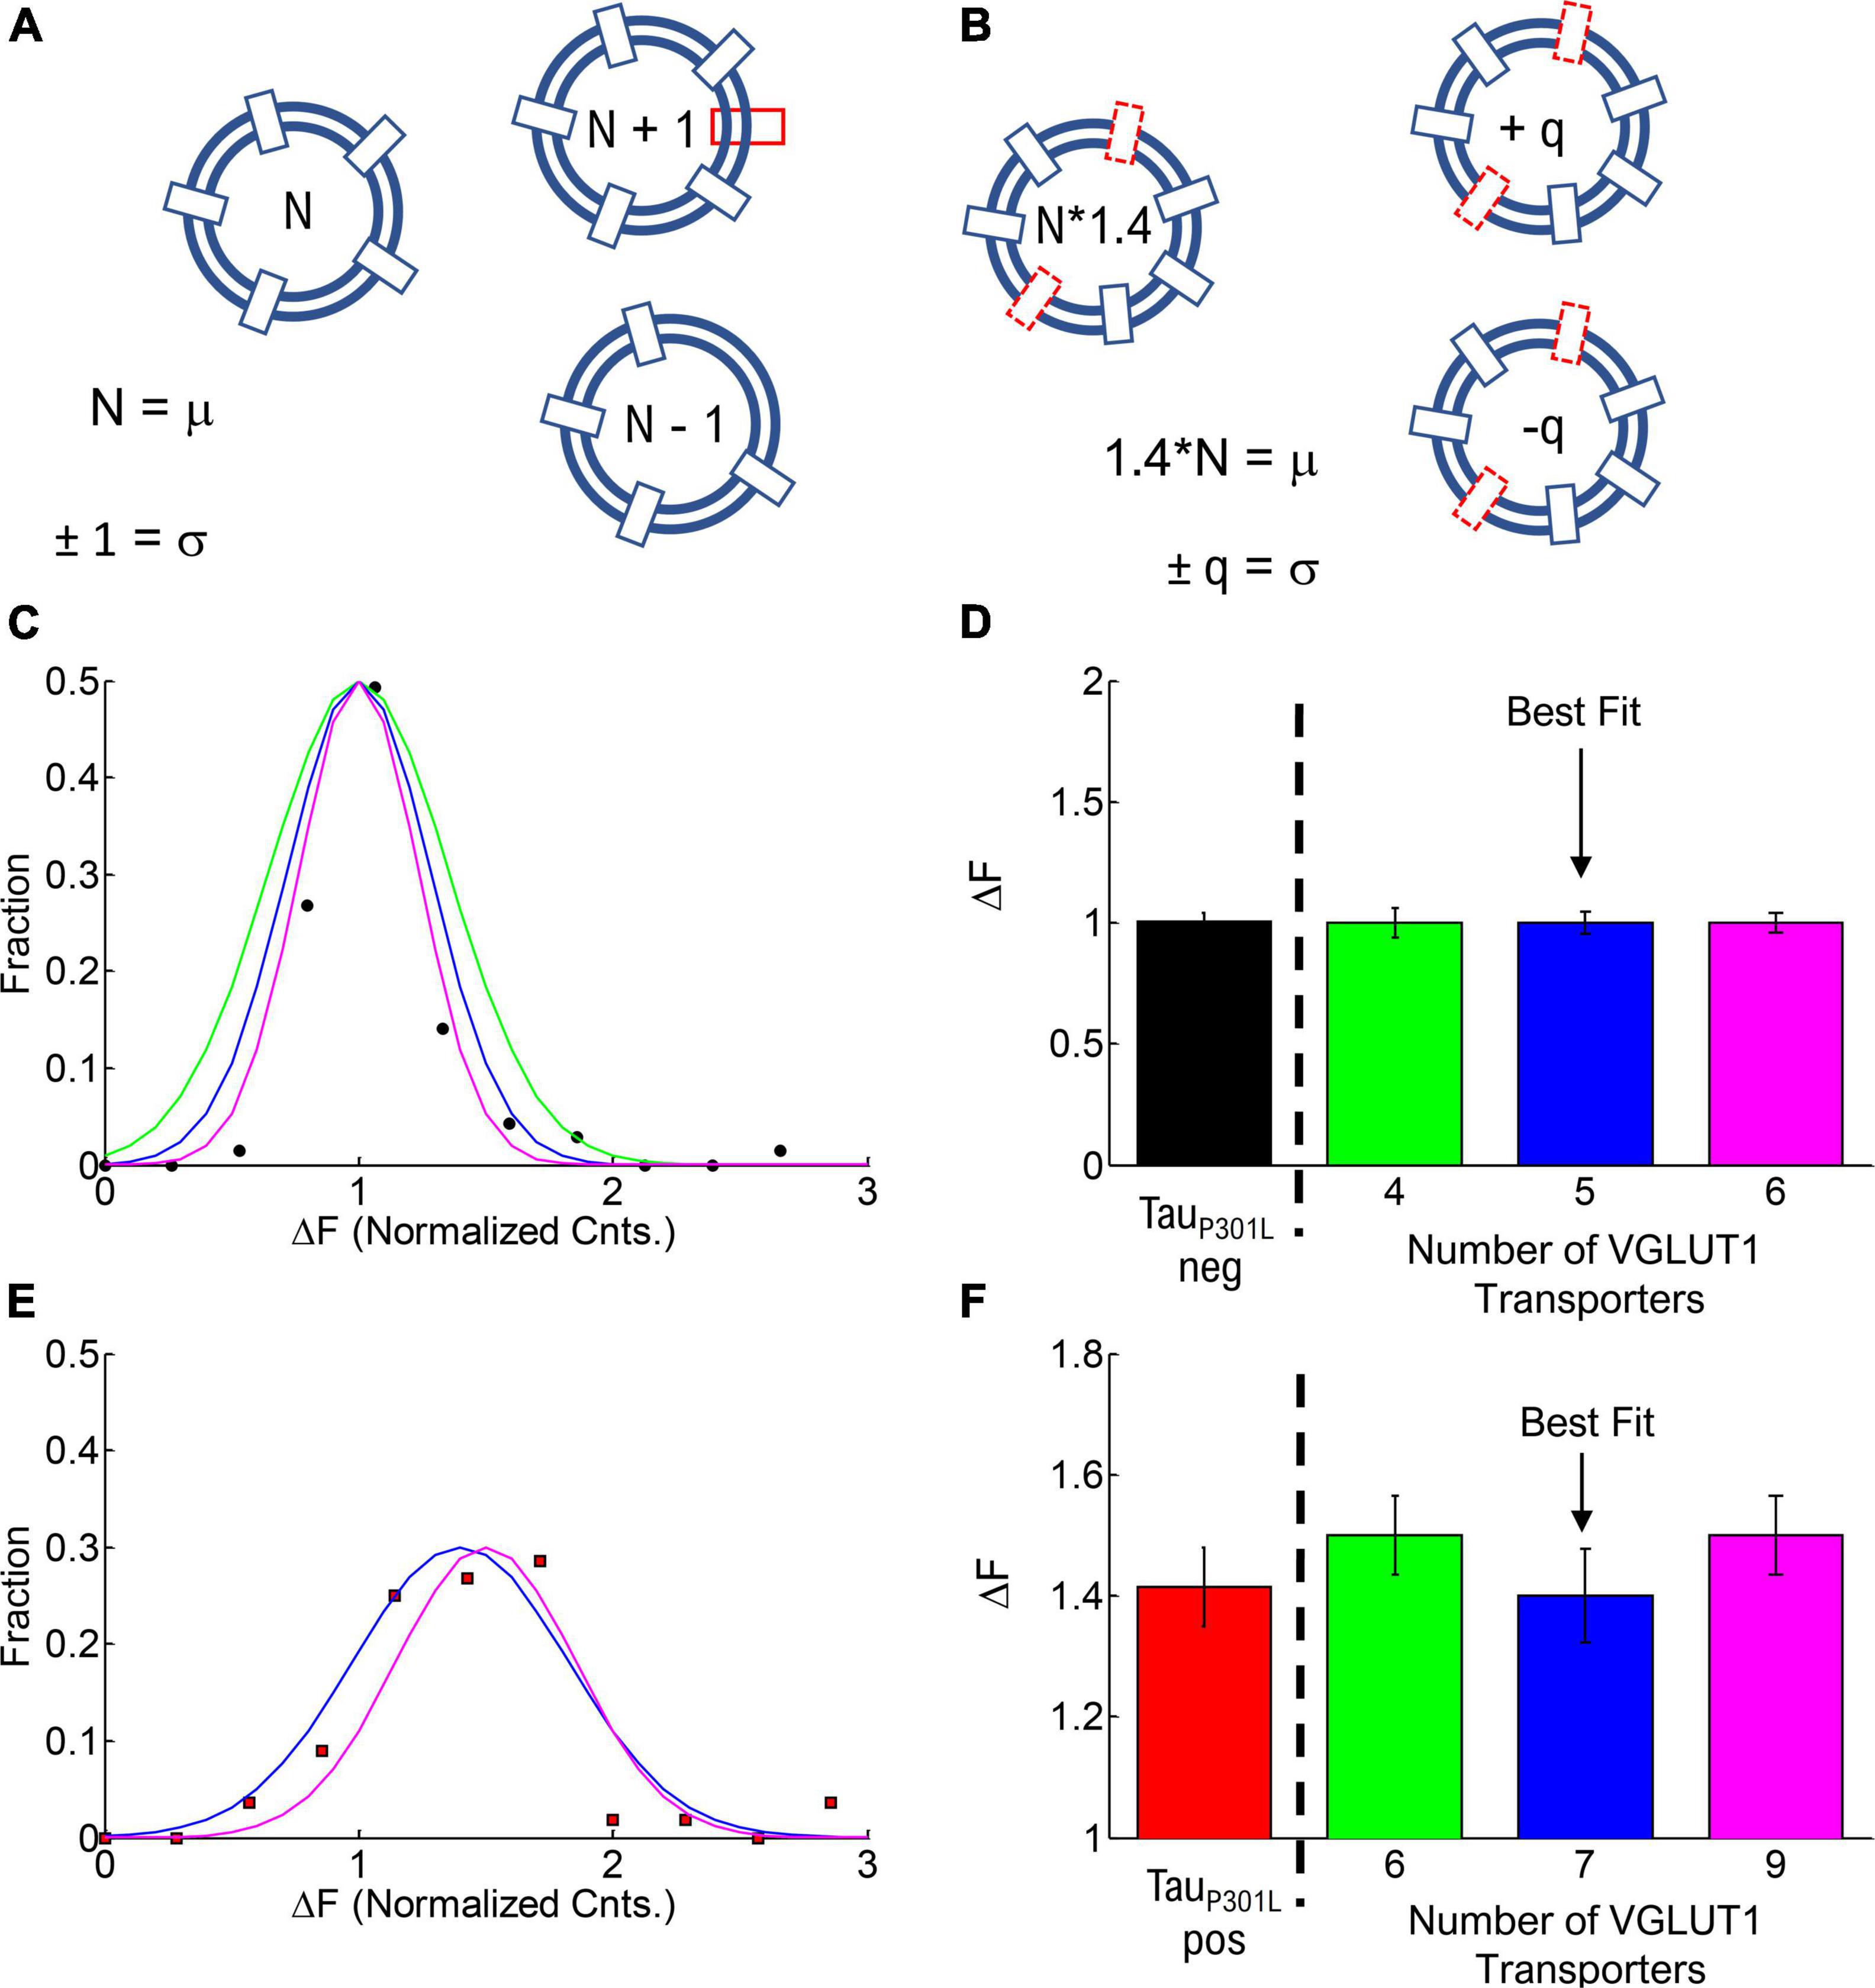
Figure 6. Estimate of number of VGLUT1 transporters per vesicle. (A) Cartoon model of the number of VGLUT1 transporters per vesicle (N) and the variance in number (σ). (B) Cartoon model of the increase in number of VGLUT1 transporters in tauP301L pos (N*1.4) and the variance in number (σ). (C) Fraction of single vesicle intensities per vesicle in tauP301L neg (Solid circles) and modeled integer number of VGLUT1 transporters per vesicle of 4 (Green), 5 (Blue), and 6 (Magenta), with each having a variance of 1 per vesicle. (D) Normalized intensity per vesicle and variance for all modeled options of tauP301L neg (Colors same as C). (E) Fraction of single vesicle intensities per vesicle in P301L (Solid squares) and modeled integer number of VGLUT1 transporters per vesicle equal to the nearest integer increase above tauP301L neg (6 = 1.5*4, Green), (7 = 1.4*5, Blue), and (9 = 1.5*6, Magenta), with each having a variance of 1 per vesicle. (F) Normalized intensity per vesicle and variance for all modeled options of tauP301L pos (Colors same as E).
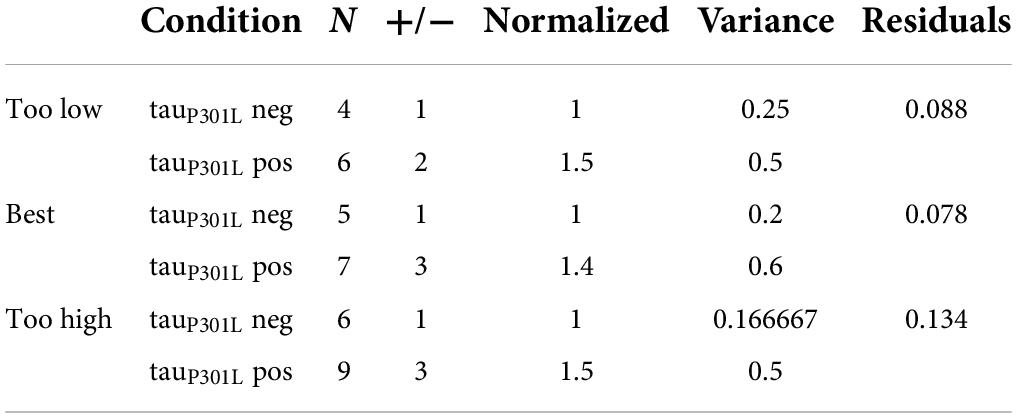
Table 1. Estimated change in number of VGlut1 transporters per vesicle in tauP301L pos and tauP301L neg conditions. Best estimate in the number of transporters was determined by residuals square fit to experimental results (Figures 6C–F).
We first modeled the tauP301L neg single vesicle condition to find the minimum number of VGlut1 transporters that would satisfy the observed result (Figures 6C,D). We found that a minimum of 4 transporters with a variance of 1 and a maximum of 6 transporters with a variance of 1 satisfied the constraints observed experimentally; below or above those values lead to values outside previously physically observed limits of VGlut1 transporters (between 5 and 12 transporters per vesicle) (Takamori et al., 2006).
We then multiplied the number of VGlut1 transporters per tauP301L neg vesicle (4, 5, 6) by the factor that resulted in the next nearest integer number of vesicle per transporter; for example, an N = 4 transporters for tauP301L neg would be multiplied by 1.5* to get an integer increase to 6 transporters per tauP301L pos vesicle. We then found that for tauP301L neg VGlut1 to have both N = 4, 6 would require a factor of 1.5 times to get the nearest integer of VGlut1 of 6 (Green, Figures 6E,F) and 9 (Magenta, Figures 6E,F) respectively in tauP301L pos. The best fit result was the model of N = 5 VGlut1 transporters for tauP301L neg and N = 7 = 1.4*5 VGlut1 transporters for tauP301L pos (Blue, Figures 6E,F).
Discussion
In this present study, we found tauP301L pos mice exhibit increased VGlut1-pHluorin intensity compared to tauP301L neg littermates using the pH-sensitive fluorescent protein VGlut1-pHluorin (Figure 1). We hypothesized that there were several pathways that could result in increased tauP301L pos pHluorin intensity (Supplementary Figure 2). We found that the increased pHluorin intensity was not stimulation frequency dependent (Figure 2), and that the release probability was the same for both tauP301L pos and tauP301L neg (Figure 2). After establishing that only single vesicles released for each stimulation pulse (Supplementary Figure 5), we observed that each single release event exhibited an ∼1.4x VGlut1-pHluorin intensity for tauP301L pos as compared to tauP301L neg (Figure 3) and that tauP301L pos mice exhibited increased VGlut1 levels compared to tauP301L neg littermates at 14–18 DIV (Figure 4). Finally, we measured extracellular glutamate released using the fluorescent reporter iGluSnFR, and found that tauP301L pos neurons exhibit a 1.4x increase in glutamate released as compared to tauP301L neg littermates (Figure 5). We conclude that increased single vesicle pHluorin intensity is caused by an increase in VGlut1 per vesicle, and the increased VGlut1 results in increased extracellular glutamate released during synaptic transmission.
One major problem in understanding how tau mediates presynaptic pathological changes during disease progression is inconsistent results from different methodological approaches. Further, altered VGlut1 levels and tau mislocalization in the presynapse can have confounding effects on presynaptic transmission. Therefore, it is essential to put the results from this study in the broader context of previous studies on tauopathy effects on presynaptic transmission.
First, our cellular culture approach differs from other cell culture approaches in keyways. We studied tauP301L pos neurons grown on tauP301L pos astrocytes and compared their differences to tauP301L neg neurons grown on tauP301L neg astrocytes. Previous studies have used immortalized hippocampal cells or neuroblastoma (SHSY5Y) cell lines to study tau-induced VGlut1 levels, which have not been shown to be directly related to the time-course of tauopathy in P301L (Siano et al., 2019). Alternatively, primary hippocampal neurons in htau mouse lines have been grown directly on treated glass coverslips (Zhou et al., 2017; McInnes et al., 2018), but their results are physiologically limited because previous studies have also shown that neuron-astrocyte interactions can be a contributing factor in cell cultures of tauopathy models (Sidoryk-Wegrzynowicz et al., 2017). Further, cultured hippocampal neuron studies used transfection with a htau mutation to show a significant reduction in presynaptic transmission (Zhou et al., 2017; McInnes et al., 2018; Siano et al., 2019); however, it has not been shown how acute introduction of tau is directly related to the normal time-course of neurodegeneration. Therefore, our approach provides the advantage of measuring tau-mediated presynaptic vesicle release changes during their development, and in the presence of their appropriate astrocytic growth factors.
Second, our observation of VGlut1 and our isolation of presynaptic transmission from postsynaptic signaling allows for a direct measurement of the contribution of VGlut1 in presynaptic transmission in tauopathy models. Previous age-dependent in vivo mouse model studies have been able to correlate changes in VGlut1 expression levels and their effect on calcium (Wu et al., 2021) or glutamate (Hunsberger et al., 2014, 2015), but these studies could not directly measure if VGlut1 levels mediated increased extracellular glutamate; this is particularly important because changes in VGlut1 levels have been shown to directly affect presynaptic release probability (Wilson et al., 2005, p. 1). Direct measurements of VGlut1 levels on synaptic transmission using in vitro cell culture methods were inconsistent with in vivo results (Siano et al., 2019), possibly due to the limitations of the cell culture approach used, as outlined above. The approach in our study directly measures VGlut1, extracellular glutamate, and blocks the post-synaptic response, thereby allowing for an isolated measurement on presynaptic transmission. However, we note that an increase in the variance of the number of VGlut1 transporters per vesicle (Figure 6), could have a contributing factor to differences in post-synaptic response at the single quantal release level. This possibility could be pursued in future combined studies of pre/post-synaptic transmission in our model.
Finally, our measurement of single vesicle VGlut1 levels and single vesicle presynaptic release probability separates the confounding roles of VGlut1 and vesicle release. It is not clear if presynaptic VGlut1 levels increase prior to tau-mediated decreases in presynaptic transmission or if the two occur simultaneously. Previous in vitro studies of tau binding to single vesicles resulting in a reduction in presynaptic transmission did not measure VGlut1 levels and were done using htau transfections (Zhou et al., 2017; McInnes et al., 2018). Alternatively, in vitro or in vivo cell culture VGlut1 expression level experiments showed a change in extracellular glutamate levels but did not directly measure single vesicle presynaptic transmission (Hunsberger et al., 2015).
Conclusion
Confounding tau-mediated changes in presynaptic mechanisms make it difficult to distinguish presynaptic contributions to disease progression in AD. Previous studies have shown that tau mediates increases in VGlut1-transporters per vesicle and reductions in presynaptic release probability, however, no study has determined if these changes occur simultaneously or separately. Our results show that increases in VGlut1-transporters per vesicle can occur prior to tau-mediated reduction in release probability. Further, our results show that increased VGlut1-transporters per vesicle result in an increase in extracellular glutamate release, supporting the hypothesis that increased presynaptic glutamate release mediates hyperexcitable states in AD.
Materials and methods
Continuum model of Vglut1-pHluorin/iGluSnFR intensity with electrical stimulation
There are two potential contributions from vesicle recycling mechanics that could result in the differences between tauP301L pos and tauP301L neg intensity. Because each exocytosed vesicle immediately begins the endocytosis process, observed VGlut1-pHluorin intensity simultaneously includes increasing intensity from exocytosis (ΔF/pulse, Figure 1A) and decreasing intensity from endocytosis (τendo, Figure 1A; Chanaday and Kavalali, 2018). To delineate their relative contributions, we developed a continuum fit function that can distinguish exocytosis and endocytosis parameters, while reproducing observed intensities:
where FBKG is the starting background intensity, τBKG is the background photobleaching rate constant, ΔFPulse is the pHluorin intensity increase per pulse, f is the stimulation frequency, Θ is the Heaviside function, τendo is the endocytosis rate constant.
This continuum function reproduced the observed VGlut1-pHluorin intensity with time for both tauP301L pos and tauP301L neg neurons (Blue Solid Lines, Figure 1C). From this analysis, we were able to separately quantify the intensity increase per stimulus (ΔFPulse, Left Panel, Figure 1D) and the endocytosis rate (τendo, Right Panel, Figure 1D).
Computational model of Vglut1-pHluorin intensity with electrical stimulation
Our model is based on the established binomial model of presynaptic transmission (Reid and Clements, 1999; Scheuss and Neher, 2001; Lanore and Silver, 2016). The established model predicts a presynaptic response to a single stimulus as:
where R is the response, p is the probability of release per stimulus, and q is the post-synaptic response.
Here we modify the traditional model to reproduce Vglut1-pHluorin intensity as (See Supplementary materials):
where each simulation time-step (Δt) includes the intensity from the previous simulation time-step, a total background intensity (IBKG, equivalent to eq. 1), and a probabilistic increase (p) in intensity given by a per vesicle count (ΔF, equivalent to eq. 1) from each stimulus pulse, and each vesicle has the same endocytosis rate (τ, equivalent to eq. 1).
In the present study, we used parameters for endocytosis and release probability based on experimentally determined values obtained in this study. We required that all vesicles have the same endocytosis rate (τ = 7 sec–1), found from fits in eq. 1. To model tauP301L neg single vesicle release probability per stimulus pulse, we used the experimentally observed release probability (P = 0.1) found in the present study (Figure 4D). We allowed the intensity per vesicle and overall release probability per site to change in order to model observed tauP301L pos intensity.
To confirm the validity of this model, we first compared its results to observed tauP301L neg VGlut1-pHluorin intensity. This model reproduced observed experimental tauP301L neg VGlut1-pHluorin intensity (Solid line through tauP301L neg, Supplementary Figure 2) with equivalently good agreement as the continuum model in eq. 1 (Figure 1C). Further, this model results in the same quantitative intensity per pulse as the experimentally observed (Left Panel Figure 2D). Thus, this model provides a sufficient representation of observed presynaptic release for modeling tauP301L pos VGlut1-pHluorin.
The first pathway is tested experimentally in the following section “TauP301L pos neurons exhibit quantized increase in VGlut1-pHluorin intensity-per-vesicle as compared to tauP301L neg neurons.” The second pathway, modeled computationally as an increased p-value (p, eq. 3), reproduces observed tauP301L pos intensity (Solid Line, Supplementary Figure 2); this pathway is experimentally tested in section “TauP301L positive neurons exhibit increased VGlut1 expression compared to tauP301L negative neurons.” The third pathway, modeled as an increase in the VGlut1-pHluorin intensity per vesicle (ΔF, eq. 3), results in the same observed tauP301L pos VGlut1-pHluorin intensity (Dashed Line overlaps solid line, Supplementary Figure 2).
Single vesicle release measurements
To measure single vesicle release events we used a standard threshold analysis (Supplementary Figure 4) to measure vesicles at low stimulation. Our approach is similar to a previously established method of observing single Vglut1-pHluorin intensity events at low stimulation frequencies (Maschi and Klyachko, 2017). Briefly, we stimulate cultured neurons at a fixed frequency (1, 2, or 10 Hz) for 30 s and observe VGlut1-pHluorin intensity during stimulation, followed by a higher frequency stimulation to confirm presynaptic location. We count the number of pulses until the first release event is observed (Figures 4A,B). For low stimulation frequencies (1 or 2 Hz), a single release event was typically observed for several frames before endocytosis occurred (Figure 4A); whereas, for a moderate stimulation frequency (10 Hz), recurring events resulted in increasing intensity after the initial release (Figure 4B). Consequently, we take the pulse just before the onset of intensity as the first release event (Green Arrow, Figure 4A). We then aggregate the number of pulses before the first release event is observed for each condition to determine the release probability (Red arrows, Figures 4A–C). Lastly, we then define the release probability as the inverse of the mean number of pulses until release (Figure 4A):
We note that the definition in our present study differs from previous VGlut1-pHluorin measurements, where a single pulse is initiated and a small number of release events are counted (Maschi and Klyachko, 2017; Maschi et al., 2018). However, this approach presents an effective quantitative comparison between tauP301L pos and tauP301L neg vesicle release probability because they are being compared using the same metric.
Single vesicle intensity analysis
To determine integrated intensity changes in single vesicle release events, we quantified the average intensity for the first five frames above our threshold (Supplementary Figure 4) and subtracted the average intensity for five frames just before the threshold. Aggregate cumulative distributions for all measured release event intensities (ΔF) was then compared for tauP301L pos (Red Squares, Figure 3C) and tauP301L neg (Black Circles, Figure 3C). We then fit both distributions to a cumulative fit function (Blue Lines, Figure 3C), and compared the resulting fit means to quantitatively determine the difference between tauP301L pos and tauP301L neg.
Imaging media for VGlut1-pHluorin and iGluSnFR experiments
All experiments were performed with samples between 34 and 37°C within a whole-microscope incubator (OKO Labs) at DIV14–19 (As described in Supplementary materials). During experiments, cultures were perfused with bath solution (140 mM NaCl, 2.5 mM KCl, 2 mM CaCl2, 4 mM MgCl2, 10 mM HEPES, 2 mM Glucose, 50 mM DL-AP5, 10 mM CNQX, pH adjusted to pH 7.4), consistent with previous VGlut1-pHluorin experiments (Leitz and Kavalali, 2011; Chanaday and Kavalali, 2018; Maschi et al., 2018). Solutions were heated using a temperature controller attached to a multi-line solution heater (Warner Instruments). Ammonium Chloride solutions contained the above solution mixture plus 50 mM NH4Cl and pH-balanced to 7.4.
Immunocytochemistry data analysis
Immunohistochemistry samples were prepared and imaged as described in Supplementary materials. Images were analyzed by first subtracting using a 30-pixel rolling ball radius in ImageJ; followed by a 2-pixel Gaussian-blur to reduce noise. Peak intensity (x,y) locations were then identified separately for each channel (Synaptophysin, Figure 4A; and VGlut1, Figure 4B). Peak intensity positions that co-localized in both channels to within 1 pixel (<367 nm) were then identified using matlab code. Finally, the ratio of co-localized peak intensities (VGlut1/Synaptophysin) were aggregated and tauP301L neg compared to tauP301L pos (Figure 4).
Data availability statement
The raw data supporting the conclusions of this article will be made available by the authors, without undue reservation.
Ethics statement
The animal study was reviewed and approved by Auburn University Institutional Animal Care and Use Committee (IACUC).
Author contributions
MG and MR performed the experimental design and analysis. ET managed the mouse colony breeding and sample preparation. MG, ET, MH, and JP performed the experiments. MG, ET, MH, JP, and MR analyzed the experimental results and wrote the manuscript. MG performed the computational analysis. All authors contributed to the article and approved the submitted version.
Funding
MG and MR would like to acknowledge Auburn University internal grant funding for support for the results in this manuscript.
Acknowledgments
We would like to thank Washington University Hope Center Viral Vector Core for the production of the Glut1-pHluorin vector used in this study.
Conflict of interest
The authors declare that the research was conducted in the absence of any commercial or financial relationships that could be construed as a potential conflict of interest.
Publisher’s note
All claims expressed in this article are solely those of the authors and do not necessarily represent those of their affiliated organizations, or those of the publisher, the editors and the reviewers. Any product that may be evaluated in this article, or claim that may be made by its manufacturer, is not guaranteed or endorsed by the publisher.
Supplementary material
The Supplementary Material for this article can be found online at: https://www.frontiersin.org/articles/10.3389/fnsyn.2022.925546/full#supplementary-material
References
Abbott, L. F., and Regehr, W. G. (2004). Synaptic computation. Nature 431, 796–803. doi: 10.1038/nature03010
Bell, K. F. S., Bennett, D. A., and Cuello, A. C. (2007). Paradoxical upregulation of glutamatergic presynaptic boutons during mild cognitive impairment. J. Neurosci. 27:10810. doi: 10.1523/JNEUROSCI.3269-07.2007
Chanaday, N. L., and Kavalali, E. T. (2018). Optical detection of three modes of endocytosis at hippocampal synapses. eLife 7:e36097. doi: 10.7554/eLife.36097
Crescenzi, R., DeBrosse, C., Nanga, R. P. R., Byrne, M. D., Krishnamoorthy, G., D’Aquilla, K., et al. (2017). Longitudinal imaging reveals subhippocampal dynamics in glutamate levels associated with histopathologic events in a mouse model of tauopathy and healthy mice. Hippocampus 27, 285–302. doi: 10.1002/hipo.22693
Ganguly, A., Tang, Y., Wang, L., Ladt, K., Loi, J., Dargent, B., et al. (2015). A dynamic formin-dependent deep F-actin network in axons. J. Cell Biol. 210, 401–417. doi: 10.1083/jcb.201506110
Gramlich, M. W., and Klyachko, V. A. (2017). Actin/myosin-v- and activity-dependent inter-synaptic vesicle exchange in central neurons. Cell Rep. 18, 2096–2104. doi: 10.1016/j.celrep.2017.02.010
Gramlich, M. W., Balseiro-Gómez, S., Tabei, S. M. A., Parkes, M., and Yogev, S. (2021). Distinguishing synaptic vesicle precursor navigation of microtubule ends with a single rate constant model. Sci. Rep. 11:3444. doi: 10.1038/s41598-021-82836-7
Herman, M. A., Ackermann, F., Trimbuch, T., and Rosenmund, C. (2014). Vesicular glutamate transporter expression level affects synaptic vesicle release probability at hippocampal synapses in culture. J. Neurosci. 34:11781. doi: 10.1523/JNEUROSCI.1444-14.2014
Hoover, B. R., Reed, M. N., Su, J., Penrod, R. D., Kotilinek, L. A., Grant, M. K., et al. (2010). Tau mislocalization to dendritic spines mediates synaptic dysfunction independently of neurodegeneration. Neuron 68, 1067–1081. doi: 10.1016/j.neuron.2010.11.030
Hunsberger, H. C., Rudy, C. C., Batten, S. R., Gerhardt, G. A., and Reed, M. N. (2014). P301L tau expression affects glutamate release and clearance in the hippocampal trisynaptic pathway. J. Neurochem. 132, 169–182. doi: 10.1111/jnc.12967
Hunsberger, H. C., Weitzner, D. S., Rudy, C. C., Hickman, J. E., Libell, E. M., Speer, R. R., et al. (2015). Riluzole rescues glutamate alterations, cognitive deficits, and tau pathology associated with P301L tau expression. J. Neurochem. 135, 381–394. doi: 10.1111/jnc.13230
Ittner, L. M., Ke, Y. D., Delerue, F., Bi, M., Gladbach, A., van Eersel, J., et al. (2010). Dendritic function of tau mediates amyloid-β toxicity in Alzheimer’s disease mouse models. Cell 142, 387–397. doi: 10.1016/j.cell.2010.06.036
Kashani, A., Lepicard, È, Poirel, O., Videau, C., David, J. P., Fallet-Bianco, C., et al. (2008). Loss of vglut1 and vglut2 in the prefrontal cortex is correlated with cognitive decline in Alzheimer disease. Neurobiol. Aging 29, 1619–1630. doi: 10.1016/j.neurobiolaging.2007.04.010
Kazim, S. F., Chuang, S.-C., Zhao, W., Wong, R. K. S., Bianchi, R., and Iqbal, K. (2017). Early-onset network hyperexcitability in presymptomatic Alzheimer’s disease transgenic mice is suppressed by passive immunization with anti-human app/aβ antibody and by mglur5 blockade. Front. Aging Neurosci. 9:71. doi: 10.3389/fnagi.2017.00071
Klyachko, V. A., and Stevens, C. F. (2006). Excitatory and feed-forward inhibitory hippocampal synapses work synergistically as an adaptive filter of natural spike trains. PLoS Biol. 4:e207. doi: 10.1371/journal.pbio.0040207
Lanore, F., and Silver, R. A. (2016). Extracting quantal properties of transmission at central synapses. Neuromethods 113, 193–211. doi: 10.1007/978-1-4939-3411-9_10
Lazarenko, R. M., DelBove, C. E., Strothman, C. E., and Zhang, Q. (2017). Ammonium chloride alters neuronal excitability and synaptic vesicle release. Sci. Rep. 7, 5061–5061. doi: 10.1038/s41598-017-05338-5
Leitz, J., and Kavalali, E. T. (2011). Ca2+ influx slows single synaptic vesicle endocytosis. J. Neurosci. 31:16318. doi: 10.1523/JNEUROSCI.3358-11.2011
Liu, L., Drouet, V., Wu, J. W., Witter, M. P., Small, S. A., Clelland, C., et al. (2012). Trans-synaptic spread of tau pathology in vivo. PLoS One 7:e31302. doi: 10.1371/journal.pone.0031302
Mackenzie, I. R. A., and Miller, L. A. (1994). Senile plaques in temporal lobe epilepsy. Acta Neuropathol. 87, 504–510. doi: 10.1007/BF00294177
Marvin, J. S., Scholl, B., Wilson, D. E., Podgorski, K., Kazemipour, A., Müller, J. A., et al. (2018). Stability, affinity, and chromatic variants of the glutamate sensor iGluSnFR. Nat. Methods 15, 936–939. doi: 10.1038/s41592-018-0171-3
Maschi, D., and Klyachko, V. A. (2017). Spatiotemporal regulation of synaptic vesicle fusion sites in central synapses. Neuron 94, 65–73.e3.
Maschi, D., Gramlich, M. W., and Klyachko, V. A. (2018). Myosin V functions as a vesicle tether at the plasma membrane to control neurotransmitter release in central synapses. ELife 7:e39440. doi: 10.7554/eLife.39440
Maschi, D., Gramlich, M. W., and Klyachko, V. A. (2021). Myosin V regulates spatial localization of different forms of neurotransmitter release in central synapses. Front. Synaptic Neurosci. 13:650334.
McInnes, J., Wierda, K., Snellinx, A., Bounti, L., Wang, Y.-C., Stancu, I.-C., et al. (2018). Synaptogyrin-3 mediates presynaptic dysfunction induced by tau. Neuron 97, 823–835.e8.
Palop, J. J., Chin, J., Roberson, E. D., Wang, J., Thwin, M. T., Bien-Ly, N., et al. (2007). Aberrant excitatory neuronal activity and compensatory remodeling of inhibitory hippocampal circuits in mouse models of Alzheimer’s disease. Neuron 55, 697–711. doi: 10.1016/j.neuron.2007.07.025
Peters, S. T., Fahrenkopf, A., Choquette, J. M., Vermilyea, S. C., Lee, M. K., and Vossel, K. (2020). Ablating tau reduces hyperexcitability and moderates electroencephalographic slowing in transgenic mice expressing a53t human α-synuclein. Front. Neurol. 11:563. doi: 10.3389/fneur.2020.00563
Pooler, A. M., Phillips, E. C., Lau, D. H. W., Noble, W., and Hanger, D. P. (2013). Physiological release of endogenous tau is stimulated by neuronal activity. EMBO Rep. 14:389. doi: 10.1038/embor.2013.15
Ramsden, M., Kotilinek, L., Forster, C., Paulson, J., McGowan, E., SantaCruz, K., et al. (2005). Age-dependent neurofibrillary tangle formation, neuron loss, and memory impairment in a mouse model of human tauopathy (P301L). J. Neurosci. 25:10637. doi: 10.1523/JNEUROSCI.3279-05.2005
Reid, C. A., and Clements, J. D. (1999). Postsynaptic expression of long-term potentiation in the rat dentate gyrus demonstrated by variance-mean analysis. J. Physiol. 518, 121–130. doi: 10.1111/j.1469-7793.1999.0121r.x
Roberson, E. D., Halabisky, B., Yoo, J. W., Yao, J., Chin, J., Yan, F., et al. (2011). Amyloid-β/Fyn–induced synaptic, network, and cognitive impairments depend on tau levels in multiple mouse models of Alzheimer’s disease. J. Neurosci. 31:700. doi: 10.1523/JNEUROSCI.4152-10.2011
Roberson, E. D., Scearce-Levie, K., Palop, J. J., Yan, F., Cheng, I. H., Wu, T., et al. (2007). Reducing endogenous Tau ameliorates amyloid ß-induced deficits in an Alzheimer’s disease mouse model. Science 316:750. doi: 10.1126/science.1141736
SantaCruz, K., Lewis, J., Spires, T., Paulson, J., Kotilinek, L., Ingelsson, M., et al. (2005). Tau suppression in a neurodegenerative mouse model improves memory function. Science 309, 476–481. doi: 10.1126/science.1113694
Scheuss, V., and Neher, E. (2001). Estimating synaptic parameters from mean, variance, and covariance in trains of synaptic responses. Biophys. J. 81, 1970–1989. doi: 10.1016/S0006-3495(01)75848-1
Siano, G., Varisco, M., Caiazza, M. C., Quercioli, V., Mainardi, M., Ippolito, C., et al. (2019). Tau modulates VGluT1 expression. J. Mol. Biol. 431, 873–884.
Sidoryk-Wegrzynowicz, M., Gerber, Y. N., Ries, M., Sastre, M., Tolkovsky, A. M., and Spillantini, M. G. (2017). Astrocytes in mouse models of tauopathies acquire early deficits and lose neurosupportive functions. Acta Neuropathol. Commun. 5:89. doi: 10.1186/s40478-017-0478-9
Takamori, S., Holt, M., Stenius, K., Lemke, E. A., Grønborg, M., Riedel, D., et al. (2006). Molecular anatomy of a trafficking organelle. Cell 127, 831–846. doi: 10.1016/j.cell.2006.10.030
Toniolo, S., Sen, A., and Husain, M. (2020). Modulation of brain hyperexcitability: potential new therapeutic approaches in Alzheimer’s disease. Int. J. Mol. Sci. 21:9318. doi: 10.3390/ijms21239318
Voglmaier, S. M., Kam, K., Yang, H., Fortin, D. L., Hua, Z., Nicoll, R. A., et al. (2006). Distinct endocytic pathways control the rate and extent of synaptic vesicle protein recycling. Neuron 51, 71–84. doi: 10.1016/j.neuron.2006.05.027
Wilson, N. R., Kang, J., Hueske, E. V., Leung, T., Varoqui, H., Murnick, J. G., et al. (2005). Presynaptic regulation of quantal size by the vesicular glutamate transporter VGLUT1. J. Neurosci. 25, 6221–6234.
Wu, M., Zhang, M., Yin, X., Chen, K., Hu, Z., Zhou, Q., et al. (2021). The role of pathological tau in synaptic dysfunction in Alzheimer’s diseases. Transl. Neurodegener. 10:45. doi: 10.1186/s40035-021-00270-1
Yamada, K., Holth, J. K., Liao, F., Stewart, F. R., Mahan, T. E., Jiang, H., et al. (2014). Neuronal activity regulates extracellular tau in vivo. J. Exp. Med. 211:387. doi: 10.1084/jem.20131685
Keywords: tau, fluorescence microscope methods, computational model, presynaptic transmission, cell culture, hippocampus, VGlut1, glutamate
Citation: Taipala E, Pfitzer JC, Hellums M, Reed MN and Gramlich MW (2022) rTg(TauP301L)4510 mice exhibit increased VGlut1 in hippocampal presynaptic glutamatergic vesicles and increased extracellular glutamate release. Front. Synaptic Neurosci. 14:925546. doi: 10.3389/fnsyn.2022.925546
Received: 21 April 2022; Accepted: 01 July 2022;
Published: 03 August 2022.
Edited by:
Martin Heine, Johannes Gutenberg University Mainz, GermanyReviewed by:
Alexey P. Bolshakov, Institute of Higher Nervous Activity and Neurophysiology (RAS), RussiaRachel E. Jackson, King’s College London, United Kingdom
Copyright © 2022 Taipala, Pfitzer, Hellums, Reed and Gramlich. This is an open-access article distributed under the terms of the Creative Commons Attribution License (CC BY). The use, distribution or reproduction in other forums is permitted, provided the original author(s) and the copyright owner(s) are credited and that the original publication in this journal is cited, in accordance with accepted academic practice. No use, distribution or reproduction is permitted which does not comply with these terms.
*Correspondence: Michael W. Gramlich, bXdnMDAxNkBhdWJ1cm4uZWR1