 Jan M. Schulz
 Peter Redgrave
 John N. J. Reynolds
94% of researchers rate our articles as excellent or good
Learn more about the work of our research integrity team to safeguard the quality of each article we publish.
Find out more
GENERAL COMMENTARY article
Front. Synaptic Neurosci. , 31 August 2015
Volume 7 - 2015 | https://doi.org/10.3389/fnsyn.2015.00013
A commentary on
Cortico-striatal spike-timing dependent plasticity after activation of subcortical pathways
by Schulz, J. M., Redgrave, P., and Reynolds, J. N. J. (2010). Front. Syn. Neurosci. 2:23. doi: 10.3389/fnsyn.2010.00023
The arrangement of the panels in Figure 4 of the article by Schulz et al. (2010) is incorrect. The order of the panels A and B in Figure 4 was erroneously reversed, so that the graphs do not match the figure legend and the references in the text. Here, we provide the original figure with the correct panel arrangement.
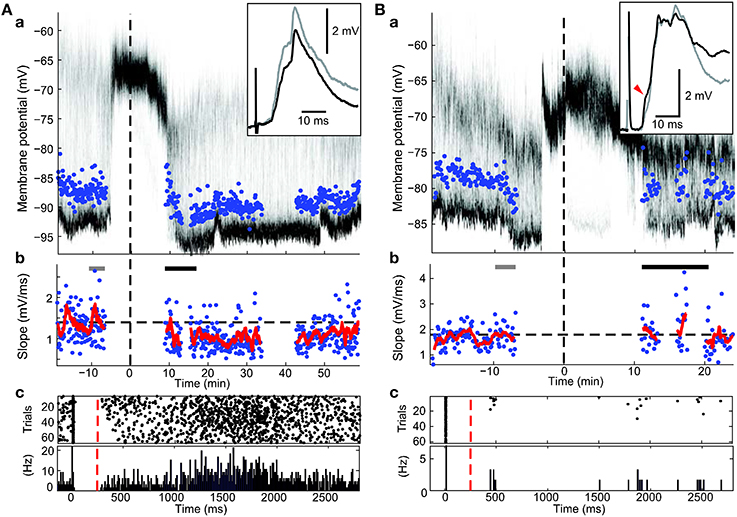
Figure 4. Effects of post-light spike rate on cortico-striatal plasticity in experiments involving pre-post pairing. (a) Time-resolved membrane potential distribution. Gray-scale indicates the probability for the neuron to be at respective membrane potential (y-axis); black depicts a high probability, white a low probability. Time on the x-axis is given in relation to BIC ejection (dotted line at 0). Maximum amplitude of PSPs is indicated. (b) Maximal slopes of PSP. Dashed line indicates mean PSP slopes before at baseline. Running average of 9 consecutive values is indicated (red trace). PSP traces (top right inset in a) are mean PSPs recorded in the time indicated by the gray and black bars, respectively. (c) Raster plot and peri-stimulus time histogram of spikes during the pairing protocol. Cortical stimulus was applied at 0, the intracellular current pulse at approximately 10 ms, and light at 250 ms (red dashed line). (A) Example recording showing depression (p < 0.001; Wilcoxon rank sum test). Note the high spike rate post-light. (B) Example recording showing a selective increase in a PSP component (red arrow head; p < 0.05; Wilcoxon rank sum test) without a significant change of the overall PSP slope.
The authors declare that the research was conducted in the absence of any commercial or financial relationships that could be construed as a potential conflict of interest.
Keywords: STDP, striatum, superior colliculus, spiny projection neuron, HFS, in vivo, intracellular, dopamine
Citation: Schulz JM, Redgrave P and Reynolds JNJ (2015) Corrigendum: Cortico-striatal spike-timing dependent plasticity after activation of subcortical pathways. Front. Synaptic Neurosci. 7:13. doi: 10.3389/fnsyn.2015.00013
Received: 31 July 2015; Accepted: 07 August 2015;
Published: 31 August 2015.
Edited and reviewed by: Dirk Feldmeyer, RWTH Aachen University, Germany
Copyright © 2015 Schulz, Redgrave and Reynolds. This is an open-access article distributed under the terms of the Creative Commons Attribution License (CC BY). The use, distribution or reproduction in other forums is permitted, provided the original author(s) or licensor are credited and that the original publication in this journal is cited, in accordance with accepted academic practice. No use, distribution or reproduction is permitted which does not comply with these terms.
*Correspondence: Jan M. Schulz,ai5zY2h1bHpAdW5pYmFzLmNo
Disclaimer: All claims expressed in this article are solely those of the authors and do not necessarily represent those of their affiliated organizations, or those of the publisher, the editors and the reviewers. Any product that may be evaluated in this article or claim that may be made by its manufacturer is not guaranteed or endorsed by the publisher.
Research integrity at Frontiers
Learn more about the work of our research integrity team to safeguard the quality of each article we publish.