- 1Soil and Water Management Research, Ambo Agricultural Research Center, Ethiopian Institute of Agricultural Research (EIAR), Addis Ababa, Ethiopia
- 2Ambo Agricultural Research Center, Ambo, Ethiopia
Understanding the socioeconomic profile of a particular watershed is essential for effective project planning prior to intervention. This study aimed to gather baseline information, record the existing socioeconomic conditions, and identify key constraints within the Dhumuga learning watershed located in the West Shewa zone of Ethiopia. The information was collected through a household survey and focus group discussions. Through focused group discussions, issues like deforestation, water erosion, restricted access to enhanced crop varieties, insufficient irrigation water, and the decline in soil fertility were recognized and prioritized. The survey findings revealed that 82% of households were headed by males, with 40% of household heads possessing basic literacy skills (able to read and write), while 54% were enrolled in primary school (Grades 1–8). Crop production generated 912.08 USD per household per year on average as of 2023 Ethiopian foreign exchange rates to USD, while livestock production generated 2,612.39 US dollar per household per year. In relation to food security, 36% of households have occasionally faced food shortages caused by natural issues during the kiremt season. The research also highlighted challenges such as land degradation from water erosion (46%), improper tillage practices (34%), and deforestation (20%). Additionally, 78% of households rely on firewood for cooking, with 98% of this firewood sourced from local forests and trees, posing a significant threat to forest resources and their sustainable management. For effective management and oversight of the Dhumuga learning watershed, it is recommended to implement forest resource conservation initiatives, promote the use of energy-efficient stoves, enhance soil fertility strategies, establish soil erosion control methods, and introduce innovations for community livelihood improvement, along with raising awareness about various natural resource management activities.
1 Introduction
The strategy and planning for managing natural resources based on watersheds began in Ethiopia during the 1980s. This approach has continued to evolve, but it has often lacked effective community involvement, a sense of stewardship for created resources, and planning units that are manageable (Desta et al., 2005). While initiatives for re-greening Ethiopia were initiated in the 1890s (Bekele, 2003), and large-scale strategies for soil and water conservation were introduced on agricultural land during the mid-1970s and 1980s (through food-for-work programs) (Aklilu, 2006) to combat escalating land degradation, the outcomes of these efforts have been minimal due to a top-down methodology and a focus on plot-level execution. Additionally, the country has encountered significant environmental and land degradation, driven by a complex set of factors including population growth, the poor livelihoods of rural communities, unsustainable use of natural resources beyond their recovery ability, and inadequate livestock management (Hurni et al., 2010; Gashaw et al., 2018). As a result, Ethiopia is currently one of the most severely impacted nations in Sub-Saharan Africa regarding land degradation, with approximately a quarter of its total land area degraded, impacting nearly a third of its population (Le Quere et al., 2016). Sociodemographic factors encompass the household head's experience, gender, household size, and educational level; while those factors comprise off-farm income, cattle count, and ownership of a corrugated house. Assessment of socioeconomic characteristics plays a vital role in conserving and restoring natural resources, enhancing agricultural productivity, and improving rural livelihoods. It plays a crucial role in addressing the challenges of land degradation, food insecurity, climate change, and poverty eradication (Dias et al., 2021).
Ethiopia has initiated the second phase of its Growth and Transformation Plan (GTP II), scheduled to continue until 2019/20. GTP II is focused on socioeconomic and environmental protection. It aims for an average annual GDP growth of 11%, and in accordance with the industrial sector is projected to grow by an average of 20%, leading to increased employment opportunities. It has been reported the proportion of the population living below the national poverty line dropped from 30% in 2011 to 24% in 2016 (Ethiopia Forest Climate Change Commission, 2018). The people of Ethiopia, especially those living in rural areas, heavily rely on natural resources for their livelihood security. However, due to factors such as population pressure, unsustainable use, inadequate management, and the expansion of commercial farms and infrastructure, there has been significant depletion of natural resources and environmental degradation (Ethiopia Forest Climate Change Commission, 2018).
This has led to various environmental issues, including climate change, pollution, land degradation, deforestation, water scarcity, and loss of biodiversity, which pose a high risk to the country's political, economic, and social landscape. The unwise utilization of natural resources and failure to protect the environment could lead to consequences such as floods, landslides, droughts, desertification, and loss of land productivity, ultimately resulting in population displacement and increased rural-urban migration (Ethiopia Forest Climate Change Commission, 2018; Dufera et al., 2020).
As the report of Ethiopia Forest Climate Change Commission (2018) indicates, the country is susceptible to climate variability and global climate change, with mean annual temperature having risen by 1.3°C between 1960 and 2006 and further warming predicted in the coming decades. It is estimated that climate change could potentially impact the country's GDP growth unless effective measures are implemented to enhance resilience.
Nowadays, different integrated watershed development activities have been carried out in Ethiopia to reverse the ongoing situation by restoring the degraded landscapes and primarily improving the livelihood of the farming communities with the financial support provided by IDA, GEF, GIZ, and the World Bank (Mekuria et al., 2021). In a similar vein, it has been established that enhancing degraded landscapes with comprehensive restoration strategies boosts landscape effectiveness, leading to improved soil quality, animal wellbeing, and biodiversity (Mekuria et al., 2017). Furthermore, various studies have indicated that adopting various landscape-level natural resource management strategies—such as offering better crop and vegetable varieties, initiating irrigation systems, enhancing agricultural practices, and implementing soil and water conservation techniques—has positively impacted the livelihoods of the watershed community (Habtamu, 2011; Dufera et al., 2020).
As a result, the Ethiopian Institute of Agricultural Research initiated the Climate Action through Landscape Management project in 2020 G.C. to deliver results-oriented support and encourage field-based initiatives aimed at enhancing participatory watershed management practices to mitigate land degradation. Consequently, the socioeconomic assessment of the learning watersheds was identified as one of the essential proposed activities. Since social and economic factors typically encompass the socioeconomic aspects and provide detailed demographic and other pertinent information regarding the watershed residents and various stakeholders (Calderon et al., 2013), this research was designed to gather and record the baseline data on socioeconomic aspects by identifying key socio-economic challenges and opportunities in the Dhumuga learning watershed for planning and impact evaluation.
2 Research methods
2.1. Descriptions of the study areas
The Dhumuga Learning Watershed, situated in the West Shewa Zone of Ethiopia, was chosen for its convenient accessibility for monitoring and follow-up in collaboration with the Ambo Woreda Agricultural Office. Following the criteria established, the watershed outlet was located and marked. It is geographically positioned between 8°54′0″N and 8°55′0″N latitude, and 37°49′30″E to 37°50′30″ E longitude (Figure 1), covering a catchment area of 564 hectares, with an altitude ranging from 2,189 to 2,555 m above sea level.
2.1.1 Climate of the area
The total annual rainfall is 973.10 and 1,092.20 mm in 2021 and 2022 cropping seasons respectively. This shows that total rain fall in 2022 is greater than that of 2021 that may be resulted from high monthly rain fall in April, June and August. The monthly distribution of relative humidity, minimum and maximum temperature were similar in both years (2021 and 2022) specially during the rainy months (June to November).
2.1.2 Soil type
The soil type of the area specifically of the watershed were two soil types (Orthic luvisols and Pellic vertisols) in dhumuga watershed; in which Orthic luvisols is a dominant soil type (491 ha) or 87.1 % of the total watershed area; lies from the inlet to some parts of the outlet.
During the field survey, three erosion types gully erosion, rill, and sheet erosion were identified by the surveyor groups; of which gully erosion is the one that is the dominant one and very serious. Two locations of large gullies (inlets namely Tulu Bale Welde and Tulu Bade) were identified. Most of the gullies identified in the Dhumuga watershed were categorized under large class gullies according to Imeson and Kwaad's (1980) gully class characterization.
2.1.3 Land use and topography
Agricultural practice of the area is crop production and rearing of animals; in which crop such as wheat and Tef are the widely produced crops. The analysis of land use and land cover change over 40 years of the watershed stated in biophysical study of this project indicates a slight increase in settlement land use change, while there has been a significant reduction in forest and grazing land use. Conversely, agricultural land use has shown a substantial increase. Therefore, the expansion of agricultural land is the primary factor contributing to the reduction of forest and grazing land use. Consequently, it is crucial to implement appropriate land management strategies to preserve the remaining fragmented forest and other natural resources for future generations.
Based on the slope map result, six categories of slope classes (Figure 2) were identified. The dominant slope classes are 8%−15% and 3%−8%; followed by 15%−25%; Elevation of the watershed lies between 2189 to 2555 masl. The land feature of the watershed is dominated by: rolling terrain (45% in area coverage) and gentle flat to undulating (39% in area coverage) (Table 1). Due to this, the susceptibility of soil for water erosion become higher with the overgoing of deforestation from the upper catchments. In terms of the water resources, though the study area is rich in water resources; specifically, the study watershed has only one ephemeral/intermittent river with other sub stream orders.
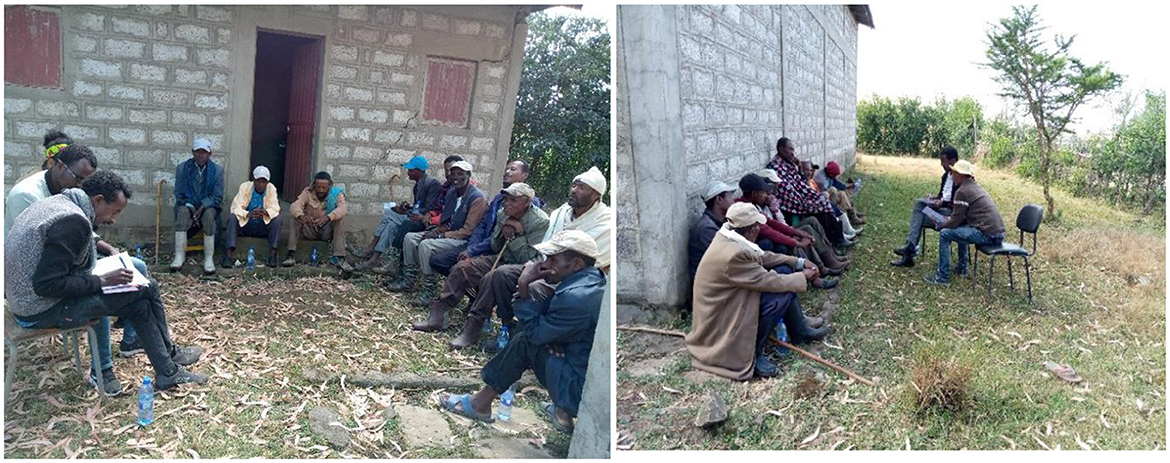
Figure 2. Photos during a focused group discussion at Dhumuga Learning Watershed since February 2021 G.C. Source: own camera during a focused group discussion at Dhumuga watershed, 2021.
2.2. Data collection and analysis
2.2.1. Sample size determination
The sample size was determined according to Yamane's (1967) sampling formula:
(i.e., 82 households were involved in the household survey); unfortunately, 20 household information was canceled due to an error occurred by enumerators during data collection. The entire watershed has been stratified into three main categories of villages (Upper catchment, middle catchment and lower catchment villages). Then the 60 household survey samples have been divided for the three villages 20 samples for each village to ensure the representativeness of samples and reduces biasness. Therefore, the remaining 60 samples have used for the analysis. The collected 60 household data is accounted for 63% which is big enough to conduct the analysis. The researchers have ensured that the sample is representativeness by and decided to handle the remaining data.
N = minimum returned sample size, N = population size (household in the watershed) = 105, e = the degree of accuracy expressed as a proportion = 0.05, ρ = the number of standard deviations that would include all possible values in the range = 2, t = t-value for the selected alpha level or confidence level at 95% =1.96.
2.2.2. Problem identification and pairwise matrix ranking
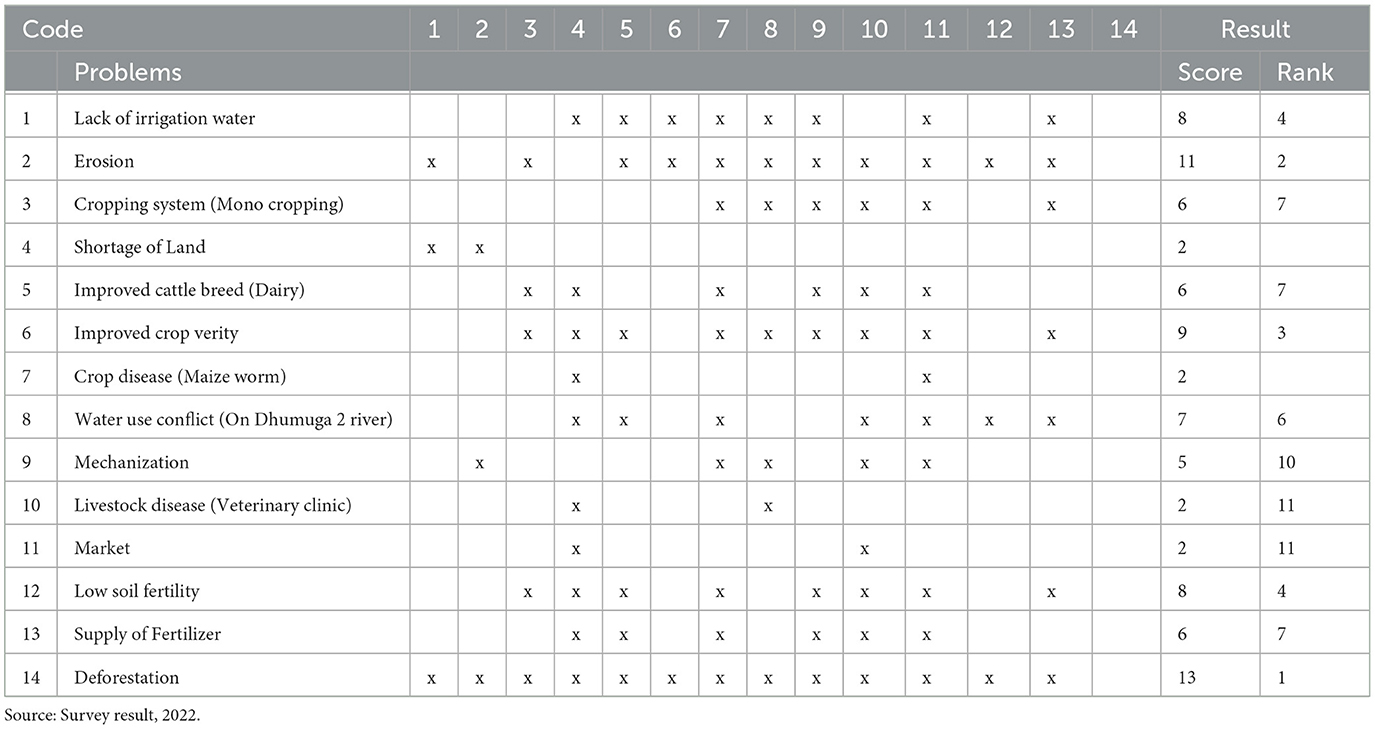
Focus group discussions (Figure 2) with nine to 10 members were used to collect, identify, and rank the problems (Figure 2). Farmers were grouped into Men and Women groups. Those groups have been also grouped into local wealth category (income level) prior to conducting the questioner. To manage the variability and reduce the dominance among different classes, a focus group discussion was held with representatives from three groups (lower, medium, and higher status). The pairwise ranking matrix was used to rank the identified problems based on the best-worst scaling theory methods of Louviere et al. (2015).
2.2.3. Data collection
A diverse team of knowledgeable experts and researchers carried out the household survey (see Figure 3). Prior to the survey, enumerators and supervisors underwent training focused on the questionnaires, data collection methods, and foundational principles. The socioeconomic and natural resource management research teams developed the questionnaires (refer to Supplementary Appendix 1).
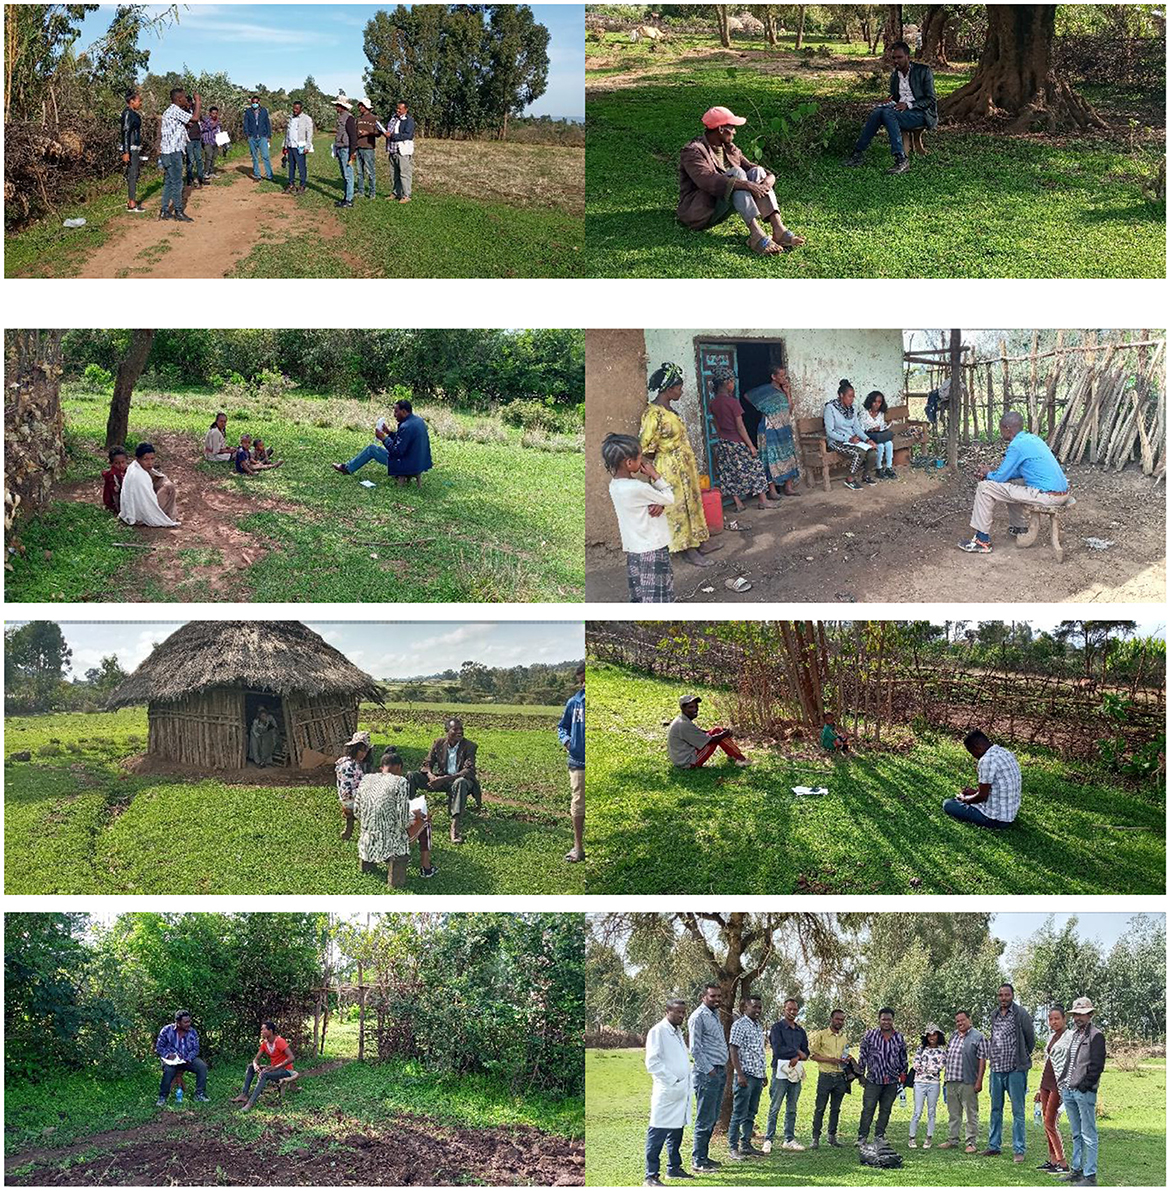
Figure 3. Sample photos during household survey at Dhumuga Learning Watershed since May 2021 G.C. Source: own camera during a focused group discussion at Dhumuga watershed 2021.
2.2.4. Data analysis
The information gathered during the Focused Group Discussion (FGD) was evaluated utilizing a pairwise ranking matrix. In addition, the data obtained from household surveys were examined through descriptive statistics, including percentage, frequency, mean, standard deviation, maximum, and minimum.
3 Results and discussions
3.1. Demographic characteristics
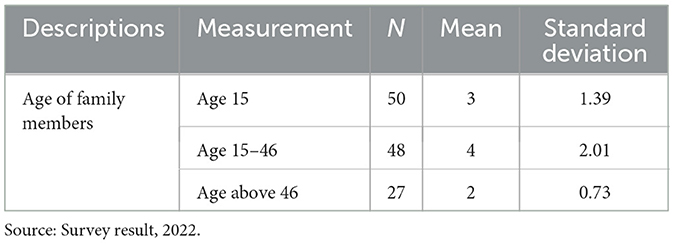
Demographic factors such as age, gender, and educational attainment play a crucial role in recognizing potential socioeconomic networks and forming a basis for understanding household conditions (Storck and Doppler, 1991; Nantha et al., 2009). During the project intervention, it is essential to outline the general characteristics of the farm households within the watershed. This research utilized data collected from 62 farm households randomly selected in the Dhumuga learning watershed. The sample consisted of 82% male-headed households and 18% female-headed households (Table 1).
Education serves as a significant factor that positively affects decision-making by enhancing farmers' understanding of how to acquire, manage, and utilize pertinent information, which leads to the adoption of advanced technologies. The level of educational attainment is often employed as an indicator of the technical skills acquired, and hence, reflects the quality of human capital. Within the watershed, 40% of the heads of the sampled households had basic literacy (could read and write), while 54% and 6% had completed primary school (1–8th grade) and high school (9–12th grade), respectively (Figure 4).
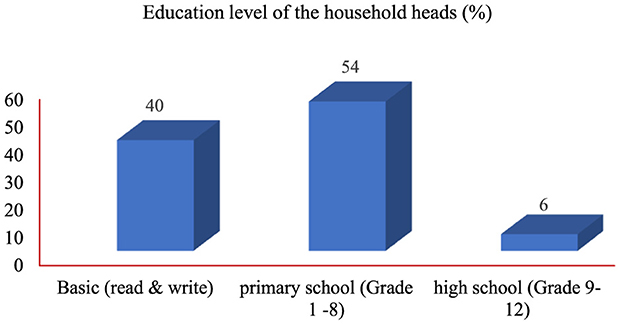
Figure 4. Education level of the household heads in Dhumuga learning watershed. Source: Survey result, 2022.
3.2. Land ownership and utilization in the watershed
In the study region, the primary methods of acquiring land included land redistribution, inheritance, and receiving land as gifts. A significant portion of households, specifically 45%, had inherited their land from relatives, while 40% obtained it from government sources (Figure 5). The aspects of land ownership, crop cultivation, and productivity can all influence watershed management practices, both in direct and indirect ways. According to Nantha et al. (2009), land ownership may affect the level of community involvement in watershed development aimed at conserving, managing, and utilizing natural resources.
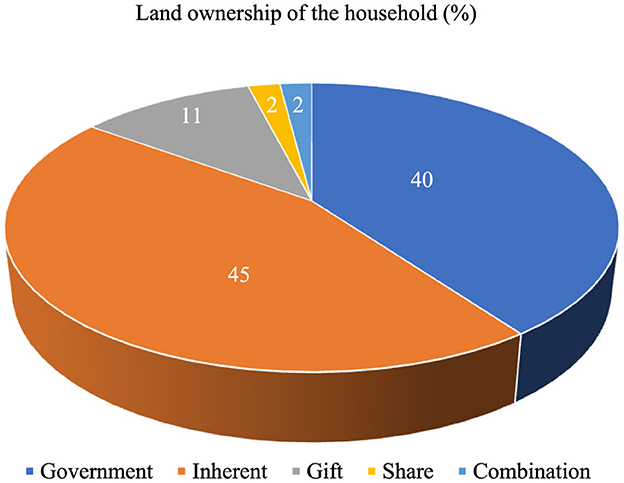
Figure 5. Land ownership of the household in Dhumuga learning watershed. Source: Survey result, 2022.
For farmers, productive land is a vital resource. In the study area, the average household had access to ~2.37 hectares of arable land that could be utilized by an economically active family (Table 2). The dominant types of crops grown in the watershed, in terms of area, were cereal crops such as Tef (Eragrostis tef), Wheat (Triticum vulgare), and Faba beans (Vicia faba; Table 2). The reported crop yields were eight quintals/ha for Tef, 24 quintals/ha for Wheat, and 7 quintals/ha for Faba beans, all of which are considerably lower than the national average productivity statistics provided by the CSA (2021) (Tef 21.26 quintals/ha, Wheat 31.51 quintals/ha, and Faba beans 24.33 quintals/ha) achieved by smallholders during the meher season.
Households in the Dhumuga watershed used on average 224 kg/ha of NPS fertilizer and 116 kg/ha of urea fertilizer during the production season (Figure 6).

Figure 6. The overall fertilizer utilization (Kg/year/household) of the watershed households. Source: Survey result, 2022.
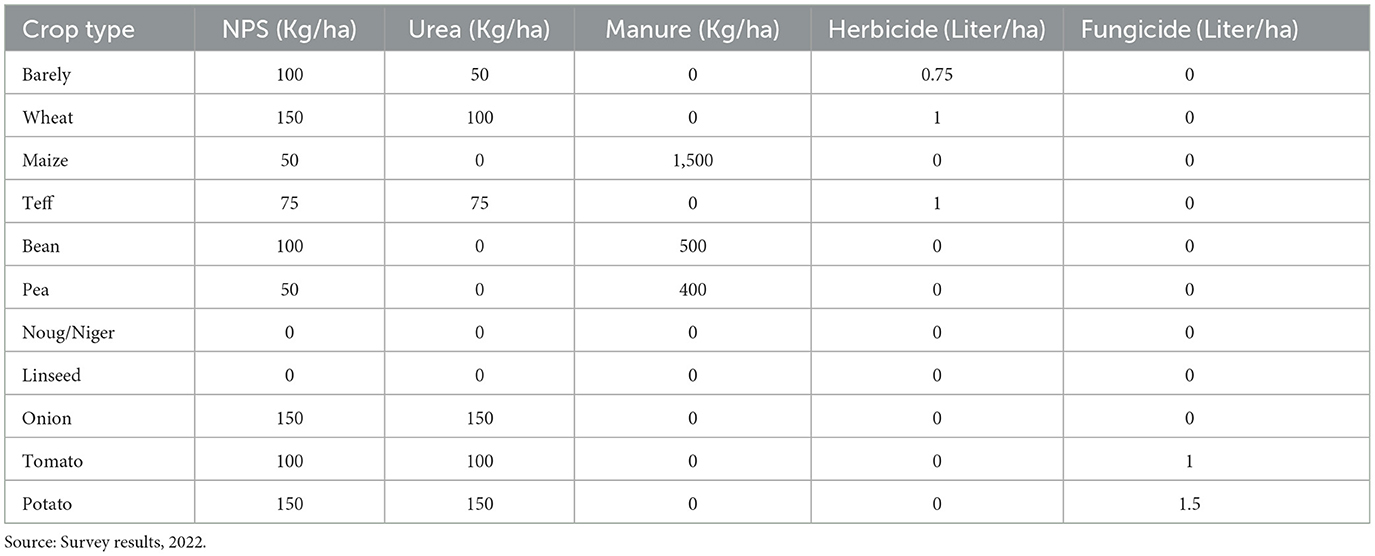
The production of crops requires inputs to obtain high yields. Therefore, the use of fertilizers (organic and inorganic fertilizers) and plant protection chemicals are a critical requirement to produce crops. Table 3 summarizes the agricultural input utilization of the households in the watershed.
Livestock ownership assessment results indicated that 34% of the households in the watershed owned more than a pair of oxen, while 29% owned a pair of oxen (Figure 7). Furthermore, 24% of households do not have an ox. Traditionally, it is assumed that ox ownership is a major indicator of wealth status in rural areas of Ethiopia, and having a larger herd is also used as a buffer against poverty (Scott, 2019). As a result, households without an ox were classified as poor. Like land ownership, livestock ownership affects the community's participation in watershed development activities, both positively and negatively.
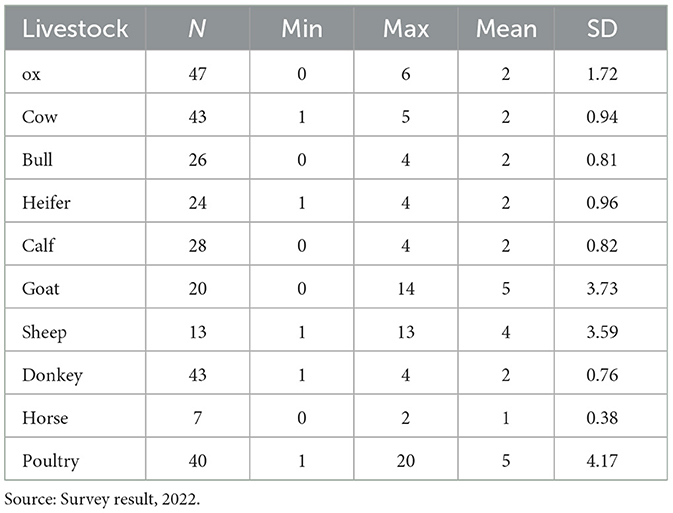
The average size of livestock kept by farm households in the watershed is presented in Table 4. The livestock species found in the study area are cows, oxen, bulls, heifers, calves, sheep, goats, chickens, donkeys, and sheep.
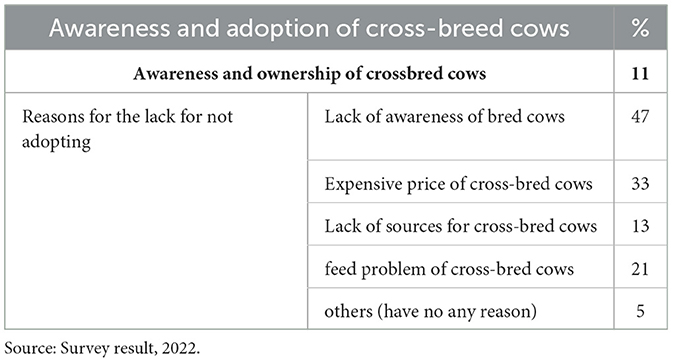
Regarding crossbreed awareness of livestock, only 11% of households in the watershed were aware of the crossbreed cows (Table 5). Many farm households did not own cross-bred cows due to a lack of awareness (47%), the high price of cross-bred cows (33%), feed problems (21%), and lack of cross-bred cows from reliable sources in the study areas.
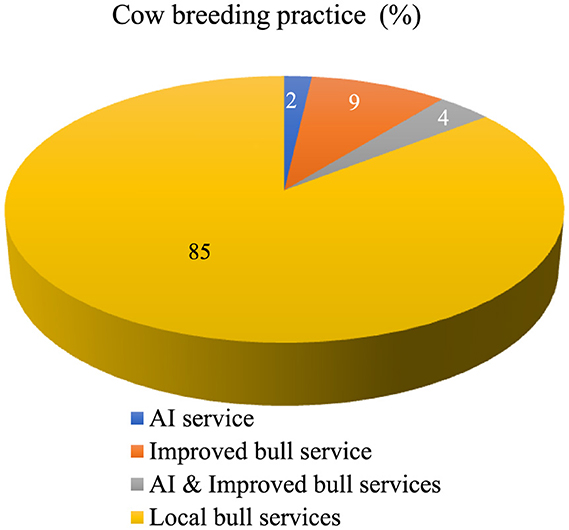
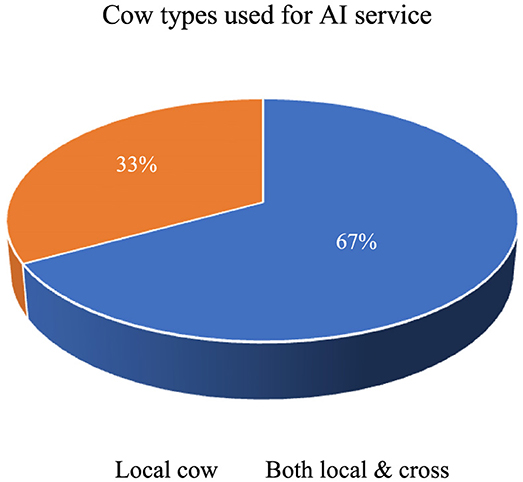
In the watershed, about 9% of households used improved bulls, while only 2% used artificial insemination (AI) services for cow breeding (Figure 8). Furthermore, 67% of the households used a local cow for AI services (Figure 8).
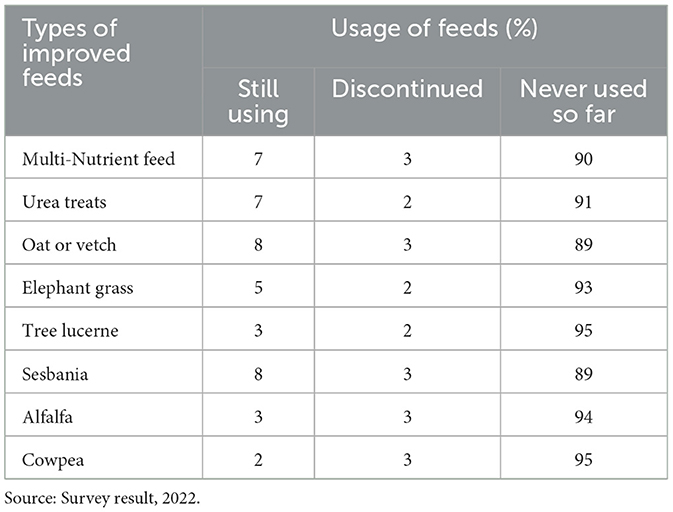
For livestock drinking, 90% of households used streams or rivers, while the remaining used springs (8%) and ponds (2%). About 36% of households were aware of improved forage, and 55% of farm households grew different improved forages in the watershed (Figure 9). Furthermore, the use of improved feed in the Dhumuga watershed was very low, with most households did not practice (Table 6).
The major feed resources in the study area are shown below. Different feed resources were identified and used to varying degrees by farm households in the study area.
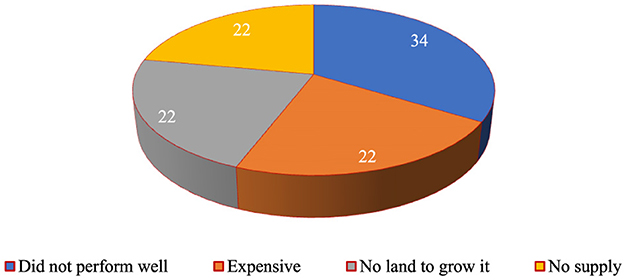
Some households have stopped using the improved feed for various reasons. As a result, 34% of households discontinued growing the improved forages due to the poor performance of the forages (Figure 10), while 66% of households stopped growing due to the high cost of forage seeds, a lack of growing land, and a lack of forage supply in the Dhumuga watershed (Figure 11).

Figure 11. Awareness and adoption of improved forages by farmers in the watershed (%). Source: Survey result, 2022.
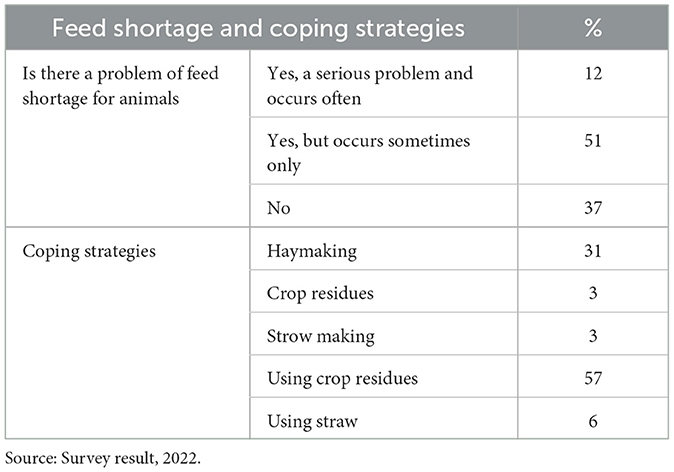
From the total sampled households, 63% of the respondents have faced feed shortage (Table 7); while 37% had enough feeds for their animals. Hence, the households faced feed shortages for an average of 4 months.
As indicated in Figure 12, 82% of the households traveled a long distance to cure or treat their animals during the disease occurrence. Consequently, the community ought to travel more than 10 km to get treatment (cure) their animals, which could be a risk for sick animals.
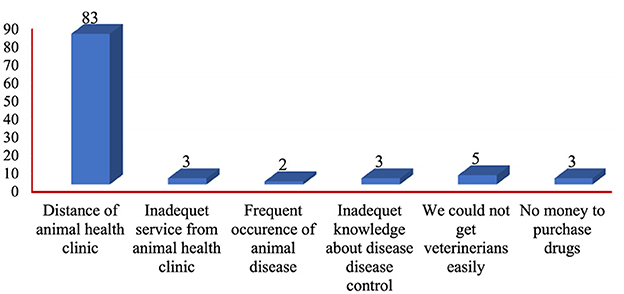
Figure 12. Problems related to animal health service and access in Dhumuga watershed (%). Source: Survey result, 2022.
From the total interviewed households, only 13, 22% of the respondents used modern beehives in the Dhumuga watershed Figure 13. Most farm households did not have practiced improved beehives. The use of modern beehives and apicultural activity in the watershed is not satisfactory.
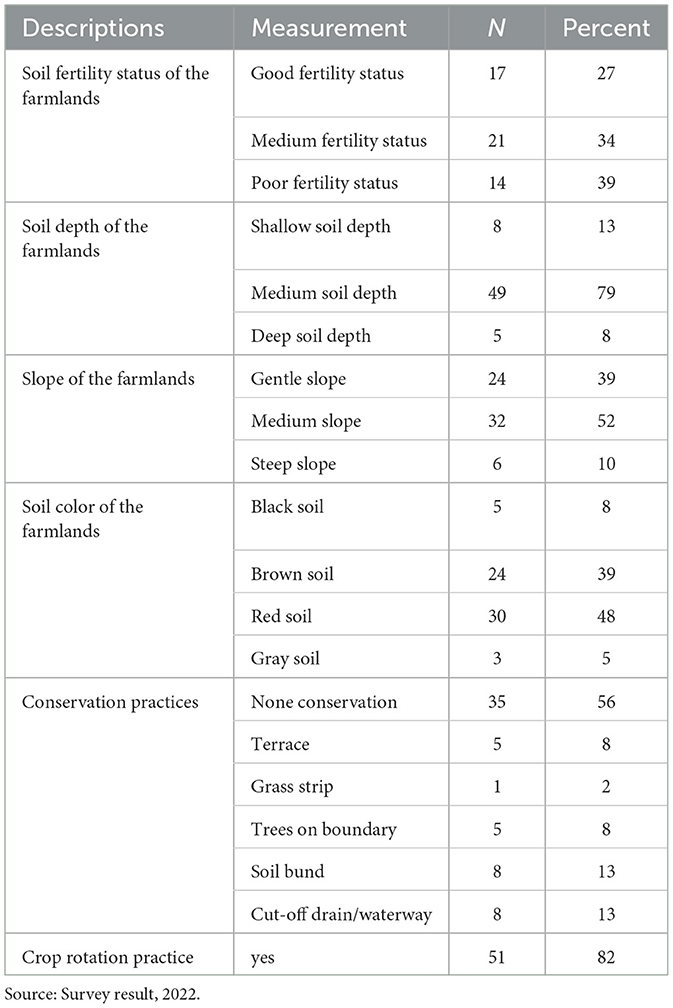
On average, 39% of households indicated that their soil fertility is poor (Table 8); conversely, 34% believe that their farmland has moderate fertility. Additionally, 56% of the households did not implement conservation practices on their fields. Crop rotation is the most widely adopted agronomic practice among households (82%). Moreover, row planting was only carried out by households for maize and horticultural crops, and they primarily utilized improved crop varieties for Wheat, Tef, and Maize.
3.3. Income from crop production
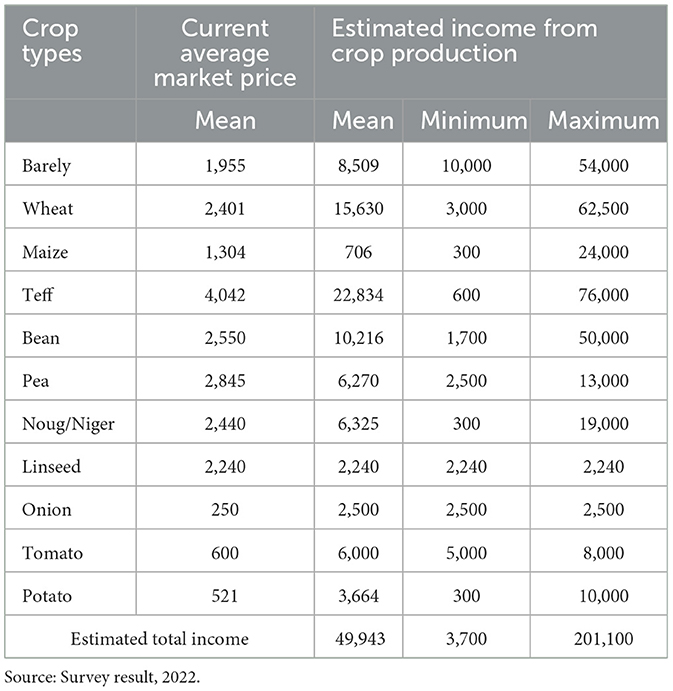
Crop cultivation have been practiced by the households to generated income. Table 9 indicates that the average annual farm income generated from crop production by sample households was 912.08 USD during the production year.
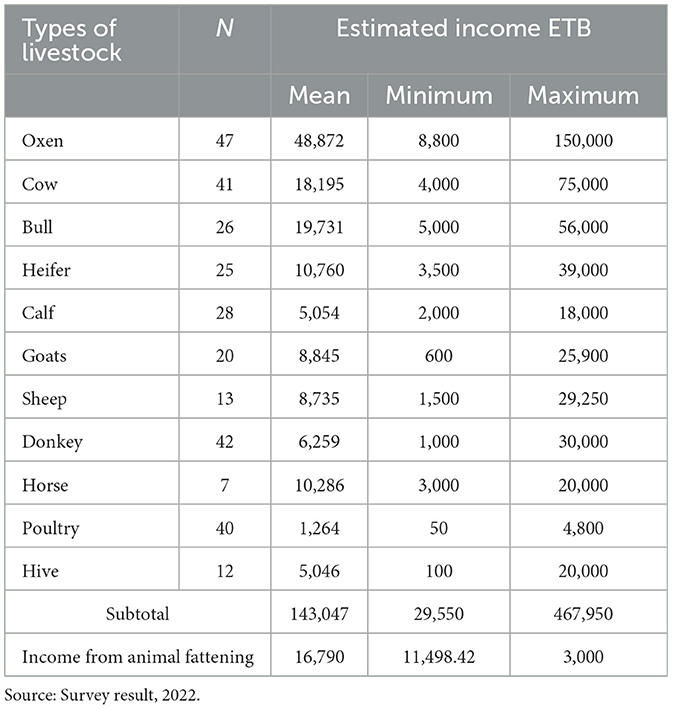
The primary factor affecting the adoption of enhanced technologies is the household income derived from livestock and livestock products. A summary of the projected yearly income from livestock production by households in the Dhumuga Learning watershed is presented (Table 10). The typical annual income from livestock production activities was 159,837 USD.
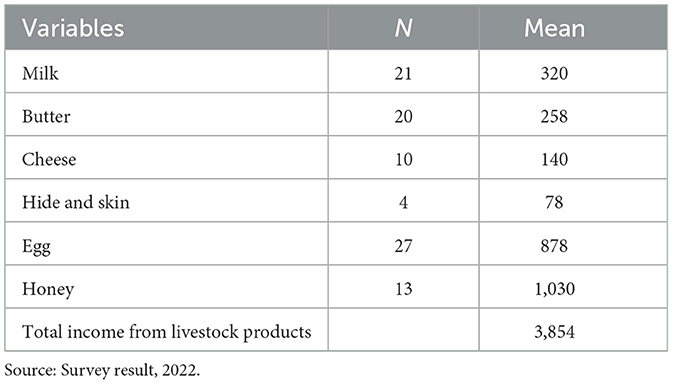
The income generated from selling livestock products can be utilized to buy essential items for the family once their consumption needs have been satisfied. The average income from different livestock byproducts by household was 70.38 USD per year (Table 11).
Farm assets such as ox plows, pickaxes, hoes, and shovels were the most owned assets by households (Table 12), as they are essential tools for farming activities.
3.4. Natural resource management activities
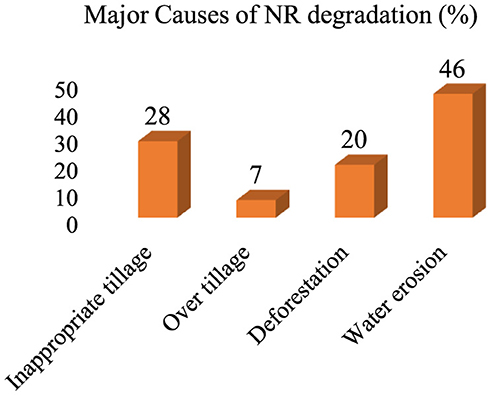
The findings from the social survey reveal that 72% of households acknowledge a land degradation issue within the Dhumuga learning watershed (see Figure 14), attributed to water erosion (46%), inappropriate tillage practices (34%), and deforestation (20%; refer to Figure 15). The land use and land cover change mapping conducted in the Dhumuga watershed further substantiates the ongoing degradation of natural resources, which is driven by the continuous expansion of agricultural land.
Approximately 90% of households engage in soil fertility management practices, primarily focusing on manure application (83%); however, the use of compost, vermicompost, and green manuring is notably low at just 17% (see Figure 16). This suggests that awareness of enhanced soil fertility management techniques is quite limited. Therefore, implementing integrated soil fertility management strategies is essential for effective management planning.
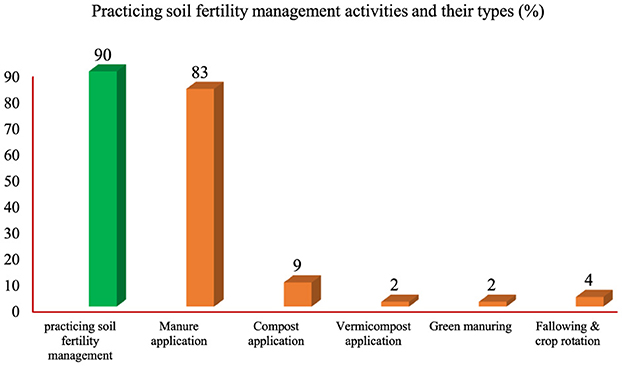
Figure 16. Soil fertility management practice in the Dhumuga watershed, 2021 (%). Source: Survey result, 2022.
3.4.1. Education and health-related issues
In the watershed, there were three primary schools, providing a great opportunity for children to attend school. As a result, 85% of boys and girls between the ages of 7 and 18 are enrolled in primary school. During the household survey, two healthcare access points were identified; however, ~87% of the households in the watershed lack an improved toilet facility, and none have a hand-washing facility.
3.5. Water resource and its availability
The formal survey conducted in the Dhumuga learning watershed indicates that more than 78% of households experience inadequate access to improved drinking water for human use throughout both the rainy and dry seasons. During the rainy season, they rely on rooftop water collection for their immediate needs. Only 26% of households have irrigated land. They employ traditional irrigation techniques, specifically the flooding method. On average, 63% of these households utilize this irrigation method for cultivating tomatoes, 23% for growing cabbage, and the remaining 11% for onion cultivation.
3.6. Food security and occurrence of different shocks in the watershed
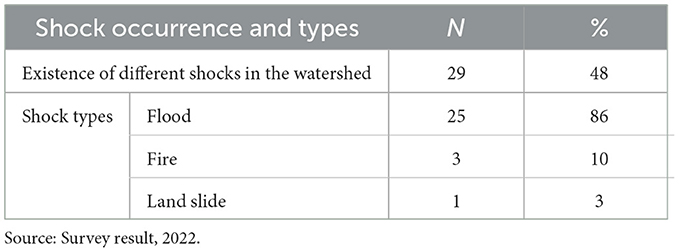
Food shortages in the watershed have been attributed to drought, pest infestations, land scarcity, and potentially a shortage of oxen. Approximately 36% of households experienced food shortages, particularly during the summer (kiremt) season in the study area; this aligns with a study conducted in Dhaka Bora watershed, East Shoa, and Mafakiya watershed, South Gonder, Ethiopia, where around 33% of smallholder farmers faced mild food insecurity for 3 months (Mohammed et al., 2024; Tesfaye and Fikadu, 2024). They managed to alleviate the food shortage with assistance from friends and/or neighbors. As shocks are a detrimental occurrence in impoverished agricultural economies, only 48% of households reported experiencing them (Table 12); flooding was identified as the most severe type of shock, affecting 86% of those surveyed in the watershed.
3.7. Energy types and their sources for the watershed community
In the context of cooking, farm households relied on various energy sources. The findings revealed that firewood (78%) was predominantly used for cooking by households in the watershed (Table 13). Collection of fuelwood from nearby forests and trees is contributing to the issue of deforestation.
The findings of the energy resource and usage assessment are supported by Beyene et al. (2018), who state that “traditional biomass is a primary source of cooking and heating energy in Ethiopia,” and align with the World Health Organization Report of 2018, which indicates that ~95% of Ethiopian households utilize polluting fuels, particularly firewood, for cooking. Moreover, a study conducted in the Jimma zone shows that a majority of households rely on wood fuel for their cooking needs, although the specific quantity was not mentioned (Fikirie et al., 2017). Additionally, research in the Mukehantuta watershed of Were-Jarso District, North Shewa, Ethiopia, indicates a consumption of 1999 metric tons per year of fuel sourced from woody biomass (Bekele et al., 2013). Furthermore, a study in the Mafakiya watershed, North Gonder, Ethiopia found that 47% of the community members have been utilizing solar energy for lighting their homes.
3.8 Access and participation in technology transfer of the watershed communities
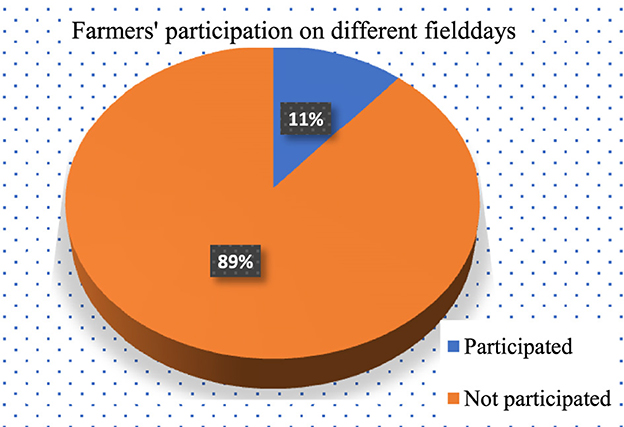
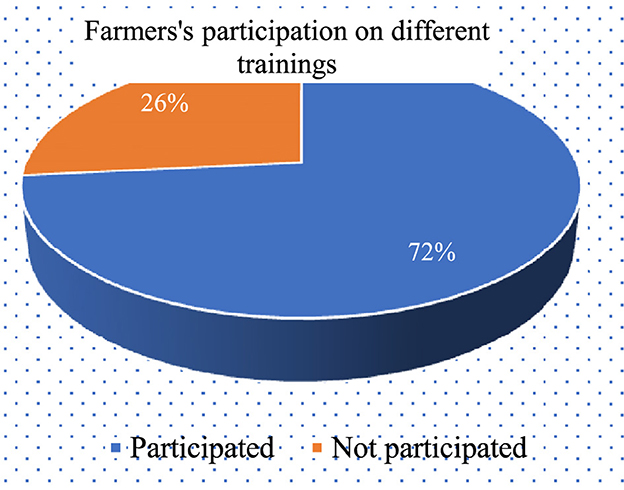
Field days serve as a highly effective way to share technology, persuade farmers to embrace new innovations, and allow neighboring farmers to see the practical application of these technologies firsthand in the fields. Among the surveyed respondents, only 11% of households took part in field days and demonstration programs coordinated by various institutions (Figure 17). In contrast, 72% of farming households engaged in training sessions provided by the woreda agricultural office at the kebele level (farmers' training center, FTC) (Figure 18) within the Dhumuga Learning Watershed. Additionally, prior to the initiation of the EIAR-CALM project, none of the watershed communities were involved in cluster farming.
Households have very limited involvement in different social networks and institutions (Table 14). Nevertheless, nearly all households took part in edir/Afoosha (98%), which represents a significant exception to the norm, as participation in this activity is compulsory. The concept has been clarified. Edir/Afosha is a local expression. It refers to a community tradition that offers funeral services and support when a family member dies. This is why the involvement of family members is considered essential. Given that a person has passed away, the funeral must take place according to community customs, and participation in these social traditions is asserted as obligatory by the community itself.
3.9 Major constraints in the dhumuga learning watershed
The pairwise matrix ranking revealed and prioritized issues within the Dhumuga learning watershed (see Table 15). Consequently, farmers from higher-income groups listed deforestation, water erosion, insufficient access to improved crop varieties, inadequate irrigation water, and declining soil fertility as their top five concerns. In addition, they identified a lack of drinking water and sanitation, insufficient electricity and alternative energy sources, issues with water erosion and runoff, limited access to improved crop varieties, and inadequate supplies of fertilizers and pesticides as significant problems. Similarly, farmers with lower incomes recognized and prioritized the absence of improved livestock breeds, high fertilizer costs, limited irrigation water, lack of credit services, issues with gully erosion and flooding, as well as the absence of basic education facilities for children aged 4–6 as critical challenges. Women's groups highlighted significant obstacles such as scarcity of drinking water and the distance required to obtain it, insufficient irrigation water and schemes, high costs of agricultural inputs, problems with water erosion, and deteriorating soil fertility.
The problem ranking in the pairwise matrix could be useful in the intervention and participatory watershed management plan. As a result, the problems that agricultural research and the EIAR-CALM project can address have been prioritized, and interventions have begun for some of them. These findings were similar with the findings of Mohammed et al. (2024), in Mafakiya Watershed, North Gonder Ethiopia, in which shortage of drinking and irrigation water, lack of electricity, and soil erosion along with declining soil fertility were identified as the top three constraints of the watershed community.
4 Conclusion and recommendations
The goal of this research was to describe the socioeconomic features of the Dhumuga watershed in order to analyze the future impact of the EIAR-CALM project. There was a total of 105 household heads in the watershed, from which 60 households were effectively sampled.
The pairwise matrix ranking results highlight various agricultural challenges within the Dhumuga watershed. As a result, significant issues identified include soil erosion caused by water, conflicts over water usage, insufficient improved crop varieties, deforestation, lack of irrigation water, inadequate drinking water and sanitation, scarcity of electricity, alternative energy options, problems related to the supply of inputs (fertilizers and pesticides), shortage of improved livestock breeds, high fertilizer prices, lack of low-interest credit, gully erosion, and depletion of soil fertility. These agricultural obstacles were prioritized during the problem identification phase. Additionally, the study provided a summary of the demographics of households, their access to institutions and arrangements, as well as ownership of farm assets and resources, which is useful for implementing various interventions in the watershed.
Overall, the adoption of diverse agricultural technologies, including improved forage practices, enhanced soil fertility management, energy-saving technologies, and environmental protection initiatives, is quite low among households. Therefore, it is essential to implement interventions using suitable technologies to resolve these issues, promote innovations for livelihood improvement, and raise awareness. Similarly, implementing various erosion control measures and structures, planting different seedling types to restore deforested areas, introducing improved animal breeds, promoting energy-efficient stoves, and utilizing alternative energy sources like solar power, in addition to demonstrating improved crop varieties, are recommended for the sustainable management of the Dhumuga watershed and to improve the livelihoods of its residents.
Moreover, the basic educational background of the watershed community presents an opportunity to tackle the socioeconomic issues and environmental degradation by leveraging the considerable workforce available. The community is highly interested in adopting new soil fertility management practices. Thus, there is a need to restructure the extension service linkages to effectively address the community's needs and combat soil fertility degradation.
The study concentrated on the socioeconomic factors and primary constraints associated with the natural resource use in the watershed. It did not delve into certain areas of the watershed community, such as gender empowerment, and biophysical aspects were studied separately in a different research effort for this watershed. Therefore, these issues should be addressed before conducting impact assessment studies within the watershed.
Data availability statement
The raw data supporting the conclusions of this article will be made available by the authors, without undue reservation.
Ethics statement
Written informed consent was obtained from the individual(s) for the publication of any potentially identifiable images or data included in this article.
Author contributions
DS: Conceptualization, Data curation, Formal analysis, Funding acquisition, Investigation, Methodology, Project administration, Resources, Software, Supervision, Validation, Visualization, Writing – original draft, Writing – review & editing. RD: Data curation, Formal analysis, Software, Writing – review & editing.
Funding
The author(s) declare that no financial support was received for the research, authorship, and/or publication of this article.
Acknowledgments
The EIAR-CALM project provided funding for this study. The Natural Resource Management Research staff at the Ambo Agricultural Research Center contributed their invaluable expertise and support from the inception of this project in 2021–2022. The Ambo Agricultural office played a crucial role in facilitating activities at the woreda and kebele levels; in particular, Mr. Gemechu Kebeda Duressa from the Ambo Agricultural office dedicated his time and efforts to this initiative. Consequently, the authors express their sincere gratitude to the funder, the office, the staff, and the individuals who played a part in the successful completion of this study.
Conflict of interest
The authors declare that the research was conducted in the absence of any commercial or financial relationships that could be construed as a potential conflict of interest.
Publisher's note
All claims expressed in this article are solely those of the authors and do not necessarily represent those of their affiliated organizations, or those of the publisher, the editors and the reviewers. Any product that may be evaluated in this article, or claim that may be made by its manufacturer, is not guaranteed or endorsed by the publisher.
Supplementary material
The Supplementary Material for this article can be found online at: https://www.frontiersin.org/articles/10.3389/fsrma.2024.1484298/full#supplementary-material
References
Aklilu, A. (2006). Caring for the land: Best practices in soil and water conservation in Beressa watershed, highlands of Ethiopia (Thesis). Wageningen: Wageningen UR.
Bekele, K., Hager, H., and Mekonnen, K. (2013). Woody and non-woody biomass utilisation for fuel and implications on plant nutrients availability in the mukehantuta watershed in Ethiopia. Afr. Crop Sci. J. 21, 625–636.
Bekele, M. (2003). Forest property rights, the role of the state, and institutional exigency: the Ethiopian experience.
Beyene, H. D., Werkneh, A. A., and Ambaye, T. G. (2018). Current updates on waste to energy (WtE) technologies: a review. Renew. Energy Focus 24, 1–11. doi: 10.1016/j.ref.2017.11.001
Calderon, M. M., Anit, K. P. A., Palao, L. K. M., and Lasco, R. D. (2013). Households' willingness to pay for improved watershed services of the layawan watershed in oroquieta city, Philippines. J. Sustain. Dev. 6:1. doi: 10.5539/jsd.v6n1p1
CSA (2021). The Federal Democratic Republic of Ethiopia Central Statistical Agency Agricultural Sample Survey, Volume I.
Desta, L., Carucci, V., Wendem-Agenehu, A., and Abebe, Y., (2005). Community Based Participatory Watershed Development: A Guideline. Addis Ababa: Ministry of Agriculture and Rural Development.
Dias, L. M., Kaplan, R. S., and Sing, H. (2021). Making small farms more sustainable and profitable. Harv. Bus. Rev. Business and Society.
Dufera, B., Dube, D. K., and Aschalew, A. (2020). Socio-economic impacts, and factors affecting adoption of watershed management practices between the treated anduntreated micro-watersheds in the chirachasub-watershed of Ethiopia. PalArch's J. Archaeol. Egypt/Egyptol. 17, 4528–4548.
Ethiopia Forest and Climate Change Commission (2018). Ethiopia State and Outlook of the Environment 2017. Addis Ababa: Ethiopia Forest and Climate Change Commission.
Fikirie, K.. (2017). Assessment of woody and non-woody fuel biomass resource availability and rate of consumption in the somodo model watershed South-Western Ethiopia. Assessment 7.
Gashaw, T., Tulu, T., Argaw, M., Worqlul, A. W., Tolessa, T., Kindu, M., et al. (2018). Estimating the impacts of land use/land cover changes on ecosystem service values: the case of the Andassa watershed in the Upper Blue Nile basin of Ethiopia. Ecosyst. Serv. 31, 219–228. doi: 10.1016/j.ecoser.2018.05.001
Habtamu, T. (2011). Assessment of sustainable watershed management approach case study lenche dima, tsegur eyesus and dijjil watershed. A project paper presented to the Faculty of the Graduate School of Cornell University in Partial Fulfillment of the Requirements for the Degree of Master of Professional Studies.
Hurni, H., Abate, S., Bantider, A., Debele, B., Ludi, E., Portner, B., et al. (2010). Land degradation and sustainable land management in the highlands of Ethiopia.
Imeson, A. C., and Kwaad, F. J. P. M. (1980). Gully types and gully prediction. Geogr. Tijdschrift 14, 430–441. doi: 10.5555/19811963791
Le Quere, C., Andrew, R. M., Canadell, J. G., Sitch, S., Korsbakken, J. I., Peters, G. P., et al. (2016). Global carbon budget 2016. Earth Syst. Sci. Data 8, 605–649. doi: 10.5194/essd-8-605-2016
Louviere, J. J., Flynn, T. N., and Marley, A. A. J. (2015). Best-worst Scaling: Theory, Methods and Applications. Cambridge: Cambridge University Press. doi: 10.1017/CBO9781107337855
Mekuria, W., Langan, S., Noble, A., and Johnston, R. (2017). Soil restoration after seven years of exclosure management in northwestern Ethiopia. Land Degrad. Dev. 28, 1287–1297. doi: 10.1002/ldr.2527
Mekuria, W., Diyasa, M., Tengberg, A., and Haileslassie, A. (2021). Effects of long-term land use and land cover changes on ecosystem service values: An example from the central rift valley, Ethiopia. Land 10, 1373.
Mohammed, M., Bekele, D., and Bazie, M. (2024). Baseline socioeconomic characterization and resource use of the community in the Mefakiya watershed. Front. Sustain. Food Syst. 8:1347866. doi: 10.3389/fsufs.2024.1347866
Nantha, K. H., Wani, S. P., and Sreedevi, T. K. (2009). “Baseline socio-economic characterization of watersheds,” in Best-bet Options for Integrated Watershed Management (Patancheru: ICRISAT).
Scott, D. (2019). Income shocks and poverty traps: Asset smoothing in rural Ethiopia (No. 19/01). CREDIT Research Paper.
Storck, H., and Doppler, W. (1991). Farming systems and farm management practices of smallholders in the Hararghe Highlands. Kiel: Wissenschaftsverlag Vauk Kiel.
Tesfaye, G., and Fikadu, T. (2024). The effect of household characteristics and sustainable land management on crop productivity in Dhaka Bora watershed, upper Awash river basin of Ethiopia. J. Soc. Econ. Dev. 1–18. doi: 10.1007/s40847-024-00362-4
Keywords: baseline, Dhumuga watershed, socioeconomic, survey, West Shewa
Citation: Soboka DM and Dibaba R (2024) Socio-economic characterization, identification and prioritization of major constraints in Dhumuga learning watershed, Ambo, Ethiopia. Front. Sustain. Resour. Manag. 3:1484298. doi: 10.3389/fsrma.2024.1484298
Received: 21 August 2024; Accepted: 13 November 2024;
Published: 12 December 2024.
Edited by:
Simone Machado Santos, Federal University of Pernambuco, BrazilReviewed by:
Charalampos Skoulikaris, Aristotle University of Thessaloniki, GreeceRinku Singh, Central Agroforestry Research Institute (CAFRI), India
Bezerra Saulo De Tarso Marques, Federal University of Pernambuco, Brazil
Copyright © 2024 Soboka and Dibaba. This is an open-access article distributed under the terms of the Creative Commons Attribution License (CC BY). The use, distribution or reproduction in other forums is permitted, provided the original author(s) and the copyright owner(s) are credited and that the original publication in this journal is cited, in accordance with accepted academic practice. No use, distribution or reproduction is permitted which does not comply with these terms.
*Correspondence: Diriba Megersa Soboka, ZG1lZ2Vyc2E4MUBnbWFpbC5jb20=
†ORCID: Diriba Megersa Soboka orcid.org/0009-0002-1069-2023
 Diriba Megersa Soboka
 Regasa Dibaba
