- 1School of Electrical Engineering, College of Engineering, Universiti Teknologi MARA, Shah Alam, Selangor, Malaysia
- 2School of Physics and Electronic Engineering, Fuyang Normal University, Fuyang, China
To optimize the capacities and locations of newly installed photovoltaic (PV) and battery energy storage (BES) into power systems, a JAYA algorithm-based planning optimization methodology is investigated in this article. For this purpose, a series of mathematical models with constraint conditions are put forward to describe the dynamic properties of PVs and BES systems. Then, a general two-level planning model for maximizing the benefits of society is employed by introducing objective functions at the investment and operational levels from comprehensive influencing factors under different companies. To determine the optimal locations and capacities for configuring renewable energy sources, the proposed planning framework is solved using the JAYA algorithm. Finally, the effectiveness and reliability of the proposed configuration method are validated using an Institute of Electrical and Electronics Engineers (IEEE) 24-bus system with PVs and BES systems. Comparing the results of the various cases, it is obvious that the JAYA-based two-level planning optimization method can find the optimal configuration with minimum cost in shorter convergence times. Hence, the configuration strategy determined via the planning optimization method using the JAYA algorithm offers valuable guidance for the installation capacities and layouts of PVs and BES systems in power systems, which underscores their practical significance in energy management.
1 Introduction
As the power demand continues to increase, power generation with conventional fossil fuels easily causes excessive exploitation of non-renewable sources, greenhouse gas emissions, global warming, and other environmental pollution problems (Li et al., 2018). To overcome the growing environmental concerns, renewable energy sources (RESs), such as wind, solar, geothermal, and various natural sources, have been extensively utilized as alternatives to fossil fuels in recent decades due to their superior features of being secure and reliable, producing no pollution, and being cost-effective (Nikzad and Mozafari, 2014). Among RESs, photovoltaic (PV) power generation relying on abundant solar energy sources is recognized as the most encouraging and promising technology (Abdelaleem and Anis, 2021; Yang et al., 2018). Hence, developing solar PV power generation technology is significantly important for mitigating environmental pollution.
With the emphasis on the dual-carbon goal, integrating solar PVs into power systems has gradually increased in recent decades. However, such power systems are uncontrollable and intermittent because solar irradiation levels are highly susceptible to uncertain nature conditions (Li et al., 2020). Under these conditions, the large-scale introduction of solar PVs will result in detrimental phenomena like reverse power flows and voltage fluctuations. To handle reliability and security problems caused by PV power generation, battery energy storage (BES) technology has earned broad attention because of its adjustable charging and discharging properties (Sun et al., 2020; Kang and Yao, 2017; Teng and Strbac, 2016). During peak load periods, BESs release electricity is released from the BES to supplement the active power shortfall while absorbing excess electricity during low-demand periods to stabilize the power load (Zhang L. et al., 2021; Cui et al., 2019). Therefore, power systems with distributed solar PVs and BES systems have become mainstream in the field of power generation research at present.
Integrating RESs into a power system plays a beneficial role in supplementing the traditional energy resources in the power system. However, the capacities and locations of PVs and BES systems present a significant challenge in managing the energy in power systems due to the complexity of current power systems (Wankhede et al., 2022; Paliwal, 2021; Gandhi et al., 2020). To better configure RESs in new power systems, scholars have carried out many investigations on planning optimization strategies with effective objective functions (Qin et al., 2023; Lu et al., 2021; Lukačević et al., 2019; Sun et al., 2022; Prajapati and Mahajan, 2021). From a power generation perspective, the optimal cost of the power system has been taken into account throughout the power system's life cycle, where the total cost is divided into four categories: environmental, energy supply, sufficiency, and safety cost (Qin et al., 2023). To maximize RES consumption, a new energy consumption assessment model for the receiving-end power grid has been constructed by Sun et al. (2022). To reduce the overall social-economic losses, Prajapati and Mahajan (2021) considered not only the fuel cost and expected loss of customers but also the operating constraints of power systems during the process of designing objective functions. Nevertheless, the objective functions proposed in the previously mentioned literature have been determined from only one perspective, such as power generation and power costumers. Against this backdrop, the objective function presented by Prajapati and Mahajan (2021) improved from multiple perspectives, including generation, PV source, energy storage, line transmission, and power customers.
To achieve the optimal configuration of PVs and BES systems, a variety of algorithms, such as genetic, evolutionary programming, scattered search, path relinking memory, ant colony, particle swarm optimization (PSO), distribution estimation, differential evolution, and artificial bee colony optimization, have been commonly utilized to solve planning optimization problems (Banos et al., 2011; Xie et al., 2015). Unfortunately, these algorithms regulate parameters based on personal experience. The convergence of the algorithm is closely related to the defined parameters. To quickly obtain the optimal configuration of PVs and BES systems, the JAYA algorithm, an optimization algorithm that does not require specific parameter adjustments, was first proposed by Rao (2016). Zhang Y. et al. (2021), Luu and Nguyen (2020), and Zhang and Jin (2022) have improved the conventional JAYA algorithm proposed by Rao (2016). These algorithms can effectively handle various constrained and unconstrained optimization problems, which motivates us to utilize the JAYA algorithm to solve the planning optimization problem.
According to the preceding discussion, optimizing the configuration of PVs and BES systems utilizing JAYA algorithm is investigated for the power system containing new energy sources in this article. It should be pointed out that it is valuable research with the following challenges: (1) how to model practical PV power generation and BES system, (2) how to build an planning optimization method based on effective objective functions and constraints, and (3) how to adopt a suitable algorithm such that the power system has better economic and reliable characteristics during the operation process. It thus stirs the current study.
Based on the aforementioned analysis, we aim to propose a planning optimization methodology for PVs and BES systems utilizing the JAYA algorithm. The contributions of this article are (1) the proposal of a novel two-level planing optimization from different perspectives to determine the best site selection and capacity sizing and (2) applying the JAYA algorithm to a capacity-sizing and site-selection scheme for for PVs and BESs, achieving satisfactory results.
The rest of the article is organized as follows: Section 2 introduces the system modeling. Section 3 presents the problem formulation as addressed in this article. In Section 4, the availability of the proposed planning optimization approach is validated by simulation results and discussions. Some conclusions are given in Section 5.
2 Modeling of the power system with PVs and BES
2.1 Basic structure of the power system with PVs and BES
Figure 1 shows the typical structure for a power system with PVs and BES systems. It is not difficult to observe from Figure 1 that there are two types of generation (i.e., conventional and PV power generation) to feed the load. Considering that intermittent climate conditions have an adverse impact on PV power generation, the output power from PV panels is non-linear, uncontrollable, and unpredictable. Therefore, utilizing PV power generation technology unavoidably leads to energy variation. Under this circumstance, the power system containing PV panels is used in conjunction with BES systems to mitigate the uncertain power flow by optimal charging and discharging.
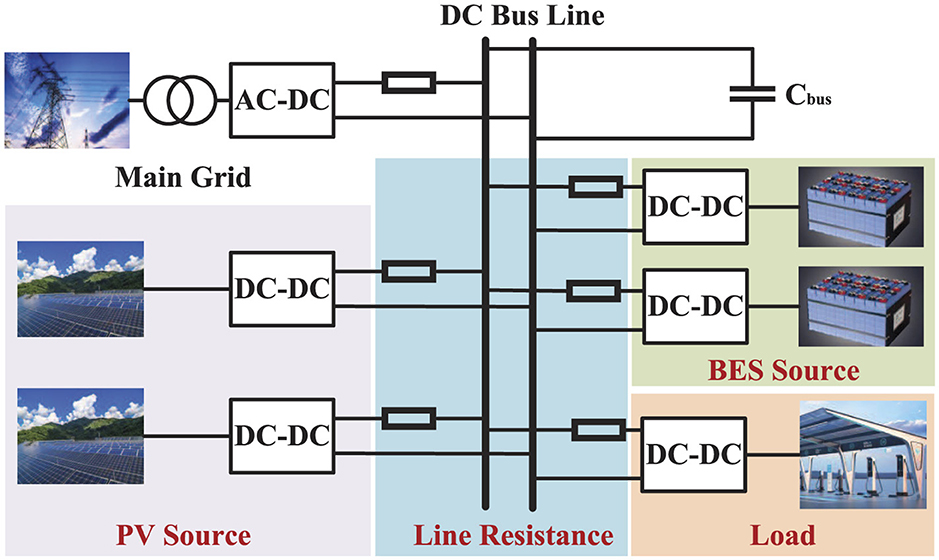
Figure 1. Structure of the power system with photovoltaic panels and battery energy storage (Harasis et al., 2021).
Three modes (i.e., balance, surplus, and deficit) are defined for RES power generation. In the balance mode, the total power generated from RESs, including PVs, is equal to the total customer load. At this time, there are no surplus or deficit powers. In the surplus mode, the total energy produced by RESs is greater than the total customer load. Thus, the BES system is utilized, and the additional energy is stored in the batteries of the power bank. Here, the power flow is from RESs to both the power grid and the BES system. In the power-deficit mode, RESs produce less power than is required by the user. At this moment, the BES system is utilized to fulfill the consumer load in power-deficit time slots. Here, the power flow is from both RESs and the BES system to the customer load. Therefore, the BES system, in conjunction with RESs adds a reliability factor and makes the hybrid model economical for the user.
2.2 Modeling of the PV power generation
The hourly power output of PV panels for solar radiation is given as follows (Okoye and Solyalı, 2017):
where is the index of the hourly time instant. ı(ı = 1, 2, ⋯ , Npv) is the index of solar PV panel, and Npv represents the number of PV panels. ηpv, ı is the photoelectric conversion efficiency of the ıth PV panel. For the ıth solar PV panel at time t, Ppv, ı, t and Ppvr, ı, respectively, denote the total hourly power and the rated power, Gpvs, ı, t is the solar radiation data. Gpvref denotes the solar radiation under the reference conditions with a value of 1000 W·m−2. Tpvcof is the temperature coefficient of the PV panel, which is set at −3.7 × 10⁻³ °C−1. Tpvref denotes the cell temperature of the PV panel under the given reference conditions, which is normally set at 25°C. Tpvc, ı, t represents the cell temperature of the ıth PV panel at time t, which can be obtained by the following equation:
Here, Tpvamb, t depicts the ambient air temperature at time t. Tpvnoct, ı stands for the normal operating cell temperature, which depends on the manufacturer's specifications for the ıth PV module.
If a number of PV panels exist, then the total power can be calculated as follows:
where Ppvs denotes the total power generated by all PV panels over one year.
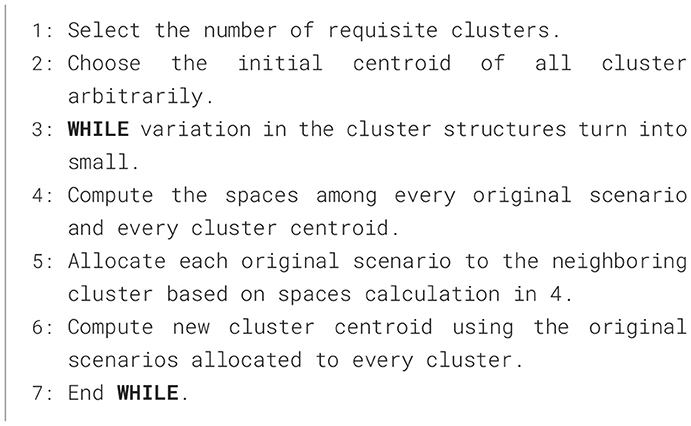
When handling the energy planning problem, the computation time can be decreased by reducing the number of PV power generation scenarios based on the K-means clustering algorithm. The centroid of each cluster is determined by calculating the average value of solar output power in each cluster. The iterative procedure of the K-means algorithm is described by Prajapati and Mahajan (2021).
Remark 1. Each cluster characterizes a scenario composed of hourly solar PV output power during one day. If the annual PV output power is divided into K scenarios by the K-means clustering algorithm, the PV output power Ppvs can be redefined by
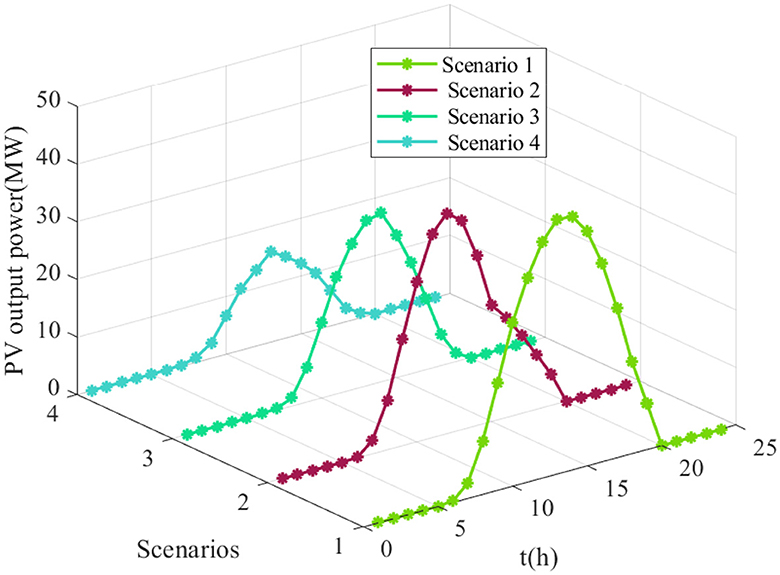
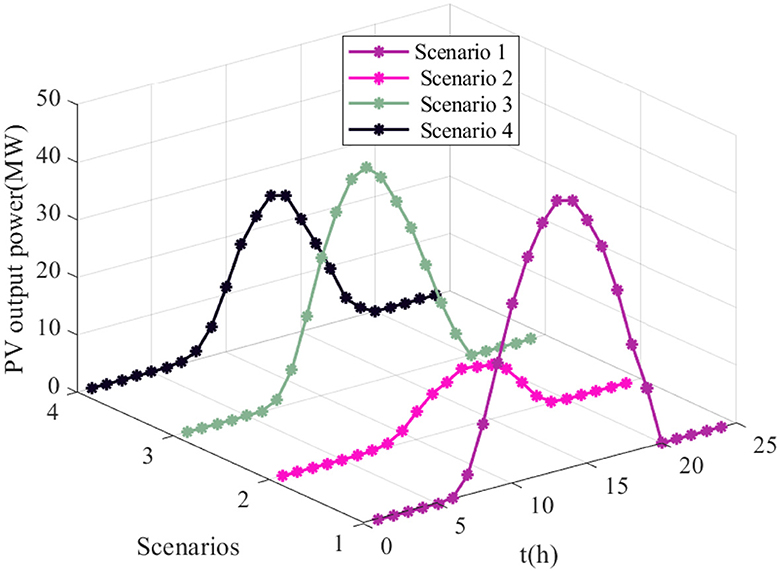
where td(td = 1h, 2h, ⋯ , 24h) represents the time index during one day. For the the kth scenario at time td, Ppv, ı, k,td denotes the output power of the ıth solar PV panels. To illustrate different operation scenarios of solar PV power generation more intuitively, the scenario reduction example of solar output power is shown in Figure 2.
2.3 Modeling of the BES system
The BES system can efficiently offset the unpredictable output of intermittent renewable resources and match the generation and demand levels. The power system's load varies throughout the day and becomes high during evening. An uninterrupted power can be supplied to customers by determining the BES systems' schedules of discharging and charging. BES systems are characterized by rated capacity and rated power. Rated capacity indicates the maximum amount of energy that can be stored in megawatt-hours by the BES system while rated power indicates the charging and discharging power in megawatts of the BES system. The BES system is modeled as follows (Hemmati et al., 2017):
where sȷ, t represents the status flag of the ȷth BES, the corresponding expression is as follows:
ȷ(ȷ = 1, 2, ..., Nbes) is the index of BES systems, and Nbes stands for the number of BES systems. Δtbes, ȷ is the charging/discharging period of the ȷth BES system. ηc and ηd are the charging efficiency and the discharging efficiency of the ȷ-th BES. Ebes, ȷ, t−1 and Ebes, ȷ, t are the total capacities of the ȷth BES at time t−1 and t, respectively. For the ȷth BES system at time t, Pbes, ȷ, t stands for the charging-discharging power; Pbes, ȷ, t>0 and Pbes, ȷ, t < 0, respectively, indicate the charging and discharging power; and |Pbes, ȷ, t| denote the absolute value of the charging-discharging power. |Pbes, ȷ, min| and |Pbes, ȷ, max| stand for the minimum and maximum values of |Pbes, ȷ, t|, respectively. SOCȷ, t−1 and SOCȷ, t denote the state of charging at time t−1 and t, respectively. SOCȷ, min and SOCȷ, max are the minimum and maximum charging states of the ȷth BES system, respectively.
Remark 2. From Equations 5–9, we see that the charging-discharging power, the state of charging, and the capacity of the BES system are well-constrained based on practical engineering applications. In addition, the initial and final state-of-charging (SOC) values regarding the ȷth BES system also satisfy the constraint defined by Equation 9.
3 Problem formulation
In this article, we focus on solving planning problems related to siting and determining the capacity of PVs and BES systems. To reduce the economic cost of a power system containing solar PV panels and BES systems, a novel two-level planning model including the investment and operation levels is proposed as follows:
where and denote investment decision variables and operational variables, respectively. and stand for the inequality and equality constraints at the investment level. and , respectively, denote the inequality and equality constraints at the operational level. and denote the objective functions at the investment and the operational level, respectively.
3.1 Objective function at the investment level
Because the life cycle of each piece of investment equipment in a power systems is inconsistent, they need to be converted into the same planning cycle. Under this circumstance, the objective function at the investment level is defined as follows:
where F is the objective function related to the investment cost of a power system with the PVs and BES systems. and , respectively, denote the investment costs of PVs and BES systems at time t. Spv, ı and Sbes, ȷ, respectively, stand for the installation capacity of a single PV and BES system, which are decision variables of the objective function F. cpv and cbes are the investment costs of the power generation every Mega Volt-Ampere (MVA) for PVs and BES systems, respectively. γpv and γbes denote the discount rates of PV panels and BES systems, which can be calculated using the following equations (Hemmati et al., 2017; Rahmani-andebili, 2015):
Here, ℏpv and ℏbes are rates of interest. yearpv and yearbes are the lifetimes of the PV panels and the BES systems, respectively.
3.2 Objective function at the operational level
For a power system that includes PVs and BES systems, accounting for the impact of operating costs from different companies on system economics is also crucial. To minimize the operating costs of the power system in practical engineering application, the objective function at the operational level is defined as follows:
where f is the objective function of the operational cost from various companies. b denotes the index of system buses. For the bth bus at time t, , , , , and , respectively, denote the operational costs of generating companies (GENCOs), energy storage companies (ESCOs), photovoltaic companies (PVCOs), line transmission companies (LTRANSCOs), and customers, which can be calculated by the following detailed analysis.
GENCOs need to consider not only the operating costs of traditional power generation methods but also the profits generated in the process of supplying power to ESCOs and customers. Hence, the operational cost for GENCOs can be expressed as follows:
where cgs is the sale price per MVA from GENCOs. For the bth bus at time t, Pℓȷ, b, t is the charging power of the ȷth BES system provided by the ℓth power generator. Pℓu, b, t is the power transmitted from the ℓth power generator to the uth customer. GCT, ℓ, b, t is the operational cost of the traditional power generation approach, which can be obtained as follows:
Here, αℓ, b, βℓ, b, and δℓ, b denote the polynomial coefficients of traditional power generation cost GCT, ℓ, b, t. For the bth bus at the time instant t, Pgen, ℓ, b, t is the power dispatched by the ℓth generator.
Because the operational expenses and profits of ESCOs are, respectively, determined by the charging and discharging power of BES systems, the operational cost for ESCOs can be defined as follows:
where cec and ced are the charging and discharging prices per MVA from ESCOs, respectively. For the bth bus at time t, Pıȷ, b, t is the charging power of the ȷth BES system provided by the ıth PV panel. Pȷu, b, t is the discharging power transmitted from the ȷth BES system to the uth customer.
Similarly, the operational costs for PVCOs can be written as follows:
where cps is the sale price per MVA from PVCOs. Pıu, b, t is the power transmitted from the ıth PV to the uth customer.
Furthermore, taking into account the demand interrupt cost and the cost of obtaining electricity from GENCOs and PVCOs is necessary when we calculate operating costs from the perspective of customers. At this moment, the operational costs for customers can be written as follows:
where DCu, b, t is the demand interrupt cost of the uth customer located in the bth bus at time t, which can be calculated as follows:
Here, PLC, u, b, t represents the load curtailment of the uth customer at bus k at time t. CDFb, t is a function of interruption duration, which is highly related to the duration and frequency of the interruption to customers. The value of CDF taken for customers are given by Wong et al. (1999).
Due to the inevitable line loss during power transmission, the operational cost for TRANCOs can be obtained by the following formula:
where Ploss, ε, t is the power loss of the εth transmission line. cll is the sale price for every kilowatt-hour when a line power loss happens in the branch of a power system with PVs and BES systems.
Substituting Equations 15–19 into the objective function (Equation 14), deriving the objective function at operational level is not difficult and can be rewritten as follows:
Remark 3. The charging price of BES systems is usually determined by the sales prices of GENCOs, PVCOs, and LTRANCOs. According to the overall benefits for society, the power loss cost between different companies is included in the total line transmission loss cost of the system. For the convenience of calculation, the charging cost for ESCOs is considered to be the same as the operational costs for GENCOs, PVCOs, and LTRANCOs in this article, excluding the transmission loss cost. In addition, the energy storage of the BES systems is obtained during the charging process, so the discharge loss is also calculated using the charging price.
3.3 Equality and inequality constraints
Because the total real power generation at time t much be balanced with the total load when generators dispatch, PV curtailment, and charging-discharging of BES systems are performed. Based on the preceding principle, the active power balance constraint is written as follows:
where PL, ε, t and Ploss, ε, t are the real power flow and the power loss of εth transmission line at time t, respectively. For the bth bus at the time instant t, Pgen, ℓ, b, t, Ppv, ı, b, t, Pbes, ȷ, b, t, and Pload, u, b, t, respectively, denote the real power obtained by generators, PV panels, BES systems, and loads from all the customers, the corresponding expressions are defined as follows:
Similarly, the reactive power balance constraint is described as follows:
where QL, ε, b, t is the reactive power flow of εth transmission line. For the bth bus at time t, Qgen, ℓ, b, t and Qload, u, b, t are the reactive power of the ıth load and the uth load, respectively. The preceding equation reveals that the total power generation have to be balanced with total reactive demand at time t.
The inequality constraints regarding the planning problem shown in Equation 11 are defined in this subsection. First, the number of candidate node connections for distributed power sources is limited by Equation 27:
where Npvmin and Npvmax are maximum and minimum quantities of PVs. Nbesmin and Nbesmax are maximum and minimum quantities of the BES systems.
Then, the upper and the lower limits of line transmission loss power are defined as follows:
Ramp rates regarding the output power of the generator are limited as follows:
Finally, the variation range of the voltage located in the bth bus is determined by the following inequality:
Remark 4. Substituting the objective function at the investment level (Equation 12), the objective function at the operational level (Equation 20), the equality constraints (Equations 21–26), and the inequality constraints (Equations 27–30) into the two-level planning model (Equation 11), the planning problem of determining the locations and the capacities related to PVs and BES systems can be addressed successfully. Therefore, the total number of PV panels and BES systems (i.e., Npv and Nbes), the corresponding install locations, and the total capacity are obtained by solving the planning issue of the power system with new energy sources.
3.4 Proposed methodology based on the JAYA algorithm
For the JAYA algorithm, the objective function Γ(x), with a series of decision variables and candidate solutions, is minimized at each iteration γ. During the iteration process, Γ(x)best and Γ(x)worst, respectively, stand for the best- and worst-candidate solutions, which are significant in the entire population, then the corresponding decision variables are changed according to the iteration criteria defined by Rao (2016):
where ξ(ξ = 1, 2, ⋯ , nd) is the index of decision variables and nd is the number of decision variables. χ(χ = 1, 2, ⋯ , nc) is the index of candidate solutions, and nc is the number of candidate solutions. γ(γ = 1, 2, ⋯ , nt) is the index of iteration times, and nt is the number of iteration times. For the χth candidate solution in the γth iteration, Xξ, χ, γ and are the current and updated values of the ξth decision variables, respectively. r1, ξ, γ and r2, ξ, γ are random numbers generated with the range [0, 1]. |Xξ, χ, γ| is the absolute value of Xξ, χ, γ. Xξ, best, γ and Xξ, worst, γ are the ξth decision variables for the best- and worst-candidate solutions, respectively.
To achieve convergence as fast as possible, the JAYA algorithm continuously updates the results by seeking the optimal and avoiding the worst solutions. Based on the preceding analysis, we utilized the JAYA algorithm to search for the optimal locations and capacities of PVs and BES systems in this article, and the corresponding methodology flow based on the JAYA algorithm is shown in Figure 3.
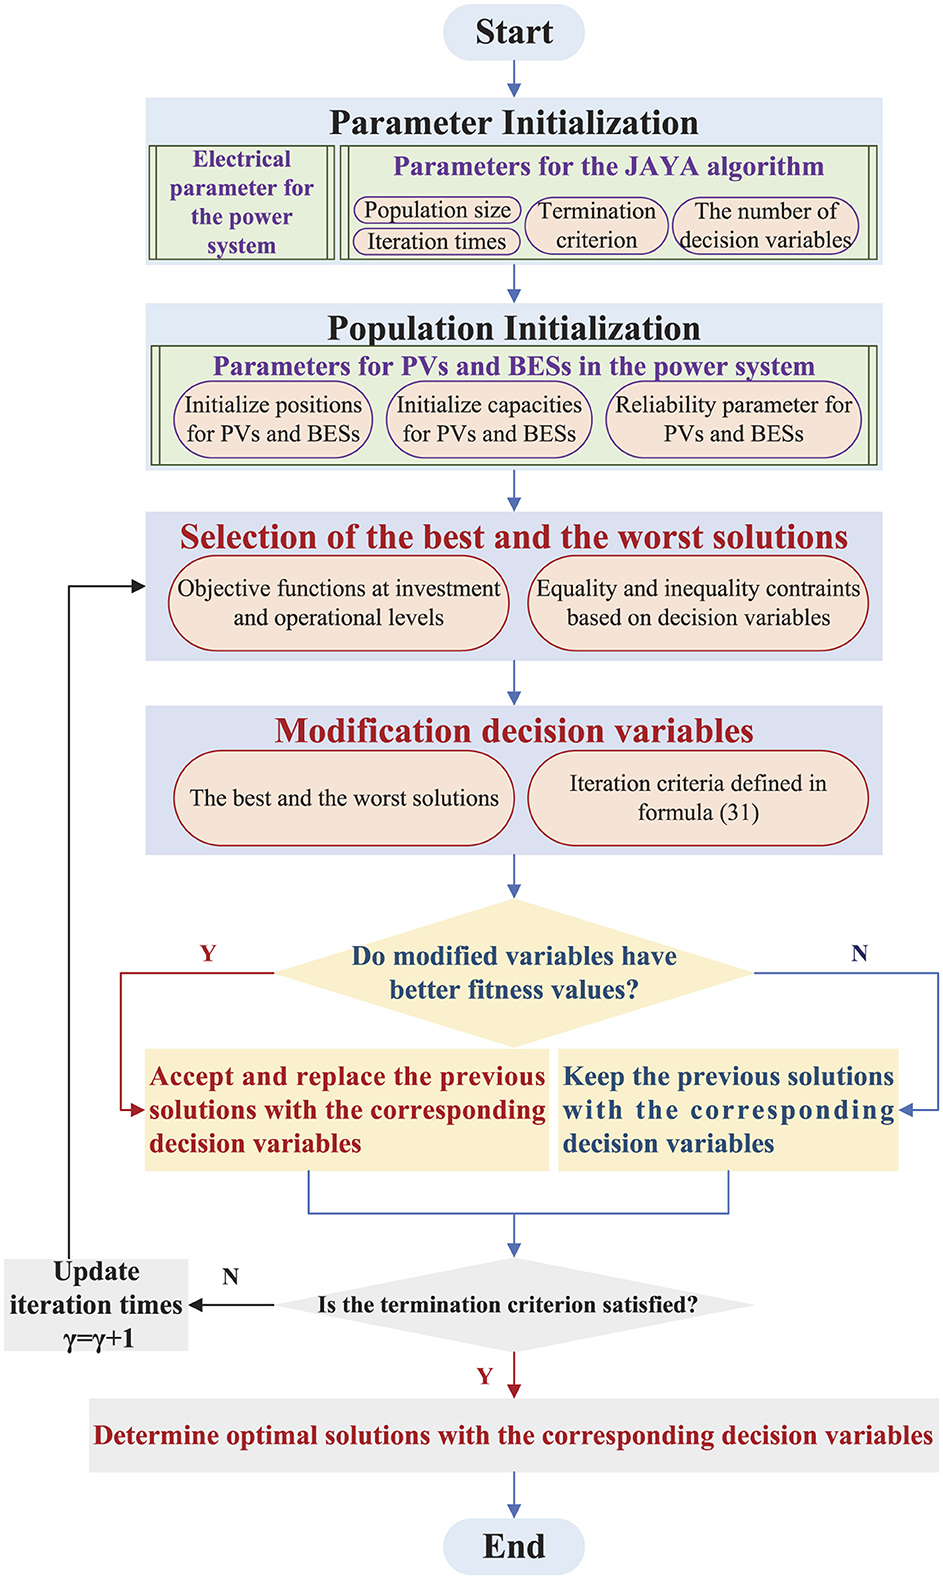
Figure 3. Methodology flow based on the JAYA algorithm. PV, photovoltaic; BES, battery enery storage.
Remark 5. Compared to other advanced intelligent algorithms like PSO (Harasis et al., 2021) and droop control (Harasis, 2024) algorithms, the JAYA algorithm is an optimization methodology that only takes common control parameters, including population size and termination criteria, into account. Namely, the JAYA algorithm does not require specific parameter adjustments for its execution.
4 Simulation result
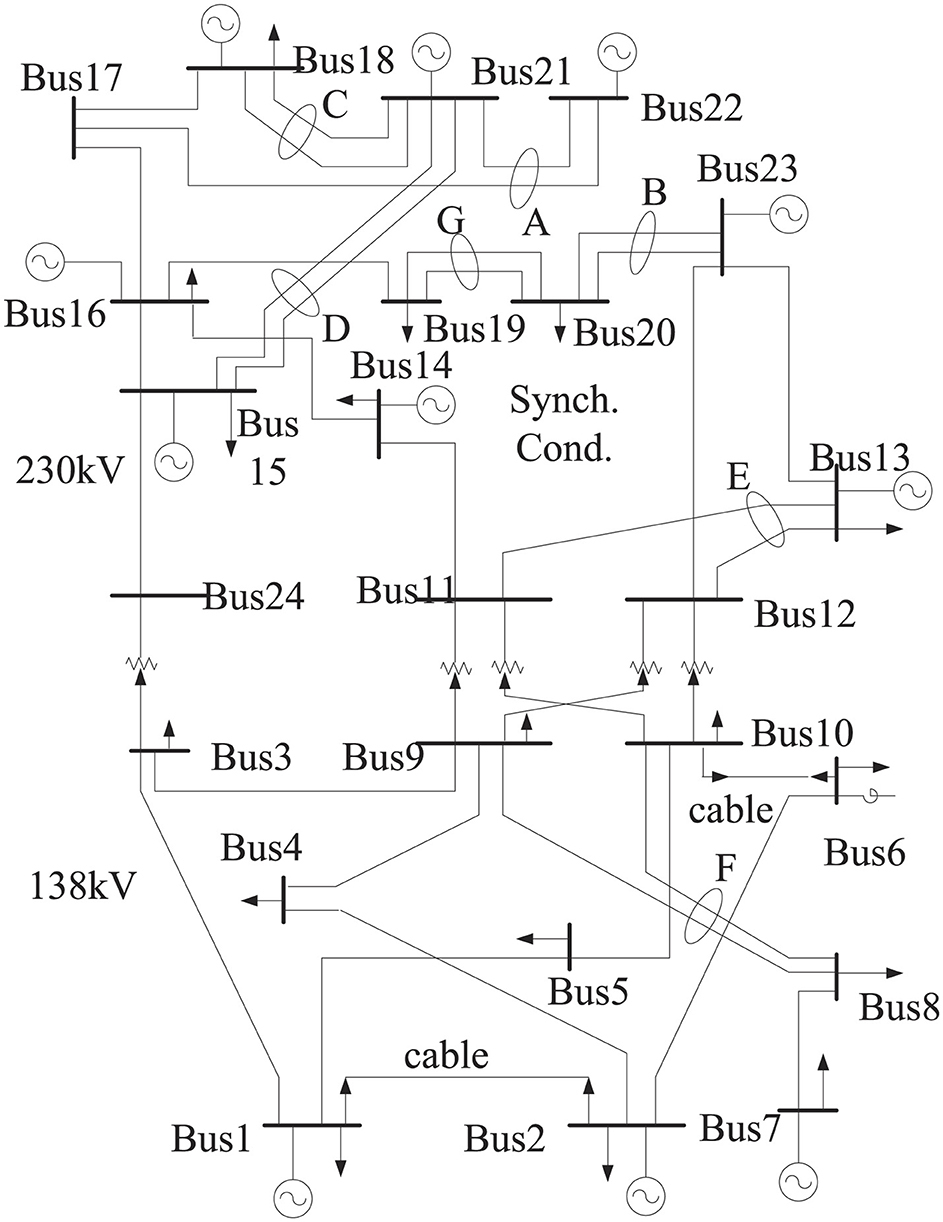
To demonstrate the proposed optimization methodology's effectiveness based on the JAYA algorithm, a practical IEEE 24-bus power system with PVs and BES systems is utilized as the test system in this section. The main topology of the practical IEEE 24-bus power system is shown in Figure 4, and the corresponding electrical parameters are given by Wong et al. (1999). The computational work in this study was carried out using the MATPOWER tool and MATLAB software on a computer with the following specifications: DESKTOP-C6K2ACT, CPU 16GHz, RAM 8GB DDR4 2133 (F4-2133C15S-8GNT).
According to the IEEE 24-bus power system, the validity and availability of the proposed planning optimization method based on the JAYA algorithm are demonstrated by the following cases. Some of the main parameters for Case 1 and Case 2 are listed in Table 1.
Case 1: In this case, we will verify that the proposed two-level planning optimization methodology (Equation 11) with objective functions at the investment and operational levels can configure the locations and capacities of PVs and BES systems much better at minimum cost.
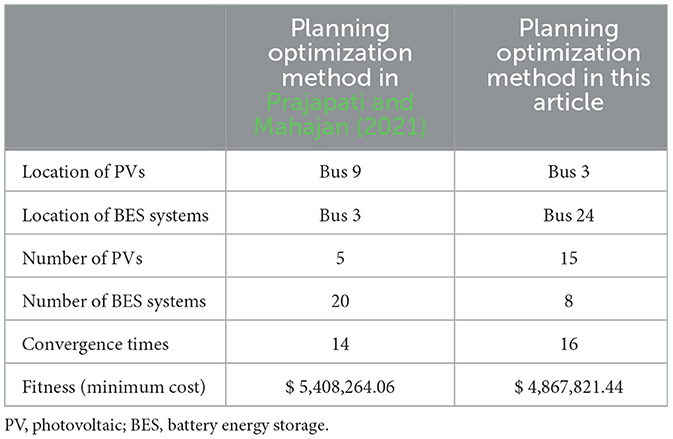
Based on the PV power generation illustrated in Figure 5, a comparison of the results of planning optimization approaches under the objective functions proposed by Prajapati and Mahajan (2021) and used in this article are listed in Table 2. To more intuitively describe the comparison results for Case 1, the corresponding simulation results are shown in Figures 6–10.
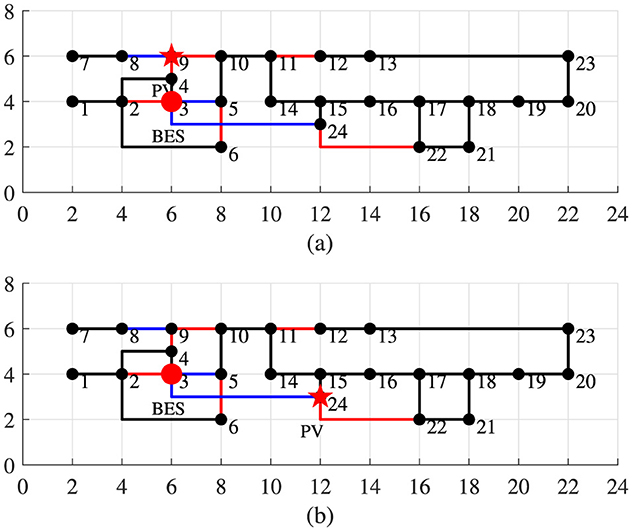
Figure 6. Site selections of photovoltaics (PVs) and battery energy storage (BES) systems under different planning optimization methods for Case 1. (a) Planning optimization method used by Prajapati and Mahajan (2021). (b) Planning optimization method used in this article.
The locations of PVs and BES systems obtained by the planning optimization methods proposed by Prajapati and Mahajan (2021) and used in this article are shown in Figures 6a, b, respectively. At this time, the number of PVs and BES systems using the planning optimization method proposed by Prajapati and Mahajan (2021) are, respectively, 5 and 20. The number of PVs and BES systems using the planning optimization method presented in this article are, respectively, 15 and 8.
According to the configuration of PVs and BES systems shown in Figure 6, the fitness values of the planning optimization methods used by Prajapati and Mahajan (2021) and used in this article are shown in Figure 7. Compared to the results of Prajapati and Mahajan (2021) planning optimization approach, the planning optimization approach presented in this article is more effective in finding the minimum cost because the objective functions at the operational level in this article consider the cost gains and losses for each enterprize. Thus, the optimization strategy proposed in this article is looking for a better benefit plan from the perspective of society.
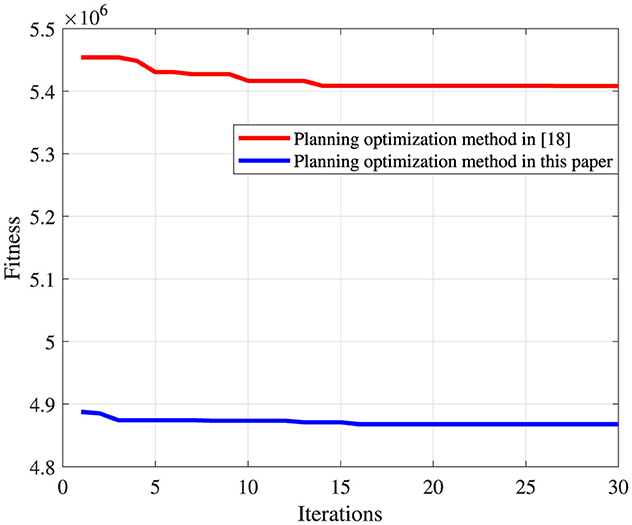
Figure 7. Comparison of fitness and iteration times for the different planning optimization methods for Case 1.
The capacities of PVs and BES systems under the planning optimization methods proposed by Prajapati and Mahajan (2021) and used in this article are shown in Figures 8, 9, respectively. It is not difficult to observe that the capacities of PVs and BES systems determined by the planning optimization method used by Prajapati and Mahajan (2021) are much less than those obtained by the planning optimization method in this article. This comparison result illustrates that Prajapati and Mahajan (2021) planning optimization method uses PVs for energy storage when the PVs' power generation is sufficient. Conversely, the planning optimization method used in this article is directly uses PVs for customers because the objective functions proposed in this article fully consider the BES systems' losses.
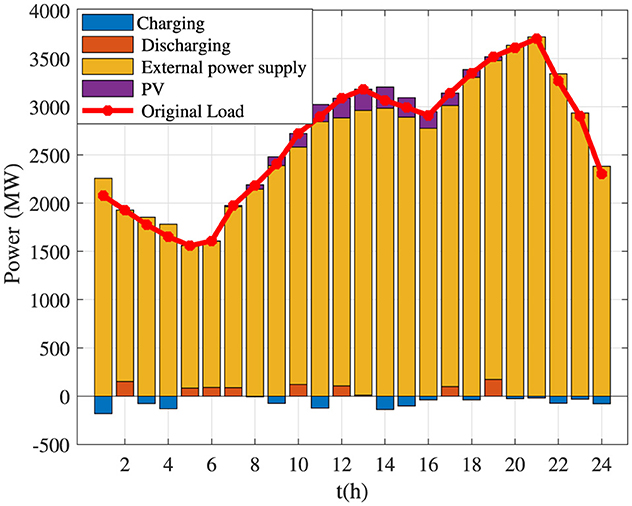
Figure 8. Capacities of photovoltaics (PVs) and battery energy storage systems under the planning optimization method in Prajapati and Mahajan (2021) for Case 1.
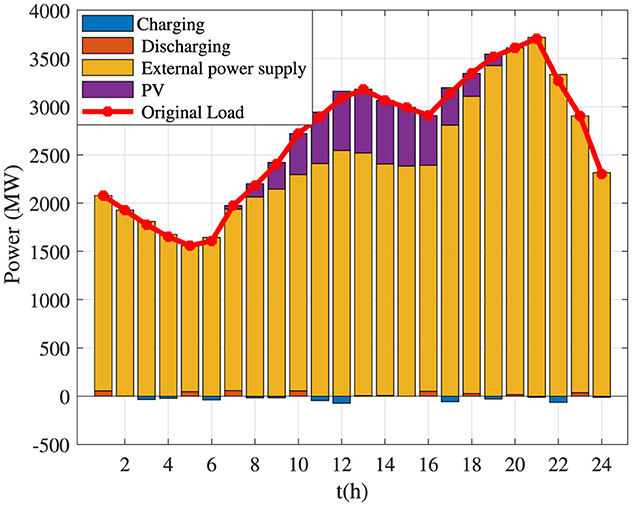
Figure 9. Capacities of photovoltaics (PVs) and battery energy storage systems under the planning optimization method proposed in this article for Case 1.
The charging and discharging situation of the BES systems under the different planning optimization methods are shown in Figure 10. By comparing the simulation results shown in Figures 10a, b, seeing that the charging/discharging power of BES systems using the planning optimization method used in this article is significantly smaller than that using the planning optimization method proposed by Prajapati and Mahajan (2021). Moreover, the varying trend for the SOC of the BES systems is smoother using the planning mechanism presented in this article over a certain period. The preceding comparison results verify that the planning method proposed in this article can simultaneously maintain the power grid system's stability, reduce maintenance costs, and improve the system's efficiency.
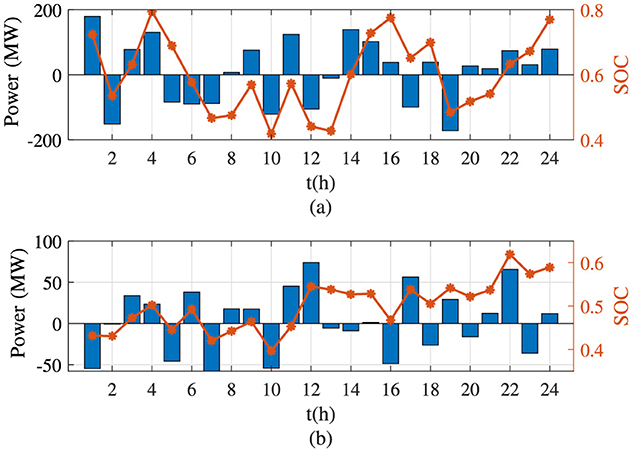
Figure 10. Charging and discharging situation of the battery energy storage systems in the different planning optimization methods for Case 1. (a) Planning optimization method used in Prajapati and Mahajan (2021). (b) Planning optimization method used in this article. SOC, state of change.
Case 2: In this case, we will verify that the adopted JAYA algorithm has a much stronger capacity for solving the optimal solutions. For this purpose, a comparative analysis was conducted between the JAYA and PSO algorithms. The PVs' output power at different scenarios for Case 2 is shown in Figure 11.
In this case, a series of comparison results using the planning optimization method (Equation 11) with the JAYA and PSO algorithms are illustrated in Table 3. To more effectively depict the comparison results for Case 2, the corresponding simulation results based on various solution algorithms are shown in Figures 12–15.
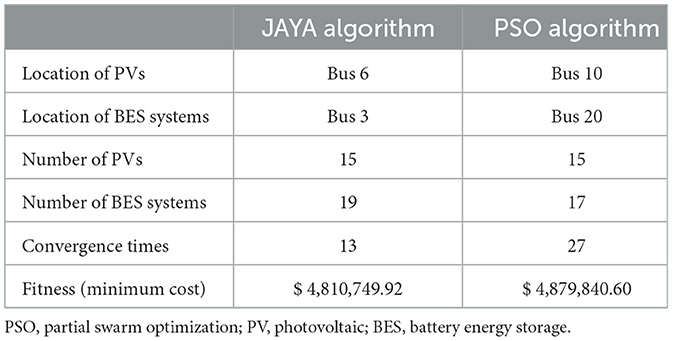
Table 3. Comparison of the planning optimization method with various solution algorithms for Case 2.

Figure 12. Site selections of photovoltaics (PVs) and battery energy storage (BES) systems using different algorithms for Case 2. (a) JAYA algorithm. (b) Partial swarm optimization algorithm.
The locations of PVs and BES systems determined using different algorithms are shown in Figure 12, where the number of PVs and BES systems using the JAYA algorithm are 15 and 19, respectively. Meanwhile, the number of PVs and BES systems using the PSO algorithm are 15 and 17, respectively.
Based on the configuration shown in Figure 12, the comparison results of the planning optimization method using the JAYA and PSO algorithms are shown in Figure 13. It is obvious to find that the planning optimization problem solved using the JAYA algorithm has a faster convergence speed and more stable convergence characteristics for determining the fitness (i.e., minimum cost).
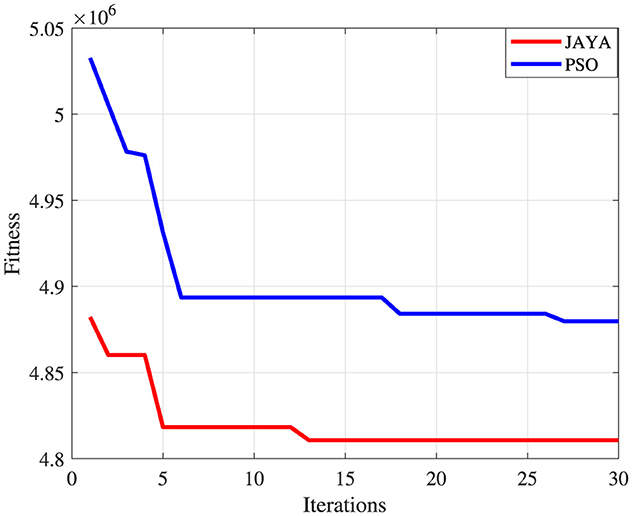
Figure 13. Comparison of fitness and iteration times for the different algorithms for Case 2. PSO, partial swarm optimization.
The PVs' and BES systems' capacities under the planning optimization method using the JAYA and PSO algorithms are shown in Figures 14, 15, respectively. As seen in these figures, the planning optimization configurations obtained using the JAYA and PSO algorithms do not change the output power provided by PVs. However, the charging and discharging states can be switched more frequently in terms of the configuration results determined by the JAYA algorithm. Therefore, the planning optimization method using the JAYA algorithm is more suitable for large-scale industrial or commercial applications with a quick power demand response.
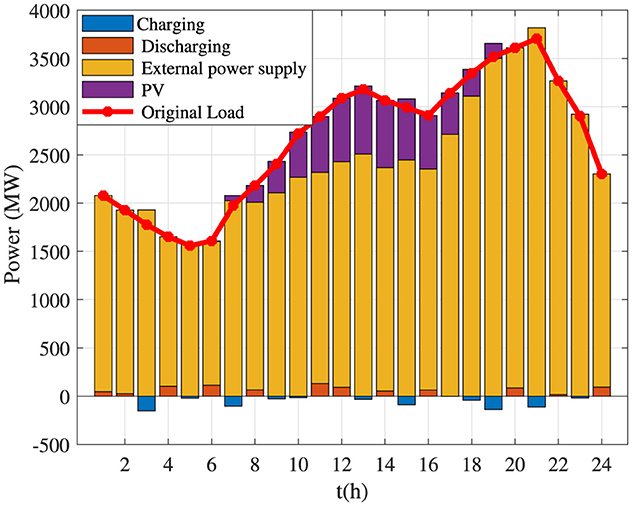
Figure 14. Capacities of photovoltaics (PVs) and battery energy storage (BES) systems using the JAYA algorithm for Case 2.
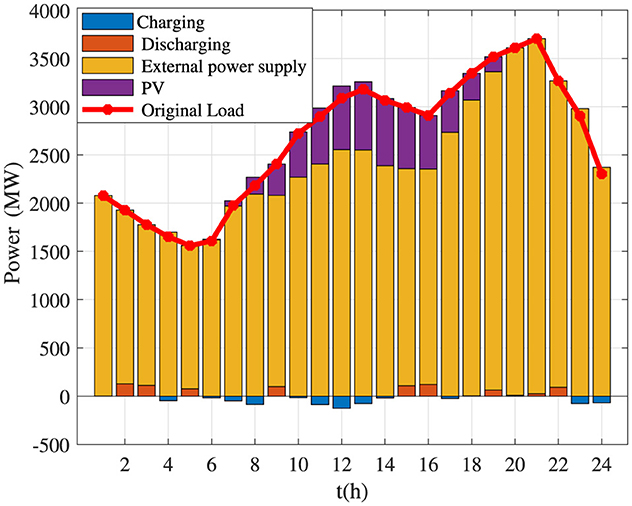
Figure 15. Capacities of photovoltaics (PVs) and battery energy storage systems using the partial swarm optimization algorithm for Case 2.
The charging and discharging situation of the BES systems under the planning optimization method with different algorithms are shown in Figure 16. Compared to the varying trend of SOC determined using the PSO algorithm, it is not difficult to find that the SOC calculated using the JAYA algorithm changes much more smoothly over a certain period. This illustrates that the planning optimization method using the JAYA algorithm is more active in energy management and charging and discharging regulation, which helps maintain the system's stability when demand changes drastically.
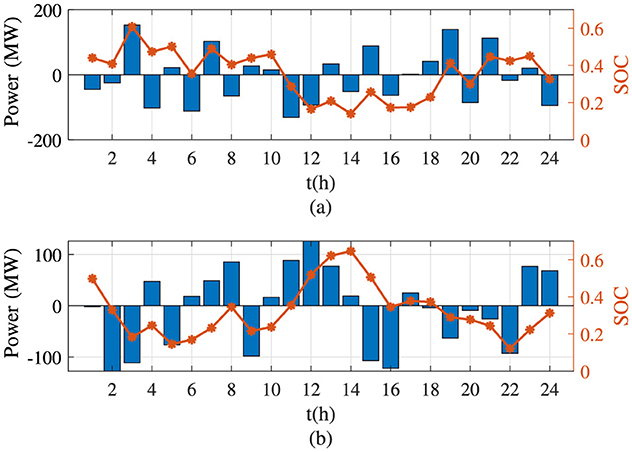
Figure 16. Charging and discharging situation of the battery energy storage system using different algorithms for Case 2. (a) JAYA algorithm. (b) Partial swarm optimization algorithm. SOC, state of change.
5 Conclusion
In this article, a new planning optimization method based on the JAYA algorithm has been proposed and implemented in an IEEE 24-bus power system. First, the mathematical model for a power system with PVs and BES systems was constructed by introducing varying binary variables. Then, the two-level planning optimization methodology was proposed for configuring the capacities and the locations of RESs, where the objective functions at the investment and operational levels are determined for various companies, including GENCOs, LTRANCOs, ESCOs, PVCOs, and customers. Subsequently, a flowchart of the planning optimization methodology using the JAYA algorithm was determined to obtain the optimal solutions as fast as possible. Finally, the effectiveness of the proposed planning optimization method was validated by using the MATPOWER 7.1 tool on an IEEE 24-bus system. Based on the comparison results for the different cases, it is obvious that the planning optimization method designed in this article has much stronger capability for enhancing the power grid's stability with various RESs. In addition, the optimal planning configuration results can be determined using the JAYA algorithm with shorter convergence times compared to the PSO algorithm.
In terms of the preceding discussion, it is recommended that the research work in this article has proved the applicability of the JAYA algorithm in a new-energy fixed-capacity location. In further research, we will focus on the coordination between the charging time of BES systems and the power grid policy to make the objective functions of planning optimization approach more practical.
Data availability statement
The raw data supporting the conclusions of this article will be made available by the authors, without undue reservation.
Author contributions
TC: Conceptualization, Data curation, Funding acquisition, Writing – original draft, Writing – review & editing. MO: Methodology, Project administration, Software, Supervision, Validation, Writing – original draft, Writing – review & editing. SZ: Formal analysis, Investigation, Validation, Writing – original draft, Writing – review & editing.
Funding
The author(s) declare financial support was received for the research, authorship, and/or publication of this article. This work was supported by the University Synergy Innovation Program of Anhui Province (GXXT-2023-032), the University Synergy Innovation Program of Anhui Province (GXXT-2023-030), and the Anhui Photovoltaic Industry Generic Technology Research Center (2024AHPV000001). This research project was also supported by the Research Fund of the Education Department of Anhui Province, China, to support teachers in the field of new energy to study and research in the field of new energy.
Conflict of interest
The authors declare that the research was conducted in the absence of any commercial or financial relationships that could be construed as a potential conflict of interest.
Publisher's note
All claims expressed in this article are solely those of the authors and do not necessarily represent those of their affiliated organizations, or those of the publisher, the editors and the reviewers. Any product that may be evaluated in this article, or claim that may be made by its manufacturer, is not guaranteed or endorsed by the publisher.
References
Abdelaleem, N. M., and Anis, W. R. (2021). “Cost versus reliability study for stand-alone pv systems in tropical climates,” in 2021 3rd Novel Intelligent and Leading Emerging Sciences Conference (NILES) (Giza), 103–108.
Banos, R., Manzano-Agugliaro, F., Montoya, F. G., Gil, C., Alcayde, A., and Gómez, J. (2011). Optimization methods applied to renewable and sustainable energy: a review. Renew. Sustain. Energy Rev. 15, 1753–1766. doi: 10.1016/j.rser.2010.12.008
Cui, Q., Bai, X., Dong, W., and Huang, B. (2019). Joint optimization of planning and operation in user-side multi-energy systems. Proc. CSEE 39, 4967–4981. doi: 10.1109/ACCESS.2021.3081798
Gandhi, G. A. S., Prakash, R., and Sivasubramani, S. (2020). “Optimal allocation of dg for minimization of power loss and total investment cost using an analytical approach,” in 2020 21st National Power Systems Conference (NPSC) (Gandhinagar), 1–6.
Harasis, S. (2024). Controllable transient power sharing of inverter-based droop controlled microgrid. Int. J. Elect. Power Energy Syst. 155:109565. doi: 10.1016/j.ijepes.2023.109565
Harasis, S., Sozer, Y., and Elbuluk, M. (2021). Reliable islanded microgrid operation using dynamic optimal power management. IEEE Trans. Ind. Appl. 57, 1755–1766. doi: 10.1109/TIA.2020.3047587
Hemmati, R., Saboori, H., and Jirdehi, M. A. (2017). Stochastic planning and scheduling of energy storage systems for congestion management in electric power systems including renewable energy resources. Energy 133, 380–387. doi: 10.1016/j.energy.2017.05.167
Kang, C., and Yao, L. (2017). Key scientific issues and theoretical research framework for power systems with high proportion of renewable energy. Automat. Elect. Power Syst. 41, 2–11. doi: 10.7500/AEPS20170120004
Li, J., Guo, B., Niu, M., Xiu, X., and Tian, L. (2018). Optimal configuration strategy of energy storage capacity in wind/PV/storage hybrid system. Transact. China Electrotech. Soc. 33, 1189–1196.
Li, J., Li, Y., and Zhou, X. (2020). Summary of research on grid-side energy storage technology. Electric Power Construct. 41, 77–84. doi: 10.12204/j.issn.1000-7229.2020.06.010
Lu, J., Mao, Y., Liu, L., Cheng, H., Zhang, J., and Zhang, X. (2021). “Unit commitment of power system with wind power and photovoltaic considering frequency safety constraint,” in 2021 IEEE Sustainable Power and Energy Conference (ISPEC) (Nanjing), 1486–1493.
Lukačević, O., Ćalasan, M., and Mujović, S. (2019). “Impact of optimal ESS allocation in IEEE 24-test bus system on total production cost,” in 2019 20th International Symposium on Power Electronics (Ee) (Novi Sad), 1–5.
Luu, T. V., and Nguyen, N. S. (2020). Parameters extraction of solar cells using modified JAYA algorithm. Optik 203:164034. doi: 10.1016/j.ijleo.2019.164034
Nikzad, M., and Mozafari, B. (2014). Reliability assessment of incentive-and priced-based demand response programs in restructured power systems. Int. J. Electr. Power Energy Syst. 56, 83–96. doi: 10.1016/j.ijepes.2013.10.007
Okoye, C. O., and Solyalı, O. (2017). Optimal sizing of stand-alone photovoltaic systems in residential buildings. Energy 126, 573–584. doi: 10.1016/j.energy.2017.03.032
Paliwal, P. (2021). “Determining optimal component sizes for an isolated solar-battery micro-grid using Butterfly PSO,” in 2021 1st International Conference on Power Electronics and Energy (ICPEE) (Bhubaneswar), 1–6.
Prajapati, V. K., and Mahajan, V. (2021). Reliability assessment and congestion management of power system with energy storage system and uncertain renewable resources. Energy 215:119134. doi: 10.1016/j.energy.2020.119134
Qin, L., Wang, Y., Wei, L., Liu, Y., and Xie, W. (2023). “A new generation cost analysis method of high renewable penetration power grid,” in 2023 IEEE/IAS Industrial and Commercial Power System Asia (I&CPS Asia) (Chongqing), 1660–1665.
Rahmani-andebili, M. (2015). Reliability and economic-driven switchable capacitor placement in distribution network. IET Gen. Trans. Distrib. 9, 1572–1579. doi: 10.1049/iet-gtd.2015.0359
Rao, R. V. (2016). JAYA: a simple and new optimization algorithm for solving constrained and unconstrained optimization problems. Int. J. Ind. Eng. Comp. 7, 19–34. doi: 10.5267/j.ijiec.2015.8.004
Sun, B., Ma, Y., Zheng, G., Chen, D., Gao, Y., and Sun, Z. (2022). “Assessment of new energy consumption capability of receiver grid,” in 2022 4th International Conference on Power and Energy Technology (ICPET) (Beijing), 1143–1146.
Sun, Y., Yang, M., Shi, C., Jia, D., Pei, W., and Sun, L. (2020). Analysis of application status and development trend of energy storage. High Volt. Eng. 46, 80–89.
Teng, F., and Strbac, G. (2016). Business cases for energy storage with multiple service provision. J. Mod. Power Syst. Clean Energy 4, 615–625. doi: 10.1007/s40565-016-0244-1
Wankhede, S. K., Paliwal, P., and Kirar, M. K. (2022). Bi-level multi-objective planning model of solar PV-battery storage-based DERs in smart grid distribution system. IEEE Access 10, 14897–14913. doi: 10.1109/ACCESS.2022.3148253
Wong, P., Albrecht, P., Billinton, R., Chen, Q., Fong, C., Haddad, S., et al. (1999). A report prepared by the reliability test system task force of the application of probability methods subcommittee. IEEE Transact. Power Apparat. Syst. 98, 2047–2054.
Xie, S., Wang, X., Qu, C., Wang, X., and Guo, J. (2015). Impacts of different wind speed simulation methods on conditional reliability indices. Int. Transact. Elect. Energy Syst. 25, 359–373. doi: 10.1002/etep.1851
Yang, J., Li, Z., Gan, J., and Zhang, J. (2018). “Life cycle cost analysis of photovoltaic plant based on interval number theory,” in 2018 IEEE 8th Annual International Conference on CYBER Technology in Automation, Control, and Intelligent Systems (CYBER) (Tianjin), 1144–1148.
Zhang, L., Yu, Y., Li, B., Qian, X., Zhang, S., Wang, X., et al. (2021). Improved cycle aging cost model for battery energy storage systems considering more accurate battery life degradation. IEEE Access 10, 297–307. doi: 10.1109/ACCESS.2021.3139075
Zhang, Y., Chi, A., and Mirjalili, S. (2021). Enhanced JAYA algorithm: a simple but efficient optimization method for constrained engineering design problems. Knowl. Based Syst. 233:107555. doi: 10.1016/j.knosys.2021.107555
Keywords: PV, BES, planning optimization, JAYA algorithm, IEEE 24
Citation: Chen T, Othman MM and Zhu S (2024) Optimization of photovoltaic and battery energy storage configuration utilizing the JAYA algorithm. Front. Sustain. Resour. Manag. 3:1466051. doi: 10.3389/fsrma.2024.1466051
Received: 17 July 2024; Accepted: 31 October 2024;
Published: 04 December 2024.
Edited by:
Andreas Olympios, University of Cyprus, CyprusReviewed by:
Salman Harasis, Tafila Technical University, JordanPreetham Goli, University of Missouri-Kansas City, United States
Copyright © 2024 Chen, Othman and Zhu. This is an open-access article distributed under the terms of the Creative Commons Attribution License (CC BY). The use, distribution or reproduction in other forums is permitted, provided the original author(s) and the copyright owner(s) are credited and that the original publication in this journal is cited, in accordance with accepted academic practice. No use, distribution or reproduction is permitted which does not comply with these terms.
*Correspondence: Muhammad Murtadha Othman, bWFtYXQ1MDVteUB5YWhvby5jb20=
 Tao Chen
 Muhammad Murtadha Othman1*