 Praveen Chandramenon
 Andrew Gascoyne
 Fideline Tchuenbou-Magaia
94% of researchers rate our articles as excellent or good
Learn more about the work of our research integrity team to safeguard the quality of each article we publish.
Find out more
ORIGINAL RESEARCH article
Front. Sustain. Resour. Manag. , 06 May 2024
Sec. Natural Resources
Volume 3 - 2024 | https://doi.org/10.3389/fsrma.2024.1363914
This article is part of the Research Topic Innovations in the Water-Energy-Food Nexus for Sustainable Management View all articles
Conventional aquaponics conserve water used in aquaponics whereas the literature suggests a certain level of freshwater replenishment or freshwater exchange for good water quality, fish and plant wellbeing, and the overall productivity of the system. This paper deals with the determination of an optimal freshwater replenishment rate for a standard aquaponics system. IoT devices and sensors were used for this project data collection. This paper used linear regressions and ensemble methods to determine the optimal rate of periodic water replenishment to maintain the water quality parameters that determine the yield and productivity of aquaponics systems. Cubic spline and Lagrange interpolation were applied to raw and simulated data. Results were evaluated and compared using statistical error estimation approaches. The best model amongst the investigated machine learning models was gradient boost with an optimal replenishment rate of 19L per week and a water quality of 4.86 for an aquaponic tank of 100 L capacity. The error estimations were a Mean Squared Error of 0.0224, Mean Absolute Error of 0.1137, Root Mean Squared Error of 0.1499, and R2 of 0.7208. This was within 1% of the value obtained from raw and interpolated data using a polynomial regression. These findings suggest that the water quality of an aquaponics system can be maintained at the desired optimal level with a weekly 19% water replenishment, thereby contributing to the improvement of productivity and resource efficiency.
The apparent fast growth of the world population and ever-increasing need for food alongside pressure to achieve sustainable goals has driven changes from conventional farming approaches to sustainable agriculture ones. Aquaponics is an agricultural approach that combines fish and soilless plant production in a recirculating ecosystem where natural bacteria convert fish waste into plant nutrients (Delaide et al., 2017). A coupled aquaponic system contains aquatic organisms, bacteria, and plants that benefit from each other in a closed recirculated water body (Goddek et al., 2019). That is, fish and plants are grown together in a closed system with a regular water recirculation between plants growbed and the fishtank. In a standard coupled aquaponics system, generally, the plants are grown on a growbed media and the fishtank is kept under the plants growbed Fish water is nutrient rich, and the plants take up these nutrients from the water to grow whilst purifying the water which returns to the fish tank. All toxic chemicals accumulated in the water, which are dangerous for the fish life, would be removed when the water is passed over the plants growbed. The quality of water that circulates between the fish tank and the plant determines the productivity of the aquaponics system. Conventional aquaponics conserves the water and the replenishment of water, which consists in exchanging fish water with the same amount of fresh water is somehow empirical. Indeed, water is generally topped up when the water level is decreased due to evaporation or evapotranspiration whilst the literature shows a broad range of water replenishment from 1% to 100%. A study on different aquaculture systems found that a rapid flow of water causes rapid flushing of waste from water which could be beneficial in waste and solid disposal from fish water (Ebeling and Timmons, 2007). A water exchange of 5–10% has been reported to be beneficial for recirculating aquaponics (Gnanasagar et al., 2020) whereas another research suggested that a 3.6% daily water replenishment caused massive nutrient loss when investigating nutrient balances and plant and fish growth performance (Delaide et al., 2017). A project performed a 70% daily water exchange in their aquaponic system during their study on the economic viability of aquaponics systems (Bich et al., 2020). They found that their aquaponics with 70% daily water exchanged have a reduced NH3 level by five times when compared to a standard aquaponic system. An article studied the water level management using bell-siphons in aquaponics and found that water replenishment helps maintain levels of dissolved oxygen between 5 and 10 which is within that acceptable range for good performance (Romano et al., 2023). The range of acceptable values is shown in Table 1. Another research analyzed that the energy and water usage of a raft aquaponics and found about 1% water loss per day and an average of 35,950 L for replenishment per year to cope with this water loss (Love et al., 2015). They applied a maximum of 10% water replenishment only to cope with the water loss. They also used chemical combinations to maintain the water quality. A study reported that higher feeding rates and lower water replenishment may cause nitrite and other toxic chemicals to accumulate in fish water quickly (Rakocy et al., 2004). Another experiment replenished 6.3% of water in their study on tomato production in aquaponics systems where manual methods were used to monitor water quality (Suhl et al., 2016) whereas 9% replenishment of fish water was used by other authors during their study on nutrient recycling from fish water (Graber and Junge, 2009). Moreover, it has been found through a predictive modeling of pH using different regression analyses that pH levels drop over time and chemicals must be applied to maintain good water quality (Mori et al., 2021). The impact of low and high rates of water replenishment is summarized in Figure 1.
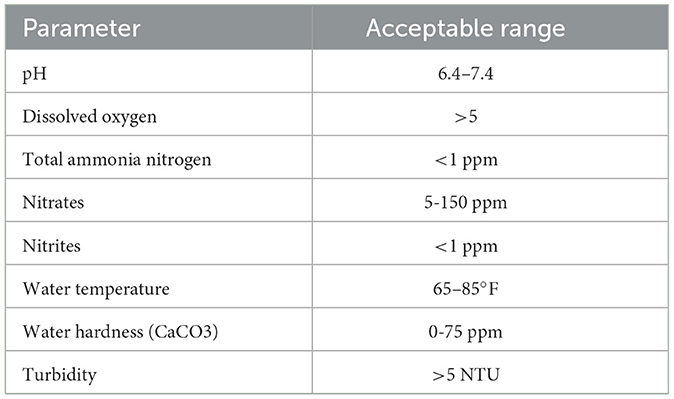
Table 1. Aquaponics water quality parameters with their acceptable limits (adapted from Nhan et al., 2019; Bich et al., 2020; Sallenave, 2022).
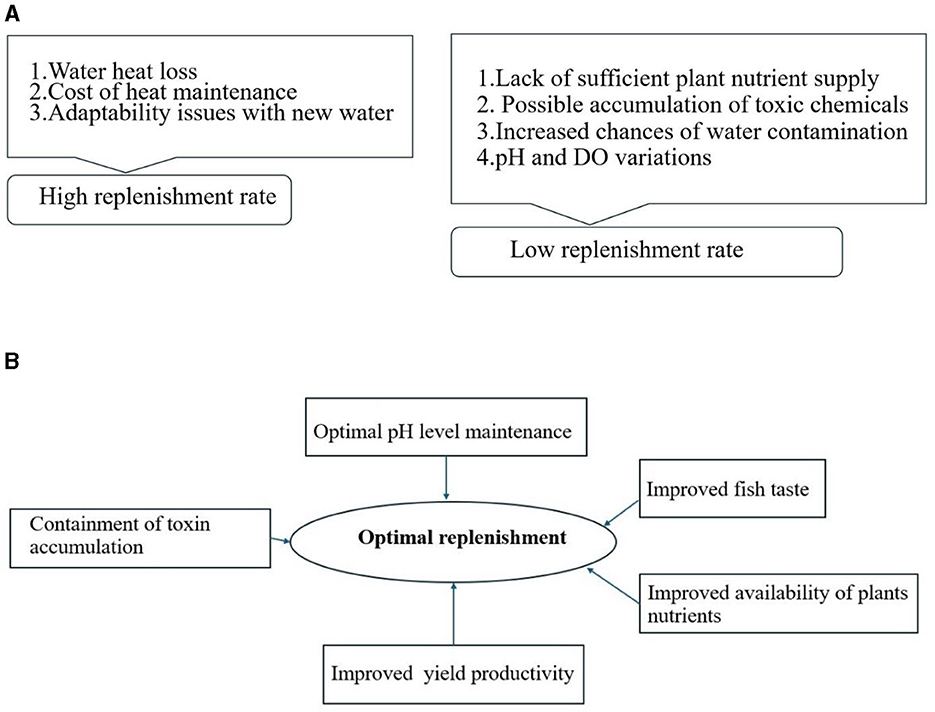
Figure 1. Schematic diagram of the effect of water replenishment on aquaponics system. (A) Effect of high and low replenishment rate; (B) Benefits of optimal water replenishment.
The current literature thus reveals that most of the aquaponics systems have either no daily water replenishment or water replenishment values ranging from as low as below 10% (Graber and Junge, 2009; Suhl et al., 2016; Blanchard et al., 2020; Rakocy et al., 2022; Shaw et al., 2022) to complete or 100% water replenishment (Nhan et al., 2019). Moreover, water replenishment has not been applied intentionally in any system or any fixed rate of replenishment identified for a defined amount of fish water. Also, a very little or no explanation were evident in current literature regarding the replenishment rate used or regarding its impacts. Understanding the effect of a regular and fixed rate of water replenishment on an aquaponics system is important for the growth of the plants and fish and thus, needs a deeper analysis, which is currently missing in the literature. Similarly, very limited studies focus on the application of machine learning to analyse and control water quality and the impacts of water replenishment on fish and plants. Therefore, the main research problem addressed on this paper is the determination of the optimal water replenishment rate for an aquaponics system. This was achieved by estimating the water quality index from the data collected through sensors and IoT devices followed by the application of statistical approaches and machine learning algorithms to identify the best water replenishment rate. The words water replenishment, water exchange and flush rate have been used interchangeably, in this article.
The experiment was done in an indoor aquaponics system installed at the University of Wolverhampton, England. This aquaponic testbed is of dimensions 2 m high by 1 m width and 0.5 m thick. The testbed consists of three sections of which the first shelf from the top has the growbed with clay balls. The lower shelf is used to keep the fish tank at 100 Liters capacity. The middle shelf is used to keep sensors and IoT devices (Figure 2). The system also has an automatic fish feeder (Smart Feeder-AF-2019B) and artificial lighting (LikeSun LED Grow Light). Six Swiss chard (Beta Vulgaris var. cicla) and 6 Cold water Carp fish of 0.127 meters (5 inches) long, were used as initial growing materials. The weight of each fish was total density of the fish were 25 grams and 0.15 kg/m3, respectively The ratio between fish and plants used in this experiment was 1:1, that is the test bed contains 6 plants and 6 fish. Timers were used for water recirculation and LED lighting in a way that water was recirculated for 15 min every 30 min with a flow rate of 350 L/h maximum. The LED lighting was turned on from 6 pm to 6 am, every day. A fish feeder dispersing 12 grams of Walters Nutrimix (2 grams per fish) was used to feed the fish around 1 pm every day. The feed quantity was calculated to meet the fish feed requirement according to their biomass.
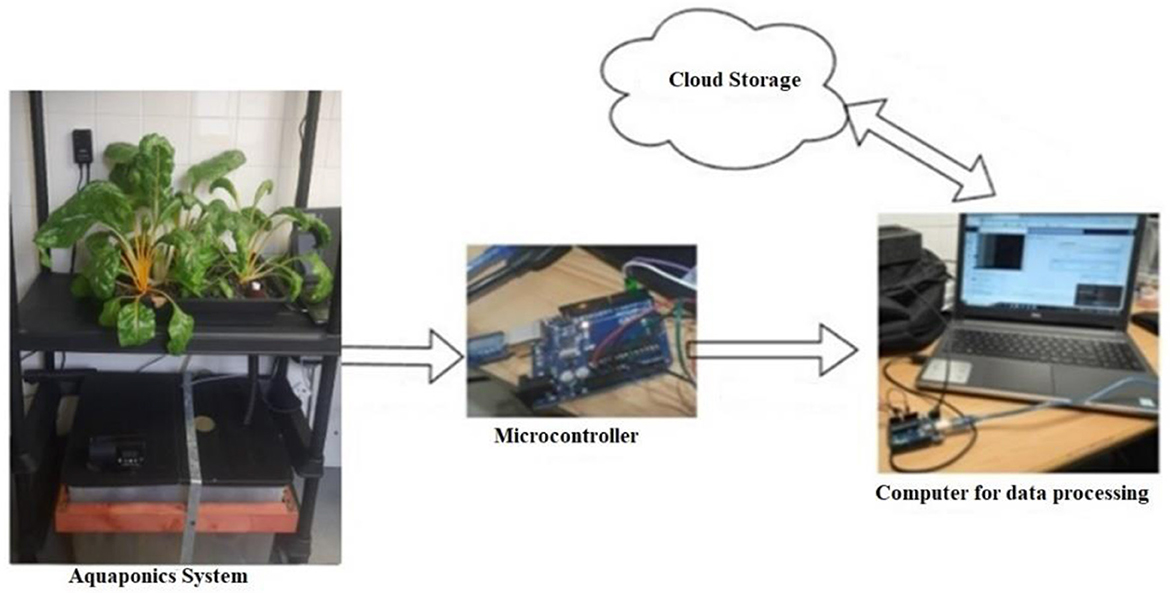
Figure 2. IoT communication system for this project. Sensor data collected is transmitted to a PC through an Arduino UNO microcontroller and is processed in a PC. Data is stored in ThingSpeak cloud and in the PC.
The main sensors used in the aquaponics system include sensors for: water temperature (DFROBOT DS18B20 digital), water pH (DFROBOT Gravity Analog-SEN0161), water turbidity (DFROBOT Analog), dissolved oxygen (DFROBOT Analog DO), total dissolved solids (DFROBOT Analog TDS), CO2 (DFROBOT Infrared). These sensors were connected to the fish water tank for data collection. The sensors were attached to the Arduino UNO Microcontroller and an ESP8266 Wi-Fi module which is connected to a standard PC. The data collection, analysis, and processing were done on the local computer. All these sensors and IoT were operated on the USB power from the connected PC. Ammonium strips were used to collect the Nitrate and Nitrite values. The DO and pH sensors were calibrated at 25°C before use. Calibrating solutions were used according to the manufacturer's specifications. All sensors were from DFRobot Gravity manufacturer (www.dfrobot.com). ESP 8266 module was used to send the sensor data directly to the cloud server (www.thingSpeak.com). The sensor data was also downloaded locally to the computer as a backup plan. Figure 2 shows the IoT communication setup.
The replenishment was done once every 7 days. The 7-day interval was planned to ensure that any fluctuation in water quality parameters due to precedent water replenishment has faded out and the equilibrium is reached before a new replenishment has been applied. Water replenishment was planned with 6%,10%,14%,18%, and 22% of the total volume of the fish water, which is 100 L in the current study. The selection of this replenishment range was based on the literature and consultation with aquaponics farmers, based in Ipswich (www.aquapona.com) and Chester (www.urbanag.uk) in England. Also, preliminary experimentations with 5% replenishment showed little or no changes in the water quality. Too much water replenishment can be detrimental to the system (Bich et al., 2020). Water quality data such as pH, DO, TAN, nitrites, nitrates, carbonate root, free chlorine, water hardness, electrical conductivity, total dissolved solids, and water temperature were collected every 7 days. Environmental parameters such as humidity, room temperature, and CO2 values were also recorded. Three sets of water quality data were collected during the experimentation. In dataset 1, the water quality data was collected from the freshwater to be used for replenishment, and dataset 2 was collected from the fish water before its replenishment. Dataset 3 was collected from fish water after the replenishment was completed. Water replenishment was repeated, and data was collected once every 7 days. Fresh water was used from the same source during the entire experiment. Freshwater was pre-processed and dechlorinated to ensure safe use for the fish. Figure 3 shows images of the testbed and the data collection process.
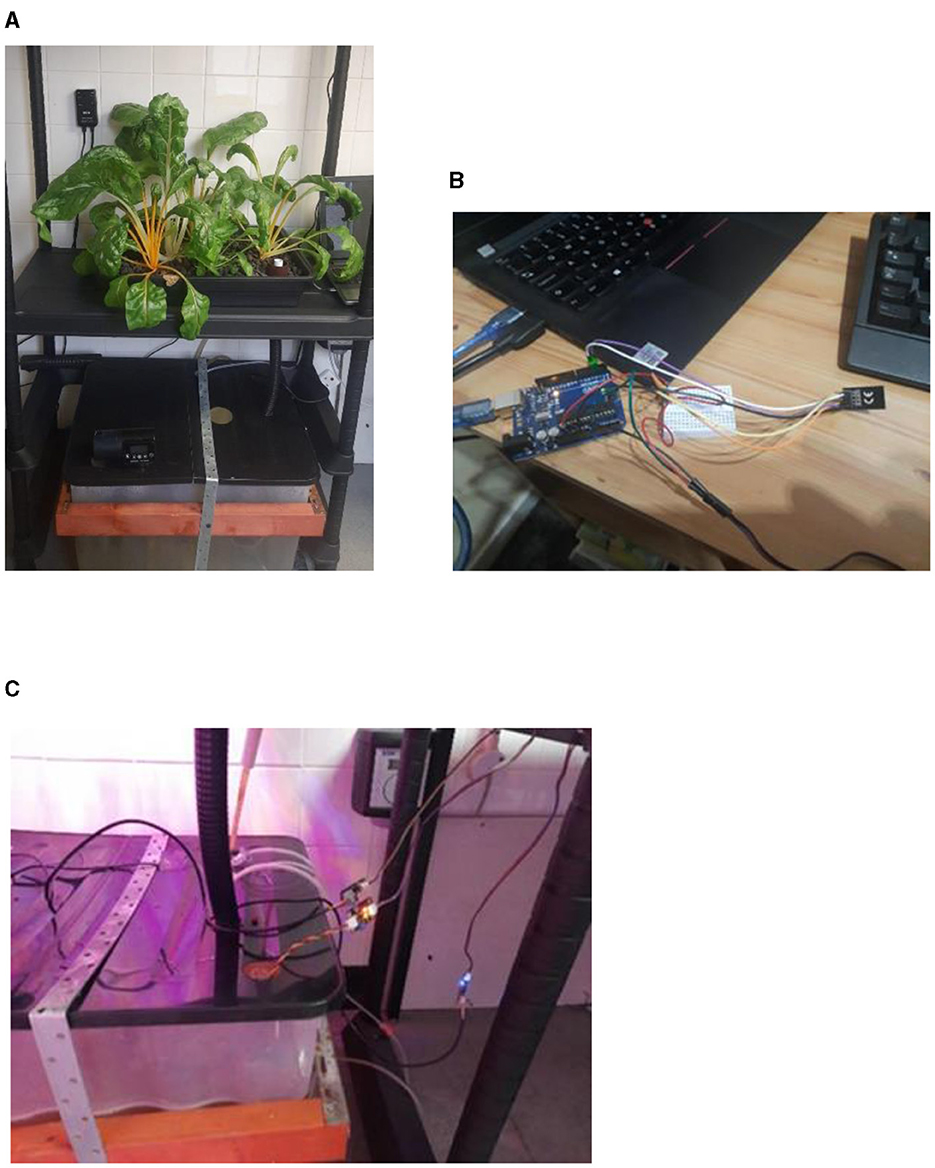
Figure 3. (A) Aquaponic testbed. (B) During data collection. (C) Sensors collecting water data.
Figure 4 is a schematic diagram of the data processing. This includes data preparation, data analysis, and data validation. Data preparation comprised data collection and outlier analysis as part of data refinement. Data normalization, correlation and regression analysis form part of the data analysis step. The results were then evaluated and compared using statistical error estimation approaches in Python.
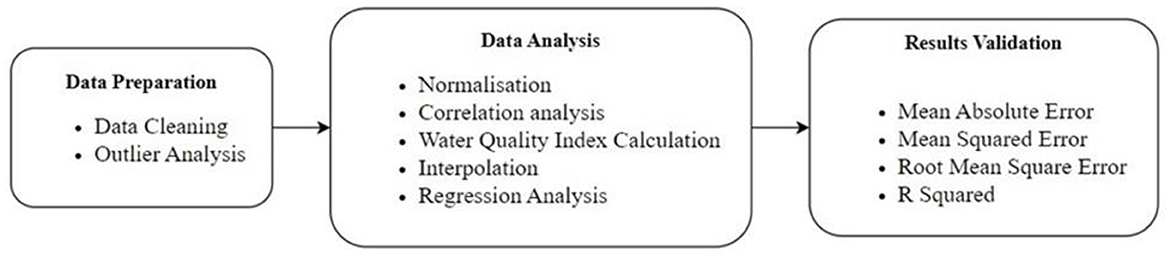
Figure 4. Schematic diagram of data preparation, analysis, and results validation.
The data collected for the optimal replenishment rate calculation was done from June 2022 to June 2023. More than 1,800 data were collected for processing, including the 11 water quality values and environmental parameters.
The z-score method was used to detect outliers of the data values and the boxplot was used to visualize the analyzed results. Boxplot analysis showed the values deemed as outliers. For example, the threshold value of turbidity was 0.3 and some outliers were detected as 5, which was far different from the normal threshold. The outlier values of 5 were replaced with a threshold value of 0.3. It identified that the wrong value of 5 has been sensed by the sensor probably due to foam in the water surface affecting the turbidity sensor reading. The same approach was used for all other parameter values to clean data before the analysis.
The optimal rate of freshwater replenishment determination requires the calculation of the water quality value of the fish tank at different levels or percentages of water replenishment. A water quality index is a significant numerical value that represents the total water quality. The water quality index (WQI) model is a well-recognized tool for water quality evaluation especially in many fields based on local water quality criteria and has been used since its development in the 1960s (Uddin et al., 2021). WQI models generally consist of four consecutive stages: (1) selection of the water quality parameters, (2) generation of sub-indices for each parameter (3) calculation of the parameter weighting values, and (4) aggregation of sub-indices to compute the overall water quality index. The optimal water replenishment rate can then be obtained by applying the machine learning algorithms between different replenishment rates and corresponding water quality indices to generate a singular quality value that represents the overall fish water quality. The water quality index can be calculated using Equation (1) (Ahmed et al., 2019; Srivastava and Kumar, 2023; Water Quality Indices, 2023).
Where Qvalue is the quality value corresponding to the water quality parameter and β is the Weighting factors of different water parameters as shown in Table 2 (Ahmed et al., 2019; Srivastava and Kumar, 2023; Water Quality Indices, 2023).
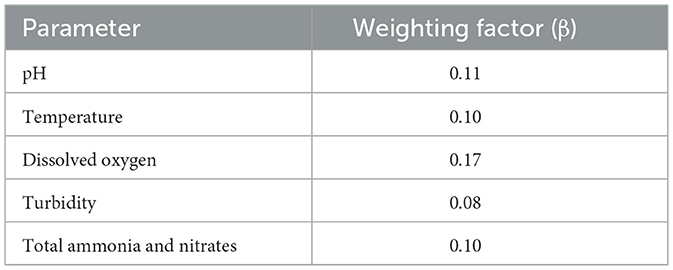
Table 2. Parameters and weighting factors to calculate quality index.
Figure 5 shows a correlation between Qvalue and parameters such as pH, Dissolved Oxygen, Total Ammonia and Nitrogen (TAN), Temperature change, and Turbidity which uses the optimal water quality parameters ranges as discussed in Table 1, and quality indices are generated according to Equation (1) (Ahmed et al., 2019; Srivastava and Kumar, 2023; Water Quality Indices, 2023).
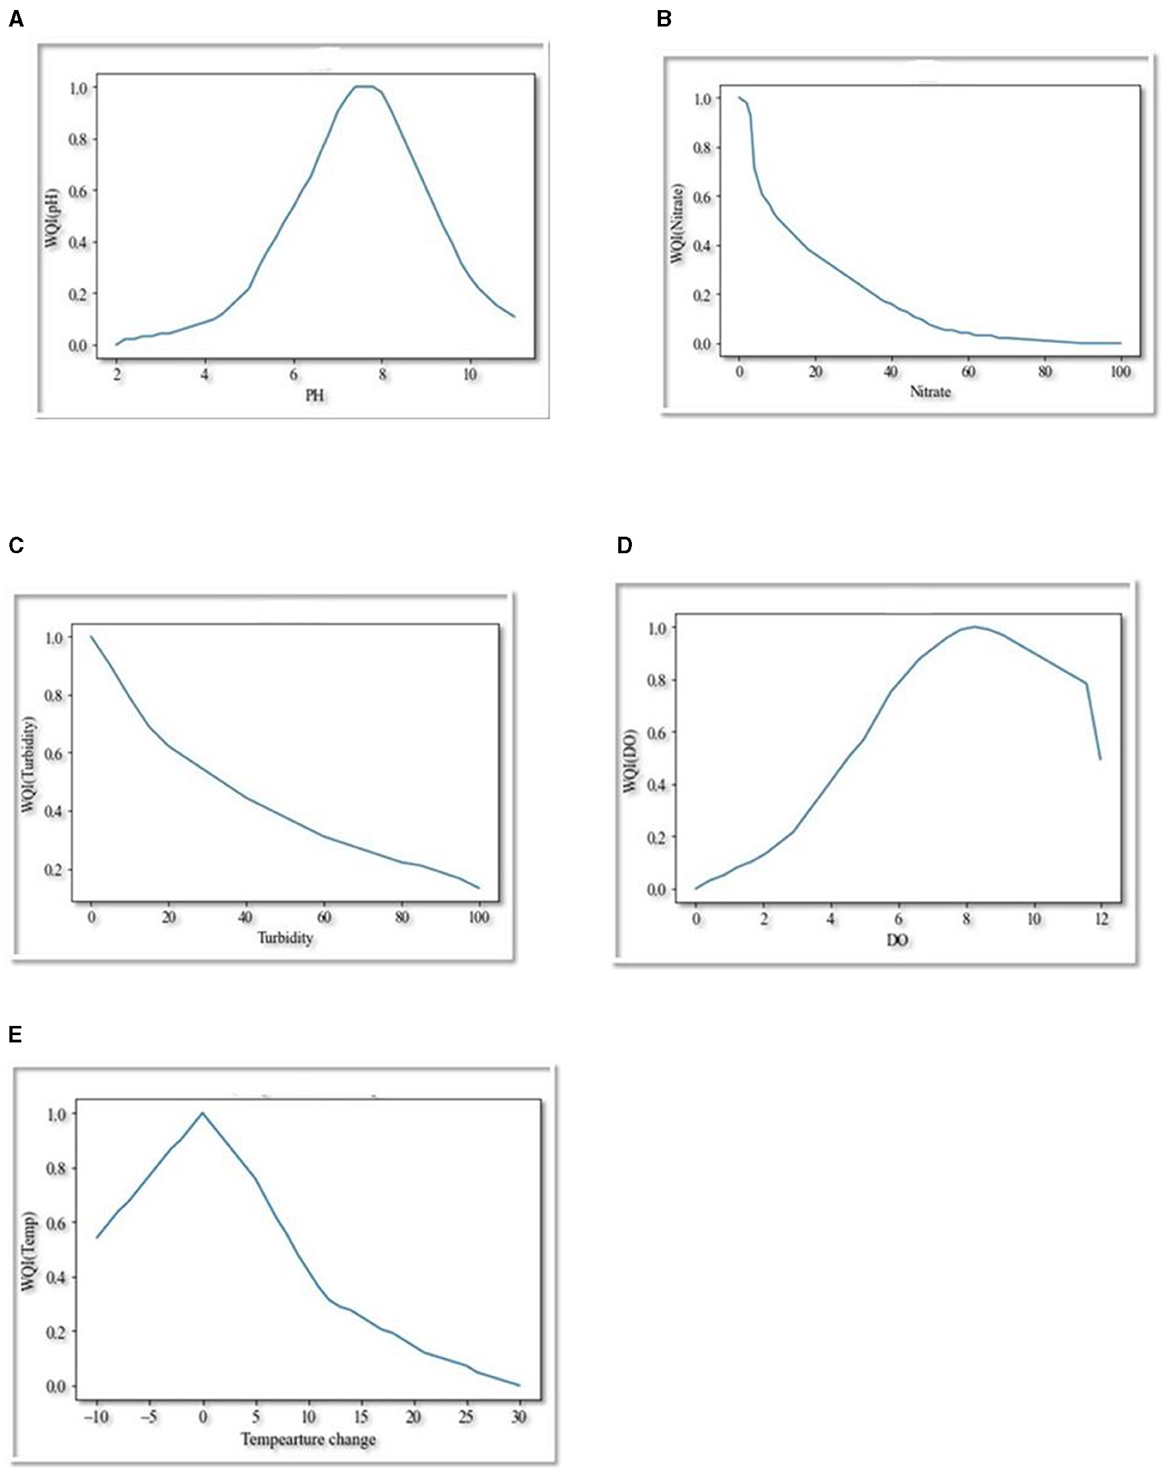
Figure 5. Graphs representing the correlation between water quality values and (A) pH, (B) Nitrate, (C) Turbidity, (D) Dissolved Oxygen, and (E) Temperature Change. Graphs represent water quality indices of these parameters within a given range. In all graphs, the X-axis gives the water parameter, and the Y-axis is the corresponding quality index.
Once the water quality index has been calculated for a set of data values of a particular parameter, the resulting WQIs are normalized using Min-Max normalization. This normalization approach standardizes the values using Equation (2).
Where Xscaled is the normalized value, Xmin is the minimum value in the list and Xmax is the maximum value in the list. Min-max normalization was applied to all quality indices calculated for all water quality parameters so that all WQIs were standardized to a value between 0 and 1. That means the lowest quality index will be 0 and the highest index will be 1. For example, if the pH value read from the sensor is 4.2, then, the corresponding Qvalue will be multiplied by the pH weighting factor 0.11 to get a WQI of 1.21 for the sensor read pH of 4.2. The minimum WQI and maximum WQI were determined when all WQIs were calculated. In the sample data, the minimum WQI is 0 and the maximum WQI is 10.12. Therefore, for the pH parameter,
which is the normalized WQI for pH 4.2. This calculation was applied to all the collected data. Finally, all the collected data were used to determine the corresponding WQI using Equation (1) and normalized using Equation (2).
The obtained values of WQIs for different replenishment rates from 6% to 22 % were used to predict the WQIs and missing replenishment rates. That is, WQIs were measured for 6,10,14,18, and 22L multiple times, and resulting data was used to determine WQIs for 7,8,9,11,12,13,15,17,19,20, and 21L.
Water temperature, pH, Dissolved Oxygen, TDS, and CO2 data were chosen to perform the correlation analysis using Python.
The water quality index of a particular water replenishment rate was calculated by adding up the individual WQIs of the five parameters such as Turbidity, temperature, DO, pH and TAN using Equation (1) to get an aggregate WQI out of five parameters using the Equation (3).
where α is the Water Quality Index (WQI).
For example, when 6% of the total fish water was used, that is 6 L was replaced with 6 L of fresh water, and the parameter readings were taken before and after the replenishment, WQI of 6% was calculated using Equation (3). The process is repeated for 10%,14% 18%, and 22%. The replenishments and WQI calculations were done every week. The impact of replenishment on the water quality parameters was analyzed before the next replenishment was done, ensuring that previous replenishment had not influenced the water quality measures.
The sensor data analysis showed that there was no considerable change in TDS and CO2 values with respect to the water replenishment. Therefore, TDS was not considered for the WQI calculation.
Three standard regression models such as polynomial regression, multiple linear regression, Ridge regression and three ensemble approaches, decision tree regression, random forest regression, and gradient boosting were chosen for regression analysis. While standard models give predictions with a single estimator, ensemble models combine mutiple estimators to perform predictions. Ensemble models were included to avoid any potential bias, low accuracy or high variance in standard models. The literature suggests that the chosen models are the best for water quality predictions (Ahmed et al., 2019). Machine learning algorithm-based regression analysis was applied to the entire data set to find out the optimal freshwater replenishment rate that gives the best water quality index. Standard regressions such as polynomial regression, multiple linear regression, Ridge regression, and Ensemble methods such as Decision Tree regression, Random Forest regression, and Gradient boosting were selected to perform regression analysis. Linear regression shows the linear relationship between between input values and output values. Random forest is a decision-tree-based approach that uses the subset of a given data set to make decisions. Gradient boosting is an efficient optimization approach that uses a stage-wise boosting method to optimize a differentiable loss function (Ahmed et al., 2019; Water Quality Indices, 2023).
Python was used to perform the regression analysis, plotting resultant graphs, and evaluation of the results. Sklearn library was used to implement the regressions in the code. A learning rate of 0.1 was used for Gradient boosting and polynomial of degree 2 was applied for polynomial regression. The algorithm received the input as a CSV file that contains quality values and percentages. First, the raw data without interpolation was input. Then the interpolated data was input to the algorithm and finally, simulated data was given as input. Regressions were applied in these three results with error estimations. Mean Square Estimations (MSE), Mean Absolute Estimation (MAE), Random mean square estimations (RMVE), and R2 estimations were used for validations.
The Water Quality Index was generated using Equation (3) for every replenishment as described in the method section. WQI represented the quality of water for each replenishment. Data was plotted and it was decided to apply standard as well as ensemble regressions. Cubic spline as well as Lagrange interpolation and regressions were applied to the correlation between WQI, and the corresponding replenishment rate. Results were obtained based on the optimized quality for a given replenishment.
Table 3 shows the correlation between different water quality parameters investigated. A correlation of 1 in the table shows the strongest correlation and 0 is assumed to be the weakest correlation. A positive turbidity correlation was observed between water and temperature whereas a negative correlation was observed between turbidity, DO, CO2, and pH. Temperature positively correlated with TDS and CO2 while negatively correlated with DO and pH. TDS positively correlates with turbidity and temperature while negatively correlates with DO and CO2. DO negatively correlated with all other parameters CO2 positively correlated with temperature and pH while negatively correlated with turbidity, TDS, and DO. pH positively correlated with TDS and CO2 while negatively correlated with turbidity, temperature, and DO.
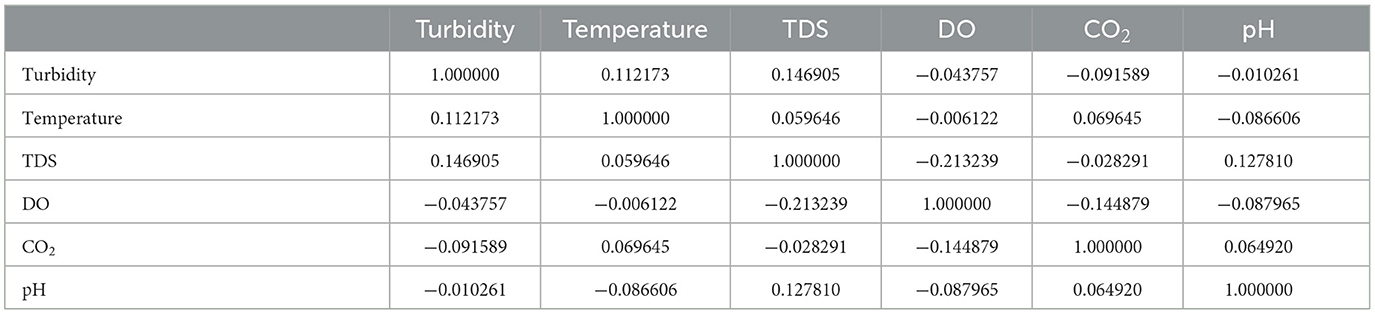
Table 3. Correlation matrix of water quality parameters.
Figure 6 shows the interpolation results with the raw data, means values, Cubic spline and Lagrange interpolation curves, simulated data, and the correlation between variance in quality values with percentage of water replenishment. These results were obtained from data that were sorted according to the percentage values. Then the means and variances were calculated for quality parameter values (Sallenave, 2022) before applying the interpolation between 0 and 23 values since the data ranges from 5 to 22. The interpolation intervals were set as 1 and 10 simulated quality values were generated for each percentage value from 5 to 22. The algorithm generated the sorted simulated data for the corresponding raw. Both interpolations showed that the variance in quality tends to decline as the percentage of replenishment values increases.
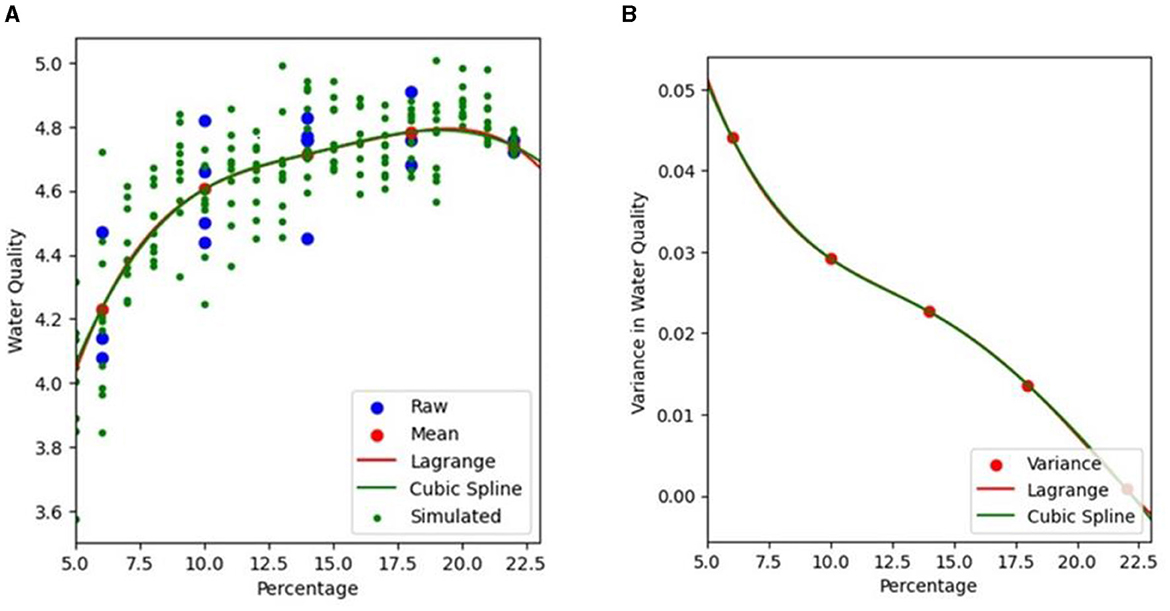
Figure 6. Water quality as a function of percentage of water replenishment. (A) Cubic spline and Lagrange interpolation were applied to Raw and Simulated data. (B) Variance declines for both interpolations. Interpolation details and data chosen are also shown inside the graphs.
Figure 7 shows a plot of various regressions applied to the data. Ahmed et al. (2019) used various regression models to find out water quality indices and Gradient Boost with a learning rate of 0.1 and polynomial regression with a degree of two appeared to be the best machine learning approaches to predict the water quality indices (WQIs). In this research data, regressions performed on raw data showed polynomial regression as the model that gives the best water quality of 4.91 with an optimal water replenishment of 18 liters per week per 100 L aquaponics system. The error estimations were 0.0181 (MSE), 0.1061 (MAE) 0.1346 (RMSE), and 0.6589 (R2 score). When the interpolated data values were given as input, again Polynomial Regression appeared as the best model with the same water quality of 4.91 and optimal water replenishment value of 18 L. The error scores were 0.0109 (MSE), 0.07213 (MAE), 0.1046 (RMSE), and 0.7175 (R2). However, when the simulated data was applied, results showed 19 L as the optimal water replenishment per week. percentage with the best quality of 4.86. Error scores for simulated data were 0.0224 (MSE), 0.1137 (MAE) 0.1499 (RMSE), and 0.7208 (R2). It was evident that the gradient boost regression model generated better results. Table 4 shows the best water quality and water replenishment percentage values and the corresponding error estimates. R2value close to 1 generally shows a better fit of the model to the data. The R2 value from the regression using raw data was 0.6589 which can be inferred as around 65.89% variability observed in the water quality explained by the model R2value for the interpolated data, 0.7175 shows a better fit for the model with 71.75% variability on the replenishment rate. When simulated data is used, a value of 0.7271 was resulted which shows the best fit among all R2values received.
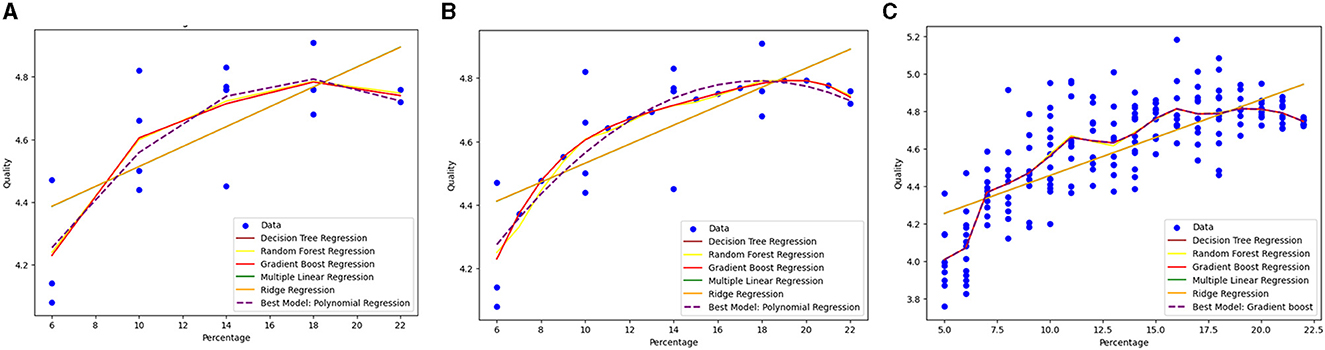
Figure 7. Resultant graph plots of all regressions on (A) raw data (B) interpolated data and (C) simulated data. In all graphs, the x-axis shows the percentage of replenishment, and y-axis has the corresponding water quality. Names of the regressions applied are shown inside the graphs.
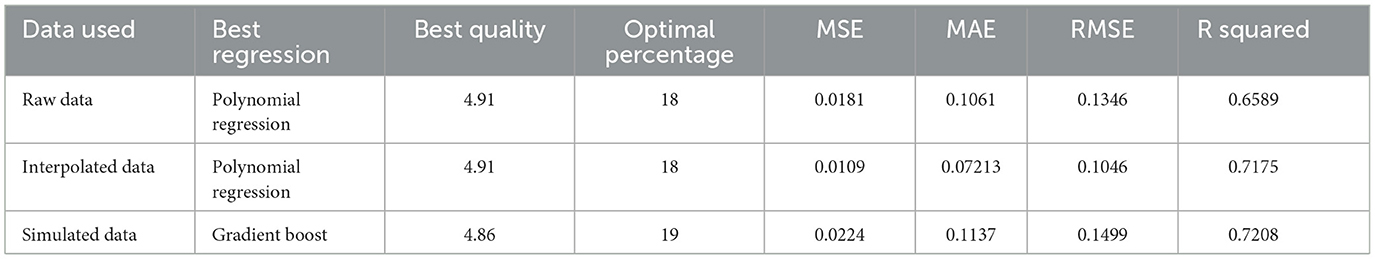
Table 4. Regression results with error estimations.
Results showed that when the raw data, that is the data received from the experimentation directly as well as the interpolated data were used, 18 L was the optimal replenishment rate for a 100 L fish tank with the best water quality of 4.91 obtained from a polynomial regression as the best model. However, when simulation was performed and regression applied to simulated data, the optimal rate changed to 19 L with a best quality of 4.86. The result with simulated data is assumed to be more precise since more data points were generated and hence precision of the result is improved. Nevertheless, the values of the replenishment rate obtained from both models are very close with a difference of 1 L/100 L system which only corresponds to 1% and a 1% error is reasonably acceptable. It should be noted that the results showed exact integer values of replenishment rates such as 18 or 19 because the algorithm was designed to perform with an interval of 1 in the x-axis values, which represents the replenishment rates. This decision was made as variations of less than a percentage point would not have an impact on the water quality maintenance. Moreover, During the experimentation, the change in water quality parameter values was recorded before and after every replenishment and the change x was non-linear. That is, x and corresponding WQIs have shown different values for the same replenishment rate which was repeated. Hence, it was decided to use machine learning to find out the optimal replenishment rate.
The data and results could be influenced by the number and types of fish and plants grown as well as the environmental conditions. The type of aquaponics used could be another influencing factor in optimal replenishment rate calculation. This project is carried out in a standard indoor coupled aquaponics system within a controlled environment. The results discussed above were generated with the data collected from a specific aquaponics system as described in the method section. However, the outcome of this research may open a new avenue for potential research aspects in aquaponics water replenishment and could inform water quality optimisation of aquaponics systems at an industrial scale. The replenishment rate calculated in the project was sensitive to the aquaponics tank capacity used. This project used a 100 L water tank and optimal rate, and water quality was calculated accordingly. The experimentation was carried out inside a closed room where artificial lighting was provided. Results may have an impact on the room environment, especially when environmental parameters such as humidity, room temperature, and carbon dioxide levels are used in correlation analysis for the water quality index calculation. Artificial light operation timing, water recirculation timing, feed timing, and feed quantity may influence the results obtained. The formula to calculate the water quality index was adapted from a study that computed the water quality index of river water. This might be an influencing factor on the results.
Water quality data of indoor recirculated aquaponics have been collected by sensors and IoT devices. Important water quality parameters were then chosen to estimate the water quality indices corresponding to various rates of water replenishment. Various regression algorithms were applied to determine the optimal replenishment rate that gives the best water quality index as well as the best regression model that was validated using the error estimations for raw data, interpolated data, and simulated data sets. Both polynomial regression and gradient boost models look promising for estimating the optimal replenishment rate and water quality of an aquaponics system. The present study showed an optimal water replenishment value of 18% per week with the best water quality of 4.9 when using raw data and interpolated data whereas the gradient boost model generated an optimal replenishment rate of 19% with the best quality of 4.86 using simulated data. The difference between the simulated and the experimental data is only 1%. Therefore, this paper proposes an innovative way of estimating the optimal replenishment rate and water quality index of aquaponic water using sensors, IoT, and machine learning, avoiding time-consuming laboratory water analysis. Additionally, no chemicals were used to stabilize the pH levels other than adding water to the tank which is an improvement to the conventional approach.
This research could be further expanded by applying the same approach to other types of aquaponics systems including semi-closed, decoupled, or outdoor systems, with different environmental and water conditions to investigate any variability in the optimal water replenishment and their impact on aquaponic water quality and to further validate the proposed method. Different machine learning or deep learning approaches can be applied other than what have been used in this project, to find out if the results are affected. Studies on fish and plant health before and after water replenishment may be further explored.
The raw data supporting the conclusions of this article will be made available by the authors, without undue reservation.
The animal study was approved by Faculty of Science and Engineering Ethics Committee, University of Wolverhampton. The study was conducted in accordance with the local legislation and institutional requirements.
PC: Conceptualization, Data curation, Formal analysis, Investigation, Methodology, Resources, Software, Visualization, Writing—original draft. AG: Supervision, Validation, Writing—review & editing. FT-M: Funding acquisition, Investigation, Project administration, Supervision, Validation, Writing—review & editing.
The author(s) declare financial support was received for the research, authorship, and/or publication of this article. This project has been partially internally funded by the School of Engineering, Computing, and Mathematical Sciences at the University of Wolverhampton and supported by the EU Horizon 2020 MSCA RISE Project ReACTIVE Too, Grant Agreement No 871163.
The authors declare that the research was conducted in the absence of any commercial or financial relationships that could be construed as a potential conflict of interest.
All claims expressed in this article are solely those of the authors and do not necessarily represent those of their affiliated organizations, or those of the publisher, the editors and the reviewers. Any product that may be evaluated in this article, or claim that may be made by its manufacturer, is not guaranteed or endorsed by the publisher.
Ahmed, U., Mumtaz, R., Anwar, H., Shah, A. A., Irfan, R., and García-Nieto, J. (2019). Efficient water quality prediction using supervised machine learning. Water 11:2210. doi: 10.3390/w11112210
Bich, T. T. N., Tri, D. Q., Yi-Ching, C., and Khoa, H. D. (2020). Productivity and economic viability of snakehead Channa striata culture using an aquaponics approach. Aquac. Eng. 89:2020. doi: 10.1016/j.aquaeng.2020.102057
Blanchard, C., Wells, D. E., Pickens, J. M., and Blersch, D. M. (2020). Effect of pH on cucumber growth and nutrient availability in a decoupled aquaponic system with minimal solids removal. Horticulturae 6:10. doi: 10.3390/horticulturae6010010
Delaide, B., Delhaye, G., Dermience, M., Gott, J., Soyeurt, H., and Jijakli, M. H. (2017). Plant and fish production performance, nutrient mass balances, energy and water use of the PAFF Box, a small-scale aquaponic system. Aquac. Eng. 78, 130–139. doi: 10.1016/j.aquaeng.2017.06.002
Ebeling, J. M., and Timmons, M. B. (2007). Recirculating Aquaculture Systems. Available online at: https://www.sidalc.net/search/Record/KOHA-OAI-UAAAN:31728/Description
Gnanasagar, V., Vivek, M., and Rajaraman, J. (2020). Study on control actions in a recirculating aquaponics system. AIP Conf. Proc. 2240:100002. doi: 10.1063/5.0011022
Goddek, S., Joyce, A., and Kotzen, B. M. G. (2019). “Aquaponics food production systems,” in Aquaponics Food Production Systems, 619, 2019.
Graber, A., and Junge, R. (2009). Aquaponic systems: nutrient recycling from fish wastewater by vegetable production. Desalination 246, 147–156. doi: 10.1016/j.desal.2008.03.048
Love, D. C., Uhl, M. S., and Genello, L. (2015). Energy and water use of a small-scale raft aquaponics system in Baltimore, Maryland, United States. Aquac Eng. 68, 19–27. doi: 10.1016/j.aquaeng.2015.07.003
Mori, J., Erickson, K., and Smith, R. L. (2021). Predictive modeling of pH in an aquaponics system using Bayesian and non-Bayesian linear regression to inform system maintenance. ACS Agricult. Sci. Technol. 1, 400–406. doi: 10.1021/acsagscitech.1c00112
Nhan, H. T., Tai, N. T., Liem, P. T., Ut, V. N., and Ako, H. (2019). Effects of different stocking densities on growth performance of Asian swamp eel Monopterus albus, water quality and plant growth of watercress Nasturtium officinale in an aquaponic recirculating system. Aquaculture 503, 96–104. doi: 10.1016/j.aquaculture.2018.12.067
Rakocy, J. E., Bailey, D. S., Shultz, R. C., and Thoman, E. S. (2004). Update On Tilapia And Vegetable Production In The Uvi Aquaponic System. College of Agriculture, Life and Environmental Sciences. Available online at: https://ag.arizona.edu/
Rakocy, J. E., Masser, M. P., and Losordo, T. M. (2022). Recirculating Aquaculture Tank Production Systems: Aquaponics-Integrating Fish and Plant Culture. Available online at: http://osufacts.okstate.edu (accessed April 3, 2022).
Romano, N., Islam, S., and Fischer, H. (2023). Ebb and flow versus constant water level on the sweet banana chili pepper (Capsicum annuum) production in an aquaponic system. Aquac. Eng. 102:102340. doi: 10.1016/j.aquaeng.2023.102340
Sallenave, R. (2022). NMSU: Important Water Quality Parameters in Aquaponics Systems. Available online at: https://aces.nmsu.edu/pubs/_circulars/CR680/welcome.html (accessed March 22, 2022).
Shaw, C., Knopf, K., and Kloas, W. (2022). Fish feeds in aquaponics and beyond: a novel concept to evaluate protein sources in diets for circular multitrophic food production systems. Sustainability 14:4064. doi: 10.3390/su14074064
Srivastava, G., and Kumar, P. (2023). “Water quality index with missing parameters,” in IJRET. Available online at: http://www.ijret.org (accessed June 12, 2023).
Suhl, J., Dannehl, D., Kloas, W., Baganz, D., Jabs, S., Scheibe, G., et al. (2016). Advanced aquaponics: evaluation of intensive tomato production in aquaponics vs. conventional hydroponics. Agric. Water Manag. 178, 335–344. doi: 10.1016/j.agwat.2016.10.013
Uddin, M. G., Nash, S., and Olbert, A. I. (2021). A review of water quality index models and their use for assessing surface water quality. Ecol. Indic 122:107218. doi: 10.1016/j.ecolind.2020.107218
Water Quality Indices (2023). Available online at: https://www.researchgate.net/publication/257650627_Water_Quality_Indices#fullTextFileContent (accessed June 12, 2023).
Keywords: Internet of things (IoT), aquaponics, water quality, water replenishment, machine learning
Citation: Chandramenon P, Gascoyne A and Tchuenbou-Magaia F (2024) IoT and machine learning approach for the determination of optimal freshwater replenishment rate in aquaponics system. Front. Sustain. Resour. Manag. 3:1363914. doi: 10.3389/fsrma.2024.1363914
Received: 15 January 2024; Accepted: 17 April 2024;
Published: 06 May 2024.
Edited by:
Amy Quandt, San Diego State University, United StatesReviewed by:
Ali Sadiq, Nottingham Trent University, United KingdomCopyright © 2024 Chandramenon, Gascoyne and Tchuenbou-Magaia. This is an open-access article distributed under the terms of the Creative Commons Attribution License (CC BY). The use, distribution or reproduction in other forums is permitted, provided the original author(s) and the copyright owner(s) are credited and that the original publication in this journal is cited, in accordance with accepted academic practice. No use, distribution or reproduction is permitted which does not comply with these terms.
*Correspondence: Praveen Chandramenon, cC5jLm1lbm9uQHdsdi5hYy51aw==; Fideline Tchuenbou-Magaia, Zi50Y2h1ZW5ib3UtbWFnYWlhQHdsdi5hYy51aw==
Disclaimer: All claims expressed in this article are solely those of the authors and do not necessarily represent those of their affiliated organizations, or those of the publisher, the editors and the reviewers. Any product that may be evaluated in this article or claim that may be made by its manufacturer is not guaranteed or endorsed by the publisher.
Research integrity at Frontiers
Learn more about the work of our research integrity team to safeguard the quality of each article we publish.