 Pia Geranmayeh
 Amanda Speks2
 Malgorzata Blicharska
 Martyn Futter
 Dennis Collentine
- 1Department of Aquatic Sciences and Assessment, Swedish University of Agricultural Sciences, Uppsala, Sweden
- 2Natural Resources and Sustainable Development, Department of Earth Sciences, Uppsala University, Uppsala, Sweden
In the past 30 years, Swedish EU Rural Development Programme (RDP) financing for constructed wetlands (CWs) had two goals: nutrient reduction and biodiversity conservation. Since 2007, at least 1,718 CWs have been implemented. However, their cost effectiveness has been difficult to assess as defined targets for improvements were lacking. In 2013, Sweden set up regional (county) targets for new CWs to mitigate eutrophication and conserve biodiversity as part of a 6-year plan under the RDP. Here, we investigate if the increase in targeting was effective, in particular if the 15 participating counties achieved their stated goals. We also compare CW characteristics during the regionally targeted period (2014–2020) with the preceding untargeted period (2007–2013). The results indicate that regional targets were not achieved. Most counties set lower targets for biodiversity conservation than for nutrient reduction. Hence, by 2020 more counties exceeded targets for the former than for the latter. Budget share allocated to the two goals was not decisive, instead the outcome could be attributed to prioritization, budget controls, timing consistency, decision criteria consistency and goal setting. During both periods half of the CWs were funded for each purpose, yet the number of wetlands constructed decreased by 82% in the second period. Landowners may have prioritized biodiversity CWs as construction costs were higher for nutrient retention CWs and costs were mostly not fully covered by the RDP. Furthermore, targets were not budget limited, which meant that county-level allocation of funds could be shifted to finance CWs that did not meet the intended purpose. To increase overall measure effectiveness, we suggest that the distribution of national funds for CWs should be divided between the two purposes identified at the regional level and that reallocation of funds only be permitted in accordance with redefinition at the county level.
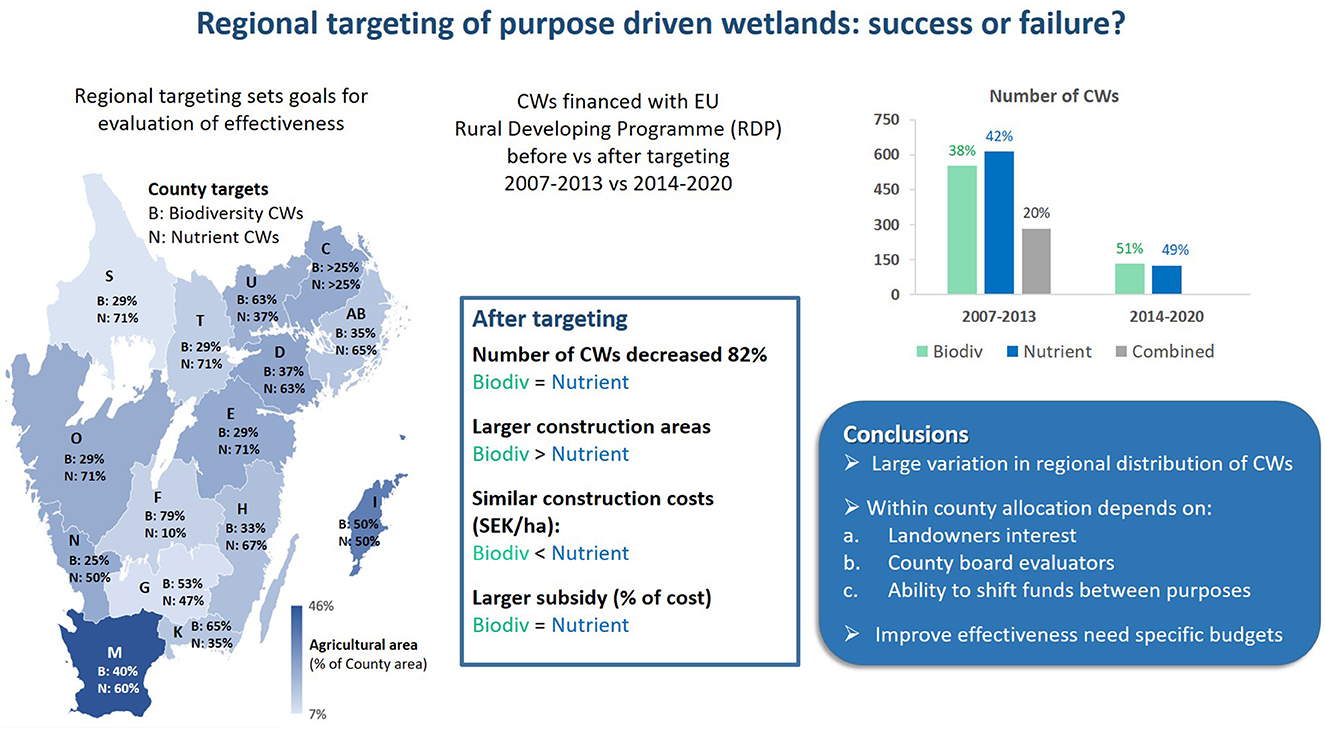
Graphical Abstract. Evaluation of the regional targets set for each wetland purpose (biodiversity or nutrient).
1. Introduction
Wetlands are an important part of the Swedish rural landscape. They provide many environmental services including nutrient capture, enhancement of biodiversity, and hydraulic buffering. However, wetland area was extensively reduced throughout the 20th century to enhance agricultural and forest production. In the past 30 years, the Swedish government has supported the creation of constructed wetlands (CWs), as an agri-environmental measure (AEM) to compensate for the loss of natural wetlands. The new CWs have several purposes. In the 1990s when active support began, the two primary purpose was to reduce nitrogen (N) loads from agricultural areas to the Baltic Sea and to increase biodiversity (Graversgaard et al., 2021). Later the focus was expanded to include reducing agricultural phosphorus (P) losses and to enhancing aquatic environments in general.
Depending on their primary purpose, CWs can look different from each other. Effective N reducing CWs are usually large open ponds with varying amounts of emergent vegetation located in agricultural areas with sufficient hydraulic and N loads (Djodjic et al., 2022). CWs designed to promote P trapping should receive a high P load. Since 2010, CWs for P retention have typically been designed to route influent water into an initial open pond followed by a shallow area with emergent vegetation. CWs to support biodiversity are usually large and can be located anywhere in a catchment.
In Sweden, the decision to construct a wetland is ultimately up to the landowner. Landowners include individuals, corporations, municipalities and other actors (Andersson, 2012). The large financial investment is one of the main factors influencing landowners' willingness to construct wetlands (Franzén et al., 2016) and a lack in continuity of financial support is seen as an important barrier (Geranmayeh et al., under revision). Landowners' willingness is positively impacted by ecosystem management cooperation, support from regulatory authorities and policy design (Blicharska and Rönnbäck, 2018). However, farmers most often associate wetland construction with negative impacts on farming operations, due to land management changes (Hansson and Kokko, 2018).
The Swedish government has used financial support to landowners to encourage wetland construction through the European Rural Development Programme (RDP), Local Water Preservation Grant (LOVA) and Local Initiative for Nature Conservation (LONA). Both LOVA and LONA are directly financed by the Swedish state, while the RDP is up to 50% financed by the European Union (EU). Each EU state has the power to adapt and direct support to correspond with national priorities and needs (Andersson, 2012). The RDP covers up to 100% of the total cost for CWs, while both LOVA and LONA cover up to 90% of the total cost.
The RDP aims and targets of support for all purposes are evaluated and set for multi-year periods. After joining the EU in 1995, Sweden has been included in four of these periods: 1995–1999, 2000–2006, 2007–2013, and 2014–2020. In Sweden, the RDP is the most important source of financing CWs. For example, between 2011–2020, around 95% of all CWs were financed through the RDP (Speks, 2021). EU-mandated evaluations of the effectiveness of Swedish RDP support for CWs in the three most recent periods concluded that although the area of new wetlands increased, the increase was less than the expected areal goals (Andersson et al., 2009; Smith et al., 2016; Grigoryan, 2019). More importantly, these and other evaluations suggested that the cost effectiveness of the RDP CWs could be vastly improved through better targeting of areas for implementation and by being more purpose driven (Weisner et al., 2015, 2016; Bång et al., 2019; Djodjic et al., 2020; Graversgaard et al., 2021).
There is considerable international interest in improving AEM cost effectiveness and cost efficiency through targeting. The overall goal of targeting is to focus on the cost of implementation relative to the effect of a measure. This can lead to both greater cost efficiency and cost effectiveness. These two terms are related and often used interchangeably, leading sometimes to confusion. Cost effectiveness is the cost per unit of the targeted effect. A particular measure is more cost effective or less cost effective only relative to other measures. For example, construction of wetlands to reduce N losses from farming activities to receiving waters (the target) can be compared to other measures (e.g., cover crops) to reduce N losses from farming activities. The cost effectiveness of any two measures can be compared on different scales and potentially lead to different results. In the aggregate, CWs in Sweden have been shown to be more cost effective then cover crops (Mårtensson et al., 2020) but at a very local scale a particular wetland due to its design or placement may not be as cost effective as cover crops in the same area. In addition, the cost effectiveness of individual wetlands (proposed or implemented) can be compared, with the result that one wetland may be more cost effective than another. Cost efficiency is achieved when the resources used (quantified as costs) for a particular measure cannot be allocated in any other way and achieve a greater effect at the same place. In the work that follows we have chosen to focus on cost efficiency, i.e., the efficient allocation of resources to achieve a particular target.
In a communication on development of the new Common Agricultural Policy (CAP), EC (2017) 713 “The Future of Food and Farming”, the European Commission wrote that Member States should define quantified targets to ensure that environmental objectives agreed on are reached and that there should be flexibility in formulation of strategic plans to meet these objectives. Targeting locations where AEMs are implemented fills both of these criteria. The search for policy designs to incorporate targeting has led to a number of suggestions. Primarily, these have focused on either adjusting payments to landowners/managers or identifying factors which will contribute most to the desired environmental improvement and awarding premiums accordingly. The former led to interest in various types of payment mechanisms, such as reverse auctions, while the latter led to more explicit definition of conditions which encourage program participation, including decentralizing the policy decision process to lower administrative levels.
In spite of the interest within the EU with respect to improving the effectiveness of AEMs, there have been relatively few studies on administrative decentralization. Beckmann et al. (2009) performed a literature review and expert survey on AEM implementation which included a focus on how decentralization impacts measure efficiency and effectiveness. One of their insights was that although there is a resistance to change from agricultural administrators and farmer associations, it is possible for improvements (increased decentralization) to be made within existing administrative structures. Analyzing semi-structured interviews with institutional stakeholders, Yang et al. (2015) concluded that the rigidity of centralized RDP policy restricted local actors' ability to prioritize local needs. Bareille and Zavalloni (2017) developed and applied a model to explore how AEM decentralization would affect the provision of public goods. They found that while the returns for decentralizing payments for AEMs from central to regional government led to a decrease in the total amount of land used for AEMs, it did lead to the inclusion of higher value land and higher benefits to society. While there are other studies exploring effects of decentralization on AEMs, they focus primarily on local stakeholder involvement rather than a lower level of administration (e.g., Leventon et al., 2019; Schomers et al., 2021). Changes to the guidelines for CW implementation in Sweden within the RDP in the period from 2014–2020 brought in a higher level of decentralization with respect to determining local priorities, i.e., targeting.
Initially, participation in the Swedish RDP program for CWs was limited to previously defined nitrogen sensitive areas (NSAs) following established EU guidelines. The NSAs were broadly geographically defined and included large areas of Southern Sweden without regard to political boundaries. As the RDP expanded beyond a focus on N reduction to also include P retention and enhanced biodiversity, the geographical area of eligibility also expanded and currently includes all of Sweden. Up until the most recent program period (2014–2020), the separation by purpose between CWs intended for nutrient reduction and those with a focus on improved biodiversity was primarily left up to county-level administrators. RDP funds were allocated to county boards by the national program administrator, the Swedish Board of Agriculture. At the county level, applications submitted by landowners were evaluated and approved when basic general criteria were met and funds were available. There were no county-level targets set for the share of funds which would support nutrient reduction and the share that would support biodiversity. Funds could be used for either purpose as long as they were available. In addition, while county level authorities used informed judgement in their evaluation of applications, no metrics were available to evaluate expected effectiveness for either purpose (Grigoryan, 2019). As described above, evaluations concluded that there was still considerable room for improving program effectiveness through supporting purpose driven CW location and design (Andersson et al., 2009; Smith et al., 2016). This led to changes in the RDP policy for financing CWs.
In the Swedish 2014–2020 RDP, each county board had to propose targets for the budget share supporting CWs for nutrient reduction and the share supporting CWs for biodiversity. Proposing regionally determined budget shares would lead to assigning regional priorities for the two general CW purposes. Each county would identify targets for providing support for CWs based on the estimated regional conditions and needs. Coupling a budget share to a regionally defined target would improve cost efficiency and as a result also be expected to lead to greater cost effectiveness. The aim of this study is to investigate the result of this increase in targeting and its effect on construction of purpose driven wetlands. For the analysis, targets set by individual counties are compared with the construction of RDP-supported CWs in each county. In addition, wetland characteristics (including primary purpose, number, size and cost) are compared for wetlands constructed with RDP financing for the period from 2007–2013 with those for the immediately following period from 2014–2020 when regional (county level) targets were included for the first time. If targets were met then it may be assumed that there was greater environmental improvement, and as a result a higher degree of cost efficiency from the targeting.
2. Materials and methods
2.1. Data collection
Data on wetlands financed by the RDP during the last two program periods 2007–2013 and 2014–2020 was obtained in spring 2021 from the Swedish Board of Agriculture. These two periods are referred to as “earlier” and “later.” The data included both constructed and restored wetlands; data for 389 restored wetlands were excluded since our aim was to only look into CWs. Data for the earlier period categorized activities as “construction of wetlands,” “restoration of wetlands,” or “construction and restoration of wetlands.” Since the third category is broader than our focus on wetland construction, this category was not included in the study. The number of categories increased to six in the later program period: “restoration of wetlands,” “restoration of dams which collect phosphorus,” “restoration,” “construction of wetlands,” “construction of dams which collect phosphorus,” and “construction,” making it easier to exclude all wetland restoration activities. The remaining data consisted of 1,714 CW projects (82%) out of the original 2,103 projects.
The data received included county, project cost, construction area and amount covered by the RDP. “Construction area” is the land area in hectares (ha) affected by construction of the wetland, hence it is larger than the wetland water surface area.
2.2. Financing CWs
The original data reported project costs and not the costs of individual wetlands. Multiple wetlands were included in some projects, but only data on total project costs and amount financed by the RDP were available. When a project included multiple CWs, individual wetland costs were calculated by pro-rating individual wetland construction area by the total project area and multiplying by the total project cost. The construction cost per hectare wetland area in Swedish crowns (10 SEK ≈ 1€) was estimated by dividing the total wetland cost by the total wetland construction area.
The total budget for environmental investments and for wetland restoration and construction in the RDP was distributed by the Swedish Board of Agriculture in the following manner: 10% of the budget was divided to all 21 counties as a base amount, then 45% was divided by the share of agricultural land per county and the remaining 45% by the share of arable land in nitrate sensitive areas (NSA). The share of the total budget that was distributed to each county was estimated with the following equation:
In this study we only included the 15 southern counties (identified by letters, see Figure 2), as only one of the six northern counties had any arable land in NSA (1.2%). The 15 counties accounted for >90 % of the RDP budget, i.e., 38 billion SEK for the earlier period and 37 billion SEK for the later period.
2.3. Calculating targets
The targets for wetland construction in each county were collected from county Regional Action Plans set before the 2014–2020 RDP (Länsstyrelsen Jönköping, 2016; Länsstyrelsen Värmland, 2016; Länsstyrelsen Västmanland, 2017; Länsstyrelsen Kalmar, 2018; Länsstyrelsen Kronoberg, 2018; Länsstyrelsen Örebro, 2018; Länsstyrelsen Skåne, 2018; Länsstyrelsen Östergötland, 2019, 2020; Länsstyrelsen Södermanland, 2019; Länsstyrelsen Stockholm, 2019; Länsstyrelsen Blekinge, 2020; Länsstyrelsen Gotland, 2020; Länsstyrelsen Halland, 2020). In these Action Plans, an indication of how the budget should be distributed was given through stating the share allocated to:
• Constructing and restoring wetlands and ponds for the purpose of biodiversity.
• Constructing and restoring wetlands and ponds for the purpose of increased water quality.
• Environmental investments for increased water quality.
• Constructing two-stage ditches.
Only the targets directed at CWs were included in this study and new percentages were calculated from these two targets. These indicated the share of nutrient reduction CWs and biodiversity CWs that the county aimed to implement. In some cases, Regional Action Plans did not provide hard targets. For example, in County C, the Regional Action Plan stated that “at least 25% of the budget” should be allocated to each wetland purpose. County C was therefore listed with >25%, as they did not provide a detailed percentage.
2.4. Data analyses & statistics
Analysis of variance (Tukey's pairwise comparison method) were used to determine if there was a significant difference between average construction areas (ha) for the main purpose groups (biodiversity, nutrient reduction and combined biodiversity and nutrient reduction). The one-sample Kolmogorov–Smirnov test was used to test the null hypothesis that data came from a standard normal distribution. For all analyses a nominal significance level of 0.05 was used. Minitab 19 was used for all statistical analyses.
3. Results
3.1. National wetland construction RDP 2007–2020
During 2007–2020 the RDP financed 1,714 CWs, yet there was a large difference between the two periods, as only 15% of the CWs were implemented during the later period (Figure 1), corresponding to 25% of the total 4,803 ha wetland construction area. The total cost for constructing these wetlands was approximately 580 million SEK and the RDP financed 430 million SEK of that cost (74%). Payments from the RDP were higher during 2007–2013 (313 million SEK) compared to 117 million SEK in 2014–2020. These payments correspond to approximately 0.8 and 0.3% of the overall RDP budget in the earlier and later periods respectively.
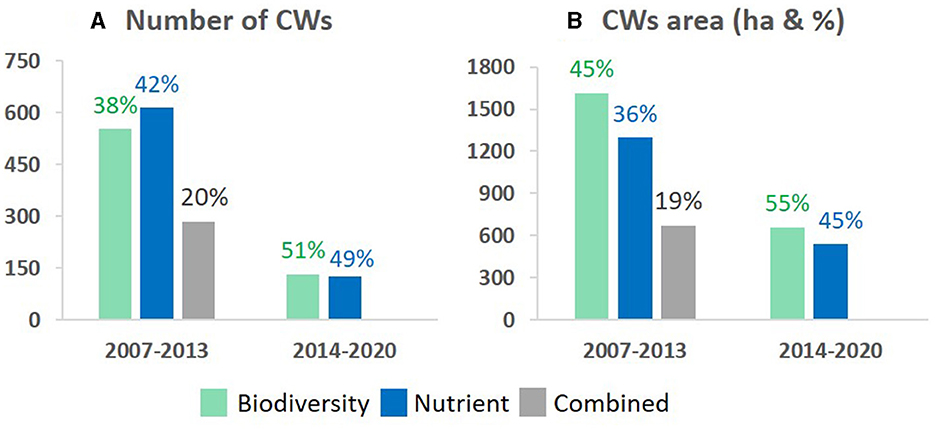
Figure 1. (A) Number of constructed wetlands (CWs) (% of total) and (B) construction area (ha and % of total area) with the main purpose of retaining nutrients (blue), increasing biodiversity (green) or a combined purpose (gray) financed by the Rural Development Programme (RDP) during 2007–2013 and 2014–2020.
3.2. Regional distribution of CWs RDP 2007–2020
There were large regional differences in wetland construction financed by the RDP. The greatest differences were found along the southern coasts, though this varied between the two periods (Figure 2). In the earlier RDP period, County M constructed 32% of all the wetlands using RDP financing, followed by 14% in County O and 10% in Counties N and H. The difference was even higher for the constructed wetland area, as during 2007–2013 County M implemented 41% of the total area. In the later (2014–2020) period, this decreased to 11% of the total number and 17% of the total area in County M. In contrast, the wetland area doubled to 16% in County O, while the number of wetlands was about the same (14 and 15%). In County D, both number and area increased from 2 to 8% and from 4 to 11% respectively.
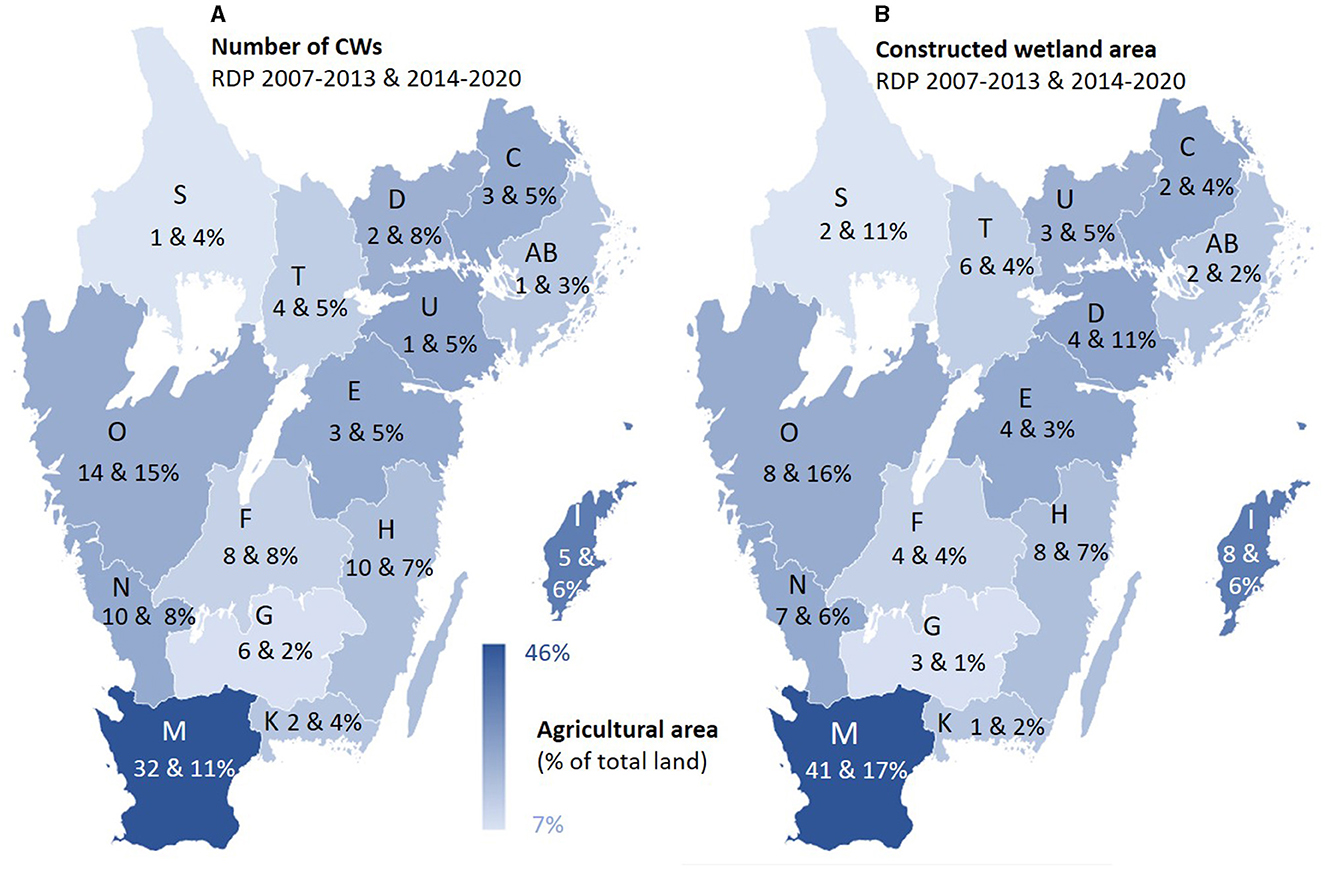
Figure 2. Maps of southern Sweden divided into Counties (letter) showing the share of agricultural area of the County (blue scale), (A) share of number and (B) area of constructed wetlands financed with the RDP period 2007–2013 and 2014–2020.
3.3. County targets in RDP 2014–2020
For the later RDP program period, regional Action Plan Targets were set, i.e., what share of the total budget was to be allocated for improved water quality, two-stage ditches and wetland restoration and construction with main purposes of increasing biodiversity and nutrient reduction. As we only have data on CWs, targets for the two wetland purposes were estimated as a share of the wetland budget for each county (Figure 3). Most counties (9 of 15) targeted larger budget shares for nutrient CWs ranging between 60 and 71%, with the highest values in Counties E, O, S and T. The lowest nutrient target (11%) was set in County F, which is much less than the 35 and 37% set in Counties K and U. County C only set a target of at least 25% for both purposes, and therefore could reach the targets for both purposes. County F, with the lowest nutrient target, also reached both targets. Furthermore, in four of the 15 counties the difference between the target and those implemented was more than 10% for biodiversity CWs (Counties E, I, O, and T), while in three cases (Counties AB, H, and M) the target for nutrient CWs was exceeded by more than 10%.
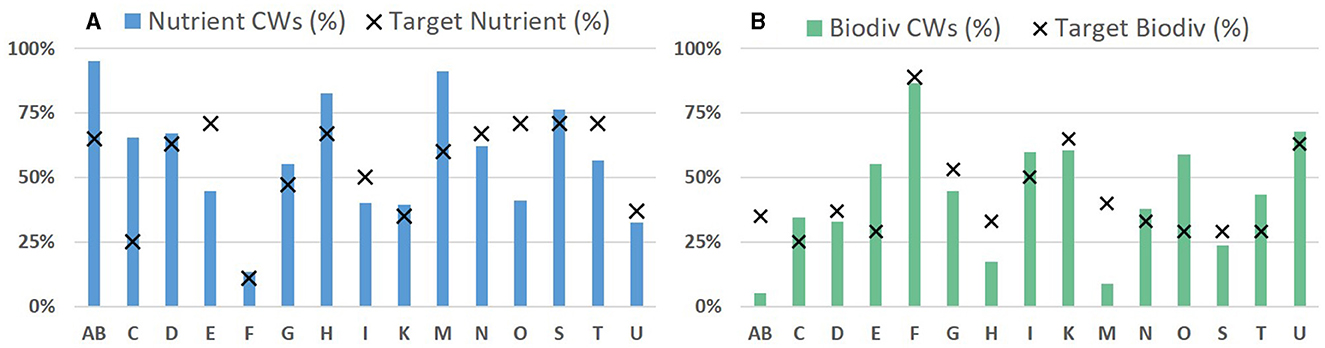
Figure 3. County targets (crosses) as the share of each county's (letters) wetland budget with the main purpose (A) nutrient reduction and (B) biodiversity set before the last Rural Development Programme (RDP) program period 2014–2020. The share of RDP payment for CWs implemented during 2014–2020 with the main purpose (A) nutrient reduction (blue) and (B) biodiversity (green).
There was a large difference in budget distribution between counties; Counties M and O both received around 18% of the total budget, while the rest each received between 2 and 8% (Figure 4). The county budget did not have an impact on the ability to reach county-level targets. Counties AB and H, both with relative small budgets, managed to implement even more nutrient reduction CWs than their target. In contrast, Counties O and E had relatively high shares of the overall budget, yet neither managed to fulfill their target for nutrient reduction CWs.
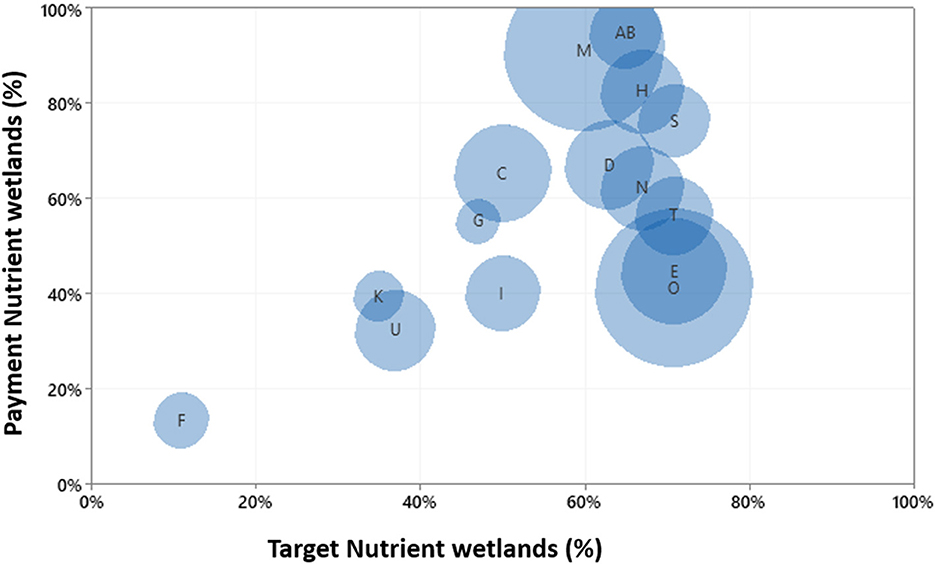
Figure 4. The share of nutrient wetlands 2014–2020 in relation to the county targets. Bubble size is the counties' share of the Rural Development Programme (RDP) budget.
3.4. Comparison of program before and after targeting
3.4.1. Construction area
Average construction areas varied significantly between periods. Both mean and median construction areas were larger during the later RDP period (4.6 ha and 2.5 ha) than during the earlier period (2.4 ha and 1.0 ha). Within each period the number of CWs for biodiversity and nutrient retention were similar (Figure 1). However, in the earlier period 20% of the CWs were categorized as a combination of the two purposes, while in the later period this classification was no longer used. On the other hand, biodiversity CWs accounted for a larger total construction area (2,275 ha) than nutrient CWs (1,836 ha), corresponding to 55 and 45% respectively. This was a result of significantly larger mean construction areas for biodiversity CWs (3.4 ha) than for nutrient reduction CWs (2.5 ha). Regardless of purpose, mean construction areas increased between periods (Figure 5A) with biodiversity CWs increasing from on average 2.9 to 5.3 ha and nutrient reduction CWs doubling in area from 2.1 to 4.1 ha.
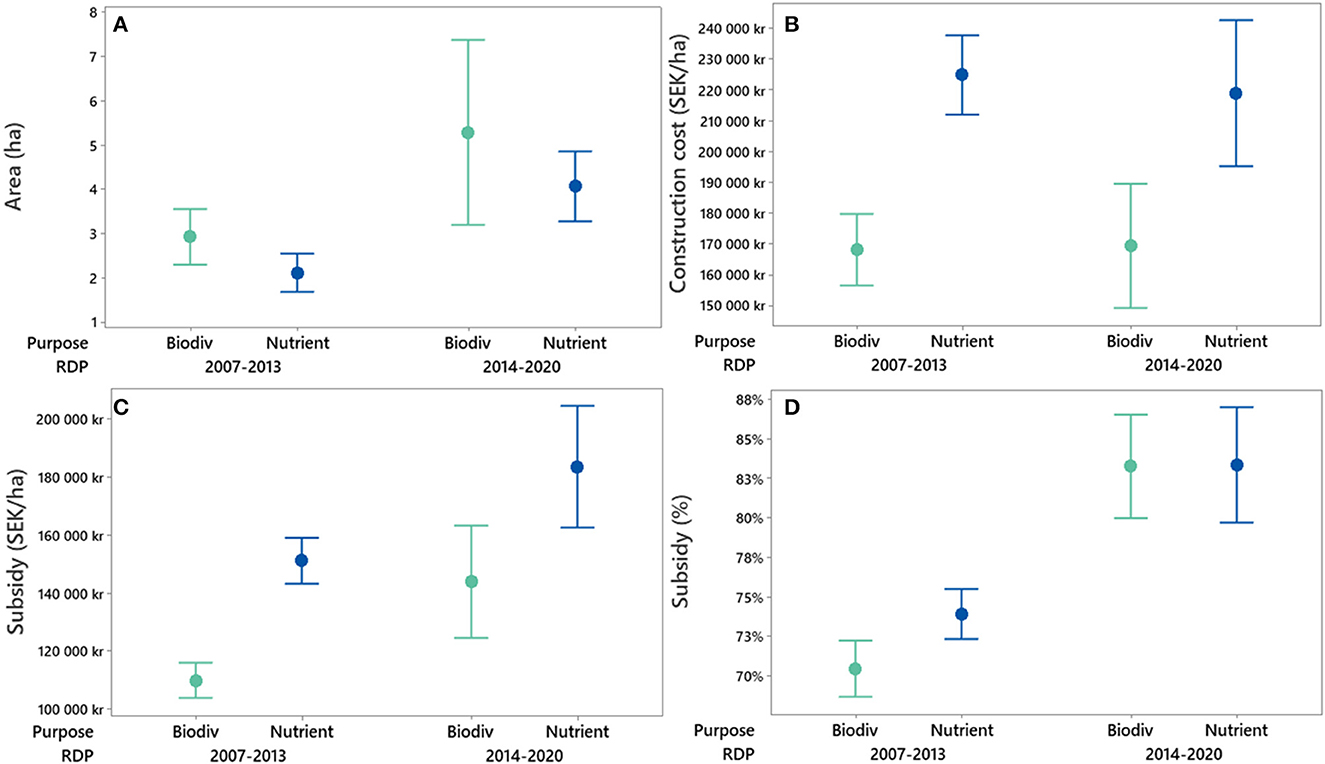
Figure 5. Interval plots for (A) construction area (ha), (B) area-specific construction cost (SEK ha−1), (C) subsidy (SEK ha−1) and (D) subsidy (% of construction cost) financed by the Rural Development Programme (RDP) during 2007–2013 and 2014–2020 for biodiversity CWs (green) and nutrient CWs (blue). The CW with combined purpose during RDP 2007–2013 was excluded. Number of biodiversity CWs was 553 and 125, while corresponding number for nutrient CWs was 614 and 138 in the two respective RDP periods. Dots represent mean values and horizontal bars show 95% confidence intervals.
3.4.2. Construction cost
As the wetland area increased between the program periods, construction costs were significantly higher for each purpose. Mean construction cost for biodiversity CWs increased from 270,646 to 440,323 SEK, while the cost for nutrient CWs was on average 324,629 and 620,027 SEK. While there was no difference in the area-specific cost between the program periods for either purpose (Figure 5B), the area-specific construction cost was significantly higher for nutrient CWs (223,648 SEK ha−1) than for biodiversity CWs (168,292 SEK ha−1).
3.4.3. Subsidies
In contrast to construction cost (Figure 5B), both the average financial payment per hectare by the RDP and the share of costs paid by the subsidy (% of construction cost) were higher for both purposes in the later period (Figures 5C, D). Furthermore, during the first period there was a difference in average share covered by the subsidy between CWs for biodiversity vs. those for nutrient reduction (Figure 5D). However, during the later period subsidies for both purposes had similar (mean 83%) shares of construction costs (Figure 5D).
4. Discussion
Policies which are expected to support the cost efficiency of AEMs through targeting are either intended to lower costs directly or to improve efficiency through placement and design. It has long been suggested that decentralizing administrative decision making could lead to higher cost efficiency (see Beckmann et al., 2009), however, previous studies have not been based on a comparative evaluation of the effects of an actual change in policy. For example, the potential impact of decentralization on stakeholders has been studied (e.g., Leventon et al., 2019; Schomers et al., 2021) and Yang et al. (2015) explored decision-makers' perspective on decentralization through semi-structured interviews, while Bareille and Zavalloni (2017) modeled changes in the provision of public goods. The results and analysis presented here are based on a quantitative comparative evaluation of the devolution of targets from a national agency to regional authorities over two periods. Our study extends previous work on targeting by identifying factors which have an impact on the effectiveness of administrative decentralization.
The Swedish EU RDP developed national criteria to support wetland construction including regional purpose driven targets that would increase cost efficiency of CWs to reduce the amounts of nutrients entering waterways and to increase biodiversity. In the earlier RDP period both purposes were financed within the same measure and responsible county-level authorities had no national or regional targets for allocation between these purposes. This changed in the later RDP period when participating counties were asked to set specific goals for each purpose based on local priorities. In this study, we have evaluated how successful the two programs were in achieving their identified goals (Figure 2A). The deviations from the goals set and the results can in part be attributed to the following five factors: goal setting (quantification), decision criteria consistency, prioritization, budget controls and timing consistency.
The manner in which goals were set and quantified is probably the most important explanatory factor. In the earlier RDP period, quantitative goals were set for the total number and area of constructed wetlands regardless of purpose. When county boards were asked to identify targets for the share intended for biodiversity and nutrient CWs, respectively, there was no indication of how targets were set. Results are not consistent across counties with respect to which goals were met (Figure 3B). In some counties, targets for biodiversity CWs were exceeded by more than 10% (County E, I, O, and T) while in others targets for nutrient CWs were exceeded (County AB, H, and M) while some counties met both targets (County C, D, F, and K). This lack of consistency may be an indication that there were problems with how targets were developed.
There is considerable regional variation with respect to goals that were set (Figures 3A, 4). While most counties set goals of constructing over 50% of wetlands for nutrient reduction, in County F the share for nutrient reduction was set around 10%. It could be because there is less agricultural land in this county but then neighboring County G with a lower share of agriculture (Figure 2) set their nutrient reduction target at just under 50% and County T with the same share of agricultural land set the nutrient reduction goal at 70%. In addition, Counties O, S, and T have chosen to set the same goals at 71%. These counties are contiguous but have very different landscapes. That they have chosen the same targets may indicate that the goals were determined in some way in relation to each other. Finally, the total budget provided for each county to cover both purposes is to a large extent driven by the share of agricultural land in the county as well as the area included in nationally designated NSAs. Agricultural practices are the primary source of nutrient losses in Sweden. Assigning a large part of the national budget to counties based on the relative amount of agricultural land in the county reflects the importance of promoting creation of CWs in the areas where the problems are greatest. However, this does not seem to be the case (Figure 4). Some counties with large budgets (indicative of a large share of agricultural area and/or a need to reduce N losses) did not set high goals for wetlands for nutrient reduction (e.g., Counties C and M).
Achieving the benefits from targeting requires an ability at the regional (county) administrative level to choose between measures. The ability to accept (adopt) measures which are consistent with the stated goals and reject those that do not fulfill the criteria is why targeting leads to greater efficiency. For a voluntary program such as the RDP wetland construction initiative, there needs to be a sufficient number of applications to allow the approving authority to differentiate between proposals which will lead to fulfillment of the goal and those which will not. The number of applications needs to be at least equal to or higher than the target. This allows the authority to prioritize ex ante set targets. A shortage of applications for one or the other (or both) of the two purposes is one factor which could lead to targets not being met. Since participation is voluntary, the financial support needs to be at least equal to the costs expected to be incurred by the applicant. If the perceived compensation for participating is less than expected costs or if there is a perception that payments may not be forthcoming, then this would be a disincentive to apply.
Although construction costs for each purpose were similar between periods, the share of costs subsidized (level of compensation paid to the applicant) increased for both purposes in the later period (Figure 5C). This meant that in reality the level of compensation relative to costs increased. Therefore, it could be expected that the number of applications would increase. However, a temporary stop of funding for all new wetlands between these two periods in 2013 may have caused potential applicants to reconsider the likelihood that they would be compensated and consequently led to a fall in applications (Geranmayeh et al., under revision). Regardless of the effect on the number of applications due to greater net compensation and the decrease due to diminished expectations, all that can be seen is that the number of approved applications decreased by 82% in the second period (Figure 1A) although the average CW size for both purposes increased (Figure 5A).
Construction costs per hectare were lower in both periods for biodiversity CWs. However, the cost for each purpose was unchanged between the two periods (Figure 5B). Average construction costs were higher for nutrient CWs as these more often require that more material is moved for effective reduction (primarily with respect to P) than for biodiversity CWs that are typically flooded without removal of soil and where greater total area is most important for providing species habitat. The increase in construction area between the two periods (Figure 5A) may have been due to fewer applications for smaller CWs. Construction costs and the ability to compensate for these are limited by the conditions of the program where a cap is set on compensation per hectare. Increasing the size of the compensated area is one possible way for an applicant to be able to provide sufficient compensation to cover higher total construction costs.
A lack of budget control associated with the individual targets may explain some of the difference between the targeted goals and the second period results. The budget allocated to the regional (county level) authorities is meant to cover all CWs supported through the RDP program irrespective of intended purpose. There are no separate budgets for each purpose which in turn allows funds to be shifted between purposes at the county level without approval from the national authority. The result is that if there are more applications approved for one of the two purposes than has been set as a goal and there is still money available then this can be moved between them. This shift of funding between purposes allows goals to be exceeded. This effect is further enhanced by the timing inconsistency between annual budgets and program period goals.
Approval of applications is an ongoing activity. While there can be considerable delays between when an application is initially submitted and finally approved, this is rarely more than 2 years. Since applications are approved continually, it is difficult for a regional authority to manage approvals so that expected goals are achieved at the end of the 6-year period. In order to achieve the goal at the end of 6 years there would need to be annual review of the goals (or annual targets) to stay on track. Annual budgets would only support program period goals if these were evaluated and adjusted appropriately each year. If this is not the case, and applications are approved as long as there is funding then this may also lead to unintended results. For the individual responsible for evaluation and approval of applications an annual bias may also impact their decisions. The role of the individual at the regional (county) level with authority to approve applications is the final factor to consider in meeting targets. As noted above, the long period over which the program period goals are expected to be met requires a comprehensive perspective. Different individuals may be responsible for evaluation during the program period, hence the need for clear guidelines and assessment of what wetland types have already been implemented in the region for balancing the allocation of funds between purposes. In addition, criteria for evaluation used by individuals in this role need to be consistent with the goals. When there are too many applications being approved for one or the other of the two purposes this may point to a bias in the criteria applied or to a need to revise the criteria used.
Furthermore, non-specific or multiple purposes are harder to target. If the target had been singular, e.g., only N reduction efficiency, evaluation of alternatives would be possible based solely on how effective they were in achieving this. However, if the target is nutrient reduction in general, then some wetland alternative sites/designs may more effectively reduce P losses while others could be more effective at controlling N. Comparing which of these two is more effective is difficult, and they would need to be expressed in a common metric. This lack of comparability is even more problematic when evaluating wetlands created for biodiversity where goals, and thus effects, may be defined in multiple ways.
This analysis of the Swedish EU RDP reveals important aspects that need to be taken into account when evaluating and designing agri-environmental support programs to make them more effective. While the study is specific for the Swedish context these insights could also be used in other parts of the world where similar programs are in place. Particularly, we highlight the need for a comprehensive perspective with clear evaluation criteria and balanced allocation of funds.
5. Conclusions
The aim of this study was to investigate if an increase in targeting has been effective for the construction of purpose driven wetlands. In our study of the Swedish EU RDP periods from 2014–2020, the results indicate that regional (county) targets were not achieved. In some cases, the target for the area and number of nutrient CWs was exceeded and in others the result was lower than the target. As there were only two targets, every exceeded target for one purpose corresponded to an under-achievement for the other. The mixed results may be a positive indication of a learning process. It is not clear from the interviews and documentation reviewed for this study how targets were set by regions, as a larger share of agricultural land was not correlated with higher nutrient target. It may be that if targets were set somewhat arbitrarily based on a general feeling of what could be achieved, the results can provide feedback that can be incorporated in new targets for following periods. Irrespective of how targets were set and the results achieved, they provide an indication of the level of ambition for supporting construction of purpose driven wetlands in each region. Indicating the desired results makes it easier to evaluate program success and to perhaps understand the factors which contribute to achieving those results.
Another potentially important reason that regional targets were not met could be that they were adjusted according to the number and type of applications received. In the end it is the landowner that decides what type of wetland they seek to implement and their purpose. Land owners interest is often recreation and bird watching rather than nutrient reduction (Geranmayeh et al., under revision) and considering the higher cost for constructing the latter, there might be a preference for biodiversity CWs. If there was a surplus of applications for biodiversity and a deficit for nutrient reduction, given the flexibility of the program budget more funds could then be used for the purpose in higher demand. To increase the application rate and cost efficiency the total cost of the CWs needs to be covered instead of only 83% on average. Continuity and help with the complicated application process is crucial for landowners trust and willingness to construct wetlands, therefore long-term financial and support system is needed (Geranmayeh et al., under revision). Providing financial support for designated catchment officers and wetland advisory services can also be important catalysts and provide bridges between landowners and county authorities. Additionally, if the allocated budget is set for each purpose individually and only allowed to be used by the receiving county for the intended purpose, then it may be expected that targets could be more easily prioritized and achieved. The flexibility of shifting funds between purposes is also easier when purposes are not well defined.
Clear definitions and decision criteria are the basis for effective targeting. Non-specific or multiple goals are harder to target.
Finally, while a regional landscape approach is beneficial in many aspects, targets for individual wetlands should be set depending on the placement in the wetlandscape (Hambäck et al., 2022). To increase cost-efficiency of nutrient wetlands, a high nutrient load is crucial (Djodjic et al., 2022), while connectivity and maintenance is more important for biodiversity (Hambäck et al., 2022). Hence, separate budgets for nutrient and biodiversity CWs would lead to greater cost efficiency by focusing on evaluation of effective criteria for placement and design. In addition, cost-efficient assessment of existing wetlands at wetlandscape level and what type of wetland types are still needed to fulfill the reduction targets and to create a multifunctional wetlandscape is required. This would lead to an efficient usage of not only land, but also investment and maintenance support within the RDP program.
Data availability statement
The raw data supporting the conclusions of this article will be made available by the authors, without undue reservation.
Author contributions
PG, AS, MB, and DC contributed to conception and design of the study. AS collected the data. PG performed the statistical analysis. PG and DC wrote the first draft of the manuscript. MF project administration and funding acquisition. All authors contributed to manuscript revision, read, and approved the submitted version.
Funding
This work was supported by the Swedish Environmental Protection Agency (WetKit Hydro-ES project, Grant No. 802-0083-19) and OPTAIN EU Horizon 2020 grant agreement No. 862756.
Conflict of interest
The authors declare that the research was conducted in the absence of any commercial or financial relationships that could be construed as a potential conflict of interest.
Publisher's note
All claims expressed in this article are solely those of the authors and do not necessarily represent those of their affiliated organizations, or those of the publisher, the editors and the reviewers. Any product that may be evaluated in this article, or claim that may be made by its manufacturer, is not guaranteed or endorsed by the publisher.
References
Andersson, K. (2012). Varför multifunktionella våtmarker? En studie om våtmarksimplementering och aktörssamverkan i Sverige. Stockholm: Stockholm Environment Institute.
Andersson, R., Kaspersson, J., and Wissman, E. (2009). Slututvärdering av Miljö-och landsbygdsprogrammet 2000–2006. (In Swedish) SLU, ISBN 978–91-86197–01-8
Bång, M., Gustavsson, A., Hjort, J., Ståhlberg, D., Svensson, E., and Söderberg, T. (2019). Resultat- och värdebaserade ersättningar för minskad övergödning – är det möjligt? Swedish Board of Agriculture, Report 32
Bareille, F., and Zavalloni, M. (2017). “Decentralization of agri-environmental policy design: the case of abandoned wetlands in Brittany,” in Journées de Recherche en Sciences Sociales (JRSS) 32.
Beckmann, V., Eggers, J., and Mettepenningen, E. (2009). Deciding how to decide on agri-environmental schemes: the political economy of subsidiarity, decentralisation and participation in the European Union. J. Environ. Plan. Manage. 52, 689–716. doi: 10.1080/09640560902958289
Blicharska, M., and Rönnbäck, P. (2018). What factors enable or hinder engagement of civil society in ecosystem management? The case of ‘pike factories' and wetland restoration in Sweden. J. Environ. Plan. Manage. 61, 950–969. doi: 10.1080/09640568.2017.1350145
Djodjic, F., Geranmayeh, P., Collentine, D., Markensten, H., and Futter, M. (2022). Cost effectiveness of nutrient retention in constructed wetlands at a landscape level. J. Environ. Manage. 324, 116325. doi: 10.1016/j.jenvman.2022.116325
Djodjic, F., Geranmayeh, P., and Markensten, H. (2020). Optimizing placement of constructed wetlands at landscape scale in order to reduce phosphorus losses. Ambio 49, 1797–1807. doi: 10.1007/s13280-020-01349-1
EC (2017). Communication From the Commission to the European Parliament, the Council, the European Economic and Social Committee and the Committee of the Regions the Future of Food and Farming. COM(2017) 713, Brussels.
Franzén, F., Dinnétz, P., and Hammer, M. (2016). Factors affecting farmers' willingness to participate in eutrophication mitigation—A case study of preferences for wetland creation in Sweden. Ecol. Econ. 130, 8–15. doi: 10.1016/j.ecolecon.2016.05.019
Geranmayeh P. Wennerholm M. Futter M. Blicharska M. (under revision). Agri-environmental advisors' perspectives on barriers opportunities for wetland creation – the view from Sweden. J. Env. Plan. Manage.
Graversgaard, M., Jacobsen, B. H., Hoffmann, C. C., Dalgaard, T., Odgaard, M. V., Kjaergaard, C., et al. (2021). Policies for wetlands implementation in Denmark and Sweden–historical lessons and emerging issues. Land Use Policy 101, 105206. doi: 10.1016/j.landusepol.2020.105206
Grigoryan, S. (2019). Våtmarker och dammar En uppföljning av stöd inom landsbygdsprogrammet baserad på uppgifter fram till och med den 2 oktober 2018. (In Swedish) Swedish Board of Agriculture, Uppföljningsrapport 2.
Hambäck, P. A., Dawson, L., Geranmayeh, P., Jarlsjö, J, Kačergytė, I., Peacock, M., et al. (2022). Trade-offs and synergies in wetland multifunctionality: A scaling issue. Sci. Total Environ. doi: 10.1016/j.scitotenv.2022.160746
Hansson, H., and Kokko, S. (2018). Farmers' mental models of change and implications for farm renewal–A case of restoration of a wetland in Sweden. J. Rural Stud. 60, 141–151. doi: 10.1016/j.jrurstud.2018.04.006
Länsstyrelsen Blekinge (2020). Regional handlingsplan för landsbygdsprogrammet och havs- och fiskeriprogrammet 2014–2020. The County Administrative Board of Blekinge. Dnr 600-1937-2013. Available online at: https://catalog.lansstyrelsen.se/store/28/resource/69
Länsstyrelsen Gotland (2020). Regional handlingsplan för landsbygdsprogrammet och havs- och fiskeriprogrammet 2014–2020. The County Administrative Board of Gotland. Dnr 600-1459-13. Available online at: https://www.lansstyrelsen.se/download/18.4c066510170f3a14b78146f7/1585894390066/Regional%20handlingsplan%20Gotland%202020.pdf
Länsstyrelsen Halland (2020). Regional handlingsplan för landsbygdsprogrammet och havs- och fiskeriprogrammet 2014–2020. Dnr 604-6474-2015.
Länsstyrelsen Jönköping (2016). Regional handlingsplan för landsbygdsprogrammet och havs- och fiskeriprogrammet 2014–2020. The County Administrative Board of Jönköping.
Länsstyrelsen Kalmar (2018). Regional handlingsplan för landsbygdsprogrammet och havs- och fiskeriprogrammet. The County Administrative Board of Kalmar. Available online at: https://www.lansstyrelsen.se/kalmar/om-oss/vara-tjanster/publikationer/2018/regional-handlingsplan-for-landsbygdsprogrammet-och-havs–och-fiskeriprogrammet-2014-2020.html
Länsstyrelsen Kronoberg (2018). Regional handlingsplan för landsbygdsprogrammet och havs- och fiskeriprogrammet. The County Administrative Board of Kronoberg. Available online at: https://docplayer.se/108240453-Landsbygdsprogrammet-i-kronobergs-lan.html
Länsstyrelsen Örebro (2018). Regional handlingsplan för landsbygdsprogrammet och havs- och fiskeriprogrammet. The County Administrative Board of Örebro. Available online at: https://www.lansstyrelsen.se/download/18.2ddec05a17ee36dc53e14387/1645109719279/Beslutad%20av%20SJV%20%C3%96rebro%20RHP%202022.pdf
Länsstyrelsen Östergötland (2019). Regional handlingsplan för landsbygdsprogrammet och havs- och fiskeriprogrammet. The County Administrative Board of Östergötland.
Länsstyrelsen Östergötland (2020). Regional handlingsplan för landsbygdsprogrammet och havs- och fiskeriprogrammet 2014–2020. The County Administrative Board of Östergötland. Dnr 600-9546-14. Available online at: https://www.lansstyrelsen.se/download/18.4a4eb7416faedec125fc2e/1580204080182/%C3%96sterg%C3%B6tland%20RHP%202020%20beslutad.pdf
Länsstyrelsen Skåne (2018). Regional handlingsplan för landsbygdsprogrammet och havs- och fiskeriprogrammet. The County Administrative Board of Skåne.
Länsstyrelsen Södermanland (2019). Regional handlingsplan för landsbygdsprogrammet och havs- och fiskeriprogrammet. The County Administrative Board of Södermanland.
Länsstyrelsen Stockholm (2019). Regional handlingsplan för landsbygdsprogrammet och havs- och fiskeriprogrammet. The County Administrative Board of Stockholm. Available online at: https://www.lansstyrelsen.se/stockholm/om-oss/vara-tjanster/publikationer/2022/regional-handlingsplan-for-landsbygdsprogrammet-och-havs–och-fiskeriprogrammet-2014-2020.html
Länsstyrelsen Värmland (2016). Regional handlingsplan för landsbygdsprogrammet och havs- och fiskeriprogrammet 2014–2020 med förlängningsåren 2021–2022. The County Administrative Board of Värmland. Available online at: https://www.lansstyrelsen.se/varmland/om-oss/vara-tjanster/publikationer/2022/regional-handlingsplan-for-landsbygdsprogrammet-och-havs–och-fiskeriprogrammet-2014-2020-med-forlangningsaren-2021-2022.pdf.html
Länsstyrelsen Västmanland (2017). Regional handlingsplan för landsbygdsprogrammet och havs- och fiskeriprogrammet. The County Administrative Board of Västmanland. Dnr 600-4463-14. Available online at: http://media.grontkompetenscentrum.se/2018/06/Vastmanland-regional-handlingsplan-landsbygdsprogrammet-170101.pdf
Leventon, J., Schaal, T., Velten, S., Loos, J., Fischer, J., and Newig, J. (2019). Landscape-scale biodiversity governance: Scenarios for reshaping spaces of governance. Environ. Policy Govern. 29, 170–184. doi: 10.1002/eet.1845
Mårtensson, K., Johnsson, H., Collentine, D., Kyllmar, K., Persson, K., Djodjic, A., et al. (2020). Åtgärdsscenarier för minskat näringsläckage från åkermark: beräkningar för ett urval av delavinningsområden inom LEVA-områden. Technical Report.
Schomers, S., Meyer, C., Matzdorf, B., and Sattler, C. (2021). Facilitation of public Payments for Ecosystem Services through local intermediaries: An institutional analysis of agri-environmental measure implementation in Germany. Environ. Policy Govern. 31, 520–532. doi: 10.1002/eet.1950
Smith, H. G., Dänhardt, J., Blombäck, K., Caplat, P., Collentine, D., Grenestam, E., et al. (2016). Slututvärdering av det svenska landsbygdsprogrammet 2007–2013: Delrapport II: Utvärdering av åtgärder för bättre miljö. (In Swedish) Utvärderingsrapport 3.
Speks, A. (2021). Analyzing the impact of the financial systems for constructing wetlands in Sweden. Master thesis in Sustainable Development, Department of Earth Sciences, Uppsala University.
Weisner, S., Johannesson, K., and Tonderski, K. (2015). Nutrient retention in constructed wetlands on arable land - an analysis of measurements and effects of rural development programme (In Swedish with a summary in English). Swedish Board of Agriculture, Report 7.
Weisner, S. E. B., Johannesson, K., Thiere, G., Svengren, H., Ehde, P. M., and Tonderski, K. S. (2016). National large-scale wetland creation in agricultural areas—Potential versus realized effects on nutrient transports. Water 8, 544. doi: 10.3390/w8110544
Keywords: agriculture, biodiversity, financing, nutrient reduction, targeting, wetlands
Citation: Geranmayeh P, Speks A, Blicharska M, Futter M and Collentine D (2023) Regional targeting of purpose driven wetlands: success or failure? Front. Sustain. Resour. Manag. 2:1251291. doi: 10.3389/fsrma.2023.1251291
Received: 01 July 2023; Accepted: 01 September 2023;
Published: 21 September 2023.
Edited by:
Sérgio António Neves Lousada, University of Madeira, PortugalReviewed by:
Cristiana Maduro Dias, Universidade dos Açores, PortugalMário Fernandes, University of Porto, Portugal
José Manuel Naranjo Gómez, University of Extremadura, Spain
Copyright © 2023 Geranmayeh, Speks, Blicharska, Futter and Collentine. This is an open-access article distributed under the terms of the Creative Commons Attribution License (CC BY). The use, distribution or reproduction in other forums is permitted, provided the original author(s) and the copyright owner(s) are credited and that the original publication in this journal is cited, in accordance with accepted academic practice. No use, distribution or reproduction is permitted which does not comply with these terms.
*Correspondence: Pia Geranmayeh, cGlhLmdlcmFubWF5ZWhAc2x1LnNl