 Wei Guo1Tao Meng2Zheyong Piao3Yian Chen1Hao Liu1Daming Xu1Fanyan Meng1Xin Wang4Jieping Han4Jing Yan4Xiaolong Yang4
 Jiaqi Li4*
 Zeqi Ge4
- 1State Grid Baicheng Power Supply Company, Baicheng, Jilin, China
- 2Research Institute of Electric Power Science, State Grid Jilin Electric Power Company Limited, Changchun, Jilin, China
- 3Jilin Electric Power Trading Center Co., Ltd., Changchun, China
- 4School of Economics and Management, Northeast Electric Power University, Jilin City, Jilin, China
The three primary markets for carbon emission reduction trading are green certificate, green power, and carbon emission right markets. This paper suggests utilizing game theory to analyze the behaviors of government and enterprises in multi-market synergistic trading. The main participants in the game are the government, electricity consuming enterprises, traditional power generators, and new energy power generators. The game model will be simulated using system dynamics, and recommendations and measures will be proposed. The findings indicate that: (1) the government's ultimate strategy is to “act” when the losses resulting from government inaction exceed the gains from government action. (2) Behavioral evolution is consistent when market participants refrain from adjusting their cost inputs in response to fluctuations in market prices. (3) The market price is not as high as possible, but too high a price inhibits emission reduction. The behavioral evolution of carbon emission reduction in multiple markets is revealed in this study, which is of great importance in the promotion of carbon emission reduction.
1 Introduction
China's energy policy now primarily focuses on encouraging the green and low-carbon transformation of high-carbon industries, as the country's “peak carbon and carbon neutral” goal gains traction. China has made great strides in the development of renewable energy, but the country still emits a large quantity of greenhouse gases overall, primarily from its core industries, which include cement, chemicals, and power. Therefore, action to cut greenhouse gas emissions is desperately needed to promote sustainable development and prevent stagnation in the energy sector. To give green power an environmental value and control the overall amount of greenhouse gas emissions through market adjustment means, the Chinese government has successively established the green certificate trading market, green power trading market, and carbon emission right trading market in recent years. The green power, carbon emission right, and green certificate trading markets, with the corresponding green certificates, green power, and carbon emission right as the primary trading bodies, are recognized as crucial policy instruments to encourage the use of clean energy, lower carbon emissions, and address climate change. The three markets' synergistic development can effectively lessen the pressure from government low-carbon subsidies, encourage the production and consumption of green power, and play a major role in providing incentives for low-carbon technology research and development, cutting the cost of energy conservation and emission reduction, and hastening the process of becoming carbon neutral. China's green certificate trading market, green power trading market, and carbon emission right trading market have experienced delayed initiation, sluggish development, and low market operation efficiency. However, the government, enterprises, and other stakeholders are actively exploring avenues for sustainable development through multi-market synergistic trading. The government and enterprises have a mutual influence and constraint relationship in the carbon emission reduction efforts. This is achieved through the green certificate trading market, green power trading market, and carbon emission right trading market. To account for the diverse range of market participants, this study categorizes enterprises into three types: traditional power generators, new energy power generators, and power-using enterprises. The objective is to analyze the mechanism of the four market subjects, facilitate the synergistic development of the three markets, and identify the optimal path for carbon emission reduction. Hence, it is imperative to rapidly study the analysis of the mechanism among the four market actors, the promotion of synergistic development in the three markets, and the exploration of the most effective path for carbon emission reduction.
2 Literature review
Clear subject is the premise of analyzing participants' behavior. At present, when experts in different industries study emission reduction work and low-carbon development, the division of government and enterprise subjects is relatively rough. The government, enterprises and energy regulatory service center constitute a tripartite game theme, and the impact of enterprise innovation under government photovoltaic subsidies is sorted out through the model (Zhang et al., 2023). From the central government, local government and enterprises, this paper studies the policy of replacing subsidies with awards (Tuofu et al., 2022). Participants were divided into energy investment companies, solar thermal power plants and nuclear power plants to study the coordinated development of solar thermal power generation and nuclear power in China (Wang et al., 2022). Analyze the behavioral strategies of the private sector from the perspective of new energy generators and sellers (Liu et al., 2021). A tripartite evolutionary game model of government, new energy enterprises and farmers is constructed to analyze the evolution path and stability strategy of the main body in the process of energy industry transformation (Yu et al., 2022). Building partnerships between energy investment companies, solar thermal power plants and nuclear power plants. The evolution process of the three-party game under different conditions is simulated, and it is proved that the long operation life of the power plant, the large subsidy and the high electricity sale price are conducive to the smooth promotion of the cooperation (Chen and Hu, 2018). An evolutionary game model was established to determine the optimal strategy of cooperative air pollution control between large iron and steel enterprises and small and medium-sized iron and steel enterprises under the government subsidy policy, and to demonstrate that government subsidies and input-output ratio are crucial for enterprises to cooperate in air pollution control investment (Zhang and Zhang, 2022). An evolutionary game model is constructed and it is concluded that carbon taxes, subsidies and penalties can promote the diffusion of low-carbon technologies (Wu et al., 2023). An evolutionary game model with suppliers and manufacturers as the main body is established to determine the optimal green investment strategy under the government subsidy policy, indicating that the government subsidy amount is set within the relevant range, which can reduce the free-riding behavior of market participants (Sun et al., 2019).
Most of the existing literature on carbon emission reduction focuses on single market or dual market coupling. The behavior evolution of market participants in green electricity trading is investigated. The sensitivity of participants to green electricity price is different under different trading modes (Wang et al., 2024). The coupling effect of carbon emission trading and tradable green certificates is sorted out, emphasizing that the coordination of TGC and CET alleviates the pressure of fiscal deficit of renewable energy and promotes the low-carbon transition in the energy sector (Chang et al., 2023). Simulation of the combined effects of carbon emissions trading and tradable green certificates on the electricity market in 2020–2026 shows that the power supply structure can be optimized under TGC and CET systems (Feng et al., 2021). Explore the impact of corporate strategic decisions and consumer choices on the promotion of low-carbon technologies, and emphasize the increasing marginal effect of carbon taxes in promoting the promotion of low-carbon technologies (Yingying et al., 2021). In the carbon emission trading market, the renewable energy portfolio standard and carbon emission trading are studied. The simulation results reveal the interaction between the strategies of market players, and provide relevant analysis basis for the setting of policy parameters (Hu et al., 2023).
Scholars at home and abroad use different theories to study how the government and enterprises develop low-carbon. This paper establishes a low-carbon energy diffusion model based on scenario-based policy representation, and proves that basic production profit per unit product and technology-driven effect are important scenario factors affecting policy effectiveness (Zeng et al., 2024). The equilibrium model of carbon emission, green certificate and electricity wholesale market is put forward. According to Nash equilibrium theory, the market equilibrium is derived, and the influence of carbon emission quota and renewable energy quota on multi-market equilibrium is revealed (Zheng et al., 2023). To explore the effect of reliability option mechanism in electricity market, carbon emission trading market and green certificate trading market on wind power investment balance and user-side cost under different demand elasticity and generation side competition. The numerical simulation shows that the RO mechanism mainly reduces the user-side risk and has little influence on the equilibrium in the region with high demand elasticity. In regions with low demand elasticity, the impact on wind power investment and user-side risk depends on the degree of market competition and the proportion of wind power RO sales (Feng et al., 2024). Document the latest trends in CO2 emissions in Asia and explore the drivers of CO2 emissions in 14 countries between 1971 and 2017. The analysis shows that per capita CO2 emissions, energy intensity, carbonization, and per capita income converge slowly across the entire sample (Parker and Bhatti, 2020). To explore the impact of circular economy innovation and business model innovation on the economic, environmental, and social performance of SMEs in Pakistan, Malaysia, and China, and the mediating role of government incentives. The results show that circular economy innovation and BMI have significant positive effects on the economic, environmental and social performance of SMEs in Pakistan, Malaysia and China. The study also found that government incentives mediate the relationship between circular economy innovation, BMI, and the economic, environmental, and social performance of SMEs in Pakistan, Malaysia, and China (Rehman et al., 2022). Focus on analyzing how network constraints affect the shape of feasible operating region. Provides a mathematical derivation of how network constraints, such as cable load and voltage limits, affect FOR. The method is based on linear distributed flow mathematical analysis (Javed et al., 2024).
It is evident that while the current literature can provide support for research on reducing carbon emissions by governments and corporations, there are still some shortcomings that need to be addressed. The categorization of government and enterprise subjects is imprecise, and the research findings have limited relevance for segmented enterprises. Additionally, the exploration of strategies and mechanisms for reducing carbon emissions rarely includes a comprehensive framework that considers the three core markets: green certificate trading, green power trading, and carbon emission rights trading. This lack of coherence and systematicity prevents a comprehensive understanding of the intricate interactions among carbon quotas, green power, green certificates, CCERs, and their potential impacts. Furthermore, both domestic and international scholars have employed various theoretical frameworks to investigate the collaborative efforts of government and enterprises in advancing low-carbon development. Each theory possesses distinct attributes, and the evolutionary game model stands out for its ability to effectively illustrate the evolution of the subject's behavior. Accordingly, this paper presents the following research and advancements:
(1) The government and enterprises are meticulously categorized as distinct entities. The government functions as the primary entity, while enterprises are categorized into three basic types: conventional power generators, renewable energy generators, and power-consuming enterprises.
(2) The development of multiple markets in a synergistic manner. The strategic choices and the extent of implementation of the government and enterprises under the synergistic trading of multiple markets can be comprehensively revealed by a comprehensive examination of the green certificate trading market, the green electricity trading market, and the carbon emission right trading market. The carbon emission right trading market includes carbon quotas and CCERs.
(3) Research on evolutionary game analysis. In light of the intricate characteristics of the conflict of interest and reciprocal confrontation between the subjects of government and enterprises, we implemented evolutionary game theory and developed the evolutionary game model of the four parties of government and enterprises.
3 Evolutionary game model for CO2
3.1 Definition of subjects
Green certificate, green power and carbon emission right market synergistic trading can promote the development of renewable energy and the upgrading of green industry, and maximizing benefits is the primary goal of enterprises in the carbon emission reduction market. Enterprises are divided into power users and power generators based on their functions and roles in the power industry chain, and traditional power generators and new energy power generators based on the type of energy used by power generators and the nature of power generation technology. Electricity-using enterprises use electricity for production activities, which can indirectly reduce carbon emissions, and implement the behaviors of buying/selling, buying, and purchasing in the carbon emission right, green electricity, and green certificate trading markets, respectively, with the strategy choice of [reduce emissions, do not reduce emissions]. Power generators are responsible for electricity production and directly face pressure to reduce emissions. Traditional power generators rely on traditional energy sources such as coal and oil, which have high carbon emissions, and implement the behaviors of buying/selling, purchasing, and purchasing in the carbon emission rights, green power, and green certificate trading markets, with the strategy choice of [reduce emissions, do not reduce emissions]. New energy power producers use renewable energy to generate electricity, with small carbon emissions, and implement the behaviors of buy/sell, sell, sell, sell in the carbon emission right, green power, and green certificate trading markets, with the strategy choices of [participate, do not participate]. The government regulates each market, and its strategy choice is [act, not act].
The conceptual framework of the carbon emission reduction participant game for government and enterprises is shown in Figure 1.
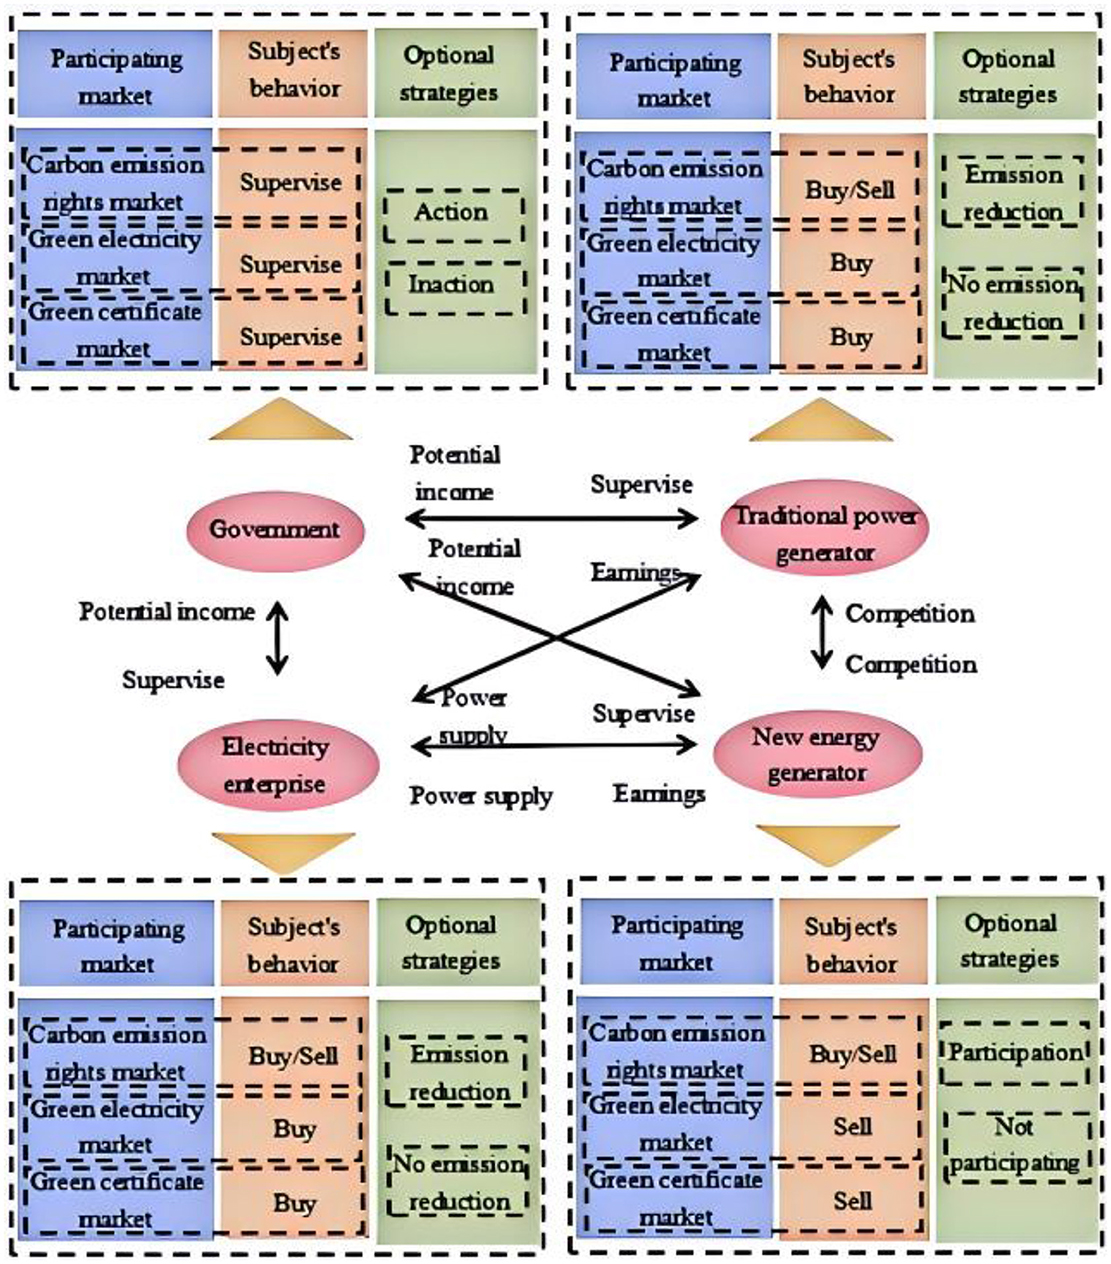
Figure 1. Conceptual framework of the game of government and enterprise carbon emission reduction participation.
3.2 Evolutionary game theory
This paper identifies four game subjects: the government, electricity enterprises, traditional power producers, and new energy power producers. All of these entities have limited rationality and gather asymmetric, limited information. They also all have conflicting interests, strive to maximize their own interests, compete with one another to better realize their objectives, and influence each other's decision-making. Finally, these entities evolve dynamically. Since each subject modifies its strategy and emphasizes the dynamic process of evolution, evolutionary game theory is a suitable and compatible framework for analyzing the behavioral changes of government enterprises in the carbon emission reduction market. This sets it apart from other theories. That is why this paper chooses to analyze the changes in government enterprise behavior using evolutionary game theory.
3.3 Basic assumptions and parameter settings
Based on the above analysis of the definition of game players, the following basic assumptions are made:
(1) The public's will can serve as an external monitoring tool to control and direct the actions of the parties involved in the game.
(2) CCERs can be purchased and sold by electricity users, conventional power providers, and new energy power producers. The cost of purchasing CCERs is included in the abatement cost of each party actively involved in the carbon market, and the proceeds from each party's sale of CCERs are included in the benefit of actively participating in the abatement market in order to streamline the simulation analysis.
(3) Should the government opt for the inactivity approach in the effort to reduce carbon emissions, businesses won't have to conduct any transactions and it won't be able to share the outcomes of the market.
(4) Participants are all finitely rational and play asymmetric games, all with two strategies.
The following describes the parameters involved in the evolutionary game model, which provides the basis for the subsequent model solving and analysis. The relevant parameters are shown in Table 1.
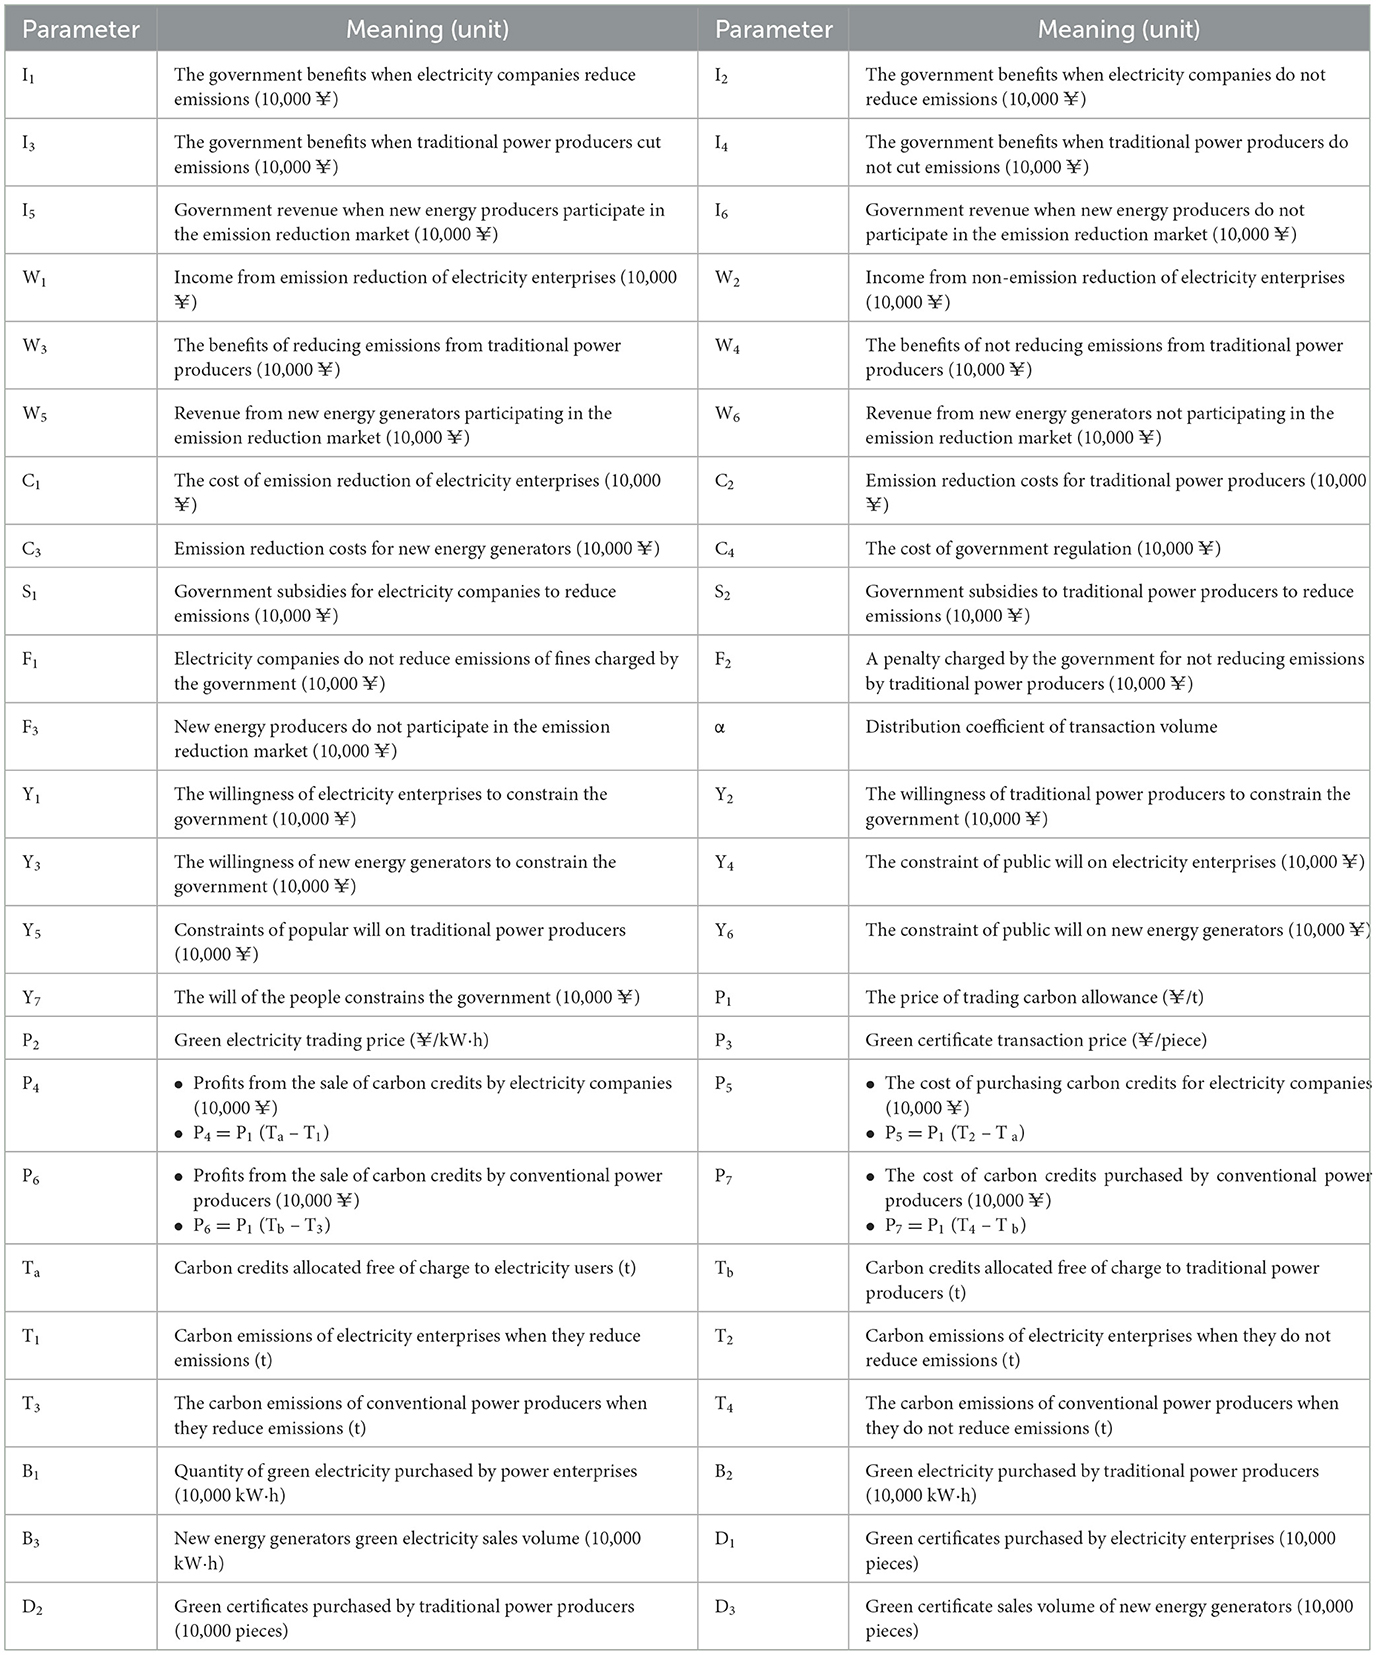
Table 1. Model parameters and their definitions.
3.4 Construction of evolutionary game model
On the basis of the model assumptions to construct the four-party subject game benefit matrix, as shown in Table 2. Among them, the probability that the government chooses to act is a, and the probability that it does not act is 1-a; the probability that the electricity-using enterprises choose to reduce emissions is b, and the probability that they do not reduce emissions is 1-b; the probability that traditional power producers choose to reduce emissions is c, and the probability that they do not reduce emissions is 1-c; and the probability that new energy power producers choose to actively participate in the carbon emission reduction market is d, and the probability that they do not participate in the carbon emission reduction market is 1-d.
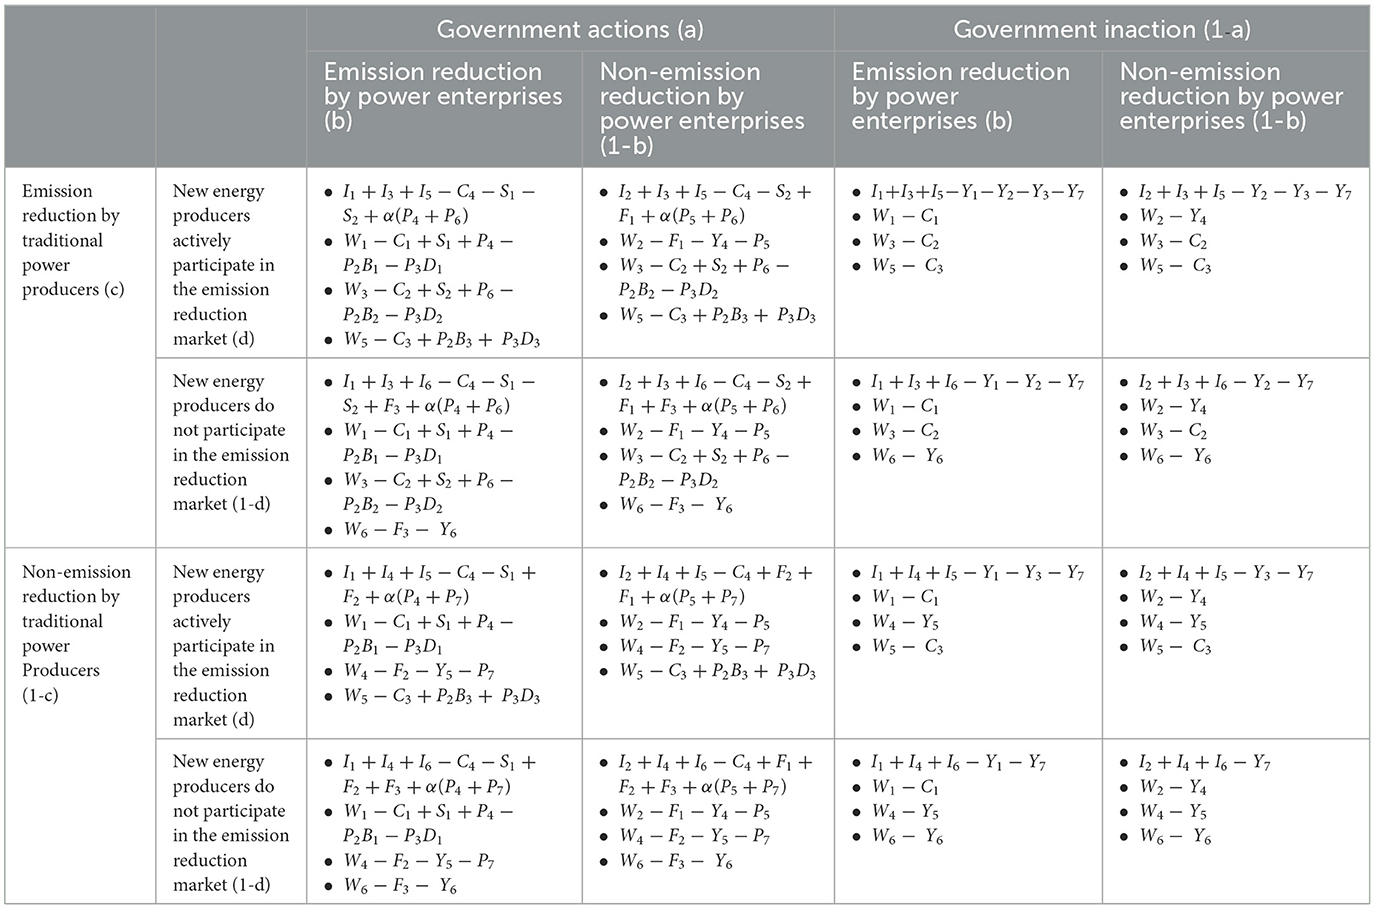
Table 2. Revenue matrix of multi-agent behavior game between government and enterprise.
Let Exy represent the expected return of participant (x) when adopting strategy (y), where (x = A, B, C, D) corresponding to the government, electricity enterprises, traditional power generators, and new energy power generators respectively; y = 1, 2, corresponding to the action and inaction strategies chosen by the government respectively; Emission reduction and non-emission reduction strategies chosen by power enterprises; Emission reduction and non-emission reduction strategies chosen by traditional power producers; Participation and non-participation in emission reduction market strategies chosen by new energy generators.
The expected return EA1 of the government choosing the “action” strategy, the expected return EA2 of the government choosing the “inaction” strategy and the average expected return during the game are respectively:
In the game, the expected income EB1 of choosing “emission reduction” strategy, the expected income EB2 of choosing “no emission reduction” strategy and the average expected income EB are respectively:
During the game, the expected revenue EC1 of the traditional power generators choosing the “emission reduction” strategy, the expected revenue EC2 of the “no emission reduction” strategy and the average expected revenue EC are respectively:
In the game, the new energy generators choose the expected return ED1 of “participating” emission reduction market strategy, the expected return ED2 of “not participating” emission reduction market strategy and the average expected return ED as follows:
Building a collection of dynamic replication systems encompassing all subjects is required to examine stability more thoroughly and accurately, as well as to verify the analysis's correctness and depth. By using this approach, we may make more trustworthy and scientific judgments by better understanding the dynamic changes of different subjects during the evolution process. The replication dynamic equations of the government, power companies, conventional power producers, and new energy power generators are as follows, in accordance with the evolutionary game principle:
3.5 Evolutionary game equilibrium analysis
Combined with the above multi-agent replication dynamic equation, let F(X) = 0, X = a, b, c, d, the local equilibrium points of the system are obtained as follows:
Based on Lyapunov stability theory, the asymptotic stability discrimination method of pure strategy equilibrium points is obtained. The Jacobian matrix is derived based on the replicator dynamics equations, with the local equilibrium points subsequently inserted to compute both the determinant, denoted as det(J), and the trace, represented by tr(J), of this matrix. When equilibrium points achieve equilibrium state, det (J) >0, tr (J) <0.
Based on the four dynamic equations, the four-dimensional dynamic Jacobian matrix is obtained by partial derivation of a, b, c and d respectively.
The expression of k11 − k44 is shown in Table 3.
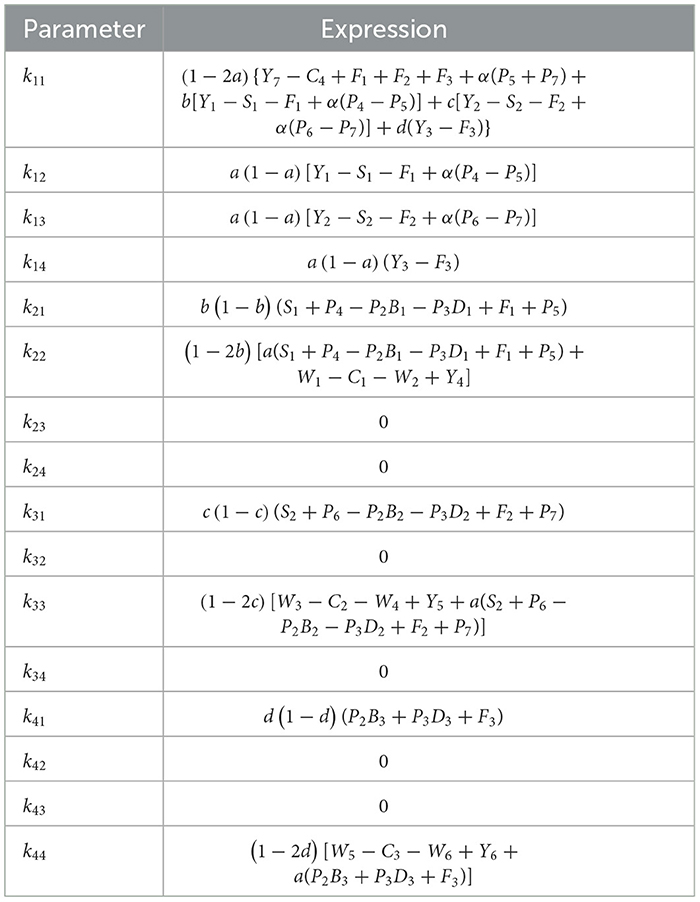
Table 3. Jacobian matrix expression.
The values of the matrix determinant, det(J), and the trace, tr(J), are obtained by entering the 16 local equilibrium points into the Jacobian matrix. Table 4 presents the findings. This indicates that a variety of variables influence the equilibrium state between the government, power companies, conventional power producers, and new energy power generators. As a result, it is impossible to say with certainty whether the aforementioned equilibrium points are in a stable condition. More discussion of the rationale and procedures involved in keeping the several government and business organizations in an equilibrium condition is required.
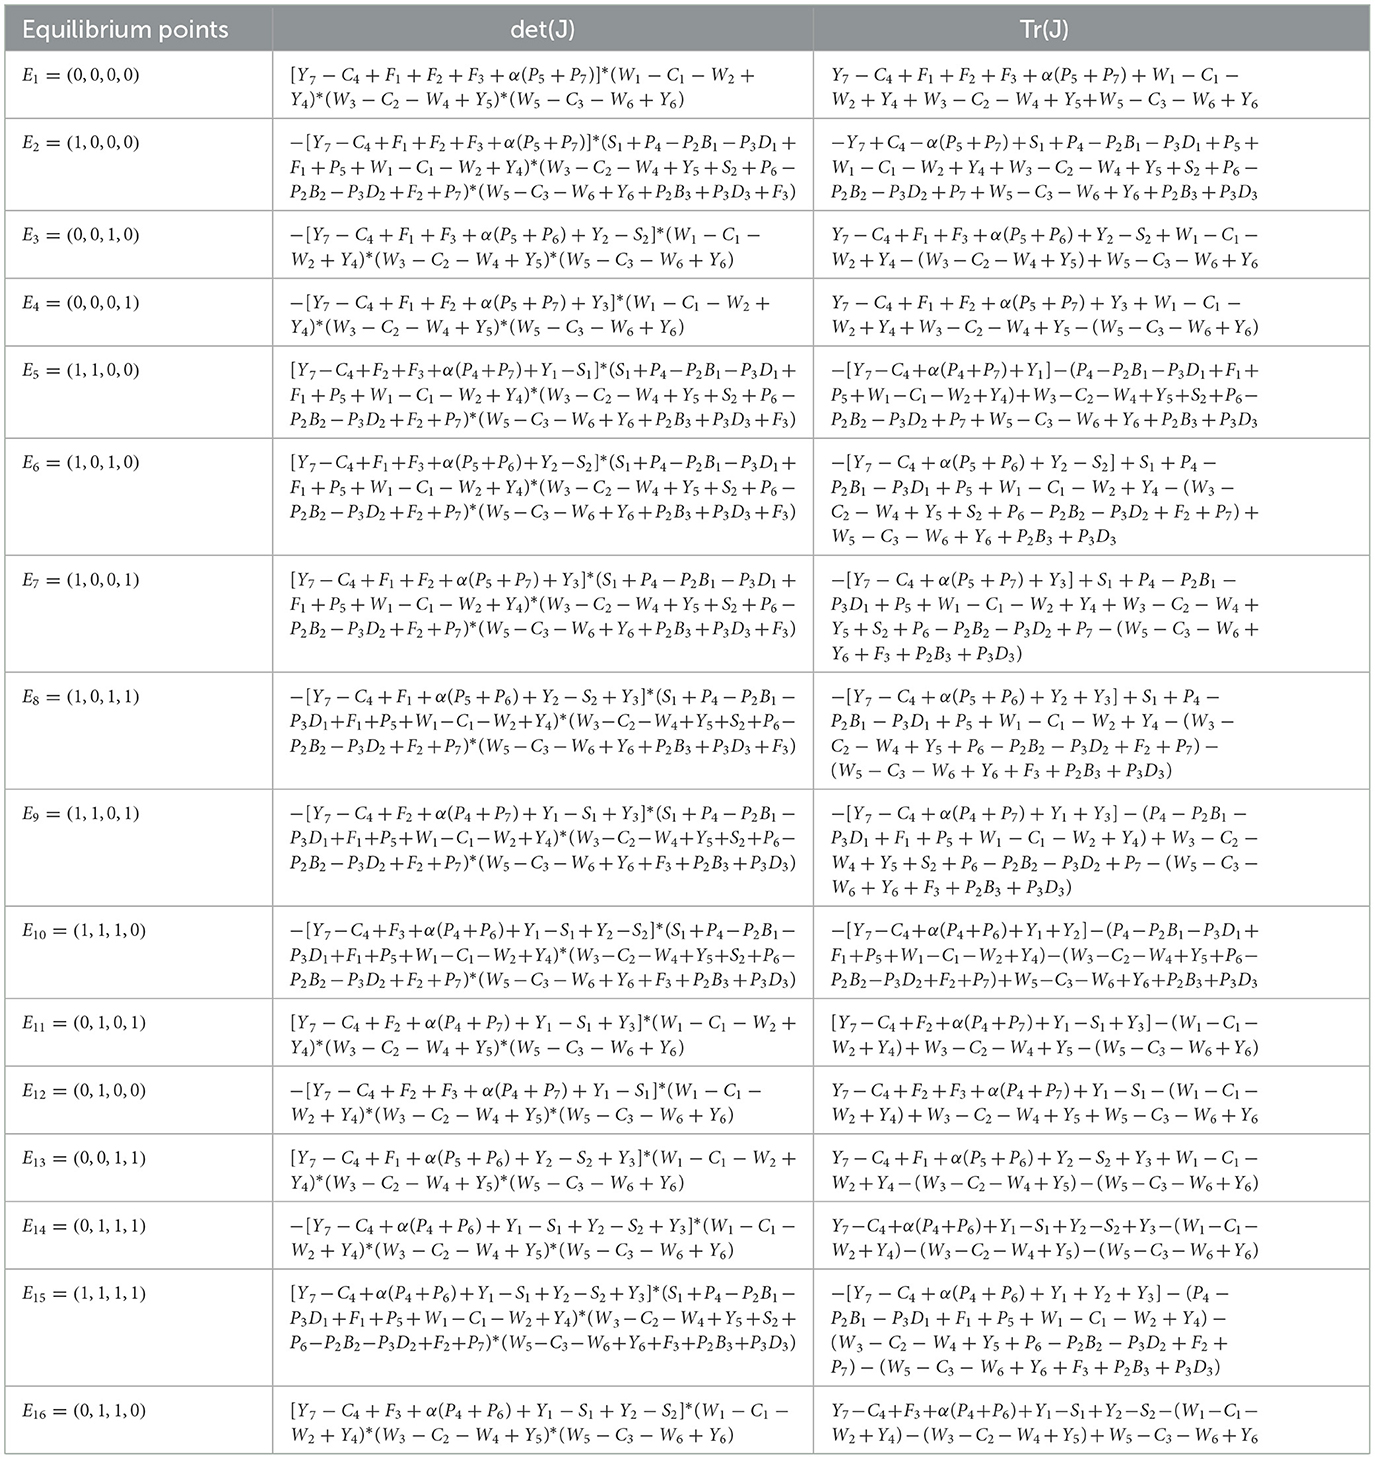
Table 4. Stability analysis of equilibrium points.
4 Evolution simulation analysis of government and enterprise carbon emission reduction based on carbon-green multi-type trading
4.1 System dynamics
By examining the evolutionary game process of government-enterprise subjects, it is evident that the behavior of the subjects eventually tends to equilibrium. However, in specific circumstances, multiple variables interact with one another, making it challenging to maintain stability. This paper employs system dynamics for simulation analysis in order to elucidate the dynamic game process of inter-subject behavior and demonstrate the impact of various variables on the subject's strategy choice. In order to precisely analyze the dynamic changes in the behavioral strategies of subjects, system dynamics is equipped with the ability to process nonlinear dynamic problems.
4.2 Establishment of simulation model
Figure 2 depicts the construction of the SD-based multi-actor behavioral evolution game model of government and enterprise, which is based on the model mentioned above.
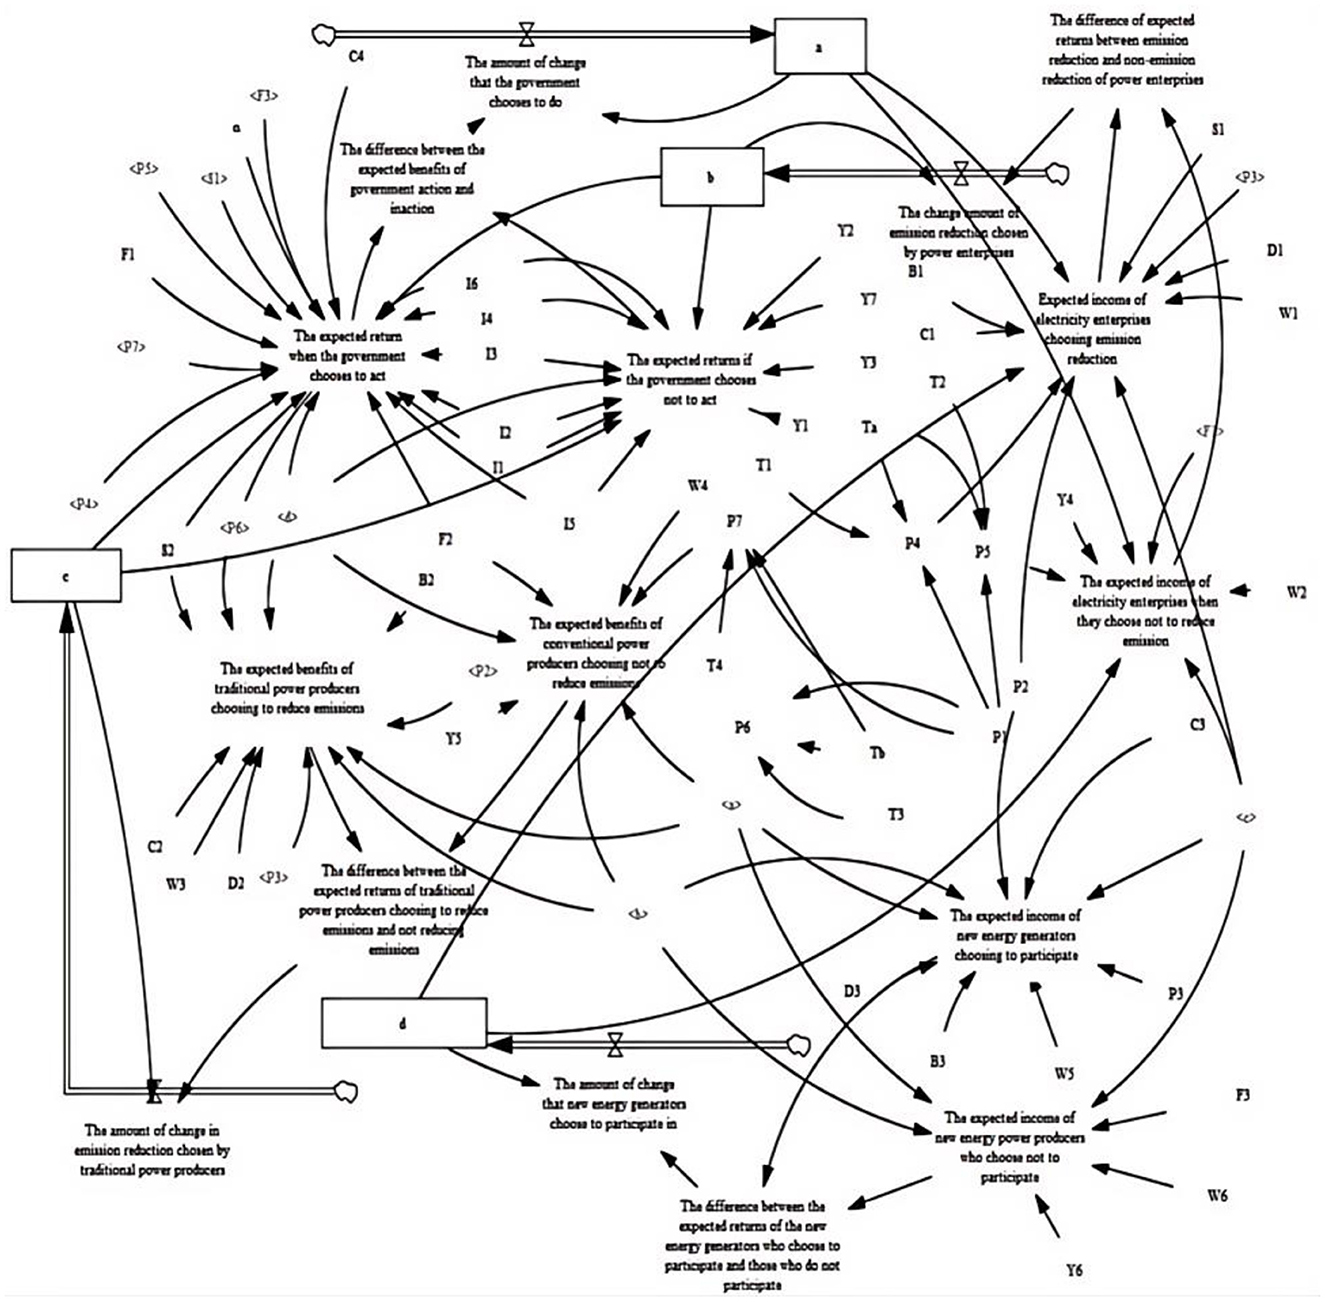
Figure 2. SD based multi-agent behavior evolution game model of government and enterprise.
4.3 Evolutionary game model simulation analysis
In the simulation analysis of the evolutionary game model, we investigate the impact of external constraints on the government's strategy selection. Subsequently, we utilize the market price as a starting point to determine the strategy changes for the primary portion of the game in the context of varying levels of price sensitivity. Finally, we propose specific recommendations.
4.3.1 Parameter setting
Consult relevant information to ensure the authenticity and accuracy of data. When determining the initial conditions of simulation data, the correctness of model structure is more important than the choice of parameter values (Wu et al., 2010). Therefore, real data are utilized as a foundation and adjusted based on the simulation scenario to determine the initial parameter values, as presented in Table 5. To analyze the changes in the subject's behavior and determine the outcomes of strategy selection, we have set the simulation duration to be 20 years with a step size of 1.
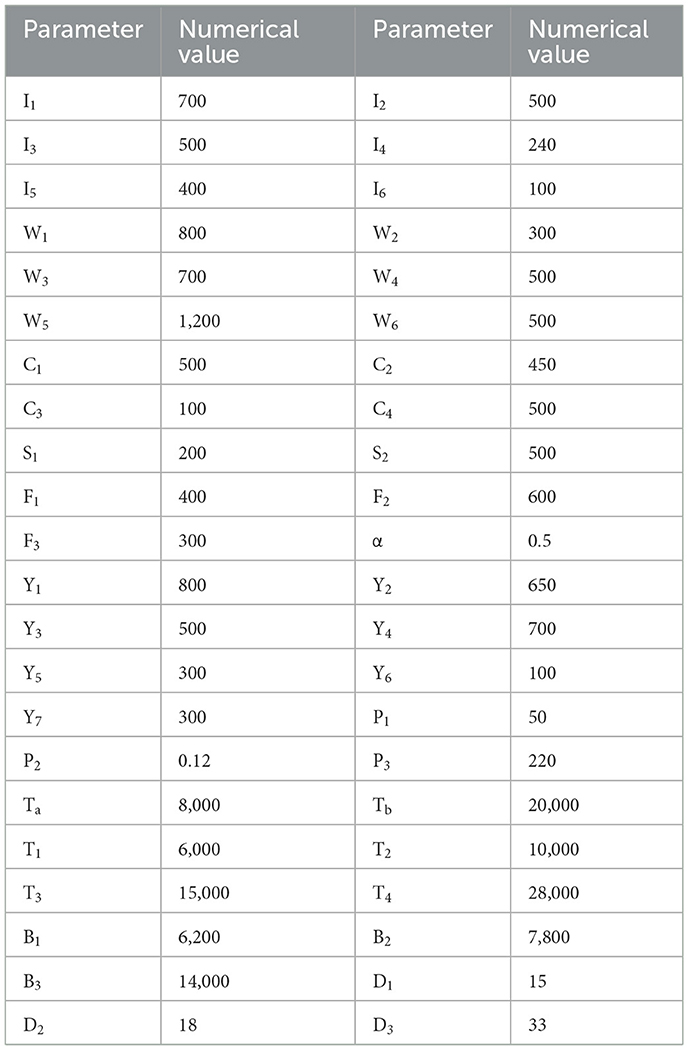
Table 5. Initial assignment of model parameters.
4.3.2 Analysis of external constraints on government strategy selection
The government's choice of tactics is significantly influenced by the limits imposed by the willingness of power users, conventional generators, and innovative energy generators. The values of the remaining parameters remain unaltered, and the adjustment method is illustrated in Table 6.
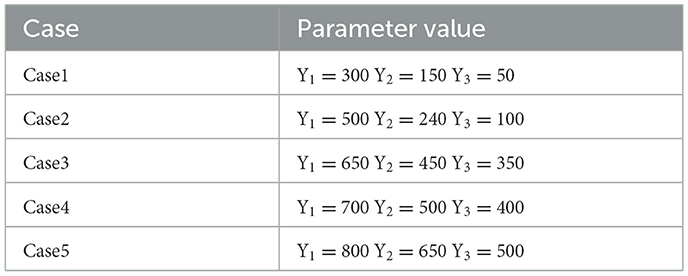
Table 6. External constraint parameters table.
When Y1 = 300, Y2 = 150, Y3 = 50, the government will implement measures to actively address carbon emission reduction within 1.5 years. In Option 1, the curve rises to 0.6 due to the limited extent of external constraints. Subsequently, the government's efforts to reduce carbon emissions gradually decline until the 17.5th year of the “inaction” strategy. As the level of external limitations increases, the government's stance becomes more favorable. When Y1 = 500, Y2 = 240, Y3 = 100, the government's level of intervention rises, but it still falls short of reaching 0.75. Once Y1 is equal to or more than 650, Y2 is equal to or greater than 450, and Y3 is equal to or greater than 350, the government will progressively increase its degree of positive carbon emission reduction until it reaches 1 in the 9th year. At this point, the government will implement the “action” plan. Based on the study of changes in the curve, it is observed that when Y1 is greater than I2, Y2 is greater than I4, and Y3 is greater than I6, the government's ultimate strategy is “action.” The simulation results may be shown in Figure 3.
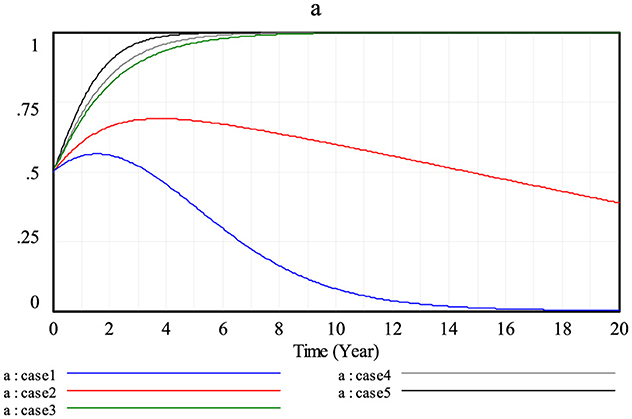
Figure 3. Influence of different external constraints on government strategy selection.
Further analyses show that carbon emission reduction is not naturally optimal, and that governments tend to adopt an aggressive “action” strategy when the potential losses from the constraints they face when not acting outweigh the potential gains from their actions. This reveals the complexity of the emission reduction process, in which each party, from the government to the power users, from traditional power producers to new energy producers, plays an important role in the game, and the actions and decisions of the main parties interact with each other and are related to each other. Therefore, it is important to recognize the holistic and systematic nature of the emission reduction work, and encourage all parties to strengthen their cooperation and achieve a win–win situation through close collaboration.
4.3.3 Analysis of strategy choices of game parties under different scenarios
(1) Game parties are not sensitive to market changes
Market players won't modify cost inputs in response to variations in market prices if electricity consumers, conventional power producers, and new energy power producers are not responsive to price swings. Table 7 displays the particular adjustment technique against this backdrop.

Table 7. Market price parameters.
The evolution of the behavior of the power consumption enterprises under the four adjustment scenarios is consistent, with the degree of motivation to reduce carbon emissions increasing from 0.5, reaching 1 in the 7th year, and fully adopting an “abatement” strategy, as shown in Figure 4. Conventional power producers have the same choice of strategy under different market prices, and fully adopt the “reduce” strategy in the 6th year, as shown in Figure 5. The new energy generators implement the same strategy in different scenarios, as shown in Figure 6.

Figure 4. The influence of market price changes on the strategy selection of power consumption enterprises.
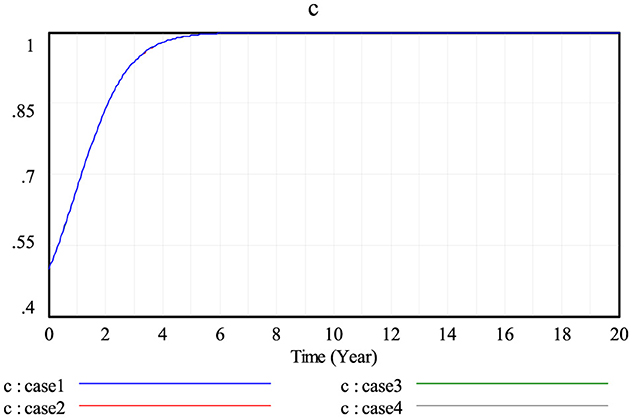
Figure 5. Influence of market price changes on strategy selection of traditional power producers.
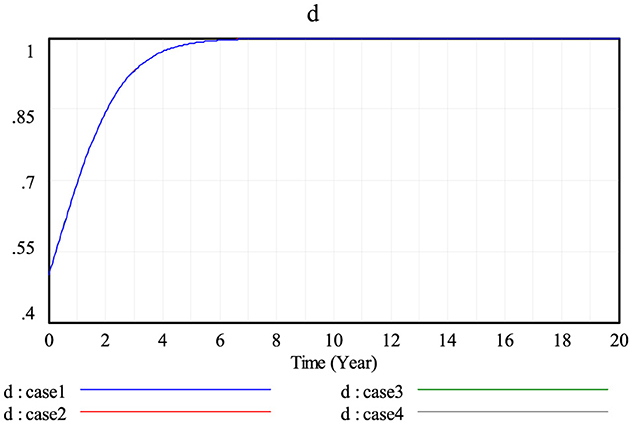
Figure 6. Influence of market price changes on strategy selection of new energy generators.
The strategic decisions made by the parties to the game and the extent to which they are implemented will remain relatively constant, lacking flexibility and adaptability, if market participants are not sensitive to price changes and do not view them as a significant reference for adjusting their emission reduction programs, according to an analysis of the simulation results. The market price controls the balance between supply and demand, directs the best use of resources, and serves as an incentive. In order to maximize their gains and adapt to the rapidly shifting market environment, market players should understand the fundamental function that market prices play, actively respond to changes in market prices, and flexibly modify their own tactics.
(2) Game parties are sensitive to market changes
A market participant may modify its implementation program in response to slight variations in the pricing of the abatement market's component markets, which will affect both the amount exchanged and the cost of abatement (Table 8).
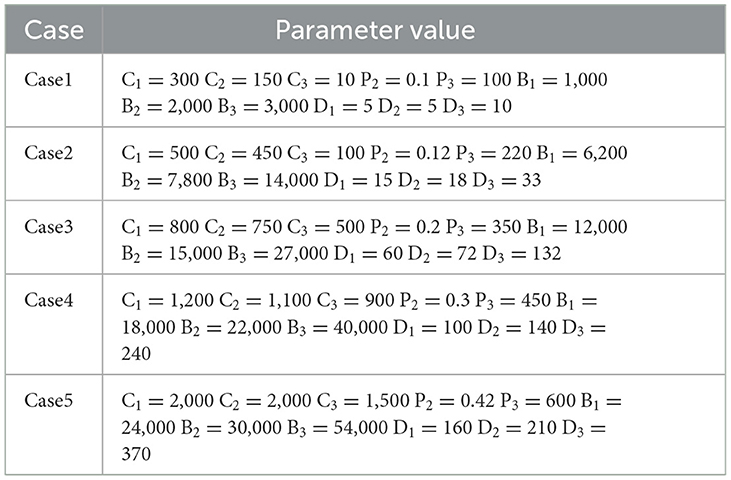
Table 8. Market price, emission reduction cost and transaction volume adjustment table.
Electricity-using enterprises adjust their emission reduction plans due to changes in market prices. In Scenario 1, the incentive of electricity-using enterprises to reduce emissions increases to 1, and they choose the strategy of “reducing emissions” in the 5th year; Scenarios 2, 3, and 4 have the same trend of behavioral evolution as Scenario 1, but with a gradually decreasing incremental increase; and the incentive of electricity-using enterprises to reduce emissions in Scenario 5 starts at 0.5 and gradually decreases, and eventually tends to choose “no emission reduction,” as shown in Figure 7. The behavioral change trend of traditional power producers under different scenarios is the same as that of power users, as shown in Figure 8. The curves of the new energy power producers in Scenarios 1 and 2 almost coincide, and in Scenarios 3 and 4, the curve increases slowly, and in Scenario 5, the curve starts to decrease, and finally adopts the strategy of “non-participation,” as shown in Figure 9.
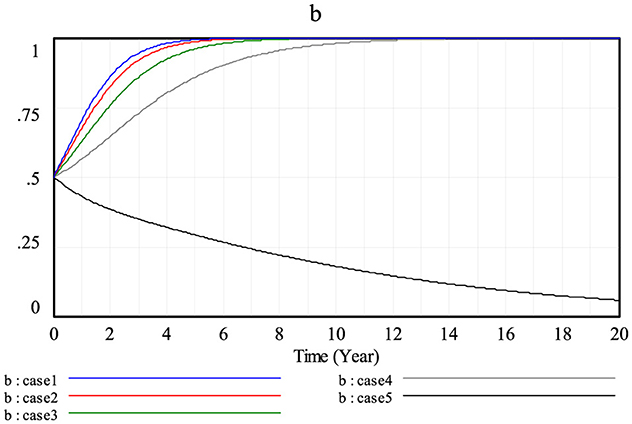
Figure 7. The influence of market price changes on the strategy choice of power enterprises.

Figure 8. The influence of market price changes on the strategy selection of traditional power producers.
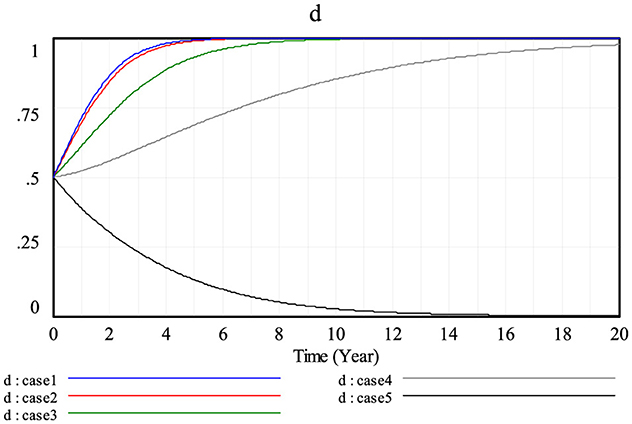
Figure 9. Actively responding to the impact of market price changes on the strategy selection of new energy power generators.
When there are changes in the price signals in the emission reduction market, power users will evaluate their power demand and reevaluate the cost-effectiveness in order to make adjustments to their power consumption strategies. They may choose energy-efficient equipment or modify their production schedules. Traditional power generators will adapt their power generation methods and capacity to maximize economic and environmental advantages. New energy power generators will increase their investment in research and development to enhance the efficiency and stability of new energy generation, in response to the incentives offered by market prices. The current market pricing are not sufficiently elevated to incentivize carbon reductions. Consequently, power businesses, both traditional and new energy providers, opt for a passive approach due to the high costs involved.
Therefore, market players must continue to be extremely sensitive to price variations and vigilant about them in order to fulfill the aim of profit maximization. Simultaneously, a steady variation in market prices is necessary to encourage market players to take an active role in reducing carbon emissions. When prices are high or low, the government can adopt appropriate control measures to maintain market stability. These include putting in place mechanisms for price stabilization and advising businesses on how to set fair pricing, among other things. The government can guarantee that market prices vary within an acceptable range and offer market players a stable, equitable, and transparent environment by means of effective government action and constructive direction.
5 Conclusions and suggestions
This paper constructs an evolutionary game model involving the government, power users, traditional power producers, and new energy producers. It takes into account the green certificate trading, green power trading, and carbon emissions trading markets. System dynamics simulation is used to analyze the strategic decisions made by each subject during the behavioral evolution process. The study's findings demonstrate that the government adopts an active “action” strategy when the costs of inaction exceed the benefits of action; conversely, when market participants lack flexibility and are not responsive to price fluctuations, they are less likely to make flexible decisions about their strategies and to adjust the emission reduction plan. Conversely, in order to better accomplish the objective of optimizing the advantages, it is important to be alert when the majority of market price variations occur because of the cost of minute changes in quick reaction. Based on this, the following recommendations are made to encourage everyone to actively participate in reducing carbon emissions:
(1) Fortifying the bonds among the primary players in the game. The actions and choices made by the government, energy consumers, conventional power producers, and new energy producers affect and limit one another. Reducing carbon emissions is a worldwide, methodical process that calls for cooperation.
(2) Be mindful of the market price's guiding function. Market prices serve as a means of setting distribution, controlling supply and demand, and providing incentives. It is advised that all market players constantly monitor changes in market prices and flexibly modify their company plans and business structures.
(3) Enhancing market mechanisms and systems for the reduction of carbon emissions. The government is responsible for maintaining the stability of market prices and can regulate market behaviors by establishing appropriate policies, regulations, and standards to establish a legal framework for the reduction of carbon emissions. In order to preserve the market's optimal functioning, the government should implement suitable regulatory measures, including the establishment of incentives and the establishment of reasonable pricing, when market prices are either excessive or depressed. Incentives, including financial subsidies and tax breaks, may also be implemented by the government to motivate enterprises to employ low-carbon practices.
In order to encourage the development of emission reduction in a more effective and sustainable direction, this paper analyzes and makes some conclusions on the game behaviors of various subjects of government and enterprises in the process of emission reduction through the use of evolutionary game theory and system dynamics. However, it should be noted that: more research is still needed to determine how to quantify the benefits of the game subjects, the CCER trading process, etc. into the model in order to make the model more accurate; the simulation data in this paper are based on real data with a certain degree of adaptation and adjustment, so the research results more reflect the general trend and possible scenarios of the government-enterprise game, rather than a completely accurate prediction. This paper is intended for reference purposes only, as the data is derived from real data and adapted to the simulation circumstance. Consequently, it contains certain limitations.
Data availability statement
The original contributions presented in the study are included in the article/supplementary material, further inquiries can be directed to the corresponding author.
Author contributions
WG: Investigation, Writing – original draft. TM: Project administration, Writing – original draft. ZP: Project administration, Writing – original draft. YC: Data curation, Writing – original draft. HL: Supervision, Writing – original draft. DX: Methodology, Writing – original draft. FM: Formal analysis, Writing – original draft. XW: Resources, Writing – review & editing. JH: Validation, Writing – review & editing. JY: Resources, Writing – review & editing. XY: Project administration, Writing – review & editing. JL: Writing – original draft, Methodology. ZG: Writing – review & editing, Visualization.
Funding
The author(s) declare that financial support was received for the research, authorship of this article. This research was funded by Science and Technology Project of State Grid Jilin Electric Power Company Limited [2022JBGS-08]. The funders have a role in study design, data collection and analysis, and the preparation of the manuscript.
Conflict of interest
WG, YC, HL, DX, and FM were employed by State Grid Baicheng Power Supply Company. TM was employed by State Grid Jilin Electric Power Company Limited. ZP was employed by Jilin Electric Power Trading Center Co., Ltd.
The remaining authors declare that the research was conducted in the absence of any commercial or financial relationships that could be construed as a potential conflict of interest.
Publisher's note
All claims expressed in this article are solely those of the authors and do not necessarily represent those of their affiliated organizations, or those of the publisher, the editors and the reviewers. Any product that may be evaluated in this article, or claim that may be made by its manufacturer, is not guaranteed or endorsed by the publisher.
References
Chang, X., Wu, Z., Wang, J., Zhang, X., Zhou, M., Yu, T., et al. (2023). The coupling effect of carbon emission trading and tradable green certificates under electricity marketization in China. Renew. Sustain. Energy Rev. 187:113750. doi: 10.1016/j.rser.2023.113750
Chen, W., and Hu, Z.-H. (2018). Using evolutionary game theory to study governments and manufacturers' behavioral strategies under various carbon taxes and subsidies. J. Clean. Prod. 201, 123–141. doi: 10.1016/j.jclepro.2018.08.007
Feng, T.-t., Li, R., Zhang, H.-m., Gong, X.-l., and Yang, Y.-s. (2021). Induction mechanism and optimization of tradable green certificates and carbon emission trading acting on electricity market in China. Resour. Conserv. Recycl. 169:105487. doi: 10.1016/j.resconrec.2021.105487
Feng, Y., Liu, Q., Feng, D., and Zhou, Y. (2024). Wind power investment equilibrium guided by reliability option considering electricity-carbon emission trading-trading green certificate joint market. Sustain. Energy Grids Netw. 37:101275. doi: 10.1016/j.segan.2024.101275
Hu, Y., Chi, Y., Zhou, W., Li, J., Wang, Z., Yuan, Y., et al. (2023). The interactions between renewable portfolio standards and carbon emission trading in China: an evolutionary game theory perspective. Energy 271:127047. doi: 10.1016/j.energy.2023.127047
Javed, A. H., van der Holst, B., Nguyen, P. H., Morren, J., and Slootweg, J. G. (2024). Analyzing impact of network constraints on feasible operation region of the radial distribution networks. Electr. Power Syst. Res. 234:110799. doi: 10.1016/j.epsr.2024.110799
Liu, J., Yu, J., Yin, Y., and Wei, Q. (2021). An evolutionary game approach for private sectors' behavioral strategies in China's green energy public–private partnership projects. Energy Rep. 7, 696–715. doi: 10.1016/j.egyr.2021.09.201
Parker, S., and Bhatti, M. I. (2020). Dynamics and drivers of per capita CO emissions in Asia. Energy Econ. 89:104798. doi: 10.1016/j.eneco.2020.104798
Rehman, F. U., Al-Ghazali, B. M., and Farook, M. R. M. (2022).Interplay in circular economy innovation, business model innovation, SDGs, and government incentives: a comparative analysis of Pakistani, Malaysian, and Chinese SMEs. Sustainability 14:15586. doi: 10.3390/su142315586
Sun, H., Wan, Y., Zhang, L., and Zhou, Z. (2019). Evolutionary game of the green investment in a two-echelon supply chain under a government subsidy mechanism. J. Clean. Prod. 235, 1315–1326. doi: 10.1016/j.jclepro.2019.06.329
Tuofu, H., Changhao, H., Qingyun, H., Dongxiao, Y., Tian, H., Yi, F., et al. (2022). A coordination analysis of stakeholder interests on the new subsidy policy of hydrogen fuel cell vehicles in China: from the perspective of the evolutionary game theory. Int J. Hydrogen Energy 47, 24493–24510. doi: 10.1016/j.ijhydene.2022.02.218
Wang, G., Chao, Y., Jiang, T., and Chen, Z. (2022). Facilitating developments of solar thermal power and nuclear power generations for carbon neutral: a study based on evolutionary game theoretic method. Sci. Total Environ. 814:151927. doi: 10.1016/j.scitotenv.2021.151927
Wang, X., Long, R., Chen, H., Wang, Y., Shi, Y., Yang, S., et al. (2024). How to promote the trading in China's green electricity market? Based on environmental perceptions, renewable portfolio standard and subsidies. Renew. Energy 222:119784. doi: 10.1016/j.renene.2023.119784
Wu, D. D., Kefan, X., and Hua, L. (2010). Modeling technological innovation risks of an entrepreneurial team using system dynamics: an agent-based perspective. Technol. Forecast. Soc. Change 77, 857–869. doi: 10.1016/j.techfore.2010.01.015
Wu, Y., Wang, X., Liu, Z., and Zhao, X. (2023). Research on low-carbon technology diffusion among enterprises in networked evolutionary game. Chaos Solitons Fractals 174:113852. doi: 10.1016/j.chaos.2023.113852
Yingying, S., Zixiang, W., Muhammad, S., and Yongchao, Z. (2021). Exploring the dynamics of low-carbon technology diffusion among enterprises: an evolutionary game model on a two-level heterogeneous social network. Energy Econ. 101:105399. doi: 10.1016/j.eneco.2021.105399
Yu, Y., Yi, S., and Zhang, A. (2022). Clean energy-based rural low carbon transformation considering the supply and demand of new energy under government participation: a three-participators game model. Energy Rep. 8, 12011–12025. doi: 10.1016/j.egyr.2022.09.037
Zeng, Y., Shi, Y., Shahbaz, M., and Liu, Q. (2024). Scenario-based policy representative exploration: a novel approach to analyzing policy portfolios and its application to low-carbon energy diffusion. Energy 296:131202. doi: 10.1016/j.energy.2024.131202
Zhang, C., and Zhang, X. (2022). Evolutionary game analysis of air pollution co-investment in emission reductions by steel enterprises under carbon quota trading mechanism. J. Environ. Manag. 317:115376. doi: 10.1016/j.jenvman.2022.115376
Zhang, X., Zhu, Q., Li, X., and Pan, Y. (2023). The impact of government subsidy on photovoltaic enterprises independent innovation based on the evolutionary game theory. Energy 285:129385. doi: 10.1016/j.energy.2023.129385
Keywords: carbon reduction, evolutionary game, system dynamics, multi-market collaborative trading, combination of government and enterprise
Citation: Guo W, Meng T, Piao Z, Chen Y, Liu H, Xu D, Meng F, Wang X, Han J, Yan J, Yang X, Li J and Ge Z (2024) Research on the evolutionary game of government and enterprises in carbon emission reduction under multi-market coordinated trading. Front. Sustain. Energy Policy 3:1456264. doi: 10.3389/fsuep.2024.1456264
Received: 28 June 2024; Accepted: 20 September 2024;
Published: 15 October 2024.
Edited by:
Walid Bakry, Western Sydney University, AustraliaReviewed by:
Husam Al Malkawi, British University in Dubai, United Arab EmiratesMuhammad Ishaq Bhatti, La Trobe University, Australia
Copyright © 2024 Guo, Meng, Piao, Chen, Liu, Xu, Meng, Wang, Han, Yan, Yang, Li and Ge. This is an open-access article distributed under the terms of the Creative Commons Attribution License (CC BY). The use, distribution or reproduction in other forums is permitted, provided the original author(s) and the copyright owner(s) are credited and that the original publication in this journal is cited, in accordance with accepted academic practice. No use, distribution or reproduction is permitted which does not comply with these terms.
*Correspondence: Jiaqi Li, MTgyMzA3NzM1N0BxcS5jb20=